Editor Note: In light of travel commitments, there will be no Daily Brief published tomorrow, March 4, 2022. Thank you for the support and see you next week!
What Happened
Overnight, equity index futures were sideways to lower while commodity and bond products remained bid. Cross-asset volatility measures remain heightened in the face of uncertainties with respect to geopolitical tensions and monetary policy action.
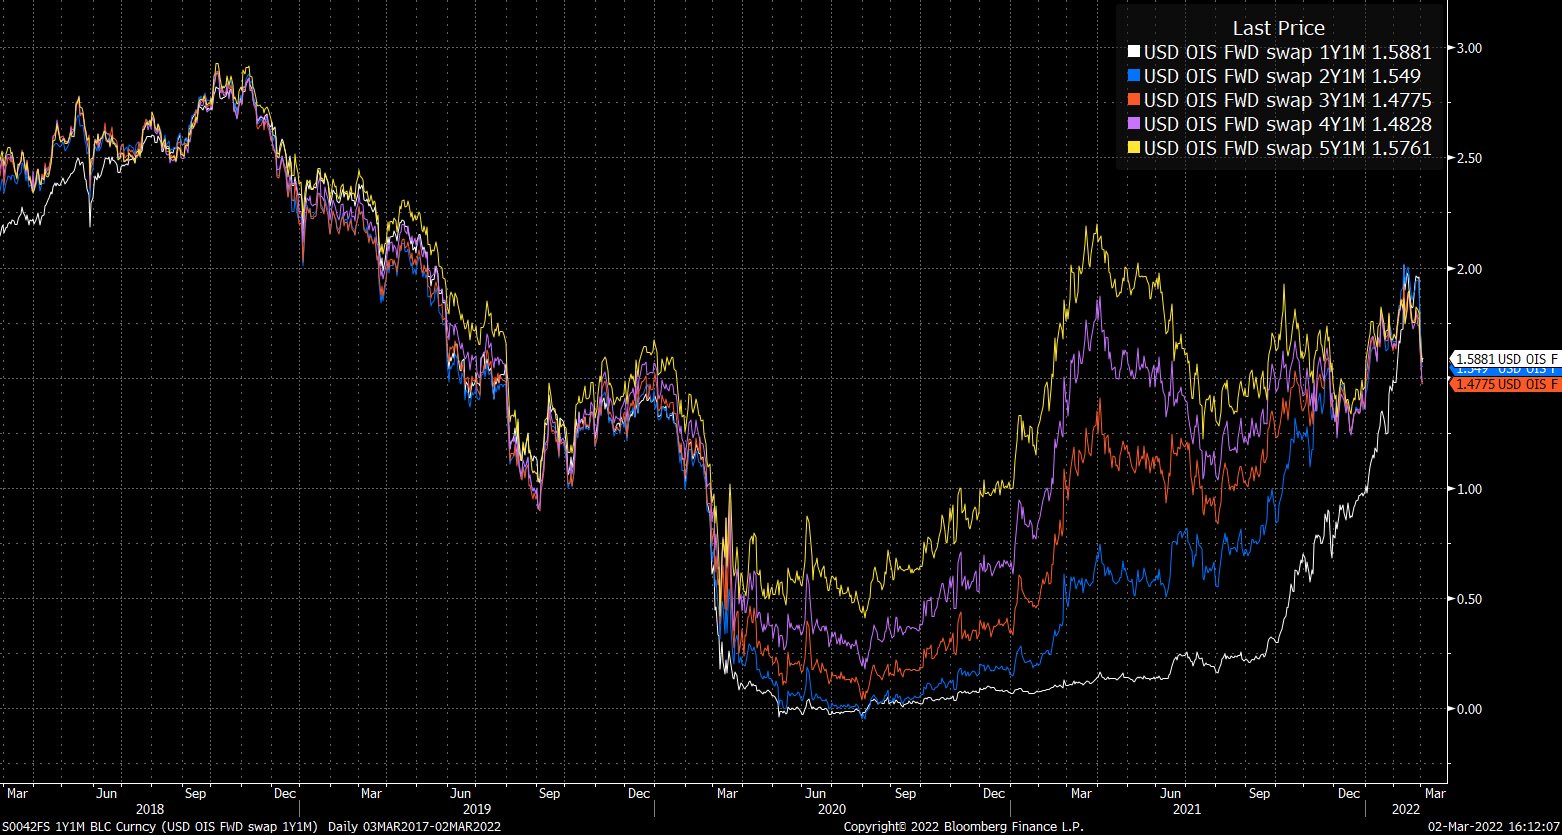
To note, in light of the economic war waged on Russia, participants received positive news from Federal Reserve Chair Jerome Powell who ruled out a 50 basis-point hike.
Moreover, ahead is data on jobless claims, productivity, labor costs (8:30 AM ET), ISM services, factory orders, core capital equipment orders, and Fed-speak by Jerome Powell (10:00 AM ET), as well as John Williams (6:00 PM ET).
What To Expect
Positioning: Skipping the fundamentals section and will follow up on (and add to) some notes established in Wednesday’s commentary.
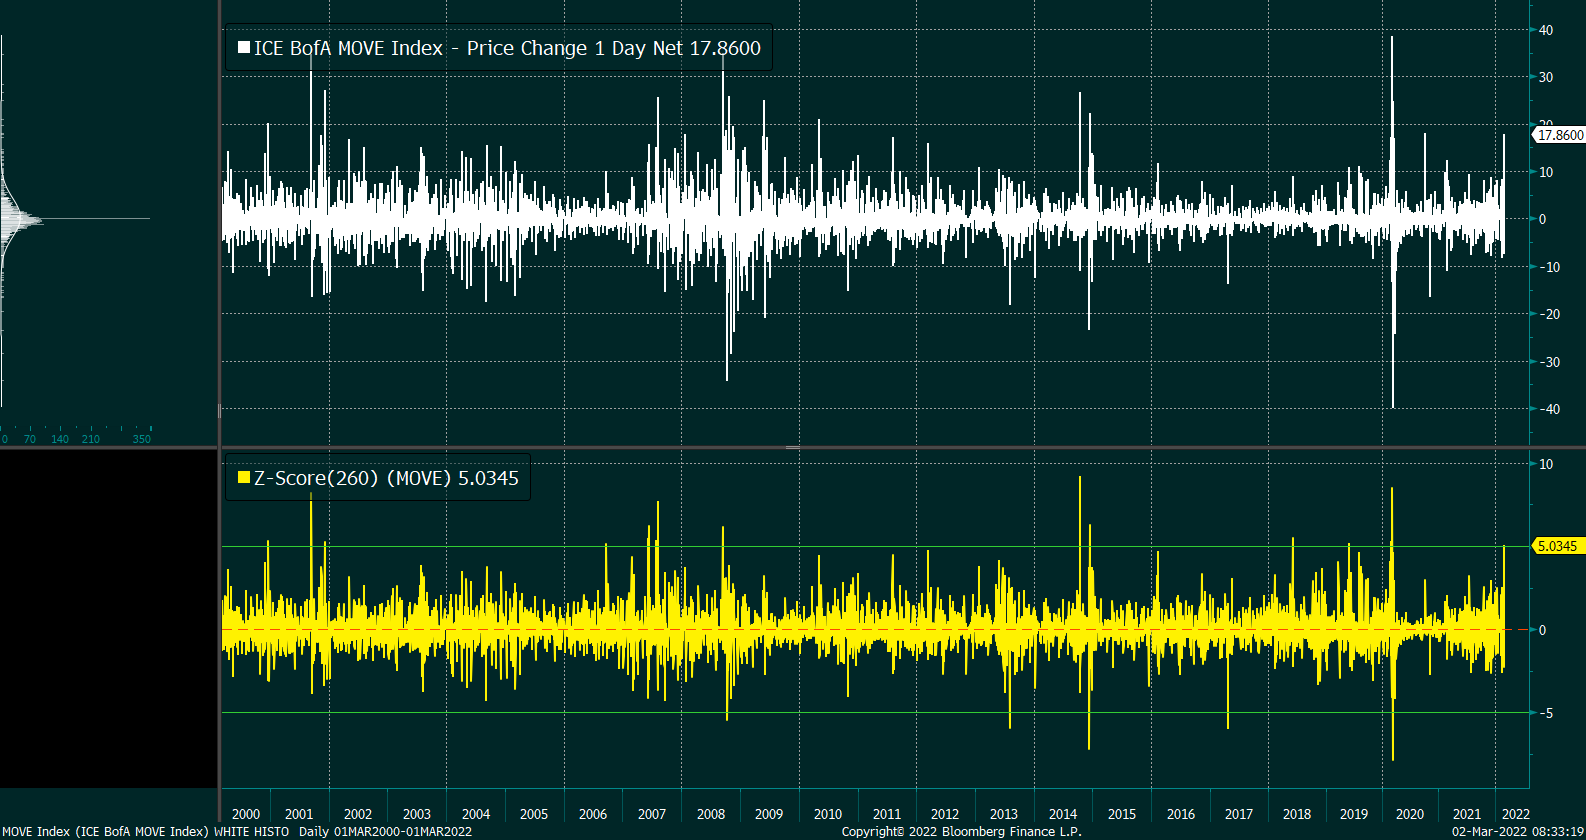
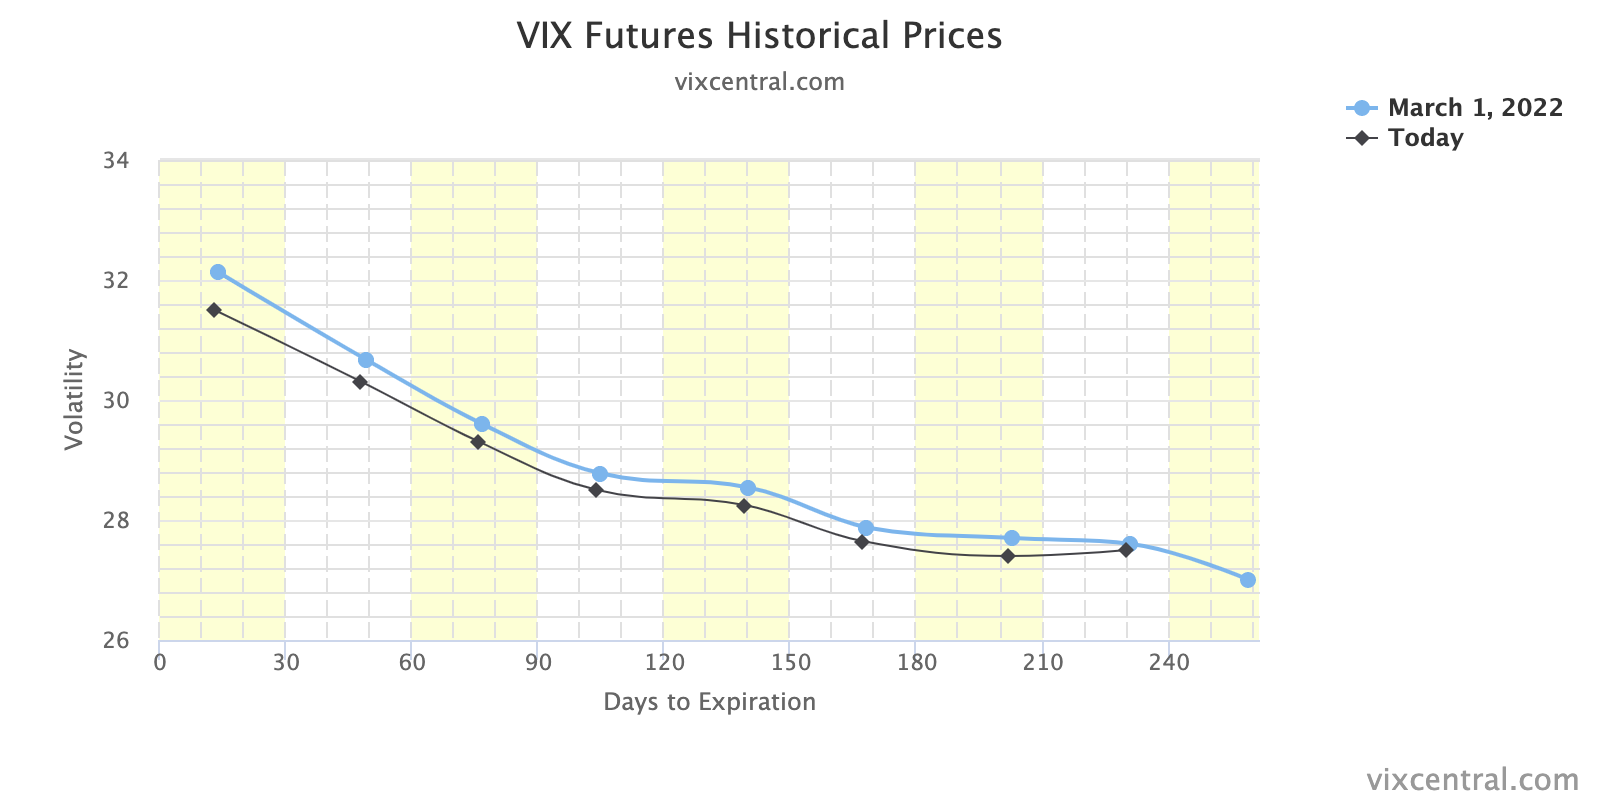
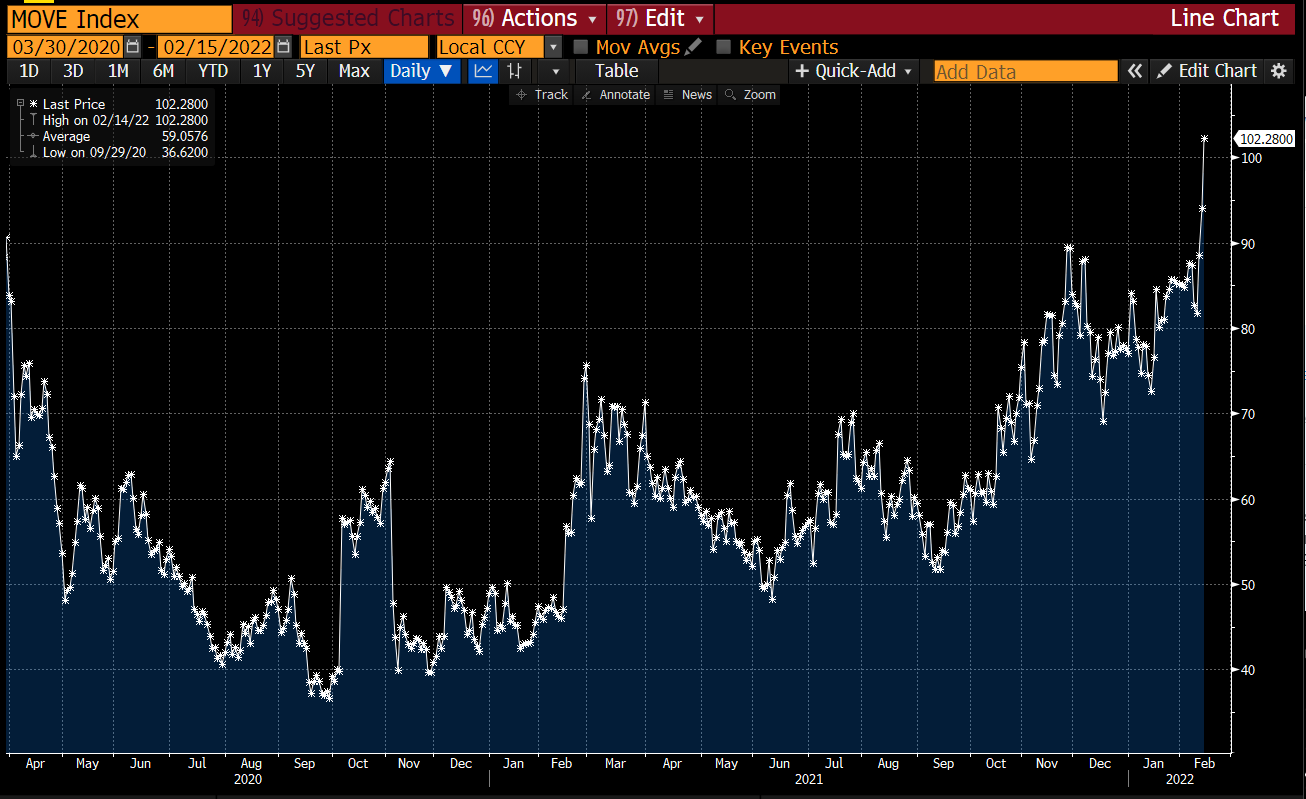
Mainly, cross-asset volatility is spiking as investors are seeking protection against the uncertainties posed by geopolitical tensions and monetary policy action.
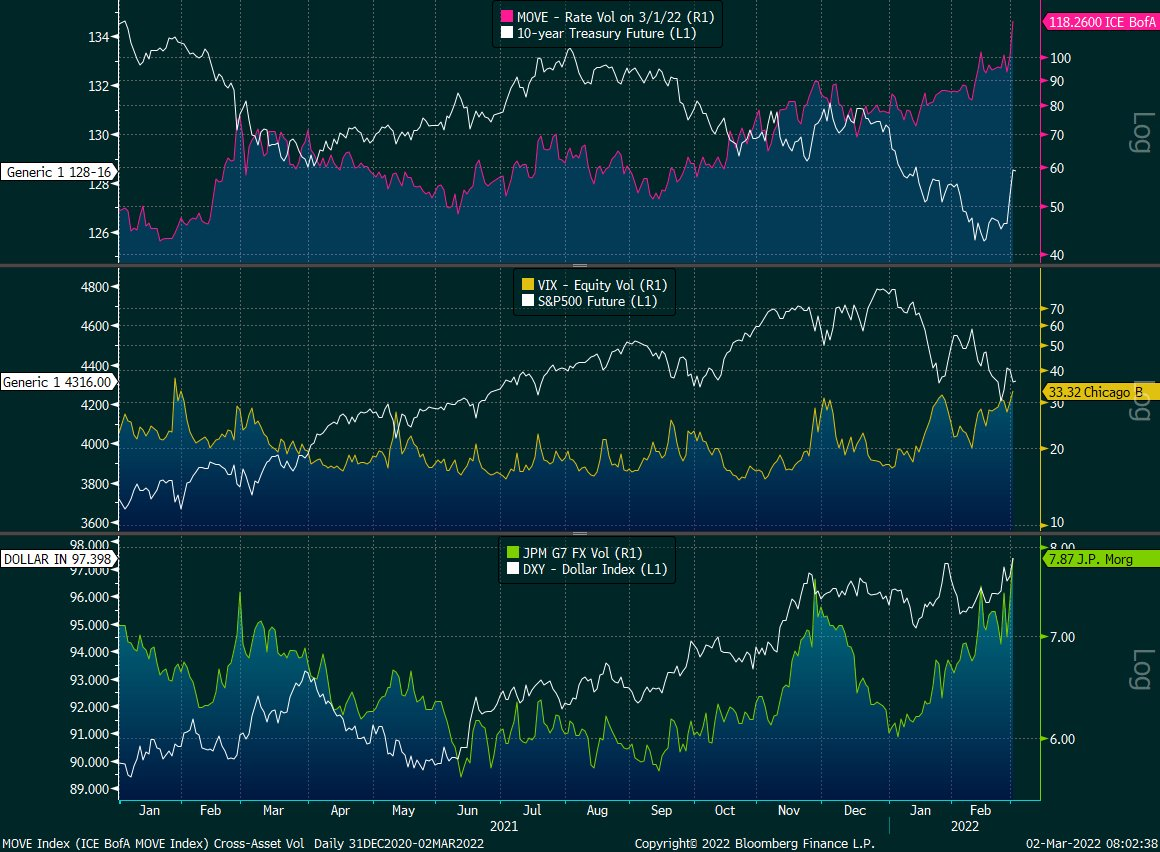
As explained, however, the equity market’s pricing of risk (which we can take as being reflected by the CBOE Volatility Index [INDEX: VIX]) is not moving lock-step with that of measures in FX and rate markets.
“The fear in one market tends to feed into the fear of another; regardless of the cause, it seems that equity and bond market participants are not (quite) on the same page,” is the direct quote.
In the subsequent text, I did little to mention the implications of liquidity supply at the index level. This realization came to me while writing some commentary for SpotGamma (who just launched its Hedging-Impact of Real-Time Options indicator or HIRO).
Moreover, the evolving monetary frameworks and intention to take from the max liquidity – which pushed participants out of the risk curve and promoted a divergence from fundamentals – has the effect of removing market excesses that have found their way into volatility markets.
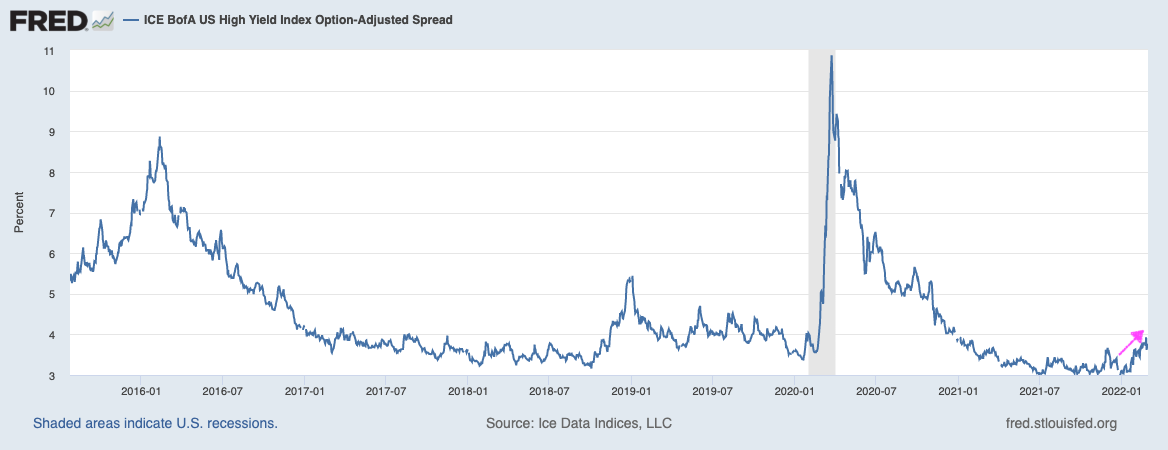
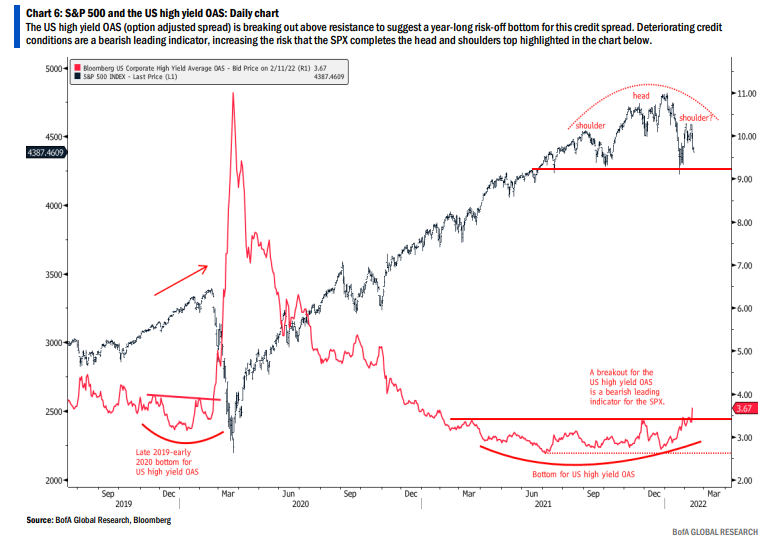
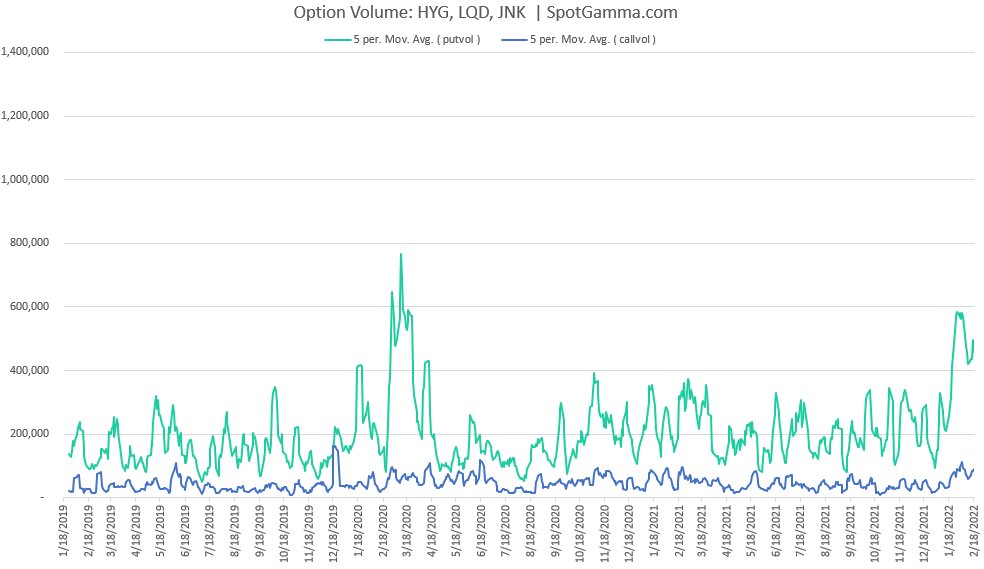
Taking a look at the U.S. high yield OAS (option-adjusted spread), participants see a “risk-off” bottom; deteriorating credit conditions are a bearish leading indicator and that’s likely been reflected by the bond market’s pricing of risk (but not equity markets, as noted above).

Tempering equity market volatility is likely supply, particularly at the index level, whereas elsewhere, at the single-stock level, underlying components are volatile.
As explained in the SpotGamma note: “We’re using the VIX as a proxy for equity market volatility while underlying components are actually very volatile.”
“There is a decline in correlation, and this is due to suppressive counterparty hedging of the most dominant customer positioning.”
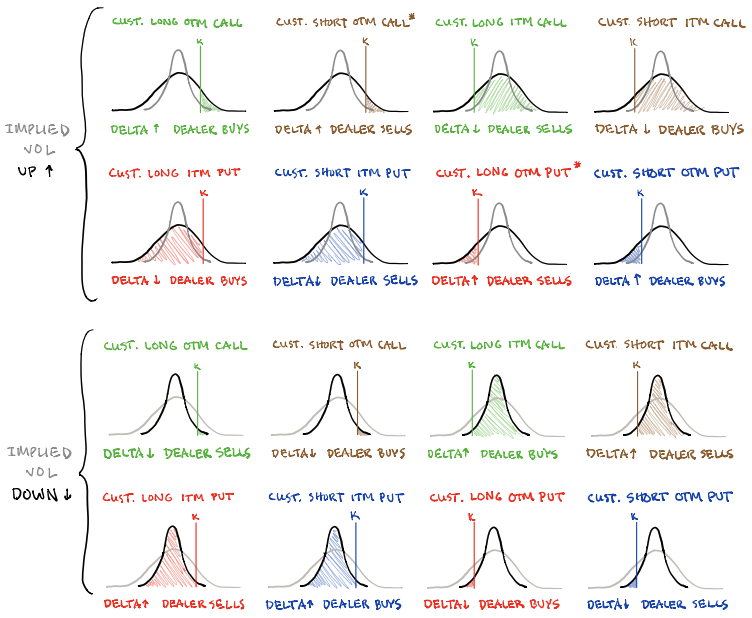
The dominant positioning at the index level is best explained as follows:
- Customers have positive directional (delta) exposure to the equity markets.
- The indexes (in which there are tax advantages, cash-settlement, among other things) provide participants exposure to a diversified and liquid hedge, easy to get in and out of.
- To hedge positive delta exposure against drops, customers will purchase downside put protection. Puts carry a negative delta and their gains are multiplied to the downside (positive gamma).
- To reduce the cost of this hedge, they sell upside call protection (also a negative delta trade). This “offset” so to speak can be initiated as a ratio to the protection carried on the downside (e.g., 2 calls for 1 put, and so on), and this feeds into skewness, also.
Options counterparties, who are on the other side of this customer activity, have positive exposure to direction.
In selling a put, the dealer has positive exposure to the direction (meaning the position makes money, all else equal, with trade higher), but their losses are multiplied with movement to the downside (negative gamma).
To hedge this put exposure, all else equal, they must sell into weakness and buy strength.
On the call side, however, the counterparty has positive exposure to delta and gamma (meaning gains are multiplied to the upside).
To hedge this call exposure, all else equal, they must buy into weakness and sell strength.
When, in the normal course of action, protection decays (given that time and volatility trend to zero), counterparty positive delta exposure decreases.
This solicits the buy-back of short futures hedges (static negative delta against dynamic positive delta options exposure) that can support the market.
As we’ve seen, a feature of falling markets is the demand for protection. When this protection is monetized (or decay ensues), options counterparties add to the market liquidity (i.e., buying back short futures hedges).
A feature of rising markets is the supply of protection (and more active hedging of call options).
Further, as markets rise, volatility falls. Participants’ demand for yield drives participants further out the risk curve (i.e., they sell more volatility) and this can solicit even more supply.
As explained in the SpotGamma note: “The counterparty is left carrying more positive exposure to delta and gamma (meaning gains are multiplied to the upside). As time and volatility trend to zero, the sensitivity of these options to underlying price (gamma) increases.”
“When gamma increases, counterparties add more liquidity (i.e., sell [buy] more into strength [weakness] against increasing [decreasing] positive delta exposure).”
Amidst this most recent leg higher, volatility has fallen (some) and the heavily-demanded put protection amidst earlier trade lower has solicited decreased hedging. The buyback of hedges has bolstered sideways to higher trade.
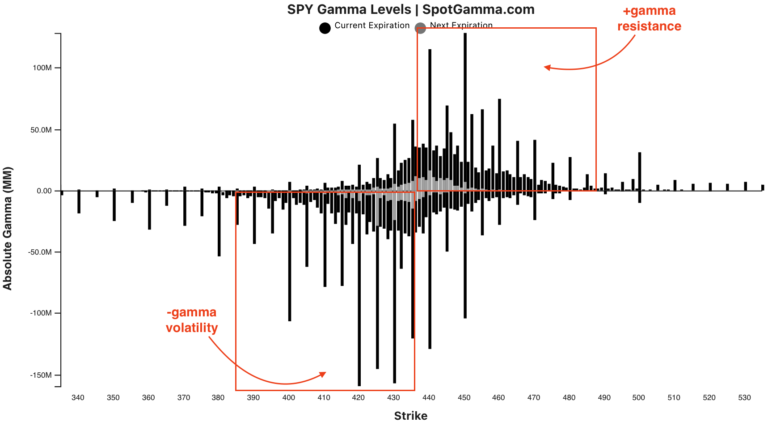
Pursuant to that remark, however, participants are still adding to their negative delta options exposure. They’re doing this via call sales (downward sloping HIRO line, below).
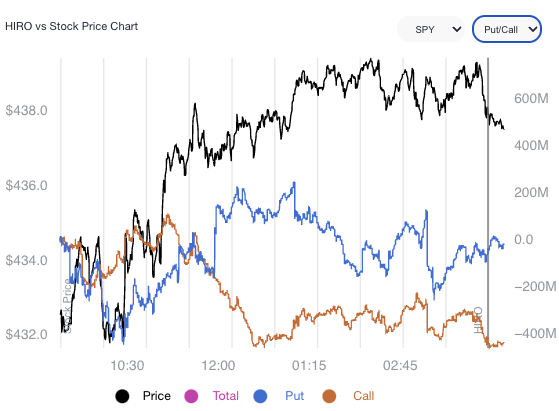
Moreover, given the build in open interest in options at higher strike prices – through naive assumptions and data collected from HIRO, among other measures – we surmise options counterparties are tending to add to the market liquidity and this is stabilizing.
“As the highly-demanded put protection decays, dealers have less exposure to positive delta. To re-hedge this, dealers buy back (cover) existing short (negative-delta) futures hedges,” SpotGamma further explains. “At the same time, as markets trend higher, … the additional interest in options participants supplied on the call side solicits increased hedging.”
From above, we surmise counterparties are long and therefore tend to sell (buy) into strength amid increasing (decreasing) positive delta exposure.
As short-dated activity clusters in the area just north of the most recent week-long consolidation area, and this protection decays, dealer exposure to positive delta (gamma) falls (rises).
“Taken together, dealers add to the market liquidity. When there is rising liquidity, volatility (a measure of how ample liquidity is) falls.”
It is options market activity and associated hedging – the supply of liquidity – that’s tempering equity market volatility relative to that of rates and FX.
Hope that better explains index-level volatility and the decline in correlation by constituents.
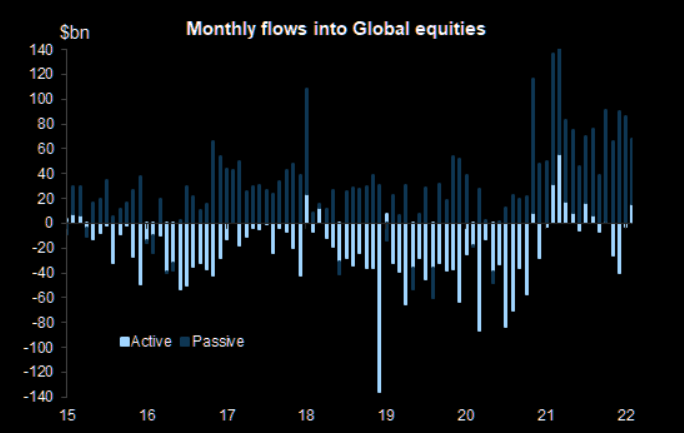
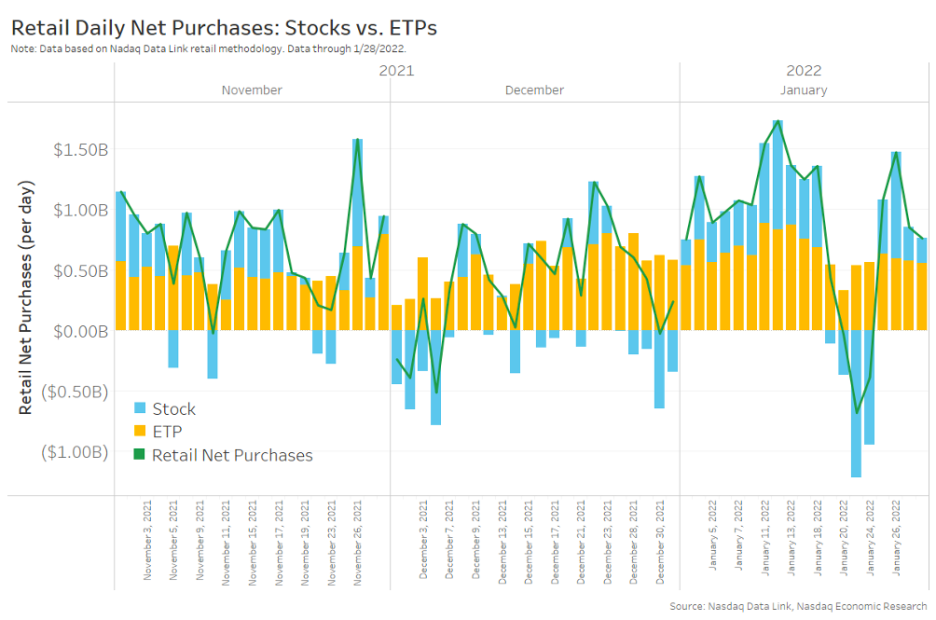
As an aside, these forces are, too, amplified by the general trend toward “passive” investing. This is a topic for another time, though.
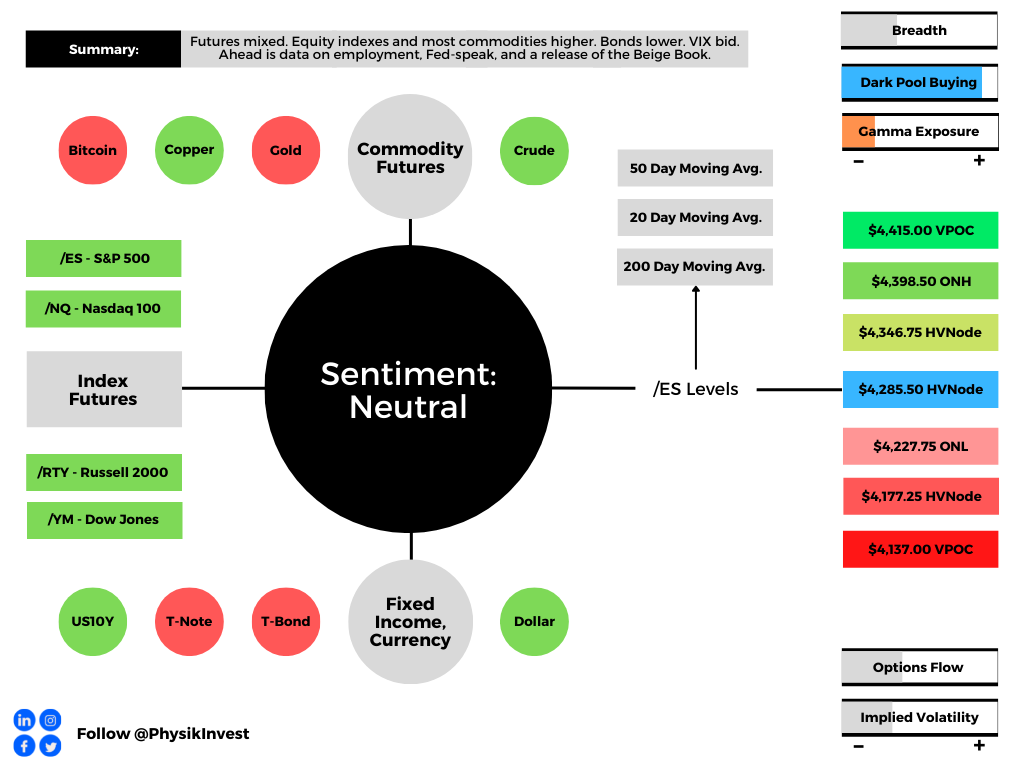
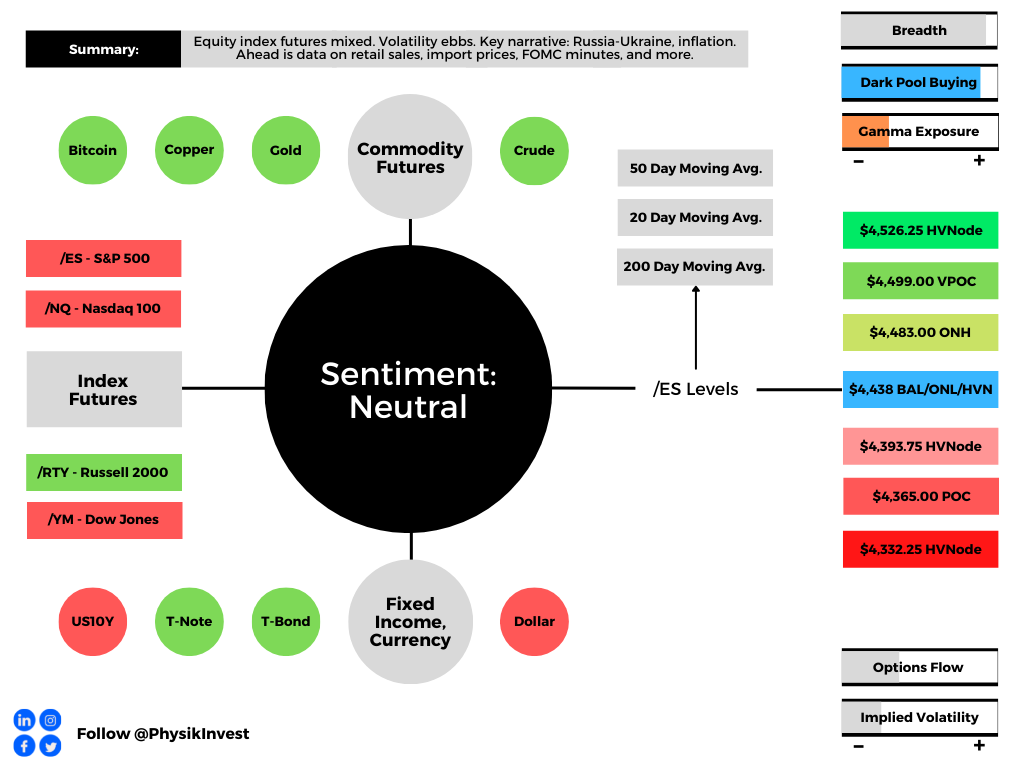
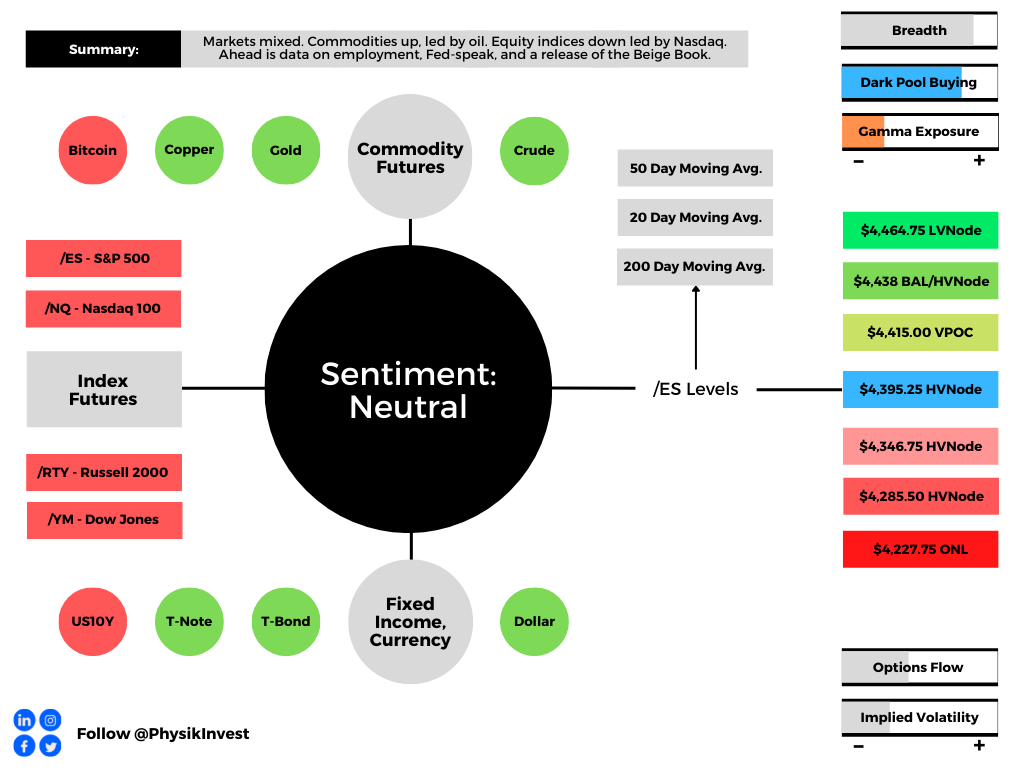
Technical: As of 6:30 AM ET, Thursday’s regular session (9:30 AM – 4:00 PM ET), in the S&P 500, will likely open in the middle part of a balanced overnight inventory, inside of prior-range and -value, suggesting a limited potential for immediate directional opportunity.
Balance (Two-Timeframe Or Bracket): Rotational trade that denotes current prices offer favorable entry and exit. Balance-areas make it easy to spot a change in the market (i.e., the transition from two-time frame trade, or balance, to one-time frame trade, or trend).

Modus operandi is responsive trade (i.e., fade the edges), rather than initiative trade (i.e., play the break).
In the best case, the S&P 500 trades higher; activity above the $4,395.25 high volume area (HVNode) puts in play the $4,415.00 untested point of control (VPOC). Initiative trade beyond the VPOC could reach as high as the $4,438.00 key response area and $4,464.75 low volume area (LVNode), or higher.
In the worst case, the S&P 500 trades lower; activity below the $4,395.25 HVNode puts in play the $4,346.75 HVNode. Initiative trade beyond the $4,346.75 could reach as low as the $4,285.50 HVNode and $4,227.75 overnight low (ONL), or lower.
Click here to load today’s key levels into the web-based TradingView charting platform. Note that all levels are derived using the 65-minute timeframe. New links are produced, daily.

Definitions
Volume Areas: A structurally sound market will build on areas of high volume (HVNodes). Should the market trend for long periods of time, it will lack sound structure, identified as low volume areas (LVNodes). LVNodes denote directional conviction and ought to offer support on any test.
If participants were to auction and find acceptance into areas of prior low volume (LVNodes), then future discovery ought to be volatile and quick as participants look to HVNodes for favorable entry or exit.
POCs: POCs are valuable as they denote areas where two-sided trade was most prevalent in a prior day session. Participants will respond to future tests of value as they offer favorable entry and exit.
Overnight Rally Highs (Lows): Typically, there is a low historical probability associated with overnight rally-highs (lows) ending the upside (downside) discovery process.
About
After years of self-education, strategy development, mentorship, and trial-and-error, Renato Leonard Capelj began trading full-time and founded Physik Invest to detail his methods, research, and performance in the markets.
Capelj is also a Benzinga finance and technology reporter interviewing the likes of Shark Tank’s Kevin O’Leary, JC2 Ventures’ John Chambers, FTX’s Sam Bankman-Fried, and ARK Invest’s Catherine Wood, as well as a SpotGamma contributor developing insights around impactful options market dynamics.
Disclaimer
Physik Invest does not carry the right to provide advice.
In no way should the materials herein be construed as advice. Derivatives carry a substantial risk of loss. All content is for informational purposes only.