Editor’s Note: The Daily Brief is a free glimpse into the prevailing fundamental and technical drivers of U.S. equity market products. Join the 200+ that read this report daily, below!
What Happened
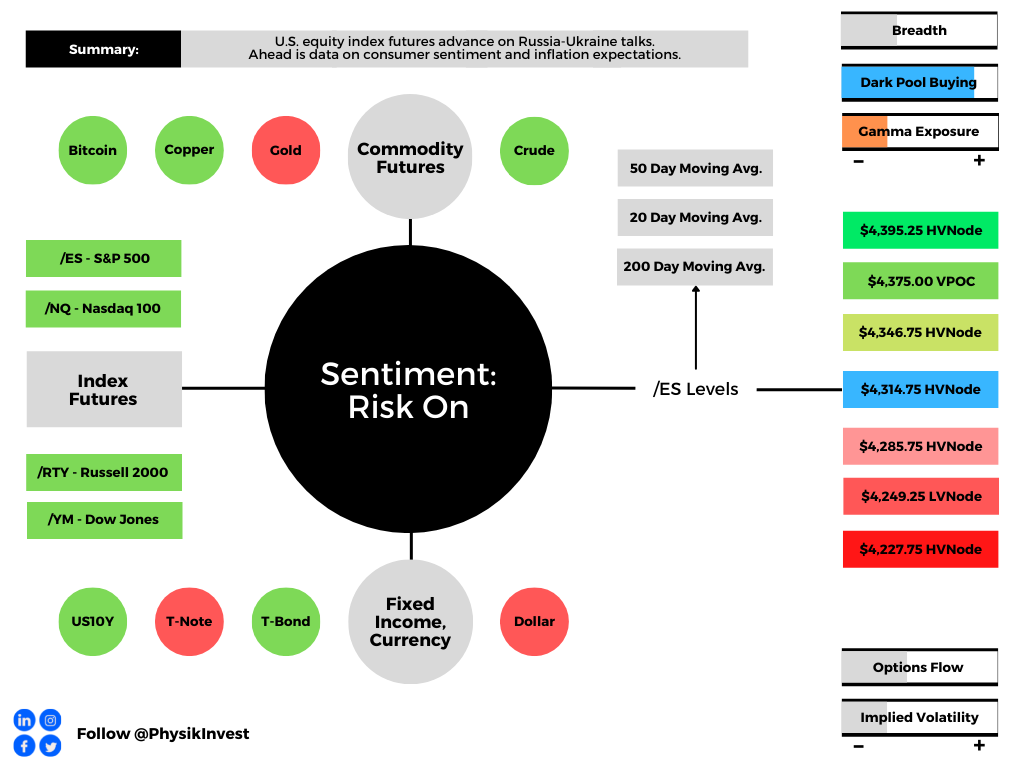
On reports that there was progress in talks between Russia and Ukraine, stock index futures advanced putting the S&P 500 back inside a large consolidation area.
Thus far, trade has been volatile and responsive to key visual levels suggesting that the larger other time frame (non-technical) participants are waiting for more information to initiate trades.
Ahead is data on the University of Michigan Sentiment (10:00 AM ET) and inflation expectations (10:00 AM ET).
What To Expect
Fundamental: Yesterday’s letter covered a lot of ground. Check it out if you haven’t already.
Volatility is heightened and the narratives we may attribute that to are concerned with the intent to tighten monetary policy, slower economic growth, and geopolitics.
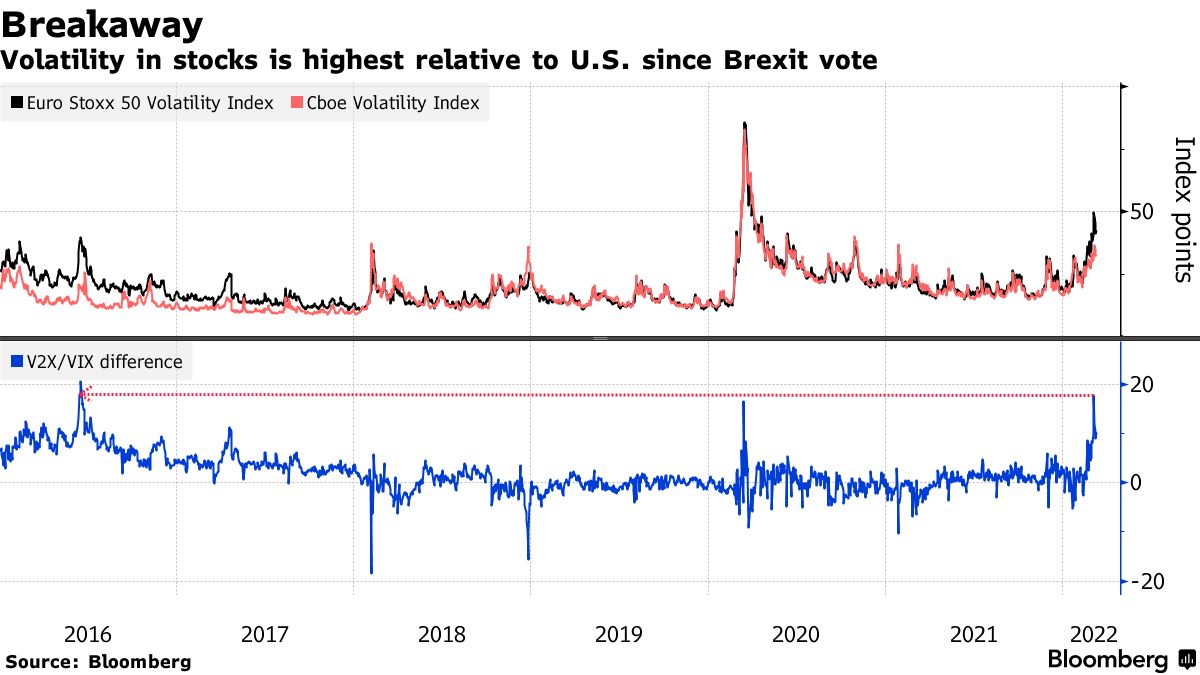
In comparison, though, U.S. equity product volatility is less than that in Europe and this points to the “risk premium for investing in Europe’s markets that are teeming with cyclical stocks acutely vulnerable to growth and inflation risks,” among other things.
Adding to the turbulence was the European Central Bank’s pivot toward hawkishness; the institution will accelerate the wind-down of its monetary stimulus. Pursuant to this decision, Euro-area equity funds had their largest weekly outflows on record.
U.S. policymakers are expected to ramp their tightening efforts, next week, also, as inflation expectations are surging.
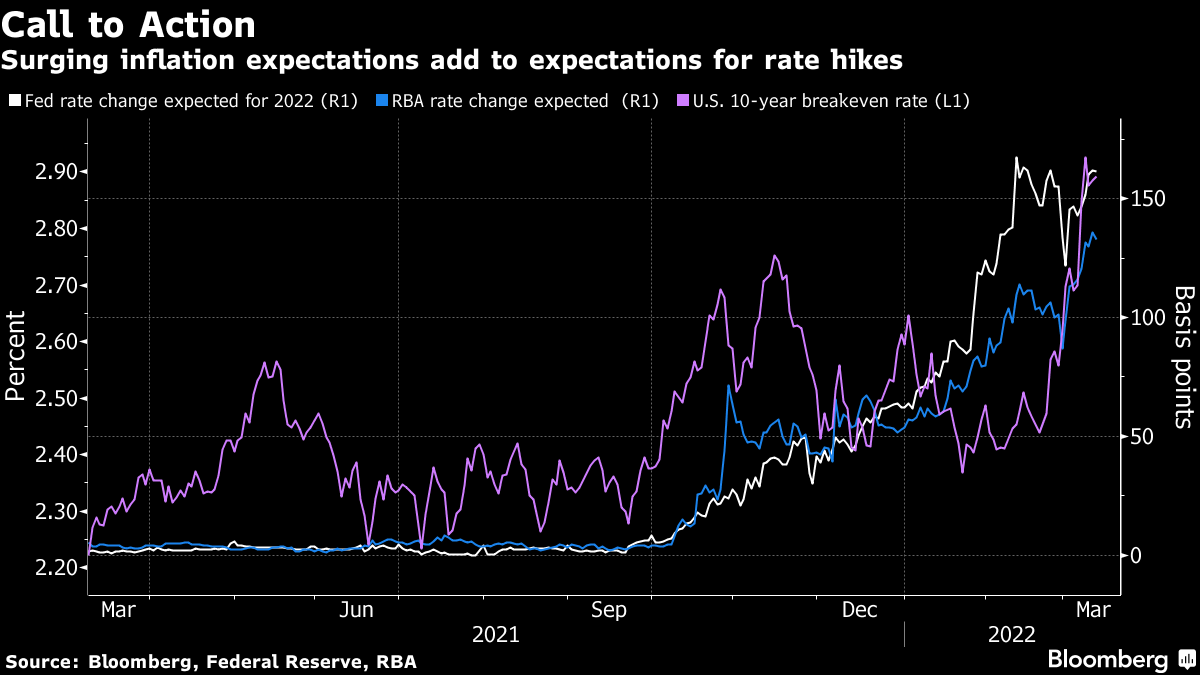
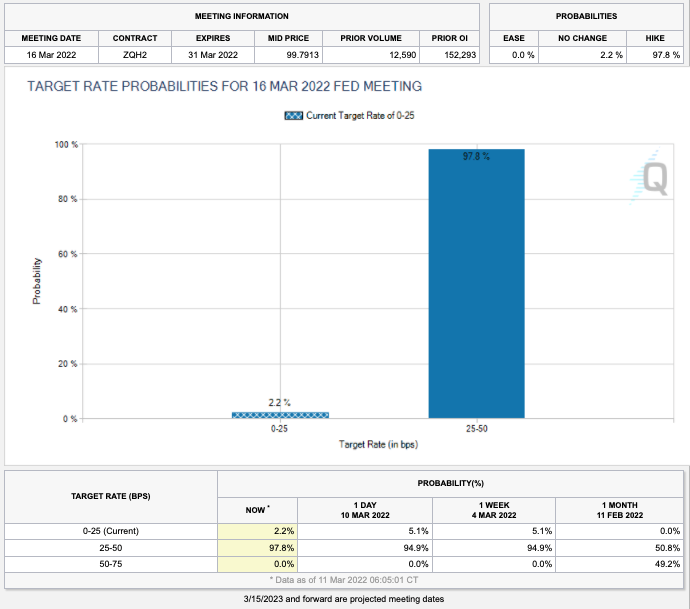
Per CME Group Inc’s (NASDAQ: CME) FedWatch Tool, participants are pricing a near 100% chance of a hike in the target rate.
In the face of all the bearish narratives, however, many products – at the single-stock level – have been de-rating now for nearly a year.
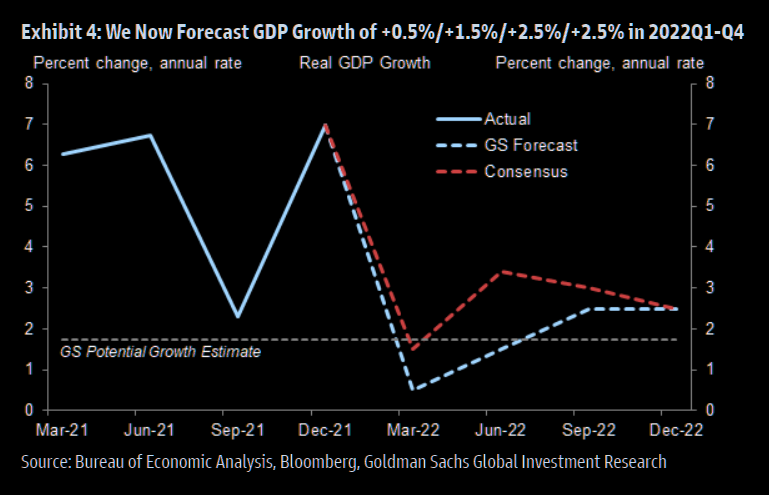
Ahead of bullish seasonality and rebalancing flow (from fixed income into equities), JPMorgan Chase & Co (NYSE: JPM) strategists suggest that “we could be through [the] worst of it.”
“When either All Strats or Equity L/S net leverage fell by at least 1.5z or more, the SPX generally rallied over the next 1wk and 4wks,” a bulletin published by The Market Ear read.
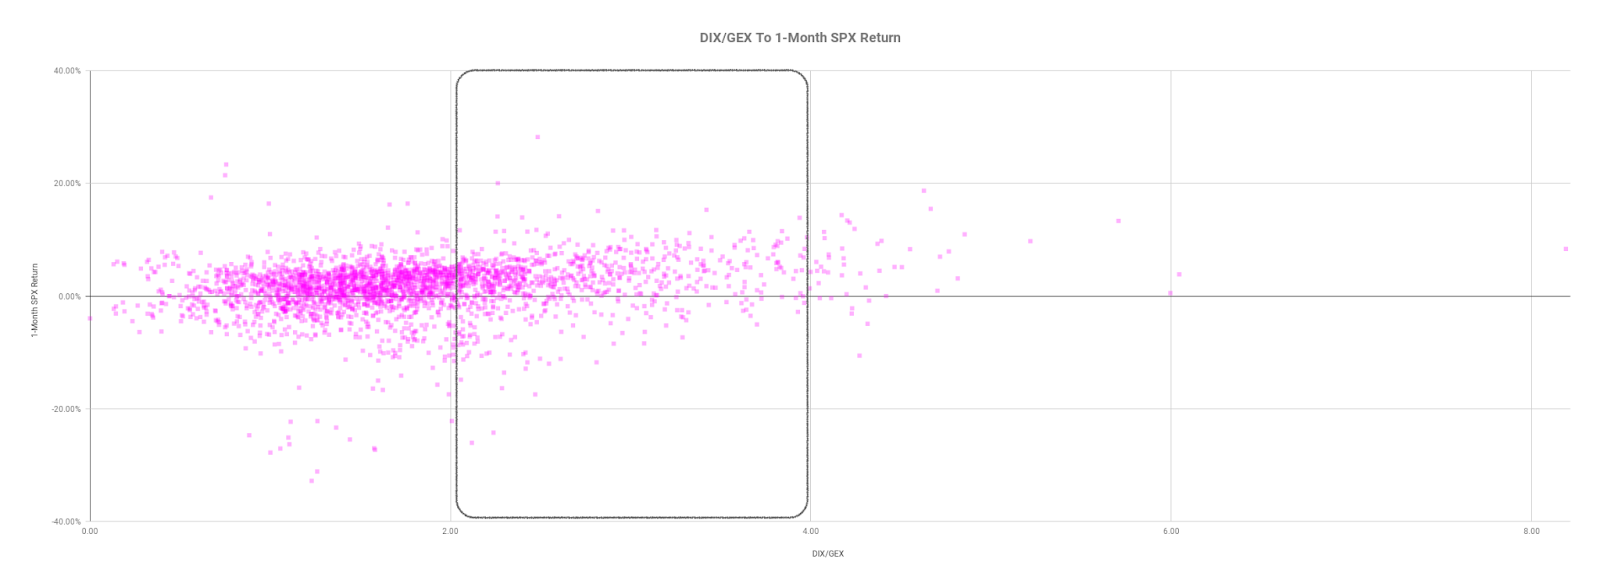
Positioning: Based on a comparison of present options positioning and buying metrics, the returns distribution is skewed positive, albeit less so than before.
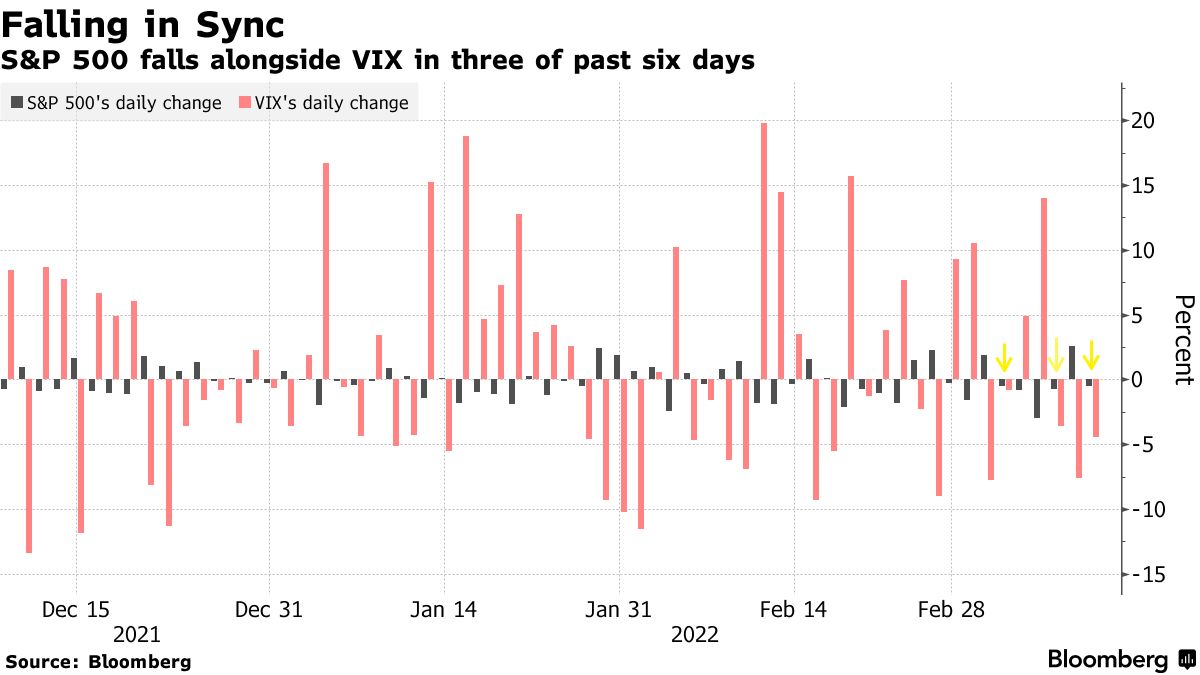
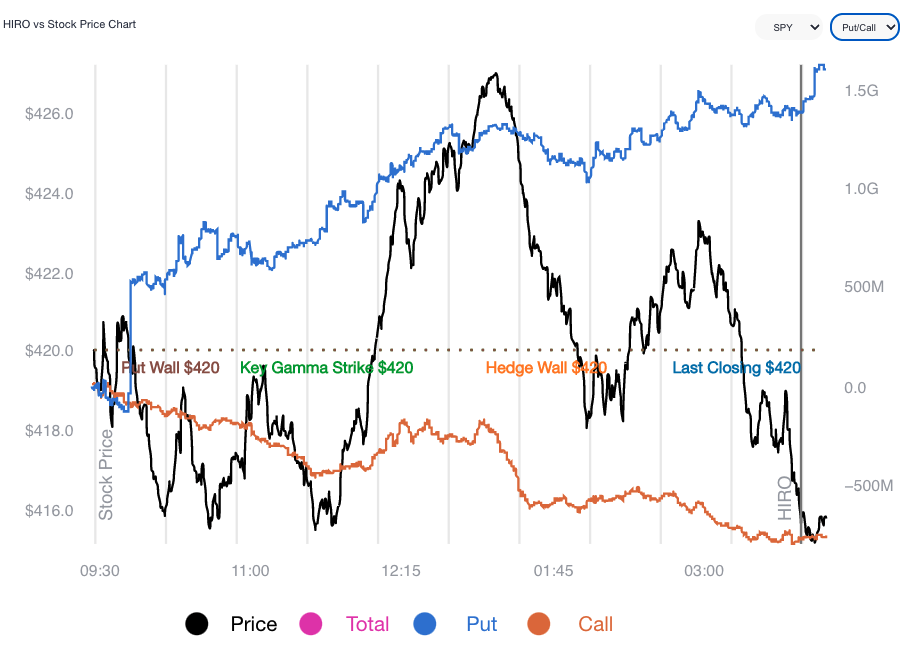
Adding, over the past weeks, we talked about the SPX and VIX down dynamic. This in part has to do with the supply and demand of protection, at the index level. Hyperlinked are our past conversations.

“We’re back to another point of people being well hedged and well-positioned,” Amy Wu Silverman of Royal Bank of Canada’s (NYSE: RY) capital markets group, said.
“You’re also seeing people selling that volatility and doing some overwriting. That can probably dampen volatility.”
“When implied volatility is high, that same 1% move lower is much more ‘expected’ so there generally won’t be the same upward pressure on volatility and in fact it might decline,” said Christopher Jacobson, a strategist at Susquehanna Financial Group LLP.
“Along the same lines, investors at that point have had more opportunity and time to hedge, so those same market moves may not lead to as much hedging activity.”
Taking this together, in accordance with metrics referred to earlier, “we could be closer to the end than the beginning of the discretionary de-risking,” as JPMorgan analysts best explain.
Further, the compression of volatility (via passage of FOMC) or removal of counterparty negative exposure (via OPEX) may serve to alleviate some of this pressure.
Until then, participants can expect the options landscape to add to market volatility.
Technical: As of 6:30 AM ET, Friday’s regular session (9:30 AM – 4:00 PM ET), in the S&P 500, will likely open in the upper part of a positively skewed overnight inventory, outside of prior-range and -value, suggesting a potential for immediate directional opportunity.
Balance-Break + Gap Scenarios: A change in the market (i.e., the transition from two-time frame trade, or balance, to one-time frame trade, or trend) is occurring.

Monitor for acceptance (i.e., more than 1-hour of trade) outside of the balance area.

Leaving value behind on a gap-fill or failing to fill a gap (i.e., remaining outside of the prior session’s range) is a go-with indicator.

Rejection (i.e., return inside of balance) portends a move to the opposite end of the balance.
In the best case, the S&P 500 trades higher; activity above the $4,314.75 high volume area (HVNode) puts in play the $4,346.75 HVNode. Initiative trade beyond the $4,346.75 HVNode could reach as high as the $4,375.00 untested point of control (VPOC) and $4,395.25 HVNode, or higher.
In the worst case, the S&P 500 trades lower; activity below the $4,314.75 HVNode puts in play the $4,285.75 HVNode. Initiative trade beyond the $4,285.75 HVNode could reach as low as the $4,249.25 low volume area (LVNode) and $4,227.75 HVNode, or lower.
Considerations: Push-and-pull, as well as responsiveness near key-technical areas (that are discernable visually on a chart), suggests technically-driven traders with short time horizons are very active.
Such traders often lack the wherewithal to defend retests and, additionally, the type of trade may be indicative of the other time frame participants waiting for more information to initiate trades.
Click here to load today’s key levels into the web-based TradingView charting platform. Note that all levels are derived using the 65-minute timeframe. New links are produced, daily.

What People Are Saying
Definitions
Overnight Rally Highs (Lows): Typically, there is a low historical probability associated with overnight rally-highs (lows) ending the upside (downside) discovery process.
Volume Areas: A structurally sound market will build on areas of high volume (HVNodes). Should the market trend for long periods of time, it will lack sound structure, identified as low volume areas (LVNodes). LVNodes denote directional conviction and ought to offer support on any test.
If participants were to auction and find acceptance into areas of prior low volume (LVNodes), then future discovery ought to be volatile and quick as participants look to HVNodes for favorable entry or exit.
POCs: POCs are valuable as they denote areas where two-sided trade was most prevalent in a prior day session. Participants will respond to future tests of value as they offer favorable entry and exit.
About
After years of self-education, strategy development, mentorship, and trial-and-error, Renato Leonard Capelj began trading full-time and founded Physik Invest to detail his methods, research, and performance in the markets.
Capelj is also a Benzinga finance and technology reporter interviewing the likes of Shark Tank’s Kevin O’Leary, JC2 Ventures’ John Chambers, FTX’s Sam Bankman-Fried, and ARK Invest’s Catherine Wood, as well as a SpotGamma contributor developing insights around impactful options market dynamics.
Disclaimer
Physik Invest does not carry the right to provide advice.
In no way should the materials herein be construed as advice. Derivatives carry a substantial risk of loss. All content is for informational purposes only.


