
Editor’s Note: The Daily Brief is a free glimpse into the prevailing fundamental and technical drivers of U.S. equity market products. Join the 200+ that read this report daily, below!
What Happened
Equity index futures rebound after exploring prices below Monday’s close. Most commodity products, alongside measures of implied volatility, remain bid.
The overnight response higher came as the European Union announced it was considering joint bond sales to assist in the fiscal fallout from Russia’s invasion of Ukraine.
Still, at home in the U.S., policymakers are looking to rein in inflation and apply contractionary monetary policy whilst inflation remains heightened and economic growth is slowing.
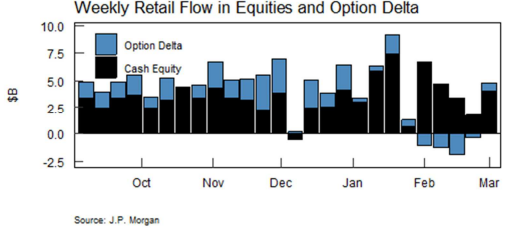
As noted in prior commentaries, in spite of continued (albeit lightly cooled) passive buying support, the equity markets are prone to continued weakness. We add to this narrative, below.
Ahead is data on the foreign trade deficit (8:30 AM ET) and wholesale inventories (10:00 AM ET).
What To Expect
Fundamental: Shortened note, today.
The prevailing narrative is concerned with the slowdown in economic growth, the intent to withdraw monetary stimulus, and the response to Russia’s invasion of Ukraine.
Heading into this week, broad-based indexes in the U.S. were weak but steady; fixed income, commodity, and equity markets abroad traded more volatile in comparison.
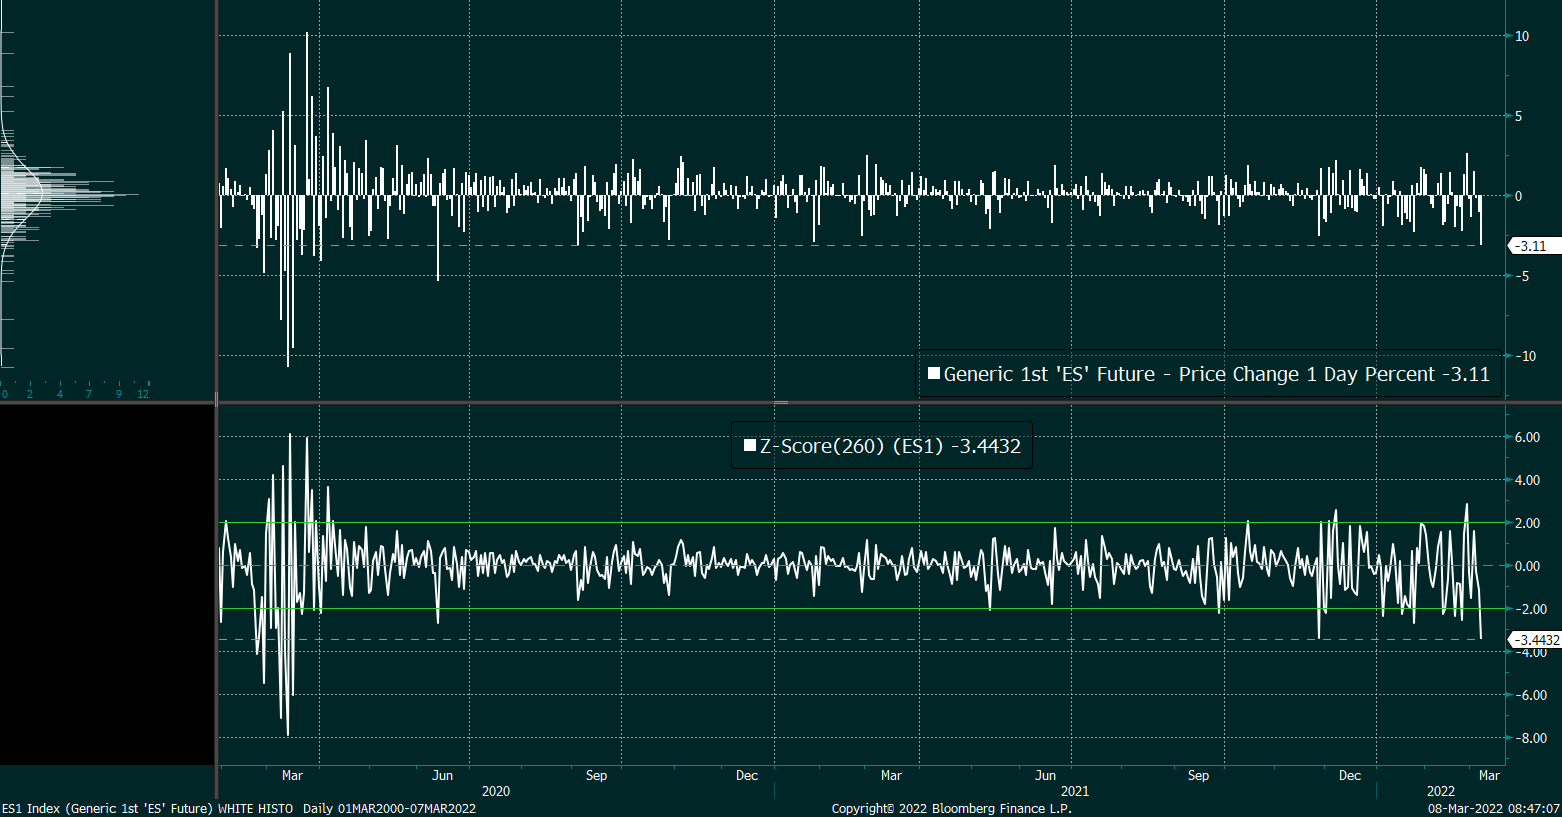
The tone changed, slightly, yesterday, after the S&P 500 pushed the lower bound of price changes it has logged since 2020.
Still, it is likely that participants have yet to witness a climactic de-leveraging; in part, what is supporting the market (as described in detail before, here) is passive buying support and the supply of liquidity, at the index level.
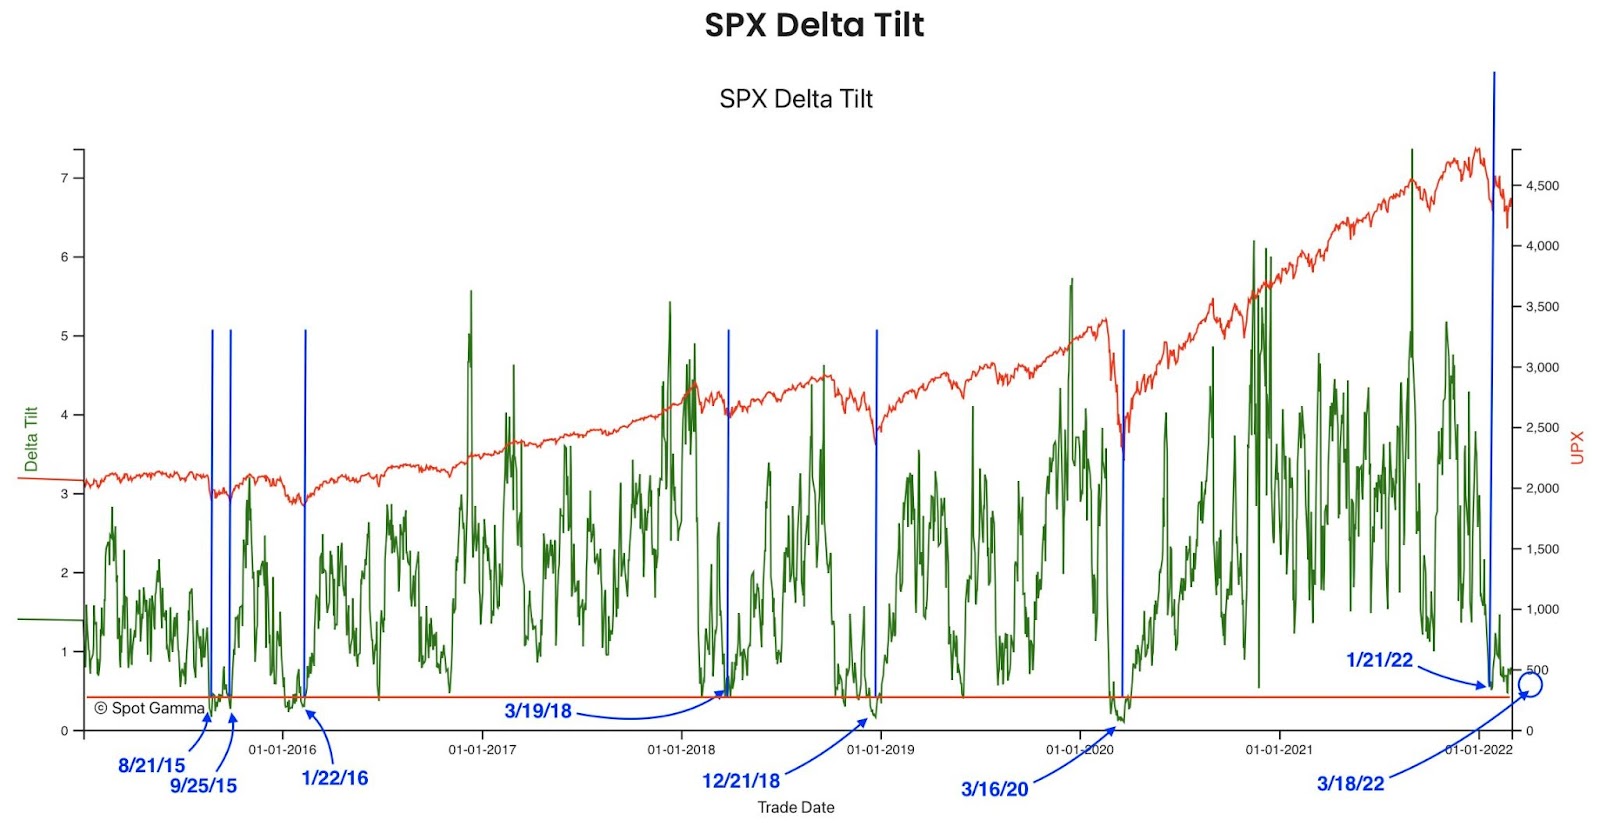
At the single-stock level, the de-rate in anticipation of slowing growth Fed tightening has mostly played its course. At the index level, there are signs of more room to go.
This is “[v]ery resemblant of prior market events,” The Ambrus Group’s Kris Sidial explained in a reference to extreme events in markets having a higher likelihood of becoming more extreme.
“Just when you think ‘this is the top/ bottom’ it puts in another massive leg that makes everyone go ‘oh sh*t’.”
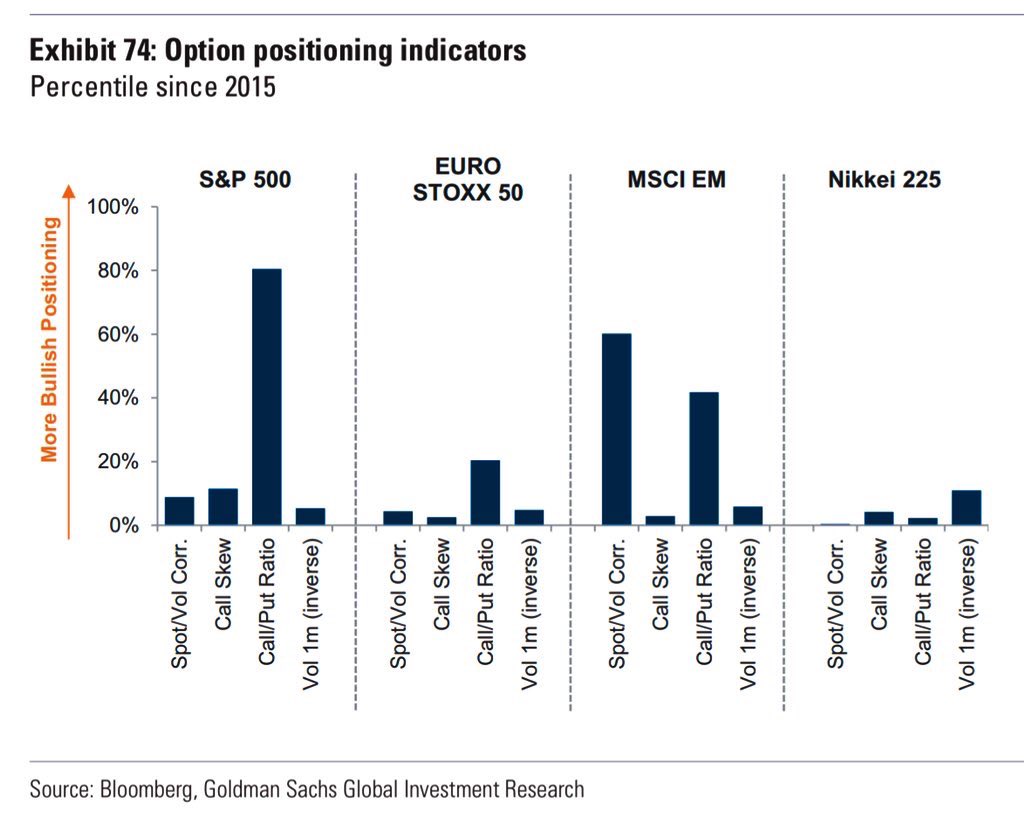
Positioning: At present, in the face of continued passive buying support, the overwhelming demand for downside (put) protection (a negative delta, positive gamma trade) results in counterparty hedging that may exacerbate weakness.
The reason why? The counterparty has exposure to positive delta and negative gamma. If underlying prices print lower and/or measures of implied volatility rise (given increased fear and demand for protection), short puts rise in value (and counterparty losses are multiplied).
To overcome these potential losses, counterparties sell the underlying to hedge. If nothing happens, the protection decays, and counterparties buy back their hedges potentially bolstering the underlying market’s calmness or attempts higher.
In the coming week, participants will gain clarity with respect to the Federal Reserve’s intent to tighten. Closely after, there is a monthly options expiration (OPEX).
The compression in volatility post-FOMC, coupled with a reduction in put-heavy positioning post-OPEX, could help support markets.
Interested in more about options and unique structures that may assist with navigating current volatility, check out this volatility trading primer by Santander.
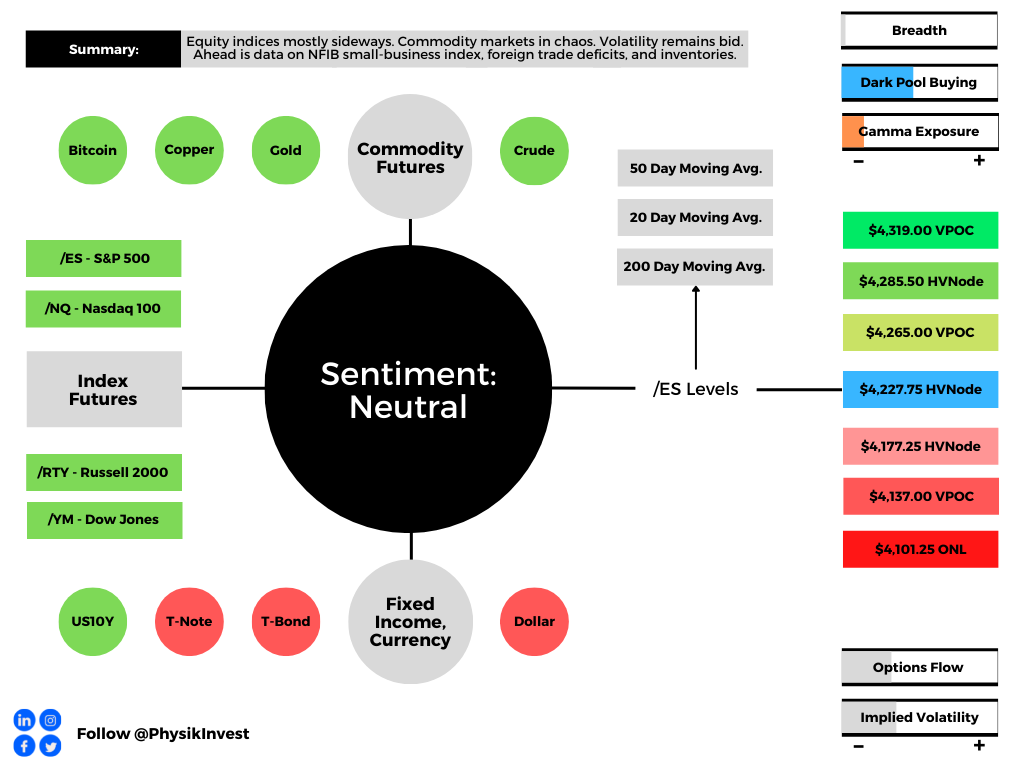
Technical: As of 6:40 AM ET, Tuesday’s regular session (9:30 AM – 4:00 PM ET), in the S&P 500, will likely open in the top part of a balanced overnight inventory, inside of prior-range and -value, suggesting a limited potential for immediate directional opportunity.
In the best case, the S&P 500 trades higher; activity above the $4,227.25 high volume area (HVNode) puts in play the $4,265.00 untested point of control (VPOC). Initiative trade beyond the VPOC could reach as high as the $4,285.50 HVNode and $4,319.00 VPOC, or higher.
In the worst case, the S&P 500 trades lower; activity below the $4,227.75 HVNode puts in play the $4,177.25 HVNode. Initiative trade beyond the latter HVNode could reach as low as the $4,137.00 VPOC and $4,101.25 ONL, or lower.
Click here to load today’s key levels into the web-based TradingView charting platform. Note that all levels are derived using the 65-minute timeframe. New links are produced, daily.

Definitions
Overnight Rally Highs (Lows): Typically, there is a low historical probability associated with overnight rally-highs (lows) ending the upside (downside) discovery process.
Volume Areas: A structurally sound market will build on areas of high volume (HVNodes). Should the market trend for long periods of time, it will lack sound structure, identified as low volume areas (LVNodes). LVNodes denote directional conviction and ought to offer support on any test.
If participants were to auction and find acceptance into areas of prior low volume (LVNodes), then future discovery ought to be volatile and quick as participants look to HVNodes for favorable entry or exit.
POCs: POCs are valuable as they denote areas where two-sided trade was most prevalent in a prior day session. Participants will respond to future tests of value as they offer favorable entry and exit.
About
After years of self-education, strategy development, mentorship, and trial-and-error, Renato Leonard Capelj began trading full-time and founded Physik Invest to detail his methods, research, and performance in the markets.
Capelj is also a Benzinga finance and technology reporter interviewing the likes of Shark Tank’s Kevin O’Leary, JC2 Ventures’ John Chambers, FTX’s Sam Bankman-Fried, and ARK Invest’s Catherine Wood, as well as a SpotGamma contributor developing insights around impactful options market dynamics.
Disclaimer
Physik Invest does not carry the right to provide advice.
In no way should the materials herein be construed as advice. Derivatives carry a substantial risk of loss. All content is for informational purposes only.