The daily brief is a free glimpse into the prevailing fundamental and technical drivers of U.S. equity market products. Join the 300+ that read this report daily, below!
Separately, the Daily Brief will be on pause from May 30, 2022, to June 7, 2022, due to the author’s overseas travel commitments. Apologies for the inconvenience and happy trading!
What Happened
Overnight, equity index futures were divergent, albeit nearly flat, after Wednesday’s release of minutes to the last Federal Open Market Committee (FOMC) meeting were less hawkish than expected, bolstering a small expansion of the range to the upside.
Though higher prices were held at the index level, some products like Apple Inc (NASDAQ: AAPL) were lower after issuing updates on its production. Yesterday, it was social media and advertising businesses like Snap Inc (NYSE: SNAP) that fell on forecasts for meager growth.
In other news, Sequoia Capital warned that the current environment for founders is a “crucible moment,” and there is no indication good times will return soon.
Pursuant to that belief, we have firms like Klarna and Bolt, who just began laying off employees, preparing for slower growth and focusing on “short-term profitability.”
A chief concern, among participants at the World Economic Forum, beyond a global recession and inflation, is the potential for ongoing conflicts to cause “mass starvation” and “political instability around the world.”
Today we get updates on jobless claims, real gross domestic product, and income, as well as final sales to domestic purchasers (8:30 AM ET). Later, pending home sales (10:00 AM ET).
What To Expect
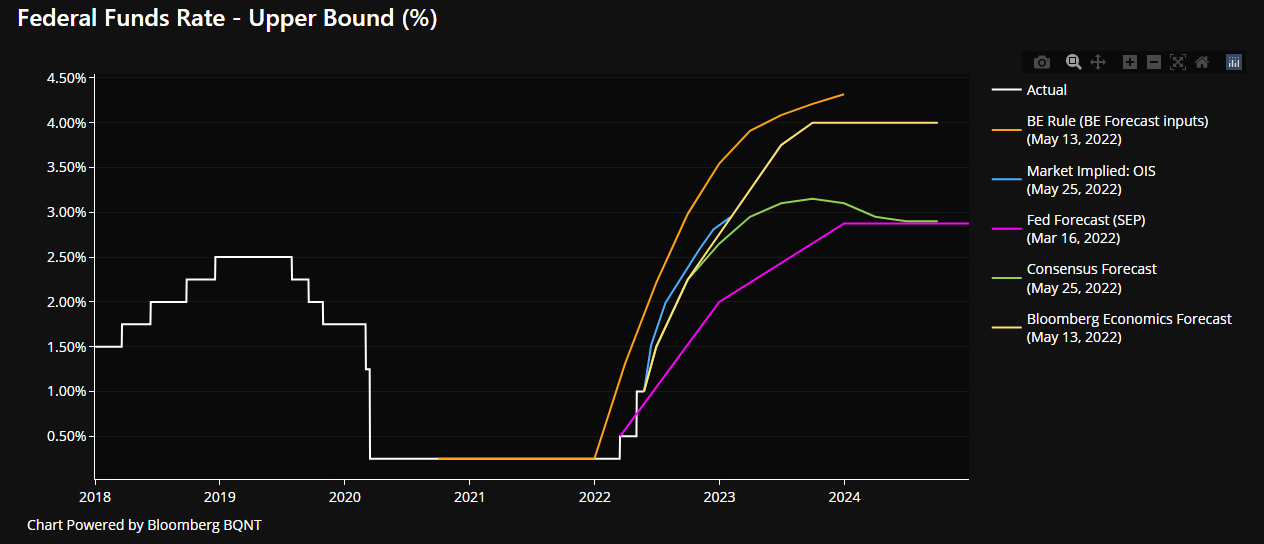
Fundamental: As was suggested could happen in Wednesday’s pre-market letter, the Federal Reserve (Fed) indicated potential policy flexibility, later this year.
Per the most recent FOMC minutes, officials are determined to achieve price stability with “50 basis-point increases in the target range … at the next couple of meetings.”
“Many participants judged that expediting the removal of policy accommodation would leave the committee well-positioned later this year to assess the effects of policy firming and the extent to which economic developments warranted policy adjustments.”
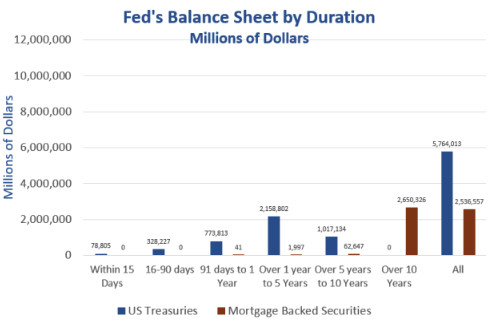
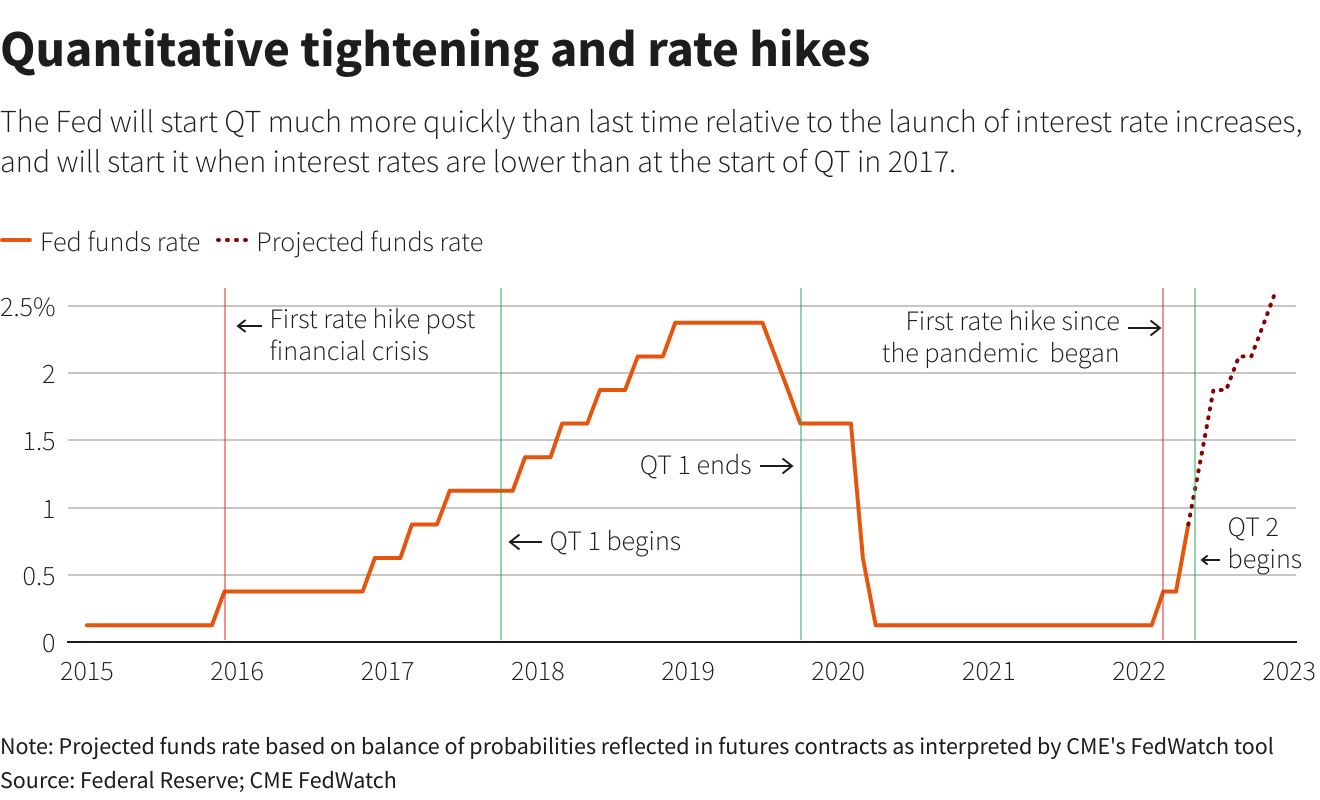
Accordingly, finalized were balance sheet reduction plans. Starting June 1, 2022, Treasury holdings will decline by $30 billion per month, rising to $60 billion per month in September.
Mortgage-backed securities (MBS) holdings will shrink by $17.5 billion per month, ultimately rising to $35 billion, in accordance with our post-FOMC letter published May 5, 2022.
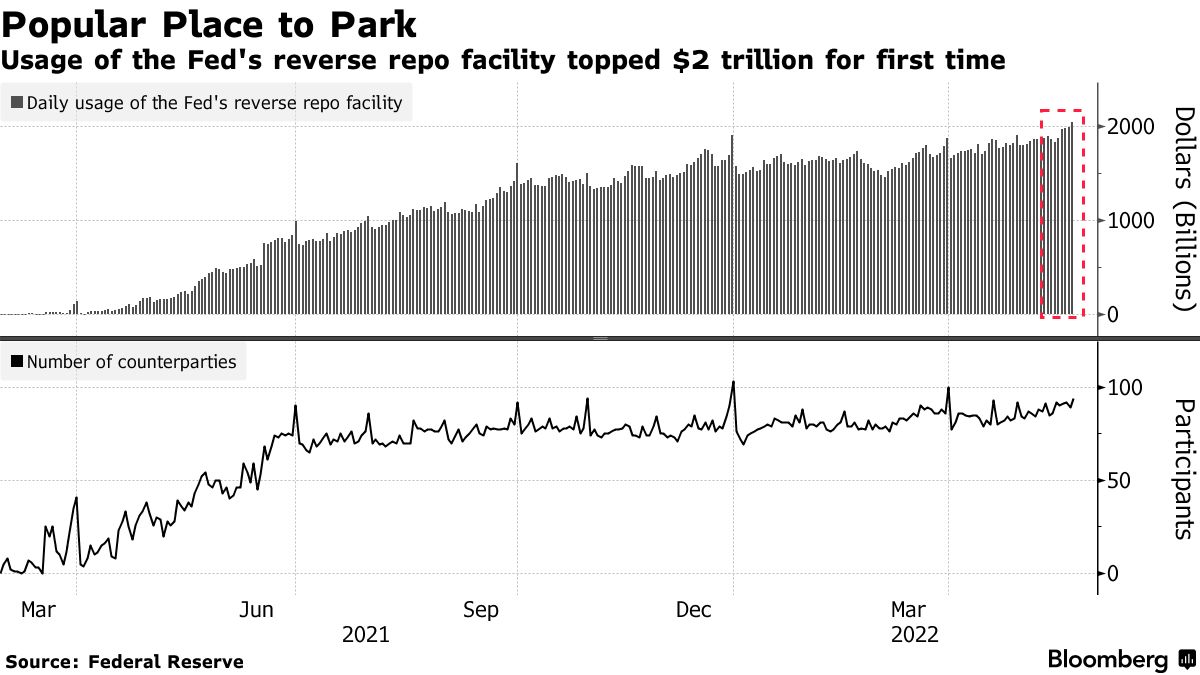
As stated, previously, with QT, central banks remove assets from their balance sheet either through outright sales or the non-reinvestment of the principal sum of maturing securities.
“QT is a direct flow of capital to capital markets” and the prospects of withdrawing this liquidity, when revealed in December’s FOMC meeting minutes, was what fed into a retreat from risk.
Overall, the minutes left the tone unchanged and reaffirmed the Fed’s commitment to stable prices.
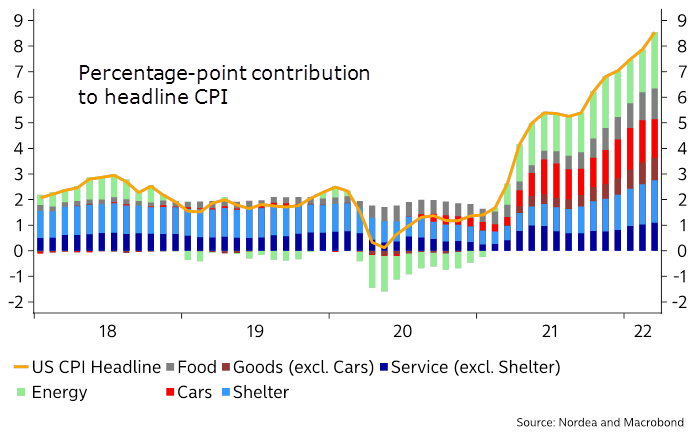
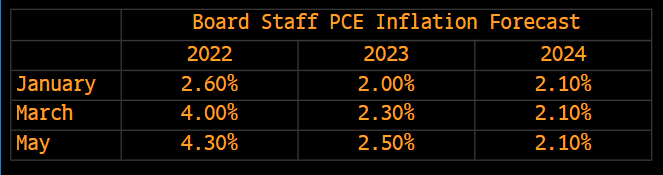
Bloomberg’s John Authers concludes, well: “If inflation should look as though it might fail to get down even to the revised forecast of 4.3% by the end of the year, there’s still a possibility that the Fed will have to be more hawkish than it currently intends, not less.”
“But at least the path until the end of summer looks clear.”
Positioning: We’re carrying forward remarks from notes earlier this week as there has been a limited change in tone.
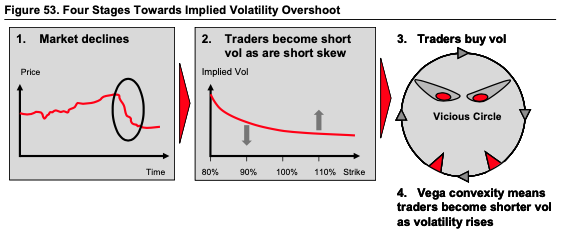
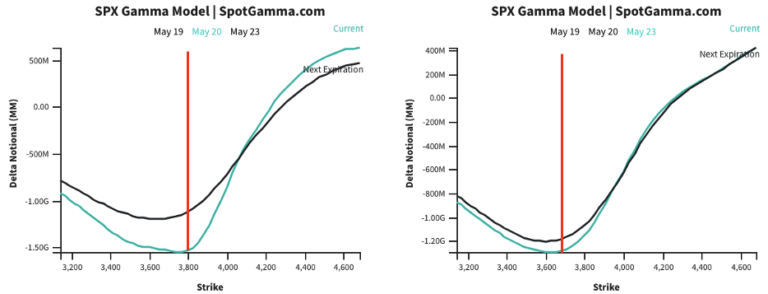
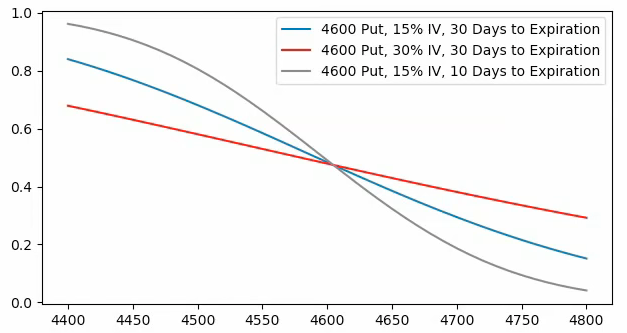
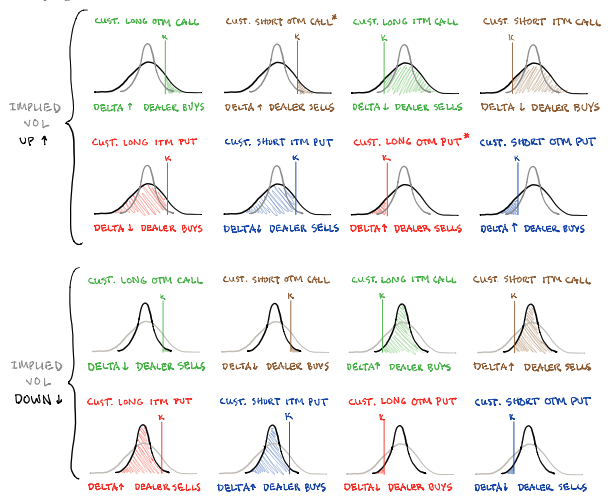
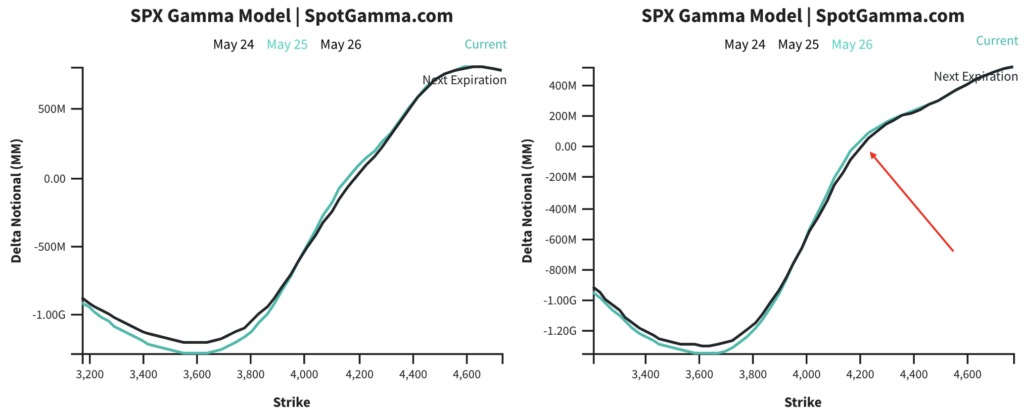
Based on current positioning, most products we monitor continue to trade in an environment that solicits more volatile hedging of put open interest and realized volatility (RVOL). This is because, naively, we look at participants as mainly owning protection to the downside.
So, they have asymmetric (positive gamma) exposure to the downside (negative delta). On the other side, liquidity providers have a negative gamma and positive delta that they must sell into weakness and buy into strength underlying to hedge.
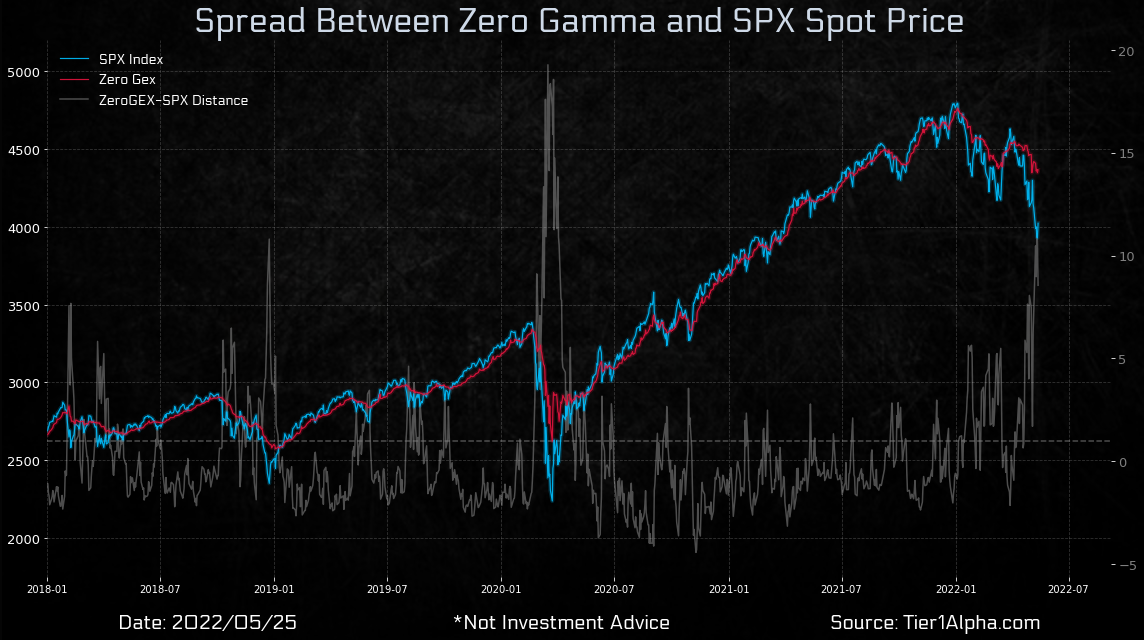
It is at a certain juncture, far above current prices (i.e., Zero Gamma), that the volatile effects of hedging this put open interest begin to cool. It is above these levels that participants’ exposure to calls solicits increased hedging activities which promote stability and less volatility.
It’s because, naively, we look at participants as financing their bets on the downside with call exposure. On the other side, liquidity providers, then, have a positive gamma and delta trade they hedge by buying into weakness and selling into strength.
We’re definitely not there yet but, based on remarks in past letters (e.g., stretched market and investors bidding “skew on the call side” amid their “fear of missing on the upside”), this letter’s author continues leaning toward strategies that have little to lose in case of further implied volatility (IVOL) compression or weakness into the June FOMC and OPEX.
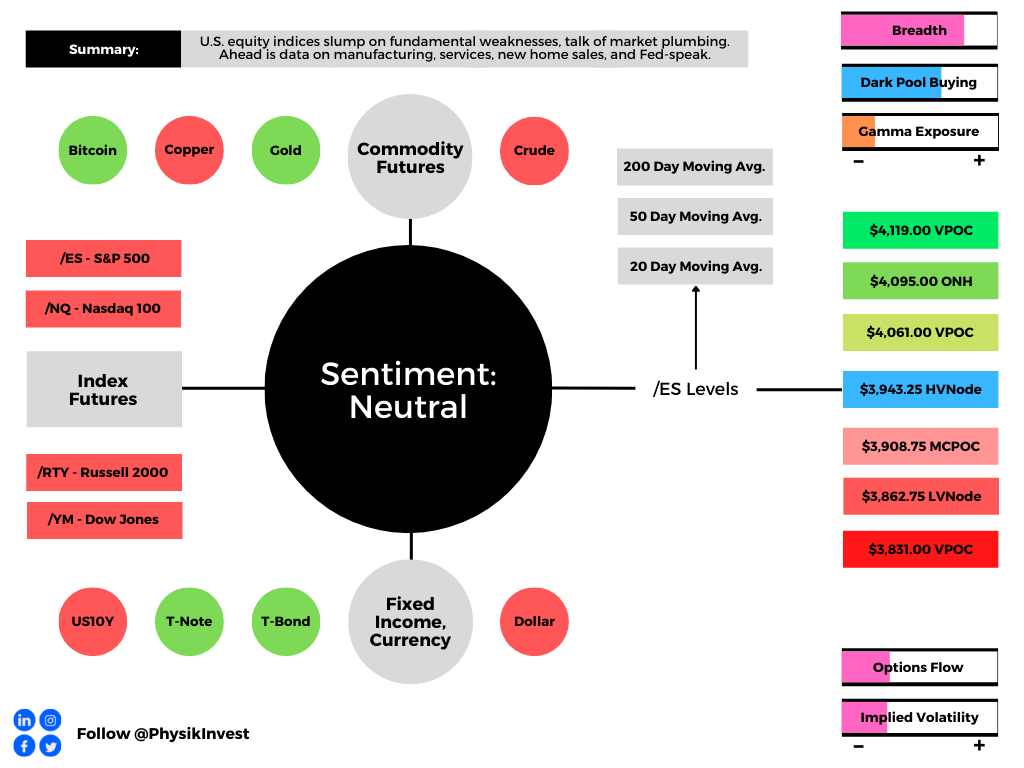
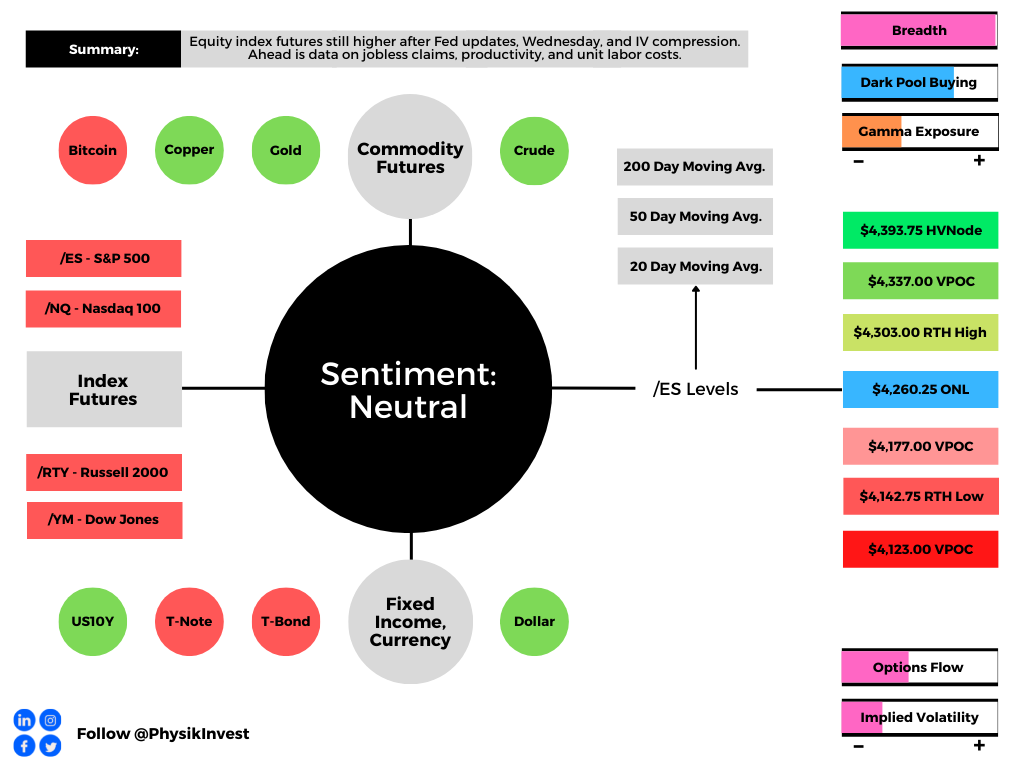
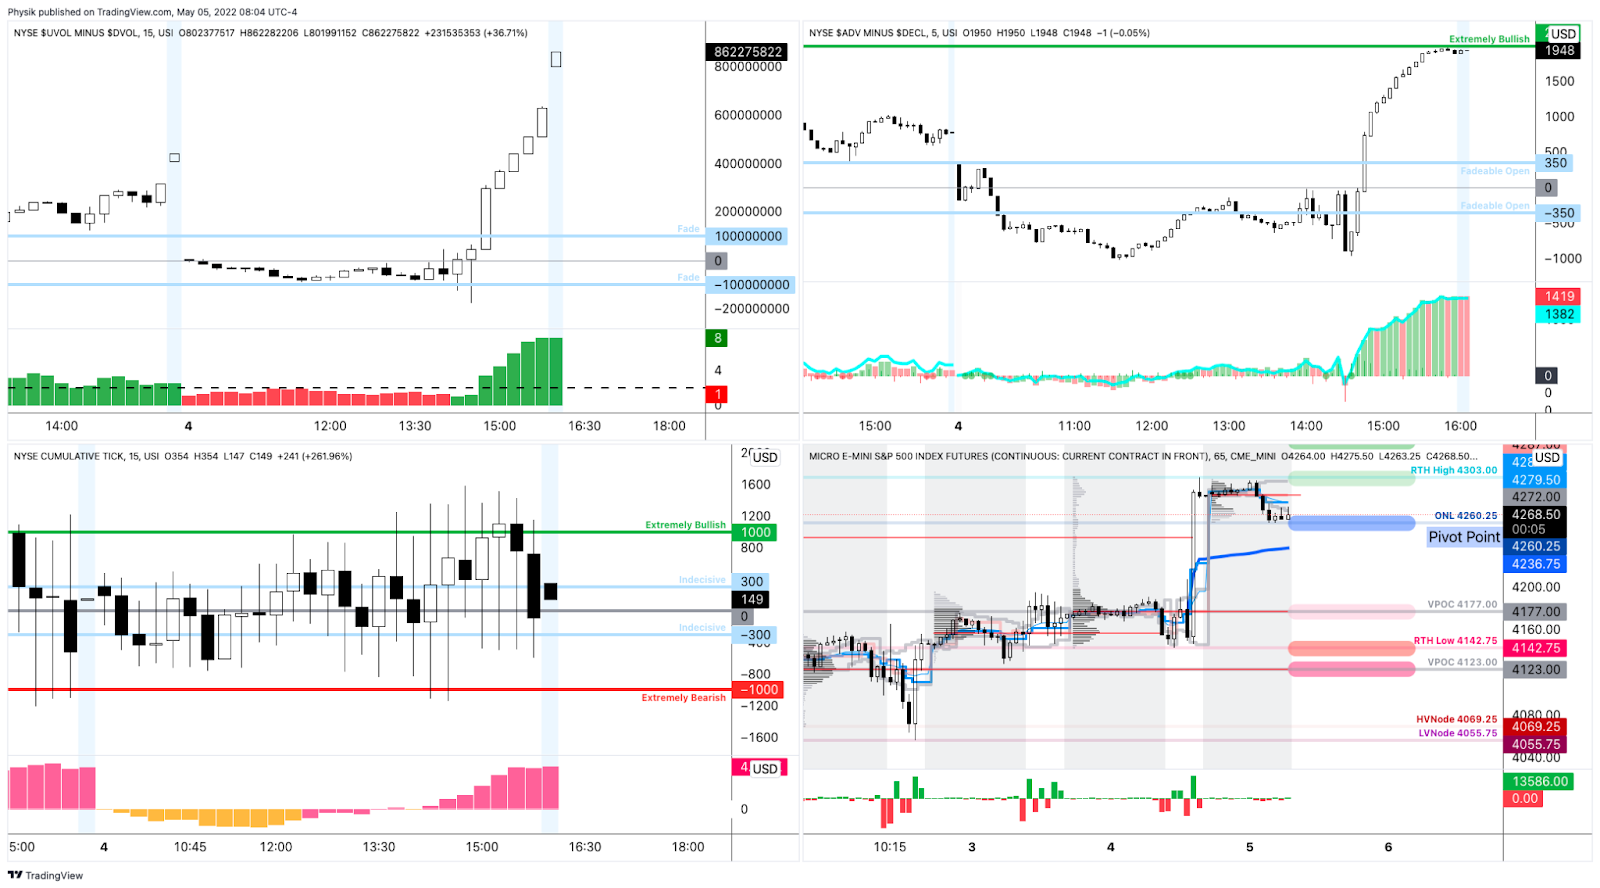
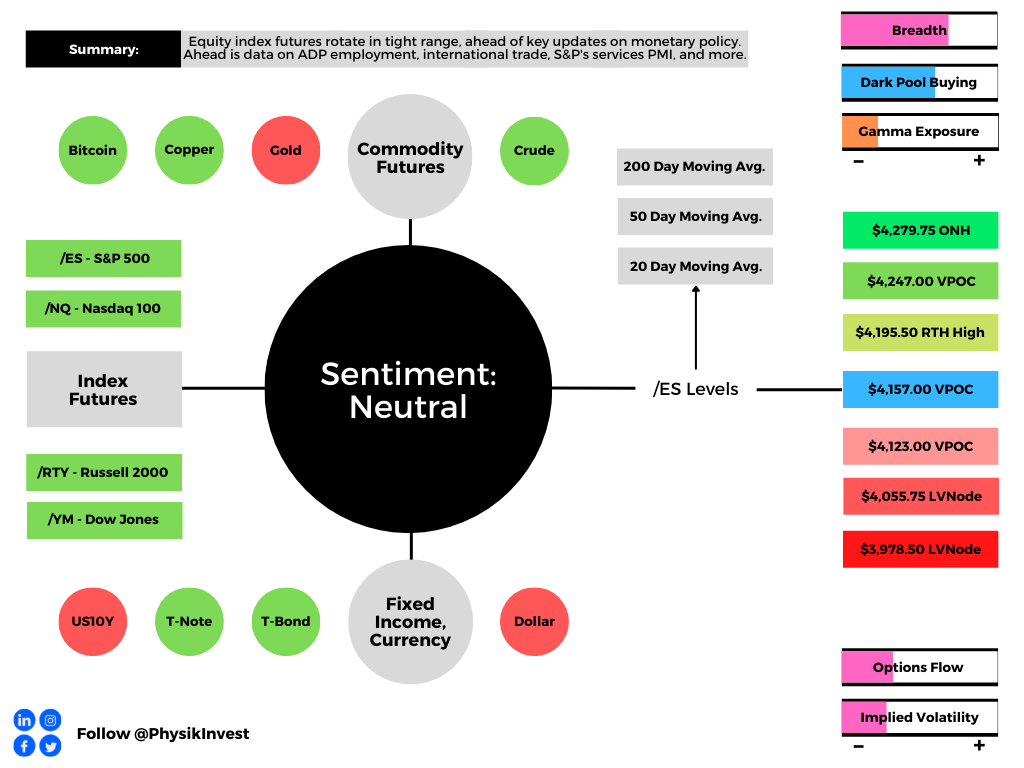
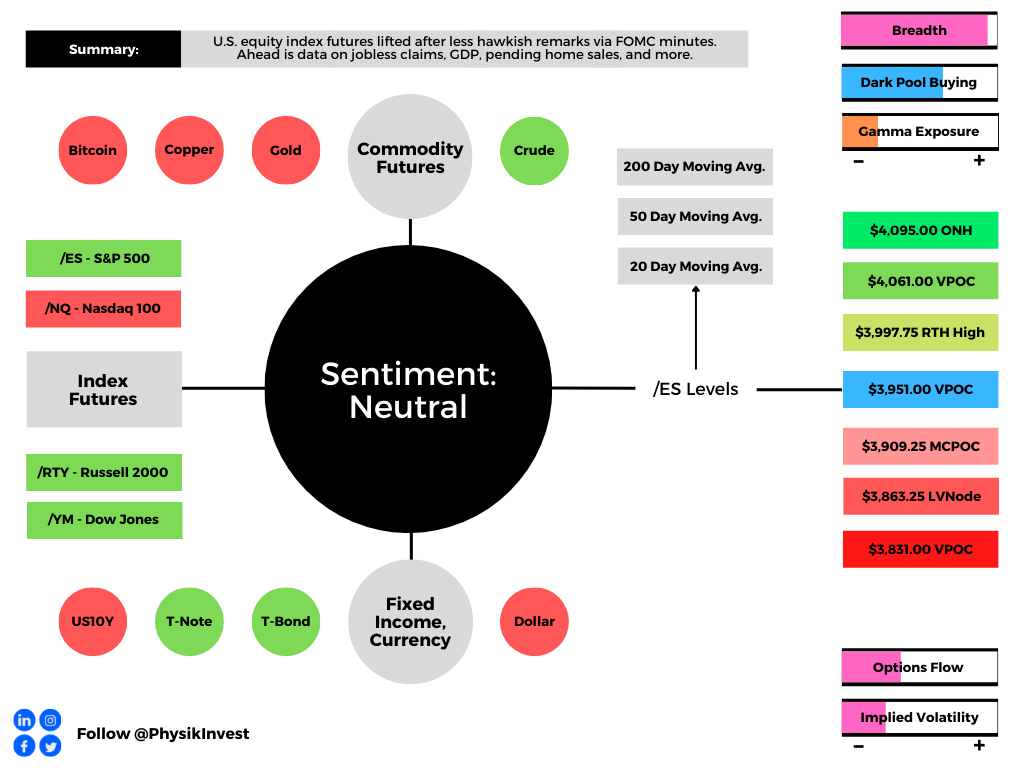
Technical: As of 6:30 AM ET, Thursday’s regular session (9:30 AM – 4:00 PM ET), in the S&P 500, will likely open in the upper part of a positively skewed overnight inventory, nearly outside of prior-range and -value, suggesting a potential for immediate directional opportunity.
In the best case, the S&P 500 trades higher; activity above the $3,951.00 VPOC puts in play the $3,997.75 RTH High. Initiative trade beyond the RTH High could reach as high as the $4,061.00 VPOC and $4,095.00 ONH, or higher.
In the worst case, the S&P 500 trades lower; activity below the $3,951.00 VPOC puts in play the $3,909.25 MCPOC. Initiative trade beyond the MCPOC could reach as low as the $3,863.25 LVNode and $3,831.00 VPOC, or lower.
Click here to load today’s key levels into the web-based TradingView charting platform. Note that all levels are derived using the 65-minute timeframe. New links are produced, daily.

Definitions
Overnight Highs And Lows (ONH and ONL): Typically, there is a low historical probability associated with overnight rally-highs (lows) ending the upside (downside) discovery process.
Volume Areas: A structurally sound market will build on areas of high volume (HVNodes). Should the market trend for long periods of time, it will lack sound structure, identified as low volume areas (LVNodes). LVNodes denote directional conviction and ought to offer support on any test.
If participants were to auction and find acceptance into areas of prior low volume (LVNodes), then future discovery ought to be volatile and quick as participants look to HVNodes for favorable entry or exit.
POCs: POCs are valuable as they denote areas where two-sided trade was most prevalent in a prior day session. Participants will respond to future value tests as they offer favorable entry and exit.
About
After years of self-education, strategy development, mentorship, and trial-and-error, Renato Leonard Capelj began trading full-time and founded Physik Invest to detail his methods, research, and performance in the markets.
Capelj also develops insights around impactful options market dynamics at SpotGamma and is a Benzinga reporter.
Some of his works include conversations with ARK Invest’s Catherine Wood, investors Kevin O’Leary and John Chambers, FTX’s Sam Bankman-Fried, Kai Volatility’s Cem Karsan, The Ambrus Group’s Kris Sidial, among many others.
Disclaimer
In no way should the materials herein be construed as advice. Derivatives carry a substantial risk of loss. All content is for informational purposes only.