Categories
Commentary

Daily Brief For July 19, 2022

The daily brief is a free glimpse into the prevailing fundamental and technical drivers of U.S. equity market products. Join the 300+ that read this report daily, below!

Graphic updated 6:50 AM ET. Sentiment Neutral if expected /ES open is inside of the prior day’s range. /ES levels are derived from the profile graphic at the bottom of the following section. Levels may have changed since initially quoted; click here for the latest levels. SqueezeMetrics Dark Pool Index (DIX) and Gamma (GEX) calculations are based on where the prior day’s reading falls with respect to the MAX and MIN of all occurrences available. A higher DIX is bullish. At the same time, the lower the GEX, the more (expected) volatility. Learn the implications of volatility, direction, and moneyness. Breadth reflects a reading of the prior day’s NYSE Advance/Decline indicator. VIX reflects a current reading of the CBOE Volatility Index (INDEX: VIX) from 0-100.

Fundamental

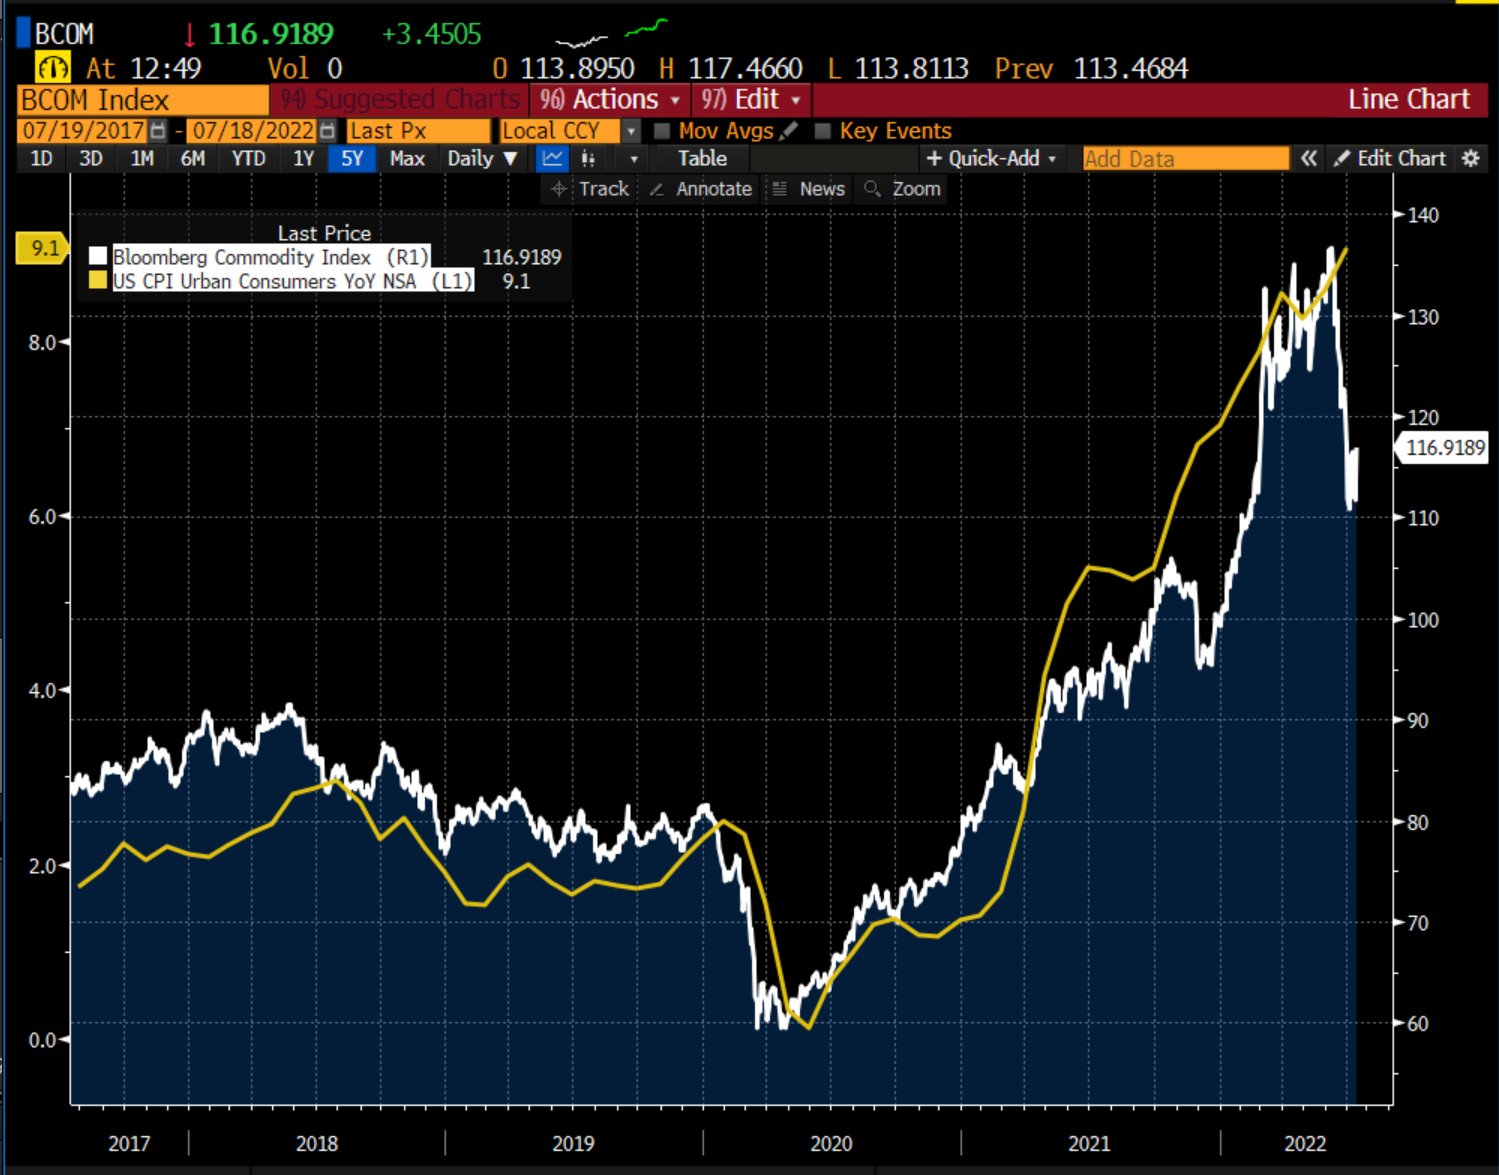
After the release of data on consumer prices, earlier this month, the belief was that a de-rate, on inflation, was, potentially, nearing an end, although it was likely to remain at a “higher level than we’ve seen historically,” per the likes of Chevron Corporation’s (NYSE: CVX) CEO Mike Wirth.

Read: National Association of Homebuilders (NAHB) Housing Market Index (HMI) sees record decline. Rental markets cooling. Foreign buying jumps. Food to be the ultimate weapon in the 21st century.

Graphic: Retrieved from Randy Woodward. “Bloomberg commodities index vs. headline CPI.”

Now comes an even deeper compression on earnings?

Graphic: Retrieved from Callum Thomas. “Clear downward momentum in earnings revisions, only 33% of analyst earnings estimates have been revised upward (i.e. the rest downward) — matches the worsening macro.”

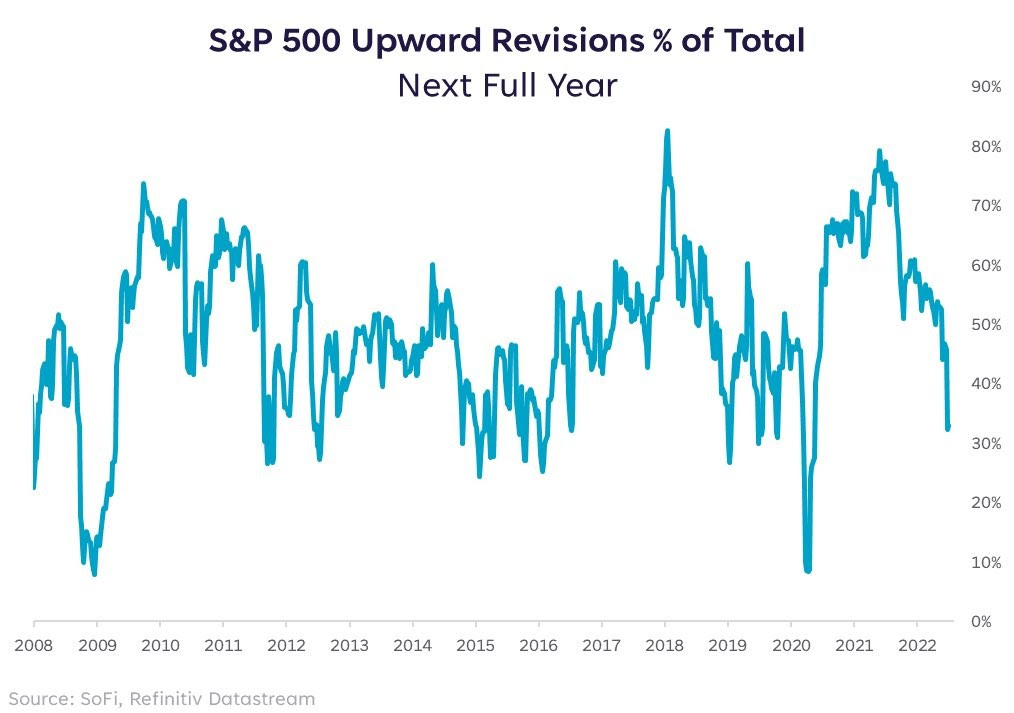
Well, maybe. Based on executives’ perspectives, we’re probably “talking ourselves into a recession,” precisely what the likes of Robert Shiller have expressed worry on.

Accordingly, participants are now pricing in shaky earnings, selling the stock of Goldman Sachs Group Inc (NYSE: GS), Apple Inc (NASDAQ: AAPL), and beyond, on those firms’ preparations for an increased potential for an economic downturn.

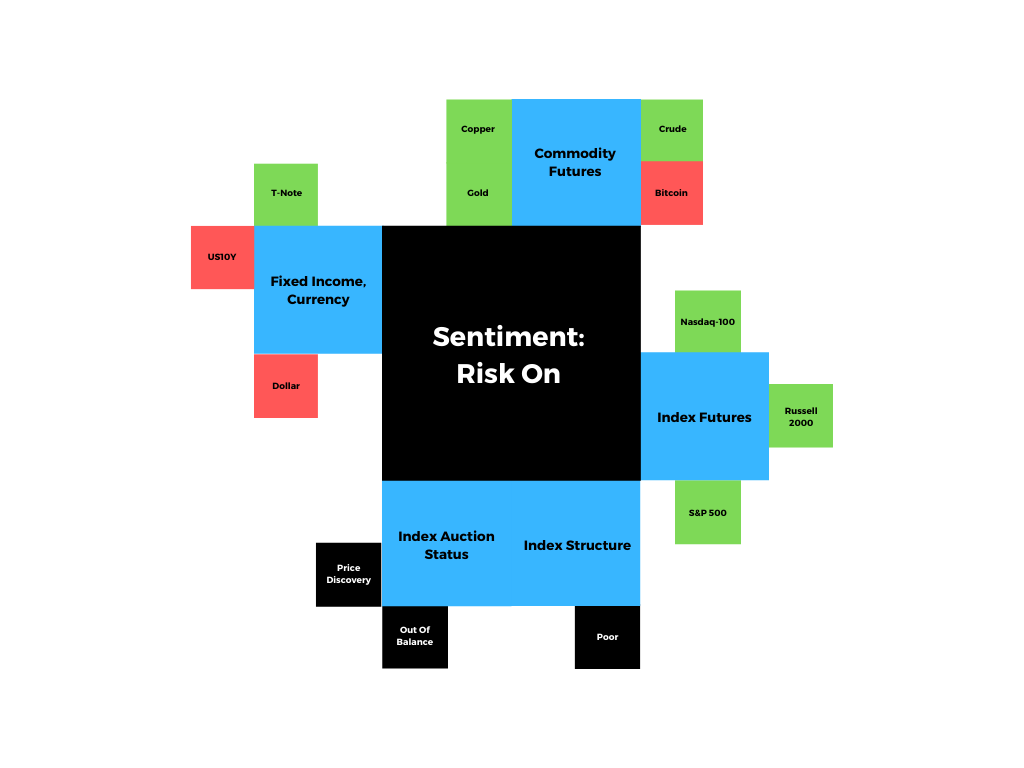
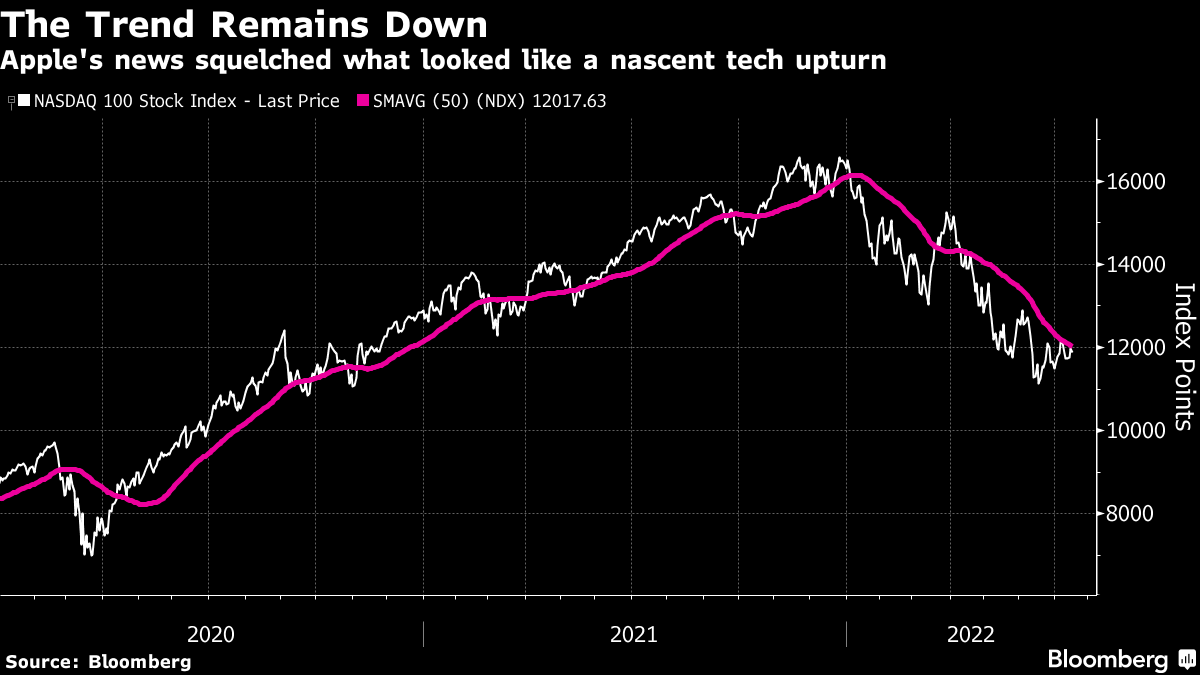
Up until this week, the Nasdaq 100 (INDEX: NDX) was doing better, consolidating for a potential break above a key response area, like the S&P 500 (INDEX: SPX), highlighted in a section further below.

It failed after the release of earnings from some index heavyweights.

Graphic: Retrieved from Bloomberg. “The Nasdaq 100, down 27% for the year so far, had briefly managed to get above its 50-day moving average on Monday, suggesting that the relentless downward trend was over — but the index failed to stay there, thanks in large part to Apple.”

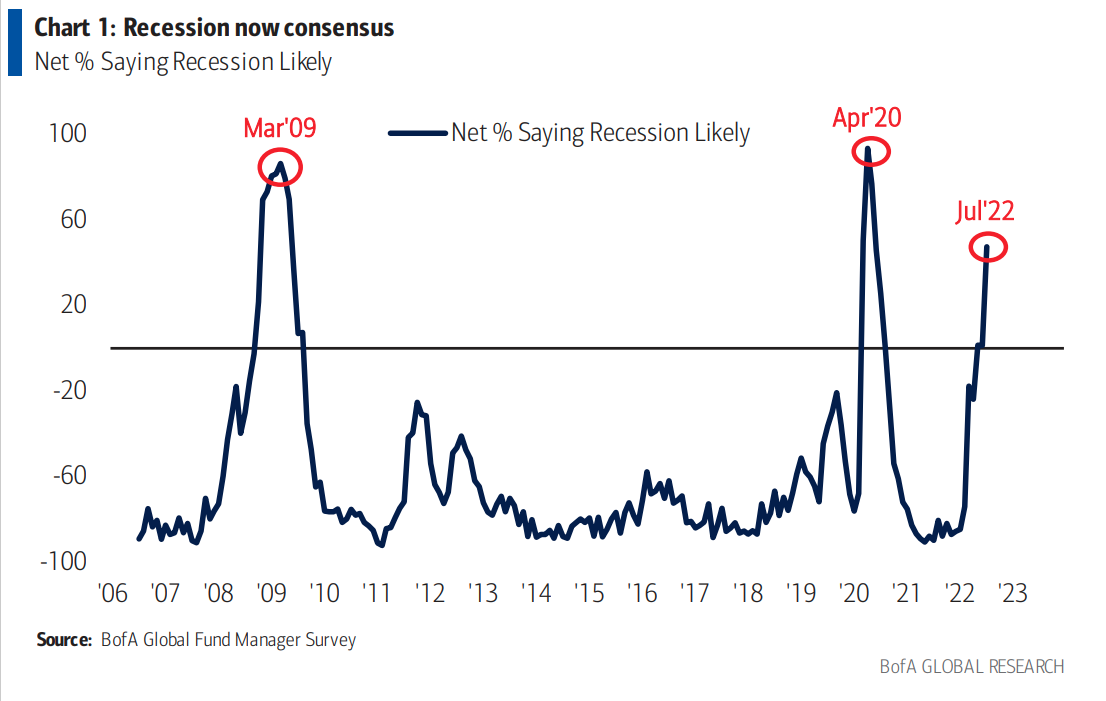
Pessimism is incredibly strong among investors, however, a sort-of contrarian signal.

In spite of some Bank of America Corporation (NYSE: BAC) indicators pointing to poor fundamentals, sentiment is suggestive of a looming “stocks/credit rally in coming weeks.”

Graphic: Retrieved from Bloomberg. “Investors slashed their exposure to risk assets to levels not seen even during the global financial crisis in a sign of full capitulation amid a “dire” economic outlook, according to Bank of America Corp.’s monthly fund manager survey.”

Positioning

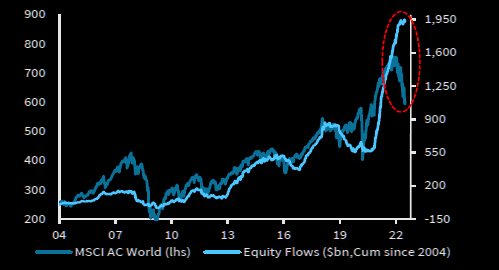
Though we’re far more than halfway through a dot-com type collapse that’s happened “underneath the surface of the indices,” per Simplify Asset Management’s Mike Green, still-strong passive flows continue to support the largest stocks within the indexes.

Graphic: Retrieved from The Market Ear. Via Barclays PLC (NYSE: BCS).

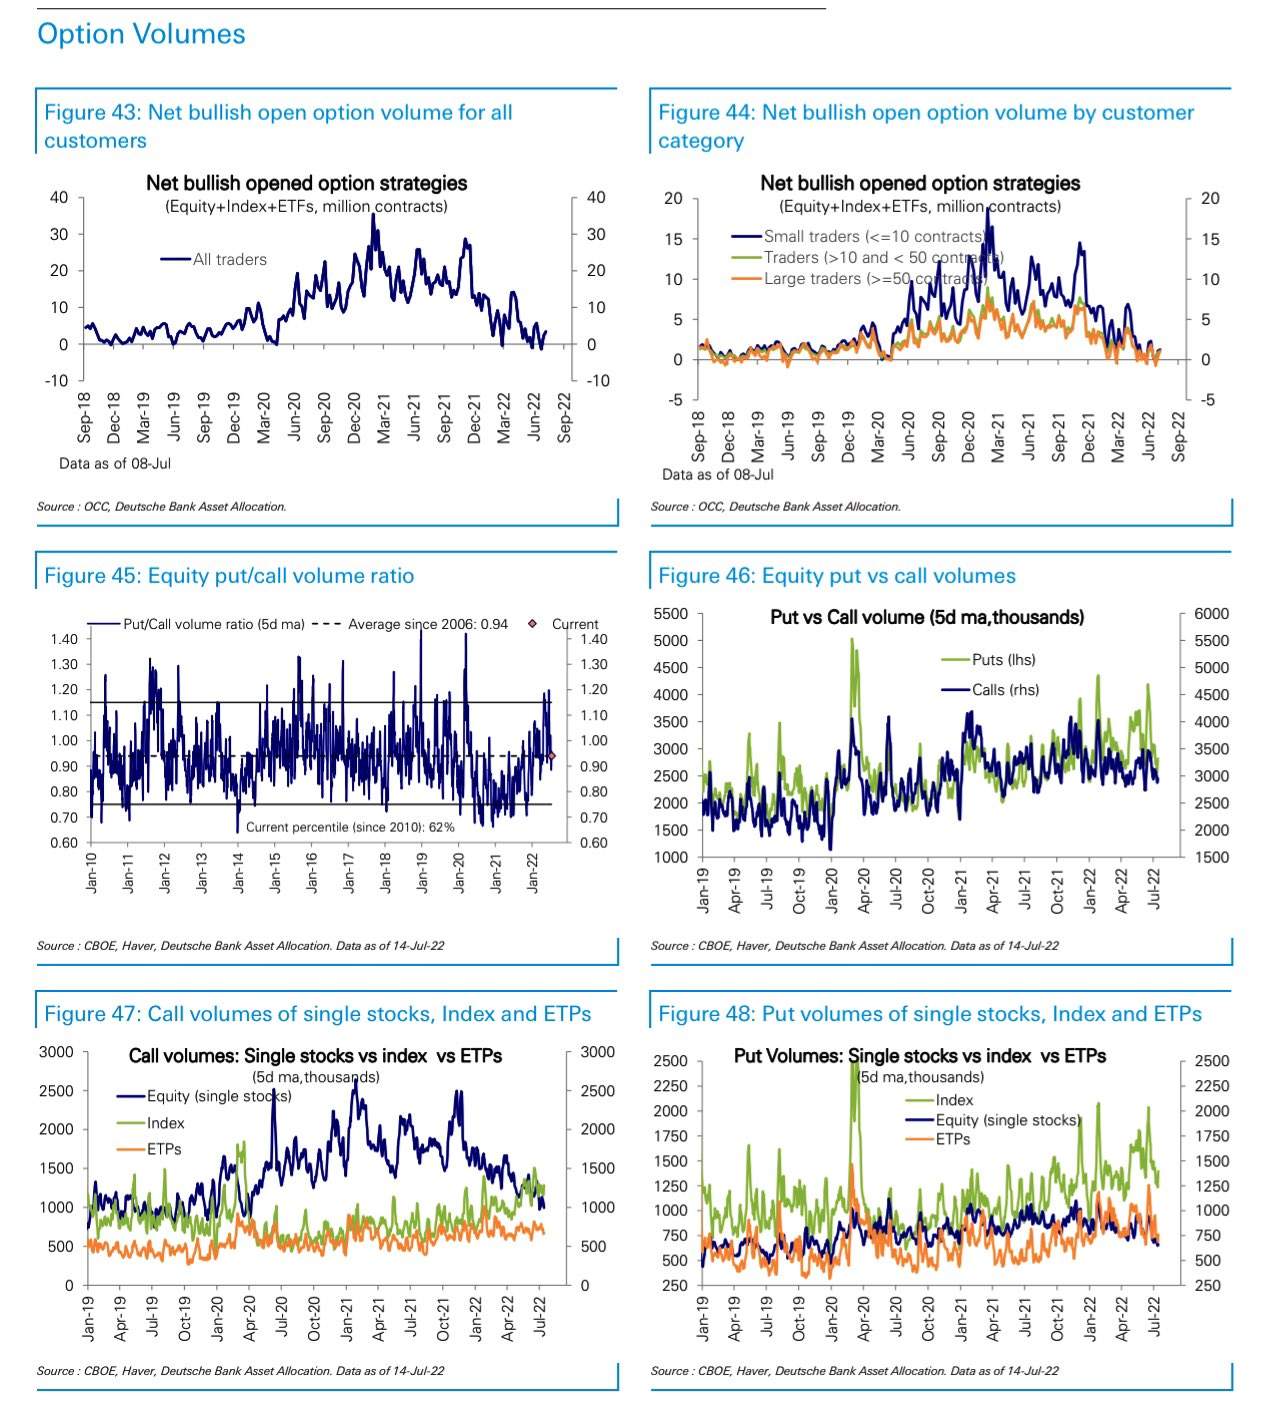
At the same time, options volumes show traders concentrating less on bullish strategies in the single stocks, while the index flows remain steady.

Graphic: Via Deutsche Bank AG (NYSE: DB).

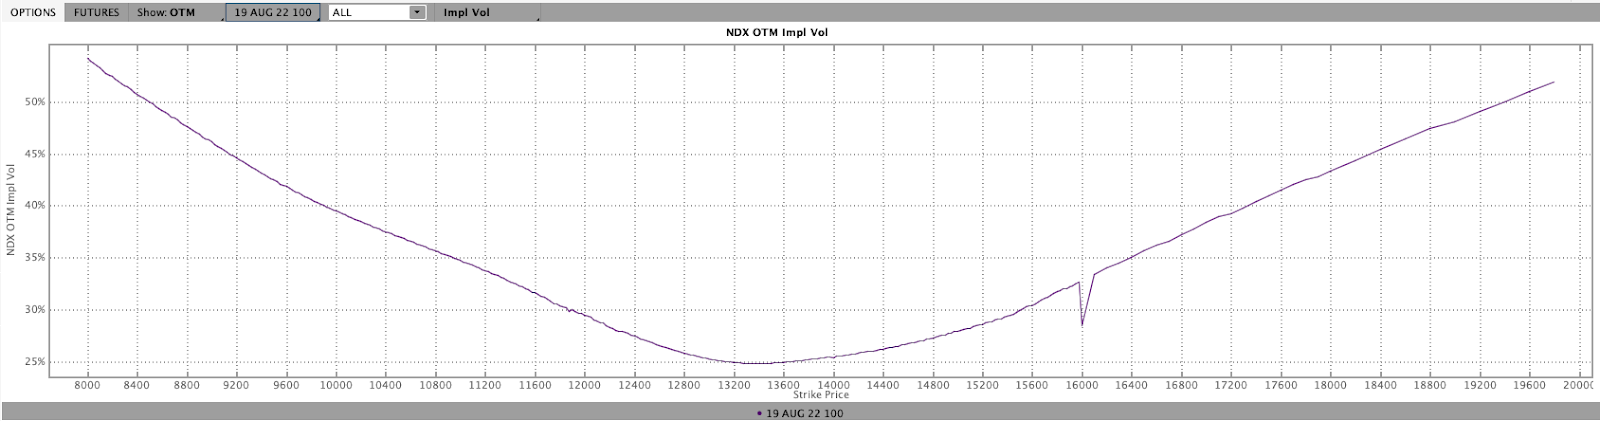
Looking at skew on something like the tech- and growth-heavy Nasdaq 100 (INDEX: NDX), our comments in prior letters (regarding volatility supply from the re-hedging of defensive structures on the put side and volatility demand on the call side from the positioning for a reversal) appear still valid.

Read: Daily Brief for July 15, 2022.

Therefore, spread opportunities still exist and remain attractive.

Graphic: Via Charles Schwab Corporation-owned (NYSE: SCHW) TD Ameritrade’s Thinkorswim. Skew resembles more of a smile, rather than a smirk.

Read: Trading Volatility, Correlation, Term Structure and Skew by Colin Bennett.

Technical

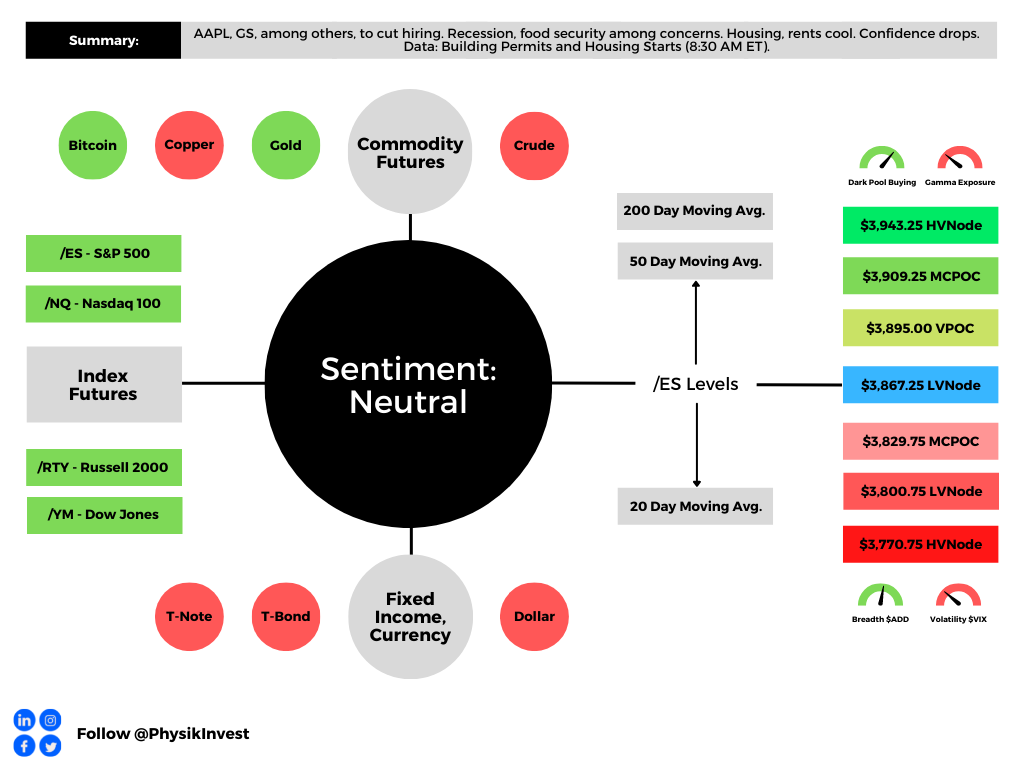
As of 6:45 AM ET, Tuesday’s regular session (9:30 AM – 4:00 PM ET), in the S&P 500, is likely to open in the upper part of a positively skewed overnight inventory, inside of prior-range and -value, suggesting a limited potential for immediate directional opportunity.

In the best case, the S&P 500 trades higher.

Any activity above the $3,867.25 LVNode puts into play the $3,895.00 VPOC. Initiative trade beyond the VPOC could reach as high as the $3,909.25 MCPOC and $3,943.25 HVNode, or higher.

In the worst case, the S&P 500 trades lower.

Any activity below the $3,867.25 LVNode puts into play the $3,829.75 MCPOC. Initiative trade beyond the MCPOC could reach as low as the $3,800.75 LVNode and $3,770.75 HVNode, or lower.

Click here to load today’s key levels into the web-based TradingView charting platform. Note that all levels are derived using the 65-minute timeframe. New links are produced, daily.
Graphic: 65-minute profile chart of the Micro E-mini S&P 500 Futures.

Considerations: Responsiveness near key-technical areas (that are discernable visually on a chart), suggests technically-driven traders with short time horizons are very active. 

Such traders often lack the wherewithal to defend retests and, additionally, the type of trade may be indicative of the other time frame participants waiting for more information to initiate trades.

Definitions

Volume Areas: A structurally sound market will build on areas of high volume (HVNodes). Should the market trend for long periods of time, it will lack sound structure, identified as low volume areas (LVNodes). LVNodes denote directional conviction and ought to offer support on any test. 

If participants were to auction and find acceptance into areas of prior low volume (LVNodes), then future discovery ought to be volatile and quick as participants look to HVNodes for favorable entry or exit.

POCs: POCs are valuable as they denote areas where two-sided trade was most prevalent in a prior day session. Participants will respond to future tests of value as they offer favorable entry and exit.

MCPOCs: POCs are valuable as they denote areas where two-sided trade was most prevalent over numerous day sessions. Participants will respond to future tests of value as they offer favorable entry and exit.

Volume-Weighted Average Prices (VWAPs): A metric highly regarded by chief investment officers, among other participants, for quality of trade. Additionally, liquidity algorithms are benchmarked and programmed to buy and sell around VWAPs.

About

After years of self-education, strategy development, mentorship, and trial-and-error, Renato Leonard Capelj began trading full-time and founded Physik Invest to detail his methods, research, and performance in the markets.

Capelj also develops insights around impactful options market dynamics at SpotGamma and is a Benzinga reporter.

Some of his works include conversations with ARK Invest’s Catherine Wood, investors Kevin O’Leary and John Chambers, FTX’s Sam Bankman-Fried, former Bridgewater Associate Andy Constan, Kai Volatility’s Cem Karsan, The Ambrus Group’s Kris Sidial, among many others.

Disclaimer

In no way should the materials herein be construed as advice. Derivatives carry a substantial risk of loss. All content is for informational purposes only.

Categories
Commentary

Weekly Brief For April 18, 2021

Happy Sunday! Though markets were relatively choppy, they ended higher last week. This came at a time of heightened public attention to the market.

The following commentary on U.S. broad market equity indices will discuss what happened, why it matters, what to expect, and how participants can position themselves for the coming week.

But first, here’s a quote from Sterling professor of economics at Yale, Robert J. Shiller:

“The current widespread fascination with the rising market accompanied by recent concern about a possible downward spiral and strained stock market valuations echo those of 100 years ago.”

Market Commentary

What Happened: The S&P 500, Nasdaq-100, and Dow Jones Industrial Average made new all-time highs before closing the week out with an attempt to balance and validate newly discovered prices.

  • Data suggests economic outlook improving.
  • Earnings pick up, add to clarity on recovery.
  • Risk, reward poor for new entries. Be picky.

Why It Matters: The price rise in U.S. broad market equity indices comes as the economic recovery from the COVID-19 coronavirus pandemic accelerated.

According to S&P Global, the recovery’s acceleration warranted a revision in the firm’s 2021 global GDP growth forecast to 5.5%, a 50 basis point change.

At the same time, it’s S&P’s belief that U.S. inflation fears are overblown. Traders began to price in that realization, last week. 

After a slew of economic releases, yields pulled back dramatically.

In a Bloomberg article, Barclays strategists, including Anshul Pradhan, noted a raising of the bar on reflation; the drop in yields “reflects the fact that expectations for growth, inflation and the hiking cycle have all been significantly revised higher.”

Further, participants saw the CBOE Volatility Index (INDEX: VIX), a measure of the stock market’s expectation of volatility based on S&P 500 (INDEX: SPX) options, continue a multi-week drop attracting the participation of systemic strategies and opportunistic hedging, as noted last week.

It is important to note that this most recent rally in equity indices, which coincides with a historically bullish period, came soon after Archegos Capital’s default on margin calls which triggered a fire sale by several big Wall Street banks.

SpotGamma, a source for actionable insights based on activity in the options market, in a commentary, attempted to unpack the narrative which suggests the mechanical bid across the broad market is tied to a “tangled web of counterparty risk and hedging,” among other factors.

Moving beyond speculations, a couple of things are true and must be accounted for in our narrative.

First, equity market inflows, over the past 5 months, exceeded inflows of the prior 12 years, total. Second, as the April monthly options expiration (OPEX) passes and the positioning of participants changes, the risks of a near-term pullback have increased substantially. 

Despite the stock market trading in a historically bullish period, as well as declining volatility attracting the participation of systematic strategies, increased put selling, and the like, downside protection is trading cheap relative to its upside counterpart.

Option Expiration (OPEX): Option expiries mark an end to pinning (i.e, the theory that market makers and institutions short options move stocks to the point where the greatest dollar value of contracts will expire worthless) and the reduction dealer gamma exposure.

Should the market turn and customers demand downside protection in an increasing fashion, dealers’ risk exposure to direction and volatility will cause violent crash dynamics to transpire.

An example of this is last year’s sell-off.

In a discussion on rising delta and volatility forcing dealers to sell into weakness to hedge a rapid move in prices, Kris Sidial, a former institutional trader and the co-chief investment officer of The Ambrus Group, a volatility arbitrage fund that looks to exploit changing market structure dynamics, said: “You have this dynamic in the derivatives market where there is a gamma squeeze when people are buying way far out-of-the-money [options], and dealers reflexively have to hedge off their risk,” Sidial said.

Graphic: SqueezeMetrics highlights implications of volatility, direction, and moneyness.

Putting it all together, despite markets being in a position to move higher, should there be a turn and spike in volatility, participants must be ready to accept the possibility of a violent liquidation.

As Market Ear puts it, hedge when you can, not when you must.

What To Expect: An increased potential to correct in time and price.

In addition, metrics, like DIX, market liquidity, and speculative derivatives activity, confirm participants’ bullishness and opportunistic hedging ahead of an acceleration in the global restart and a turn in flows, the result of consumers shifting their preferences from saving and investing to spending.

Graphic: Physik Invest maps out the purchase of call and put options in the SPDR S&P 500 ETF Trust (NYSE: SPY), for the week ending April 16. Activity in the options market was primarily concentrated in short-dated tenors, in strikes as low as $364, which corresponds with $3,640 in the cash-settled S&P 500 Index (INDEX: SPX).
Graphic: SHIFT search suggests participants are not as inclined to add call-side exposure, through the month of May, in the SPDR S&P 500 ETF Trust (NYSE: SPY).

What To Do: In the coming sessions, participants will want to pay attention to where the S&P 500 trades in relation to Friday’s open-high-low-close (OHLC). 

Any activity above Friday’s regular trade-low suggests participants are not yet done discovering higher prices. Trading below Friday’s low suggests an inclination by participants to (1) form a consolidation area that denotes acceptance of higher prices or (2) revert to the mean and repair some of the poor structure left behind prior discovery. 

It is important to take note of the minimal excess and cluster of price extensions at $4,200.00, a typical price target based on Fibonacci principles.

Excess: A proper end to price discovery; the market travels too far while advertising prices. Responsive, other-timeframe (OTF) participants aggressively enter the market, leaving tails or gaps which denote unfair prices.

So, in the best case, the S&P 500 makes an attempt to balance or discover prices as high as $4,200.00. In the worst case, participants look to auction the S&P 500 into prior poor structures and low-volume areas (LVNodes) that ought to offer little-to-no support.

More On Volume Areas: A structurally sound market will build on past areas of high-volume (HVNode). Should the market trend for long periods of time, it will lack sound structure (identified as a low-volume area (LVNode) which denotes directional conviction and ought to offer support on any test). 

If participants were to auction and find acceptance into areas of prior low-volume, then future discovery ought to be volatile and quick as participants look to areas of high volume for favorable entry or exit.
Graphic: 4-hour profile chart of the Micro E-mini S&P 500 Futures.

News And Analysis

Economy | Housing starts reach the highest level since 2006. (MND)

Recovery | U.S. is unlikely to ‘just cancel’ J&J COVID-19 shots. (BBG)

Markets | Citi to exit banking in 13 markets across Asia, Europe. (BBG)

Markets | Record-high systemic leverage is pressuring rates. (Moody’s)

Economy | S&P Global Ratings expects global rebound to roar. (S&P)

Economy | Projections on global population, aging, urbanization. (REU)

Trade | Amazon sellers slammed with COVID-induced constraints. (S&P)

Recovery | How well COVID-19 vaccines work against variants. (AB)

Markets | SPACs boost credit at targets but carry unique risks. (Moody’s)
Markets | ‘Roaring Kitty’ adds to GME bet after exercising calls. (BBG)

What People Are Saying

Innovation And Emerging Trends

Economy | Looking at the pop culture of the original Roaring Twenties. (NYT)

Markets | Want to take your company public? Here are your options. (CB)

FinTech | Societe Generale adds first structured product on blockchain. (SG)

Exodus | Hedge funds are ready to get out of NY and move to FL. (BBG)

Trading | The answer to how much capital you should be allocating. (TT)

Venture | European venture reaches all-time high in first quarter 2021. (CB)

About

Renato founded Physik Invest after going through years of self-education, strategy development, and trial-and-error. His work reporting in the finance and technology space, interviewing leaders such as John Chambers, founder, and CEO, JC2 Ventures, Kevin O’Leary, Canadian businessman and Shark Tank host, Catherine Wood, CEO and CIO, ARK Invest, among others, afforded him the perspective and know-how very few come by.

Having worked in engineering and majored in economics, Renato is very detailed and analytical. His approach to the markets isn’t built on hope or guessing. Instead, he leverages the unique dynamics of time and volatility to efficiently act on opportunity.

 Disclaimer

At this time, Physik Invest does not manage outside capital and is not licensed. In no way should the materials herein be construed as advice. Derivatives carry a substantial risk of loss. All content is for informational purposes only.

Cover photo by eberhard grossgasteiger from Pexels.