
Editor’s Note: The Daily Brief is a free glimpse into the prevailing fundamental and technical drivers of U.S. equity market products. Join the 200+ that read this report daily, below!
What Happened
Overnight, equity index futures auctioned off recovery highs, with bonds. Most commodity products held a bid, as did measures of equity index implied volatility (IV).
Ahead is data on Jobless Claims, the Consumer Price Index (8:30 AM ET), the Federal Budget (2:00 PM ET), and Fed-speak (7:00 PM ET).
What To Expect
Fundamental: Participants have readied themselves for data on inflation.
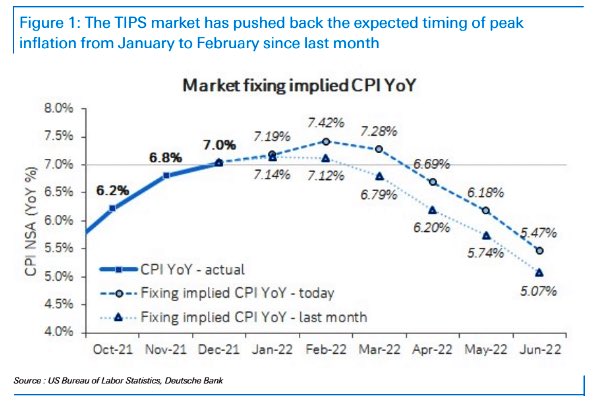
According to Nordea Bank’s (OTC: NRDBY) research, though January inflation will be higher, ultimately leading to volatility in bonds and equities, there will be a moderation in momentum.
The headline figure may print at 7.4% y/y (consensus: 7.2%) while core inflation may print 5.9% y/y (consensus: 5.9%). This is after CPI basket weights were updated and show an increased weight towards the prices that are rising the most (used cars and shelter costs).
“An above-consensus print could imply frontloading of hikes and increased speculation in a 50bp March-hike,” Nordea’s Philip Maldia Madsen and Helene Østergaard explain.
“Frontloading rate hikes support the USD, but substantial gains may require higher terminal rates pricing (more hikes priced, not just faster).”
This is as U.S. labor conditions have tightened markedly, fueling a “sell-off in the short-end of the USD curve as inflation risks remain historically high.”
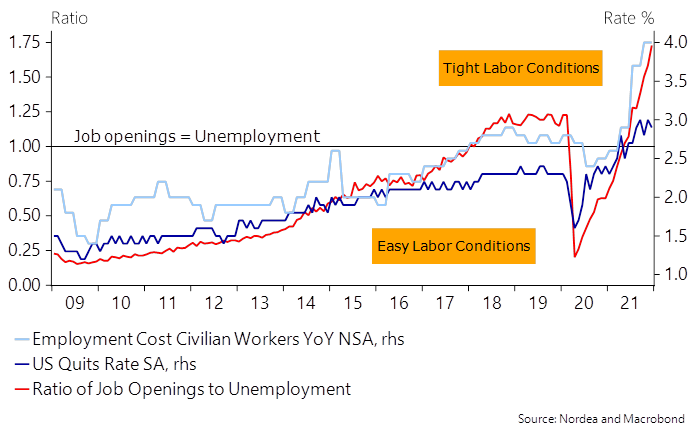
Taken together, data points to the Federal Reserve staying hawkish and a continued risk in shorter-duration bonds.
Andreas Steno Larsen of Heimstaden, who this newsletter quoted, yesterday, has explained that despite inflation printing higher in Q1, the trends will shift in Q2-Q4, given new CPI weights.
“The changes made by the BLS hence provide a net/net negative impact on inflation down the line (likely during H2-2022 already), but not before another positive tilt to inflation is seen in the very short-term.”
What is the outlook for bonds and tech? Steno Larsen suggests it is benign.
“I don’t really fear the planned QT from the Fed in that regards either,” he elaborates.
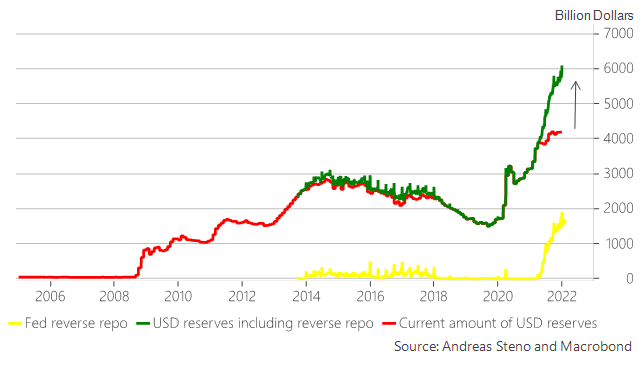
“We will not see a strong negative USD liquidity effect from QT initially as the gap between the total amount of printed USD reserves and the current amount of USD reserves available to the banking system will act as a buffer once the Fed starts bringing down the balance sheet size (QT).”
Positioning: The effects of continued volatility compression contended with demand for protection, yesterday.
In the face of a sort-of upward drift, participants legged into negative delta (-delta) trades that offered them positive exposure to the downside.
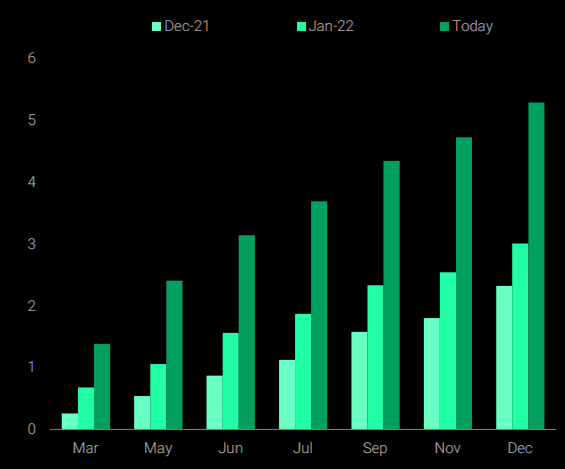
Below is a chart of SpotGamma’s (beta) Hedging Impact of Real-Time Options indicator. Notice the trend in the blue (put) and orange (call) lines. This trend denotes demand for -delta (call selling and put buying) which translates to pressure from dealers who are selling underlying (adding -delta) against their positive delta (+delta) options exposure.
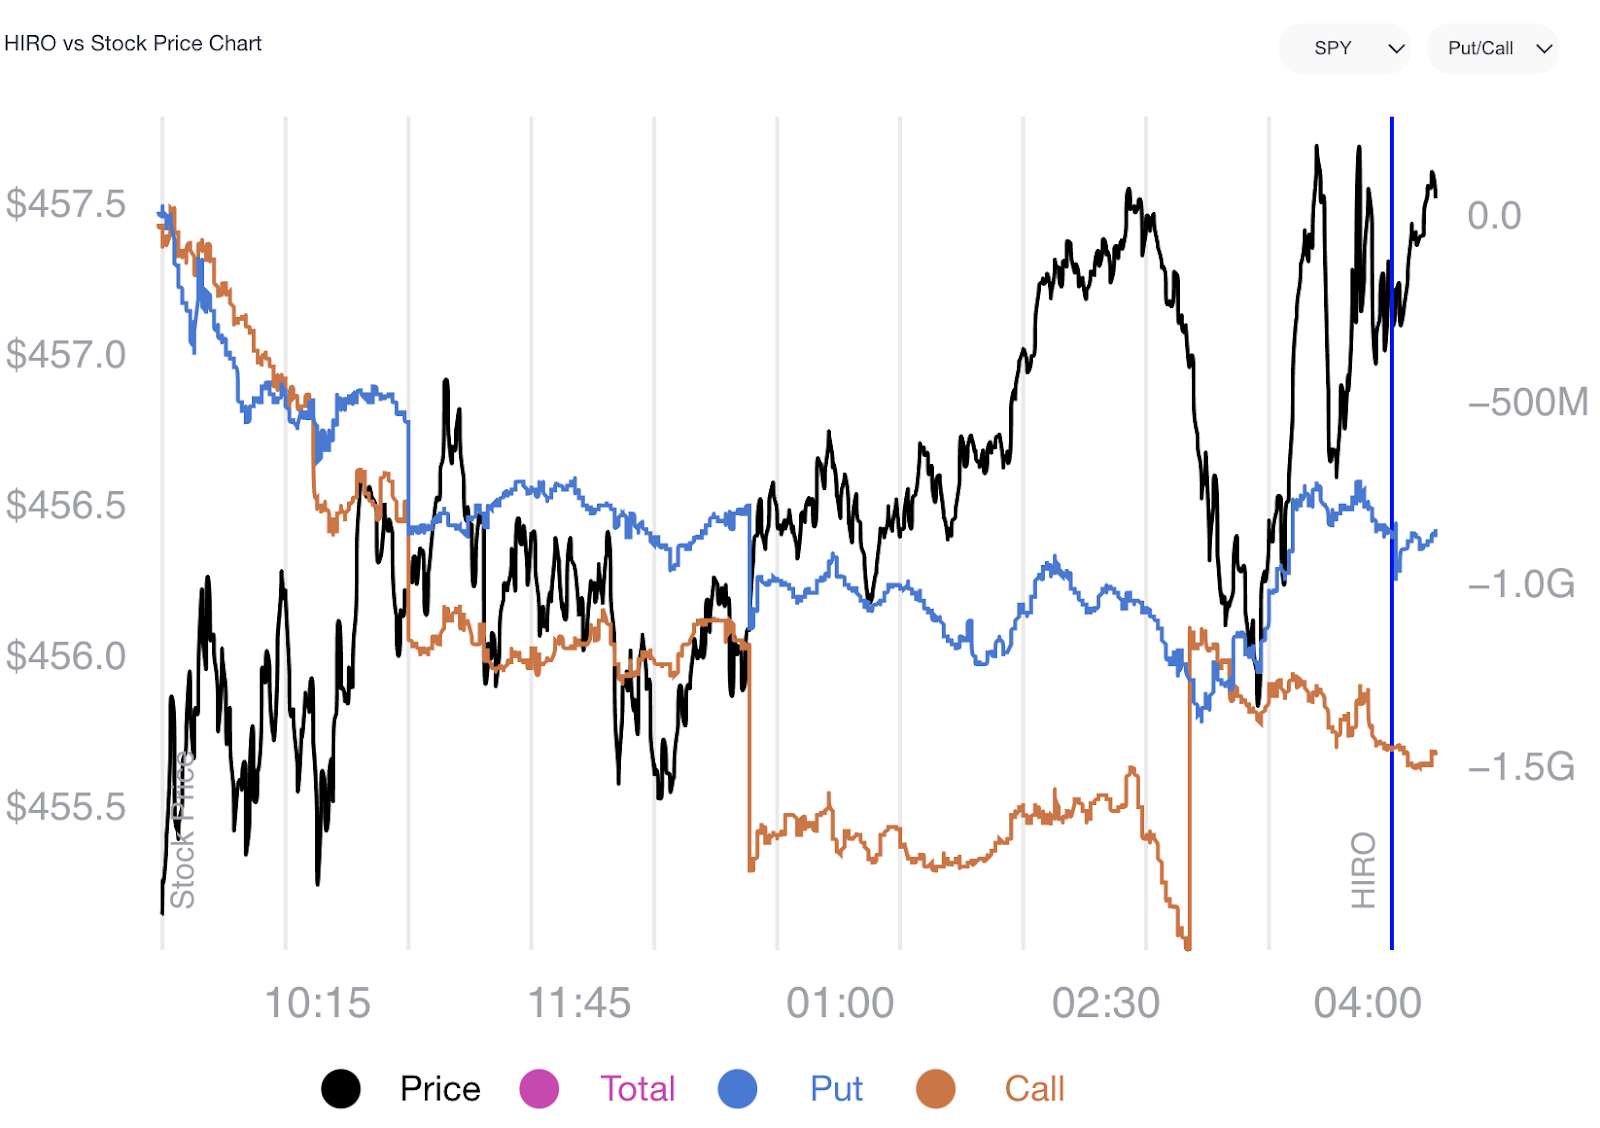
As stated, the pressure from this divergence was offset by continued compression in volatility; as time and volatility trend to zero, the supportive hedging flows with respect to time (charm) and volatility (vanna), along with “passive buying support,” took from the negative implications of customer demand for protection.
Overall, similar to yesterday, buying proxies still point to modest bullishness.
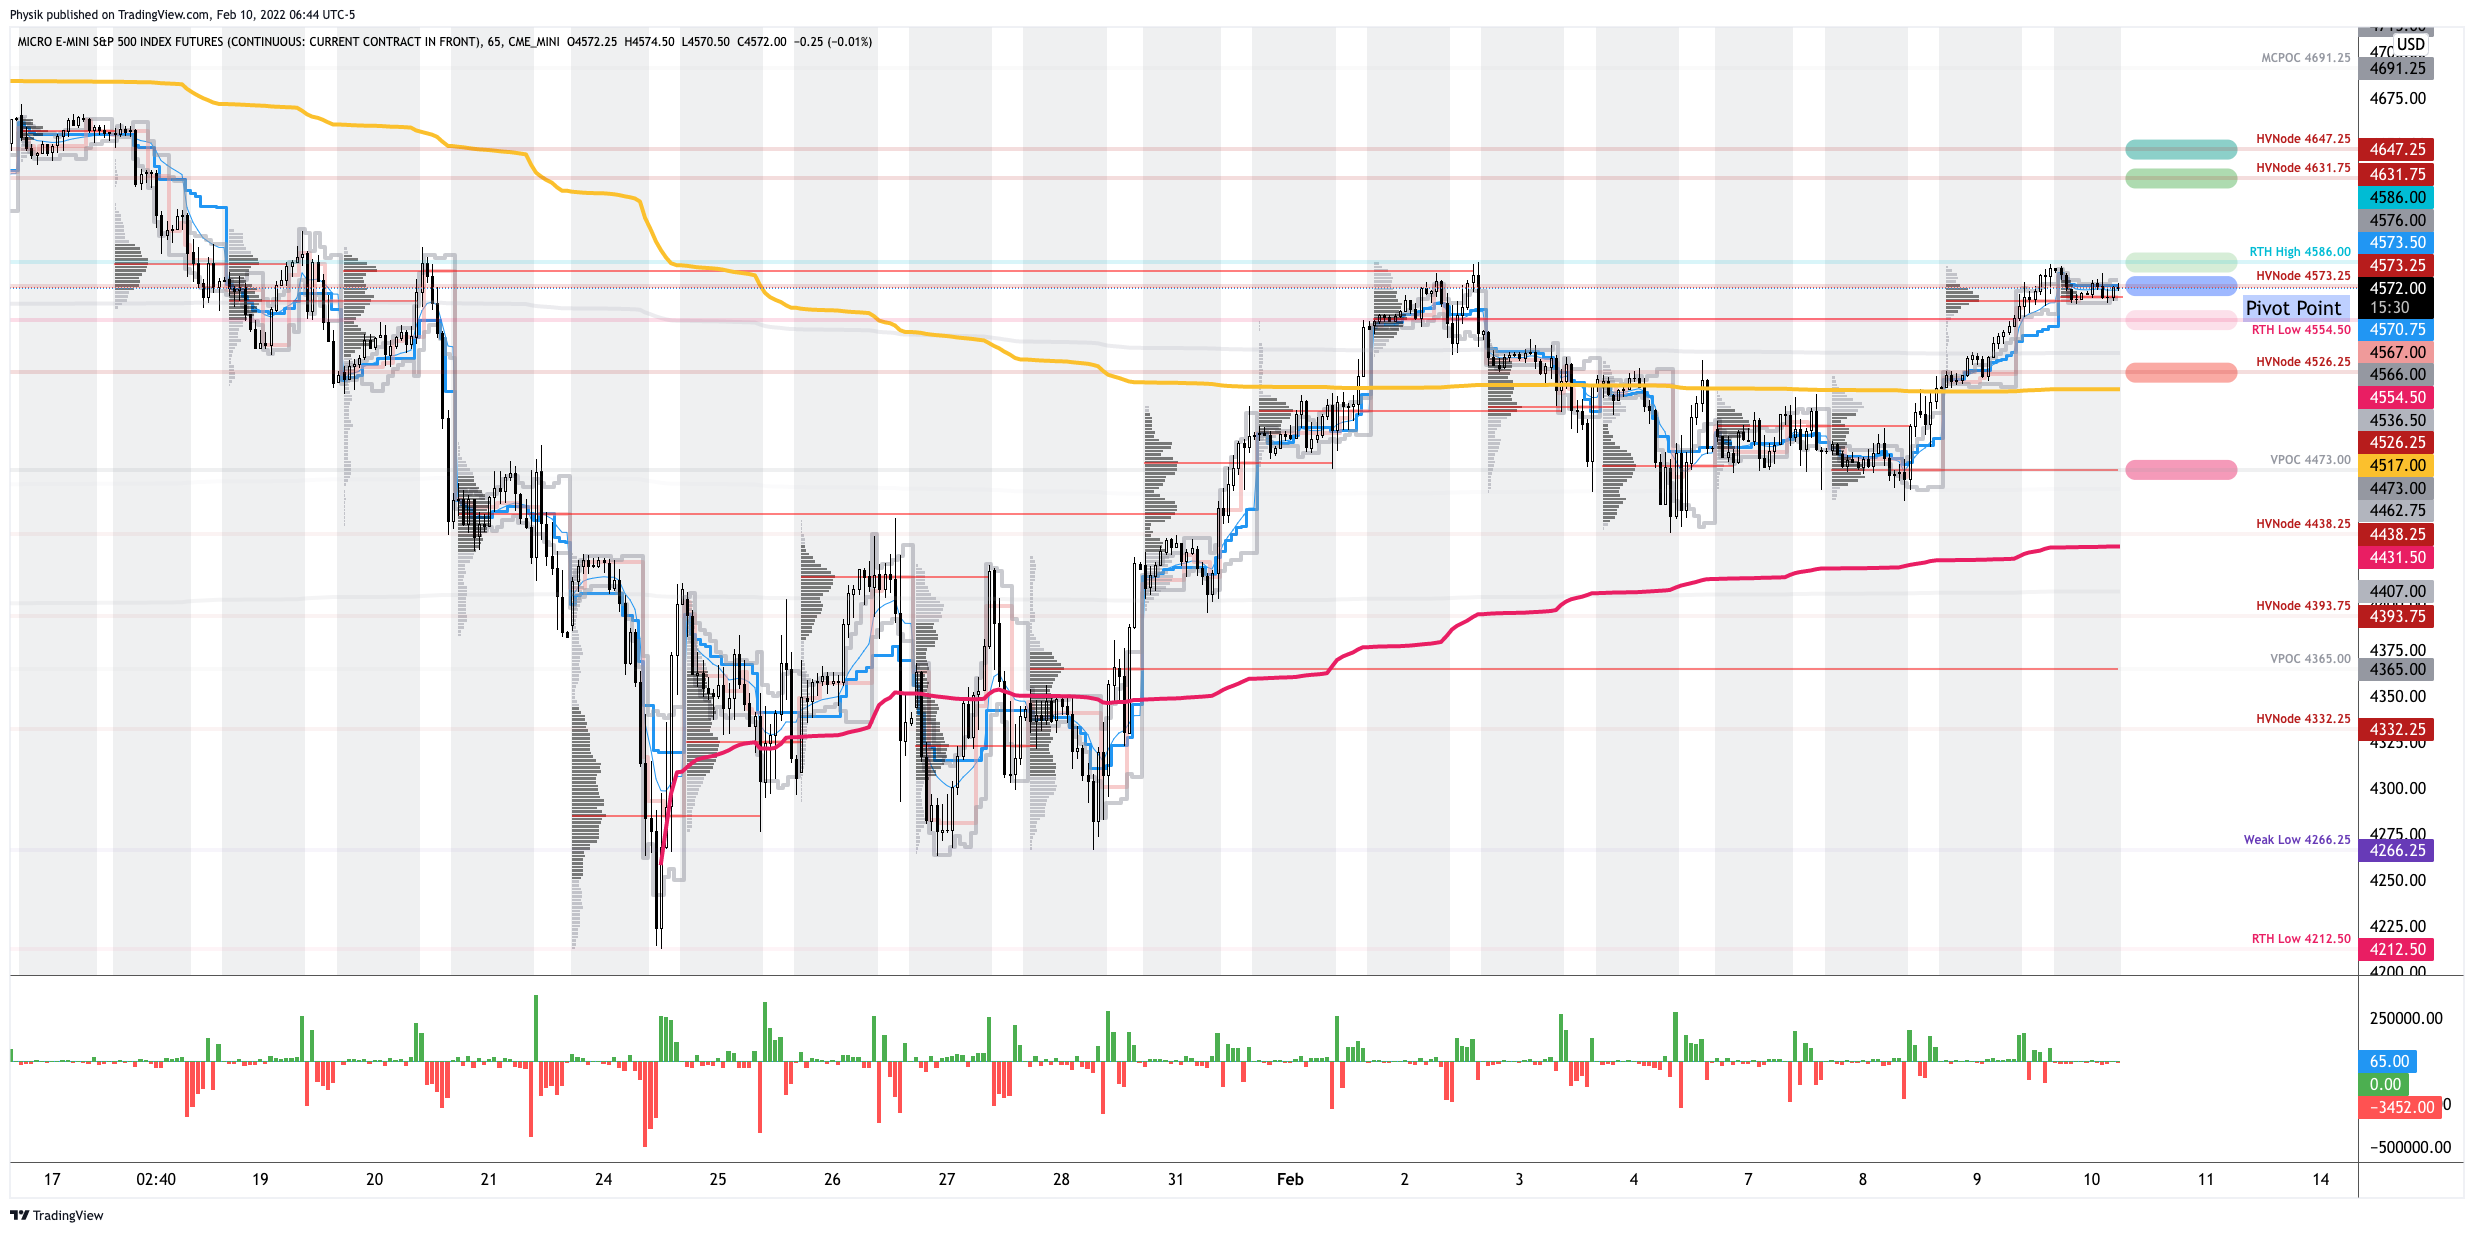
Technical: As of 6:30 AM ET, Monday’s regular session (9:30 AM – 4:00 PM ET), in the S&P 500, will likely open in the middle part of a negatively skewed overnight inventory, inside of prior-range and -value, suggesting a limited potential for immediate directional opportunity.
In the best case, the S&P 500 trades higher; activity above the $4,573.25 high volume area (HVNode) puts in play the $4,586.00 regular trade high (RTH High). Initiative trade beyond the RTH High could reach as high as the $4,631.75 and $4,647.25 HVNodes, or higher.
In the worst case, the S&P 500 trades lower; activity below the $4,573.25 HVNode puts in play the $4,554.50 RTH Low. Initiative trade beyond the RTH Low could reach as low as the $4,526.25 HVNode and $4,473.00 VPOC, or lower.
Click here to load today’s key levels into the web-based TradingView charting platform. Note that all levels are derived using the 65-minute timeframe. New links are produced, daily.
What People Are Saying
Definitions
Volume Areas: A structurally sound market will build on areas of high volume (HVNodes). Should the market trend for long periods of time, it will lack sound structure, identified as low volume areas (LVNodes). LVNodes denote directional conviction and ought to offer support on any test.
If participants were to auction and find acceptance into areas of prior low volume (LVNodes), then future discovery ought to be volatile and quick as participants look to HVNodes for favorable entry or exit.
POCs: POCs are valuable as they denote areas where two-sided trade was most prevalent in a prior day session. Participants will respond to future tests of value as they offer favorable entry and exit.
About
After years of self-education, strategy development, mentorship, and trial-and-error, Renato Leonard Capelj began trading full-time and founded Physik Invest to detail his methods, research, and performance in the markets.
Capelj is also a Benzinga finance and technology reporter interviewing the likes of Shark Tank’s Kevin O’Leary, JC2 Ventures’ John Chambers, FTX’s Sam Bankman-Fried, and ARK Invest’s Catherine Wood, as well as a SpotGamma contributor developing insights around impactful options market dynamics.
Disclaimer
Physik Invest does not carry the right to provide advice.
In no way should the materials herein be construed as advice. Derivatives carry a substantial risk of loss. All content is for informational purposes only.