The daily brief is a free glimpse into the prevailing fundamental and technical drivers of U.S. equity market products. Join the 950+ that read this report daily, below!
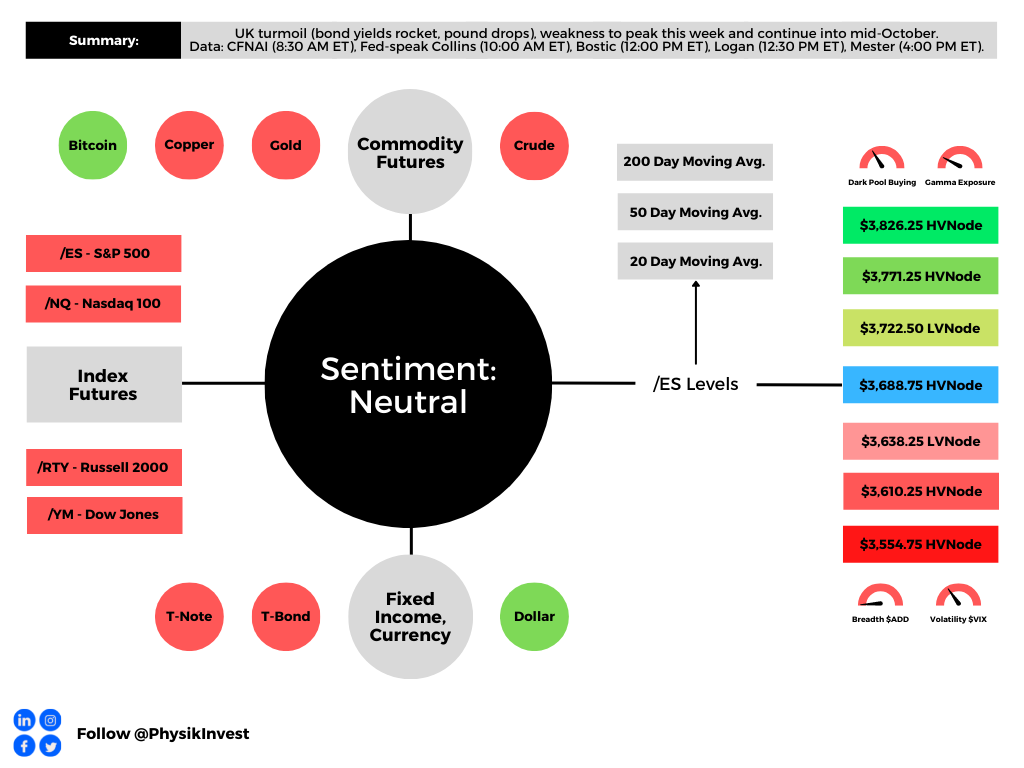
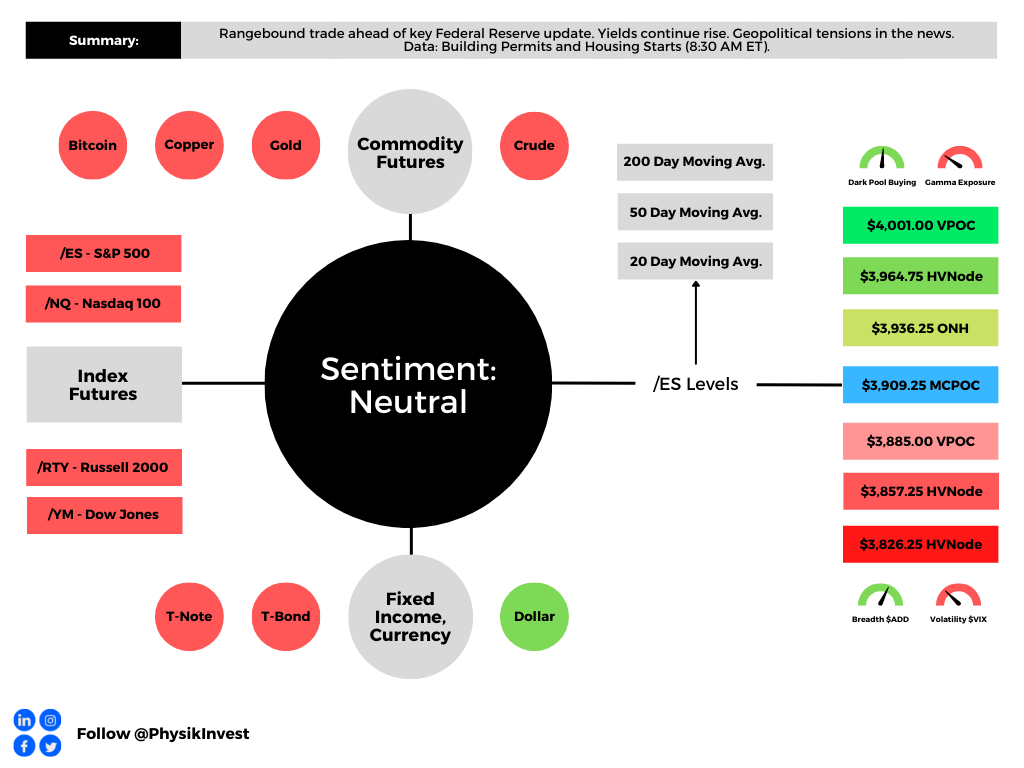
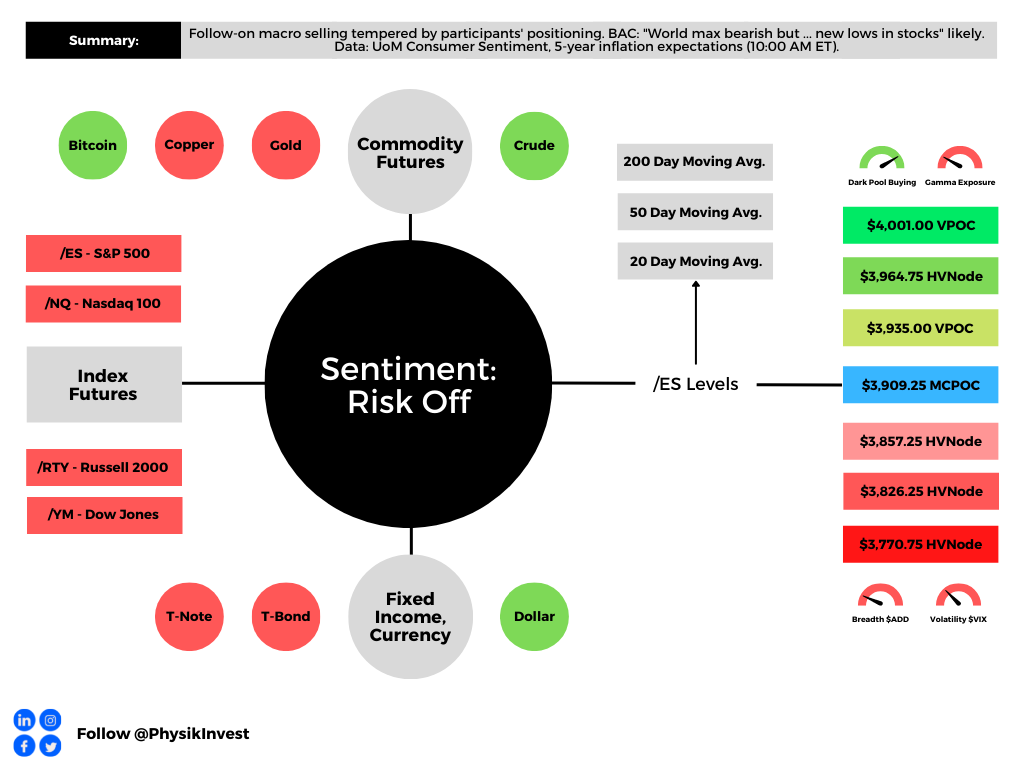
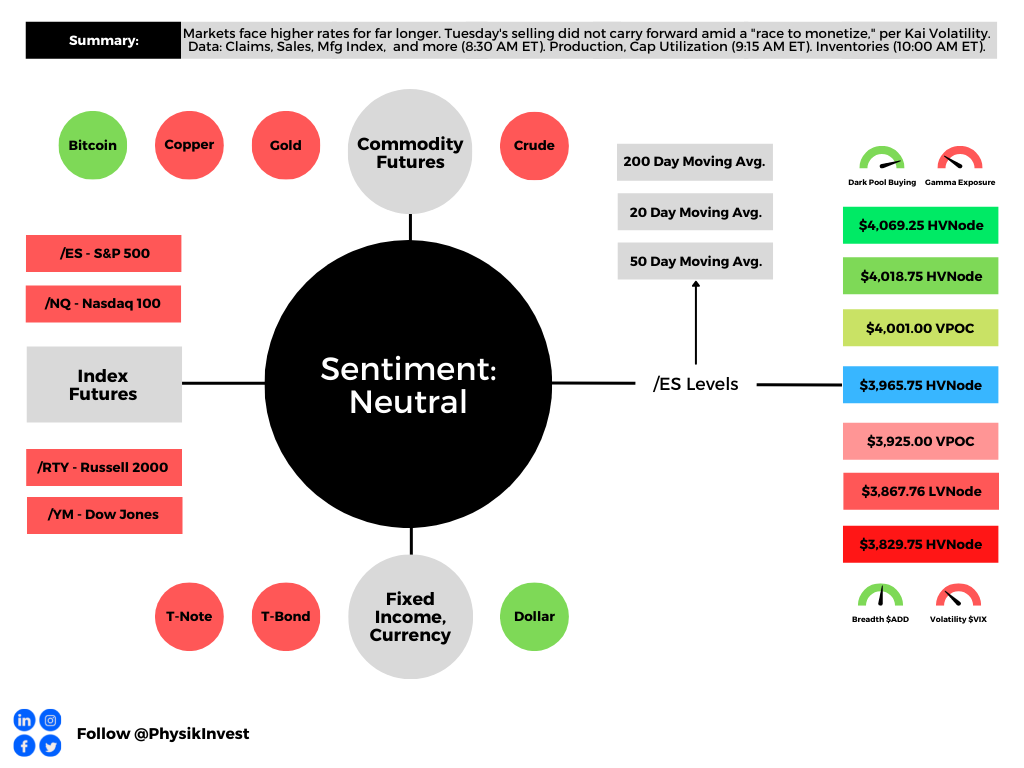
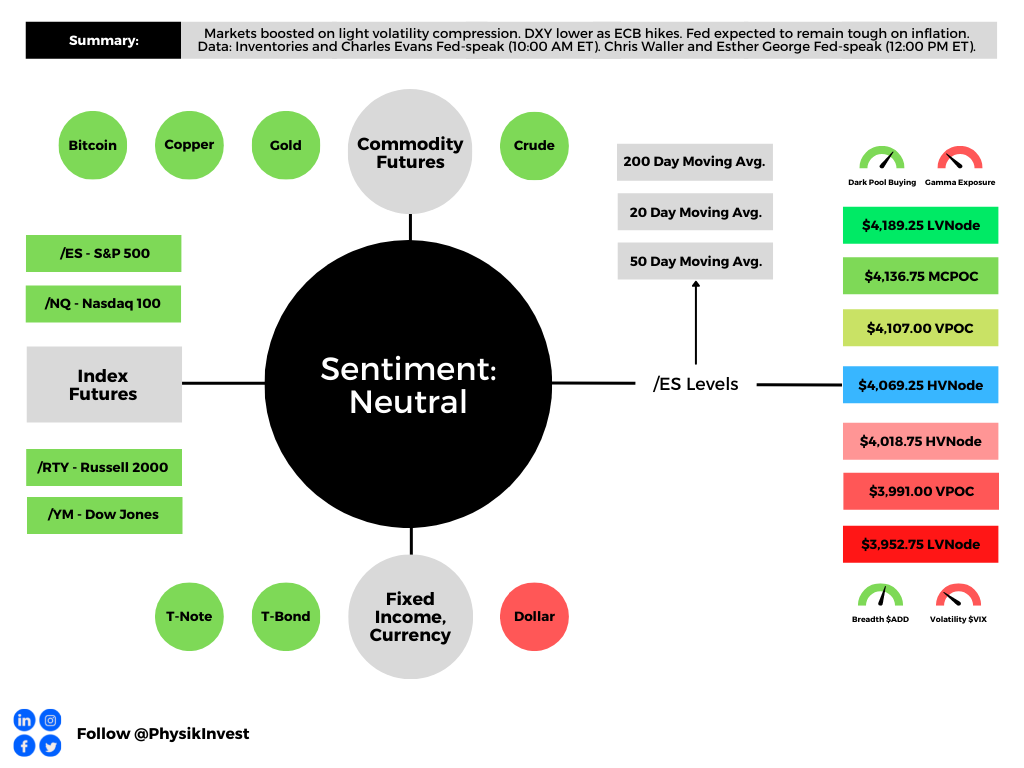
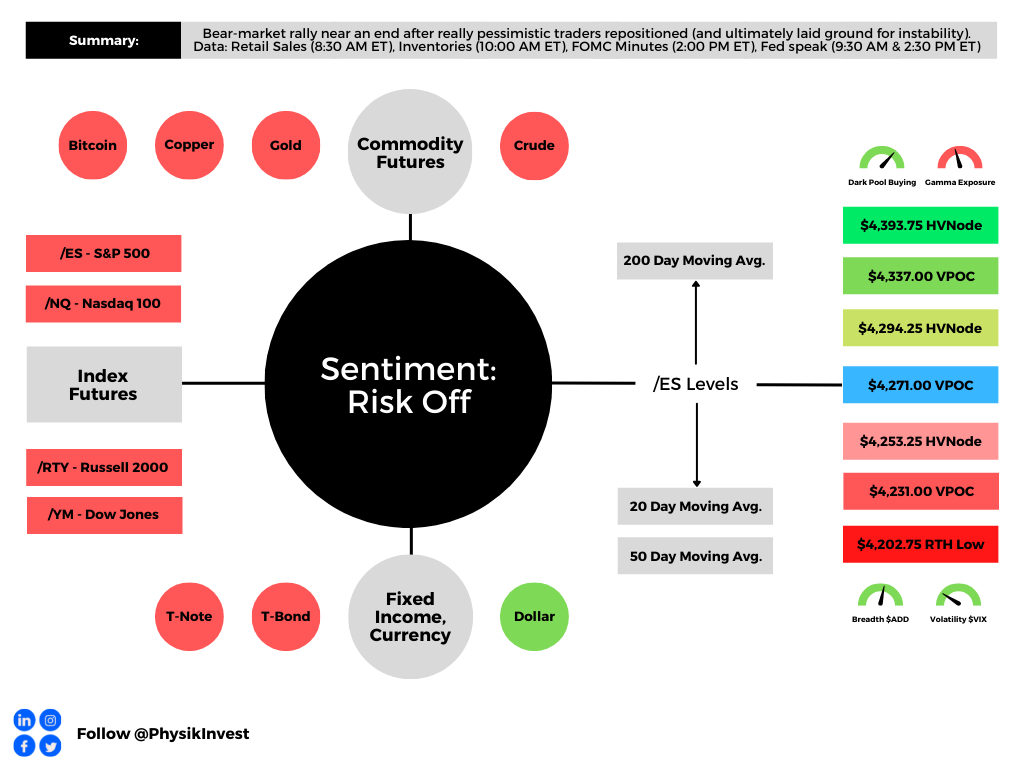
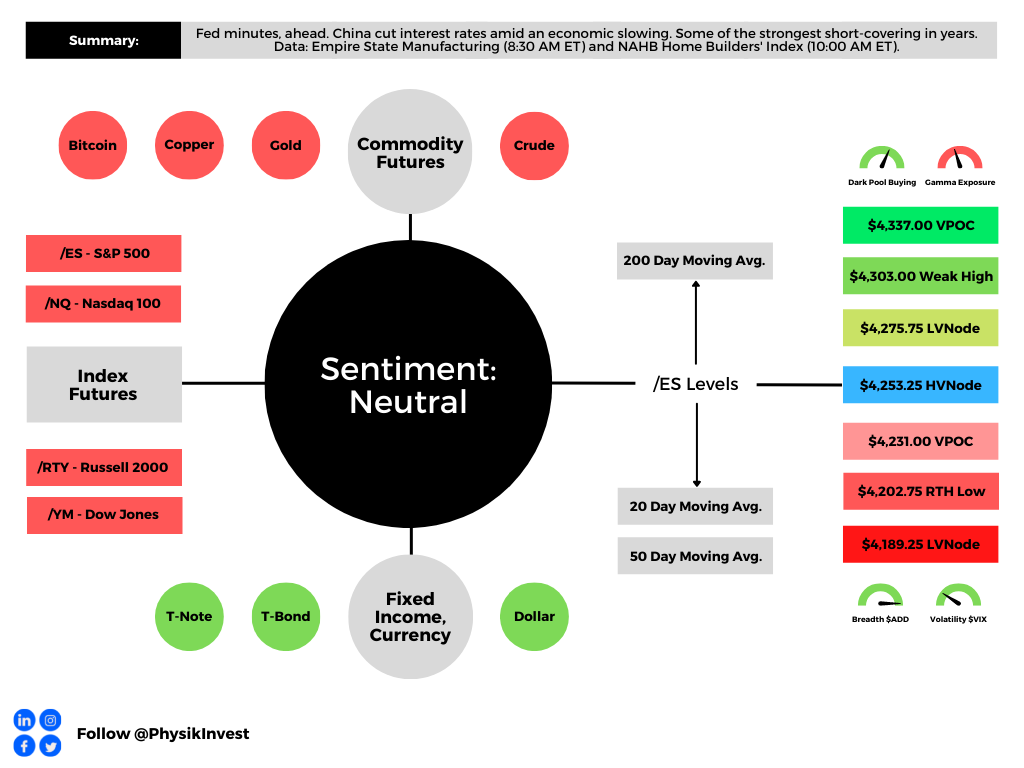
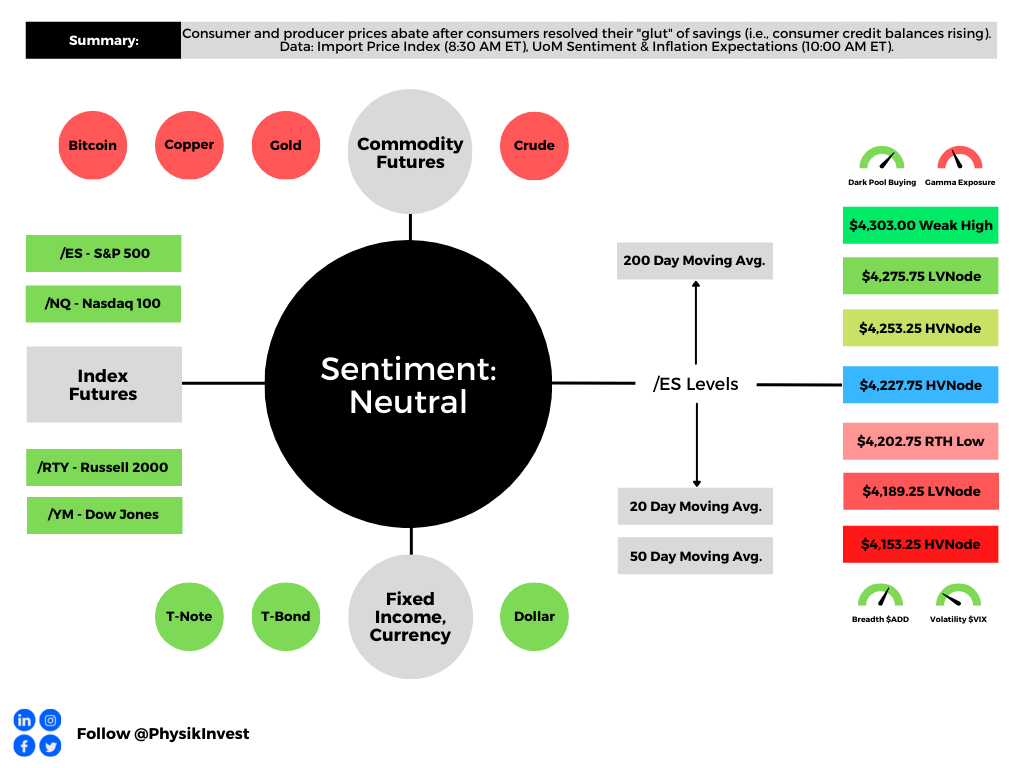
Graphic updated 8:30 AM ET. Sentiment Neutral if expected /ES open is inside of the prior day’s range. /ES levels are derived from the profile graphic at the bottom of the following section. Levels may have changed since initially quoted; click here for the latest levels. SqueezeMetrics Dark Pool Index (DIX) and Gamma (GEX) calculations are based on where the prior day’s reading falls with respect to the MAX and MIN of all occurrences available. A higher DIX is bullish. At the same time, the lower the GEX, the more (expected) volatility. Learn the implications of volatility, direction, and moneyness. Breadth reflects a reading of the prior day’s NYSE Advance/Decline indicator. VIX reflects a current reading of the CBOE Volatility Index (INDEX: VIX) from 0-100.
Fundamental
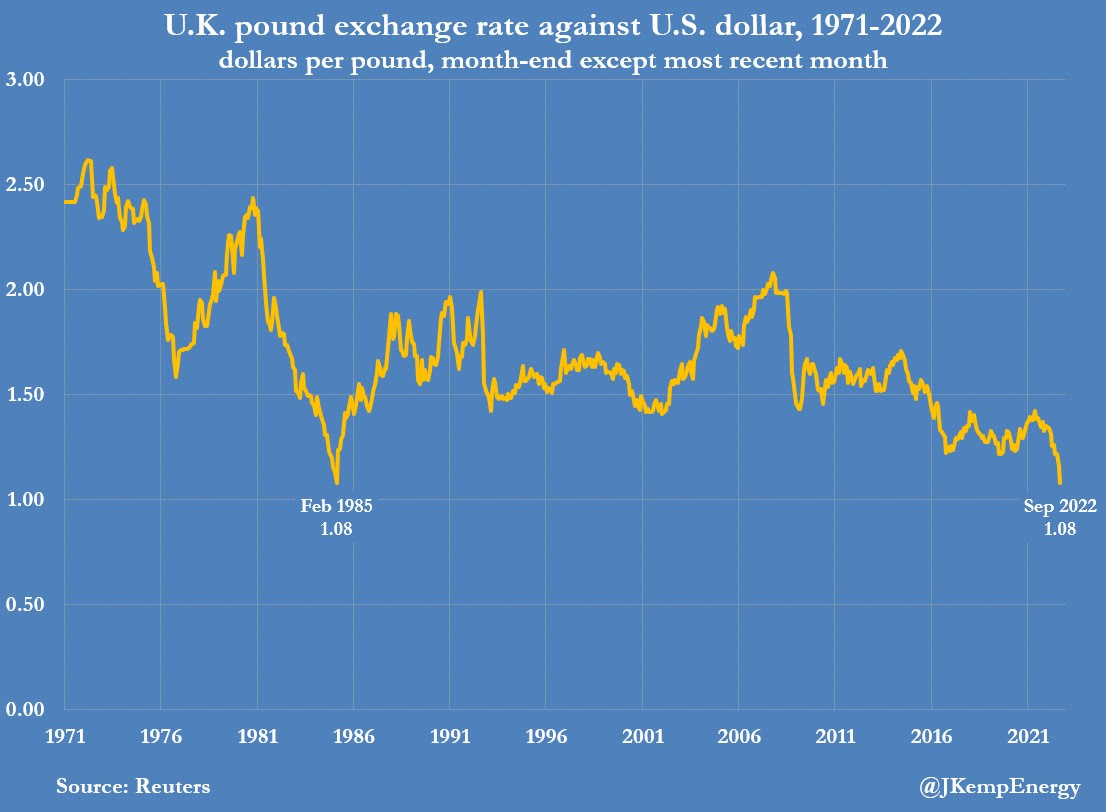
Overnight news was focused on the drop in Britain’s currency and a surge in bond yields. Per Bloomberg, the UK government’s talk about new fiscal plans and pledged tax cuts, alongside moderate interest rate hikes by the Bank of England (BoE), is the source of the weakness.
That’s because fiscal stimulus, which is part of a strategy to stoke “all-out” growth now, would add to the inflation already high and sticky from supply chokepoints and an easy-moving BoE.
Graphic: Retrieved from Reuters’ John Kemp. This action increases the UK’s competitiveness. It also increases the cost of important items in the UK, like gas for your car and electricity.
“An emergency rate hike would be a damning indictment of the government’s strategy, but it will become increasingly likely if markets fail to stabilize,” said Bloomberg economist Dan Hanson.
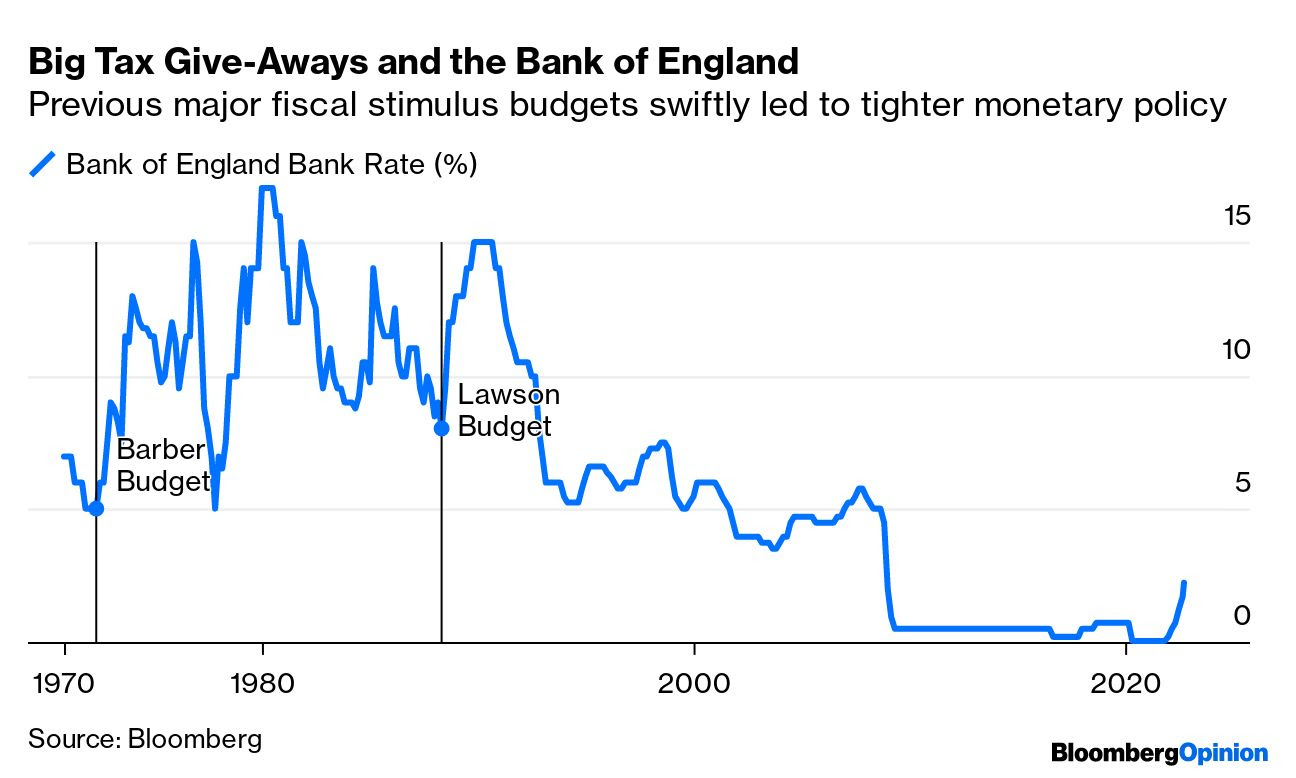
Adding, traders are pricing increased odds of rate increases (~1.75%) by the BoE’s next policy meeting in November. Looking back, in the wake of previous tax giveaways, interest rates rose by a lot to stem the inflationary shock.
Graphic: Retrieved from Bloomberg. “A combination of sharply rising bond yields and a sharply falling currency is very unusual outside emerging markets, and implies doubts over the government’s ability to service its debt.”
The weekend news, has us looking back to our letters on a “self-reinforcing ‘dollar doom loop,’” as Jon Turek of JST Advisors once put forth. It’s the case that the dominant currency for carry, due to easy monetary policies, was the dollar.
However, “the stronger the dollar gets in comparison, the less tenable it becomes as a global reserve,” and this puts pressure on the longer-term trajectory of the currency.
Knowing that US market liquidity, as well as the dollar’s strong role as a reserve, put the S&P 500 at the center of global carry regimes, an unwinding of carry may compound a market fall affecting nearly all risk assets.
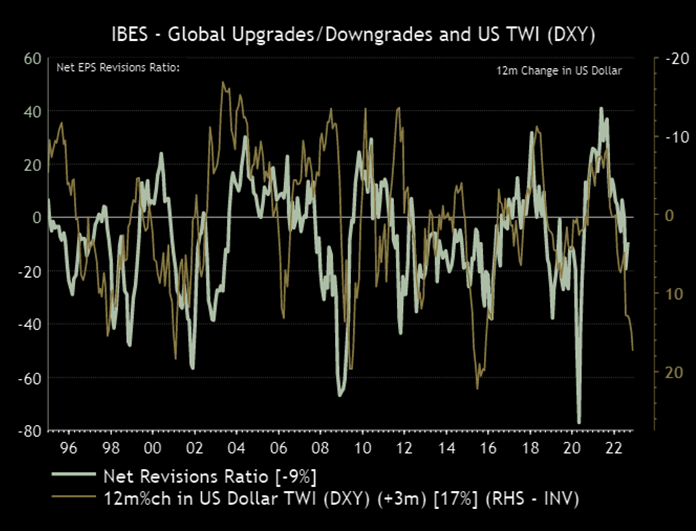
Graphic: Retrieved from Ian Harnett of Absolute Strategy Research. Via The Market Ear.
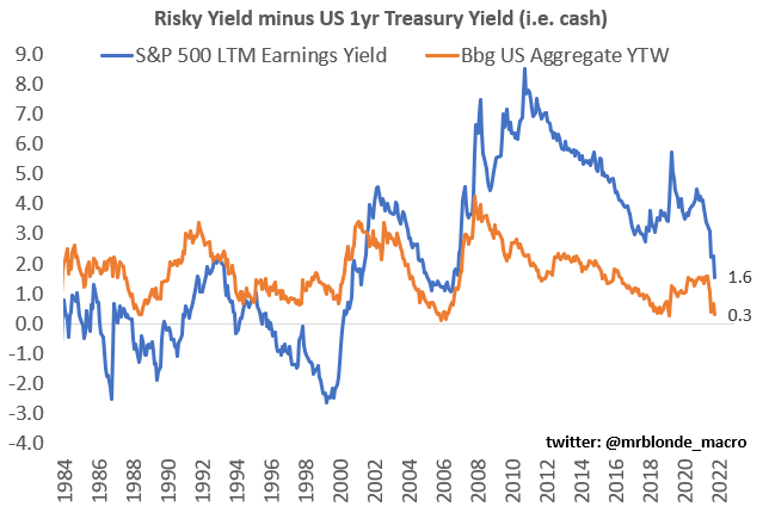
Accordingly, as put forth in Mr. Blonde’s letter, “[e]ven if you are optimistic about growth and the ability of [the] global economy to digest significant financial conditions tightening, you no longer need to be 100% invested in risky, less liquid, assets when you get a competitive return from risk-free cash.”
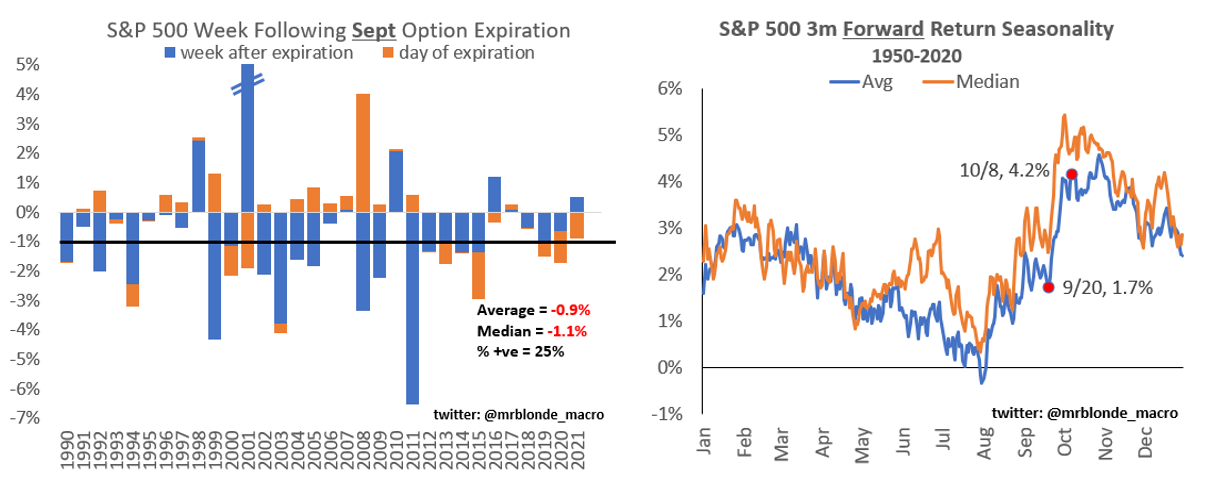
Following the September options expiration (OPEX), markets tend to have their worst week.
From thereon, the weak seasonality tends to persist for about a month, into mid-October. Given this, Kai Volatility’s Cem Karsan explained, “you need to keep selling the rallies, … [as the] war between the structural negative effects, macro flows, and positioning,” is likely to continue.
Dollar strength should feed into margin compression just now “filtering through” and impacting “international dollar-denominated debt.”
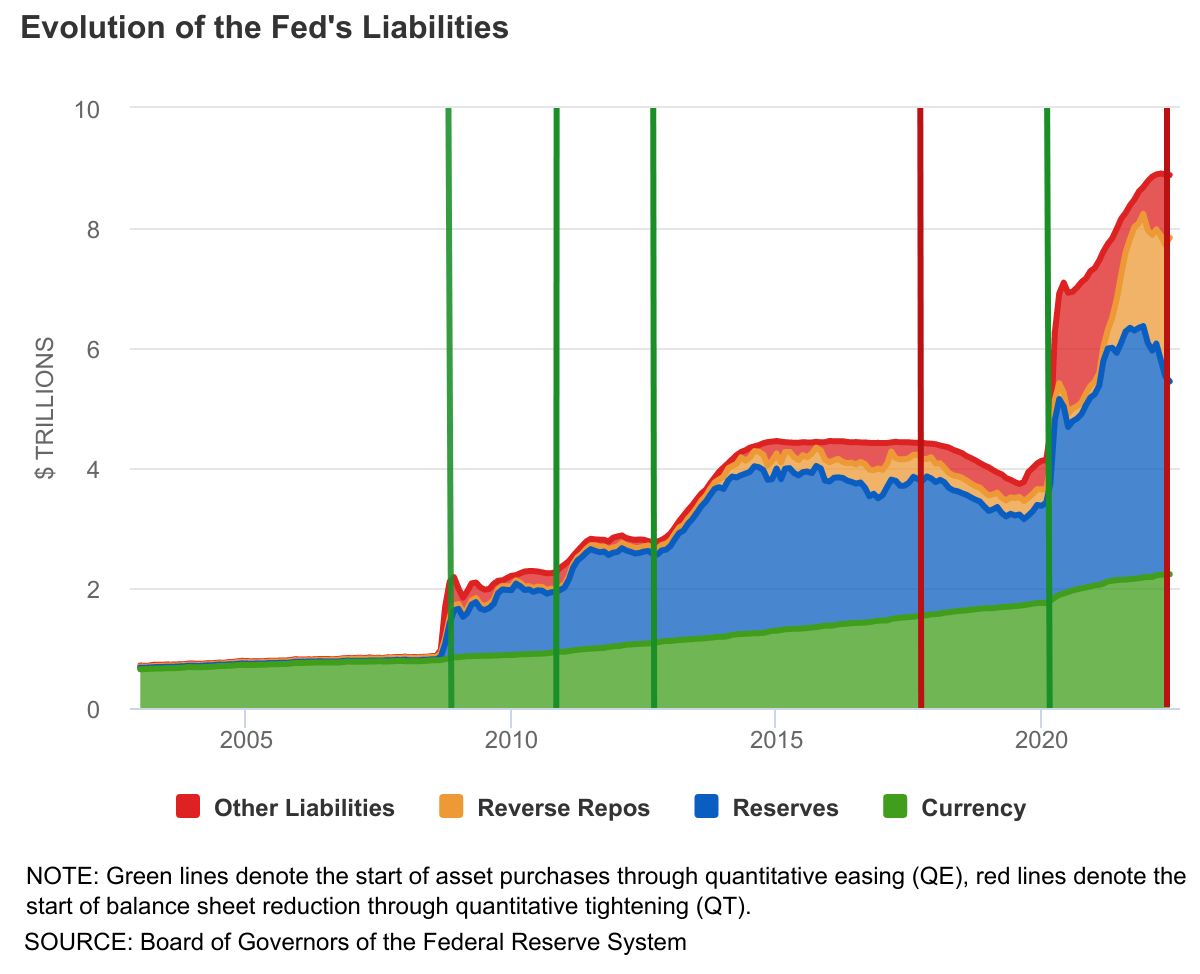
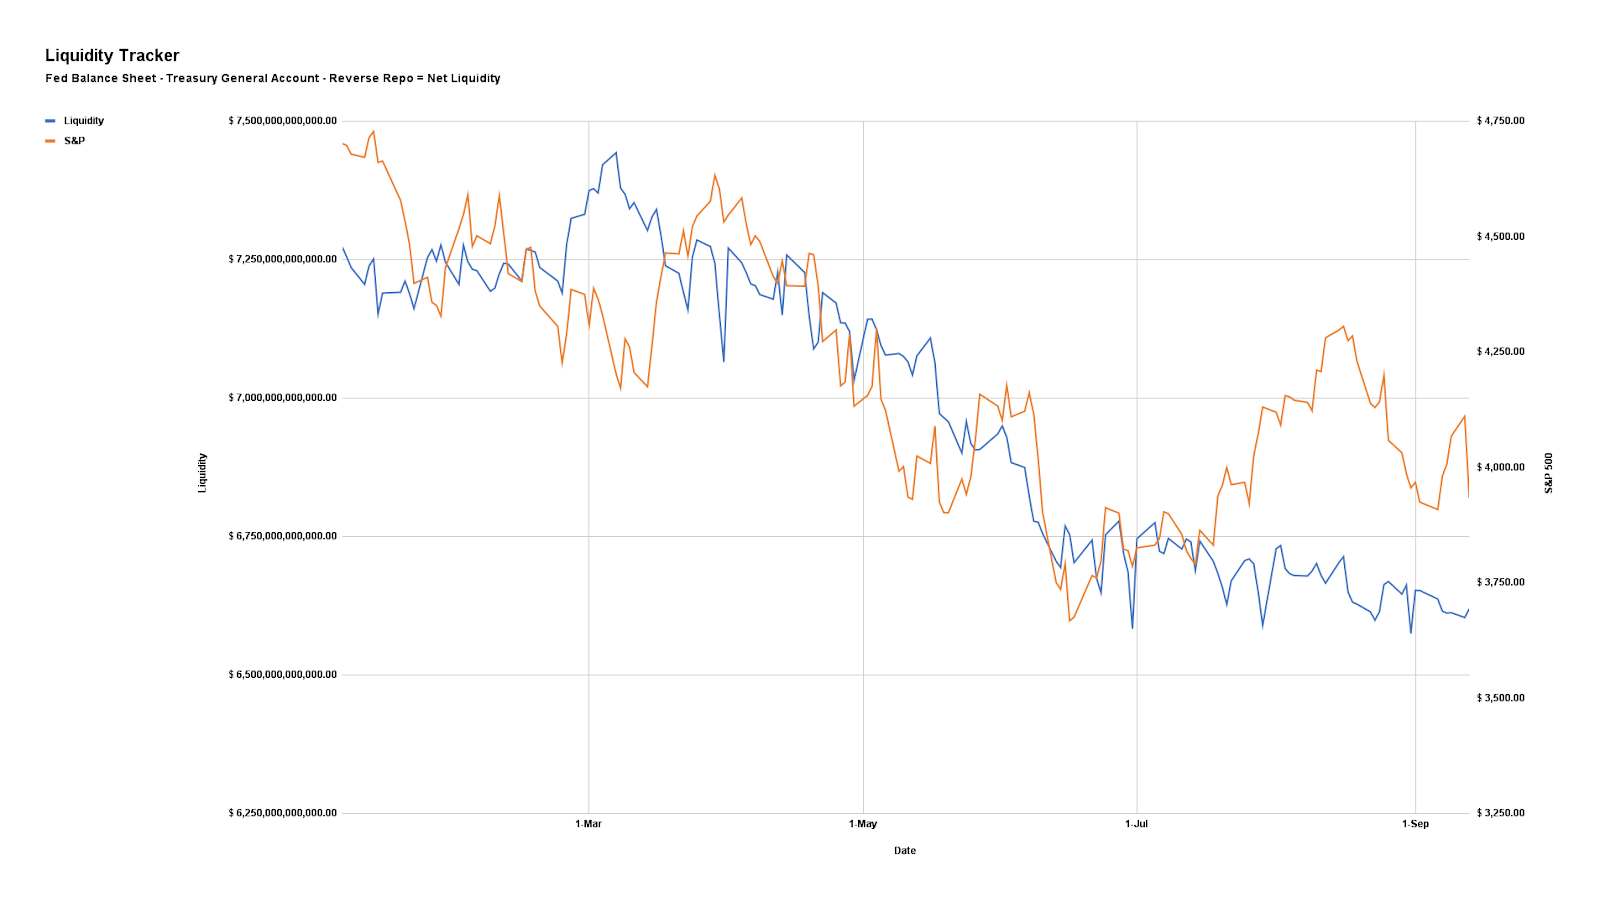
That compounds the impact of quantitative tightening (QT) which is manifesting itself as “$4.5 billion less in demand for assets per day,” as well as the blackout period for buybacks (which were consistently “supporting the market”) and options repositioning.
Read our monetary policy explainers published on September 19 and 20.
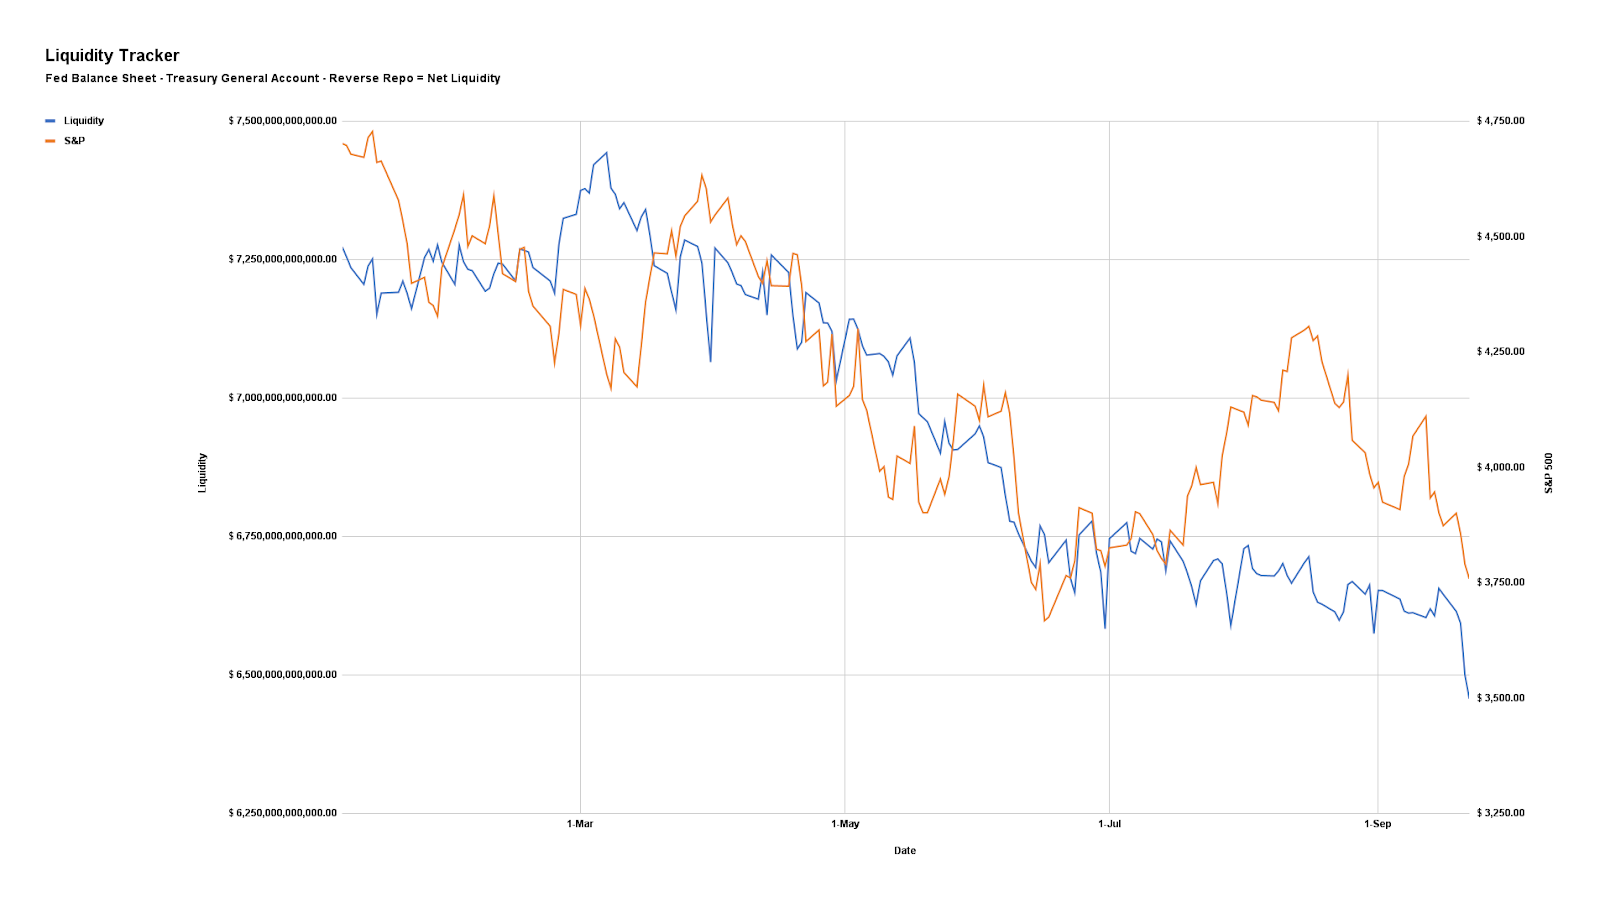
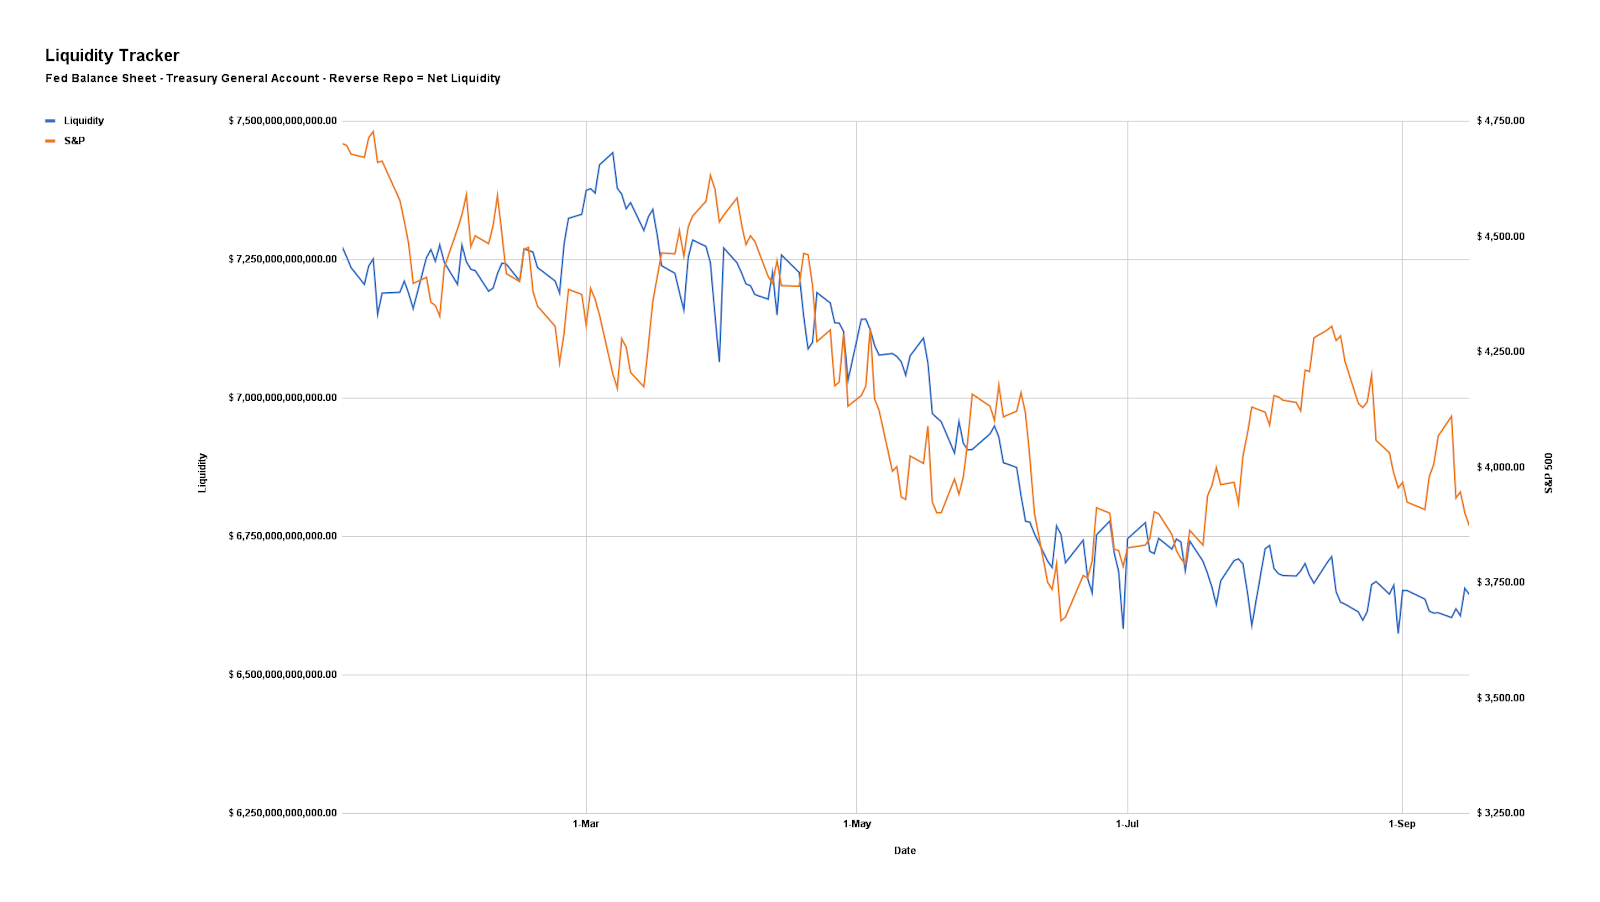
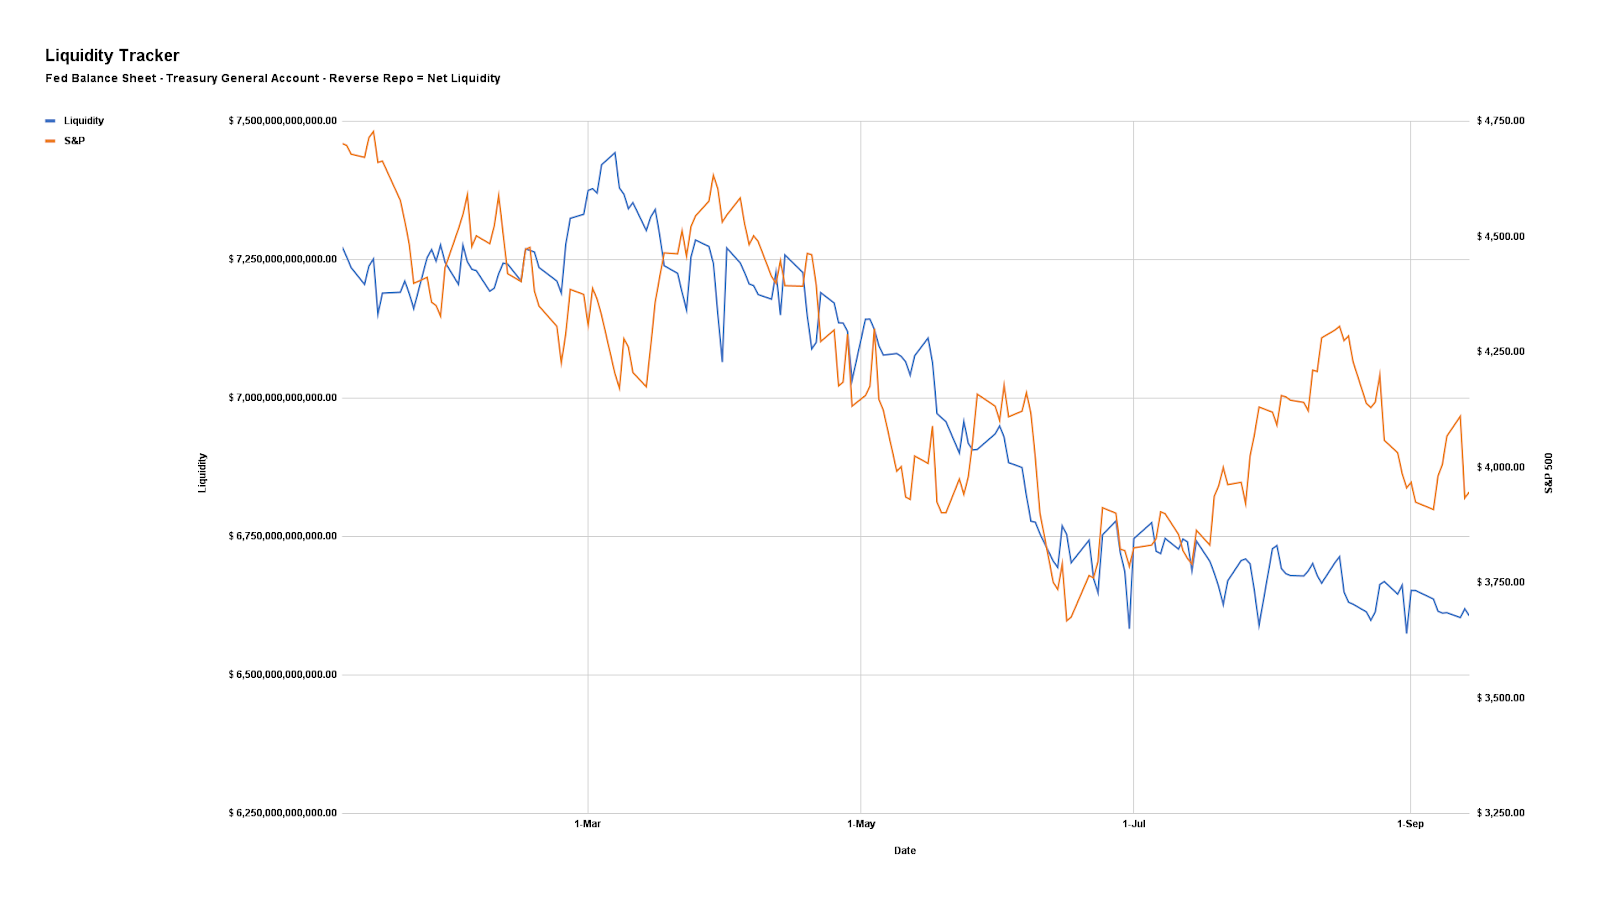
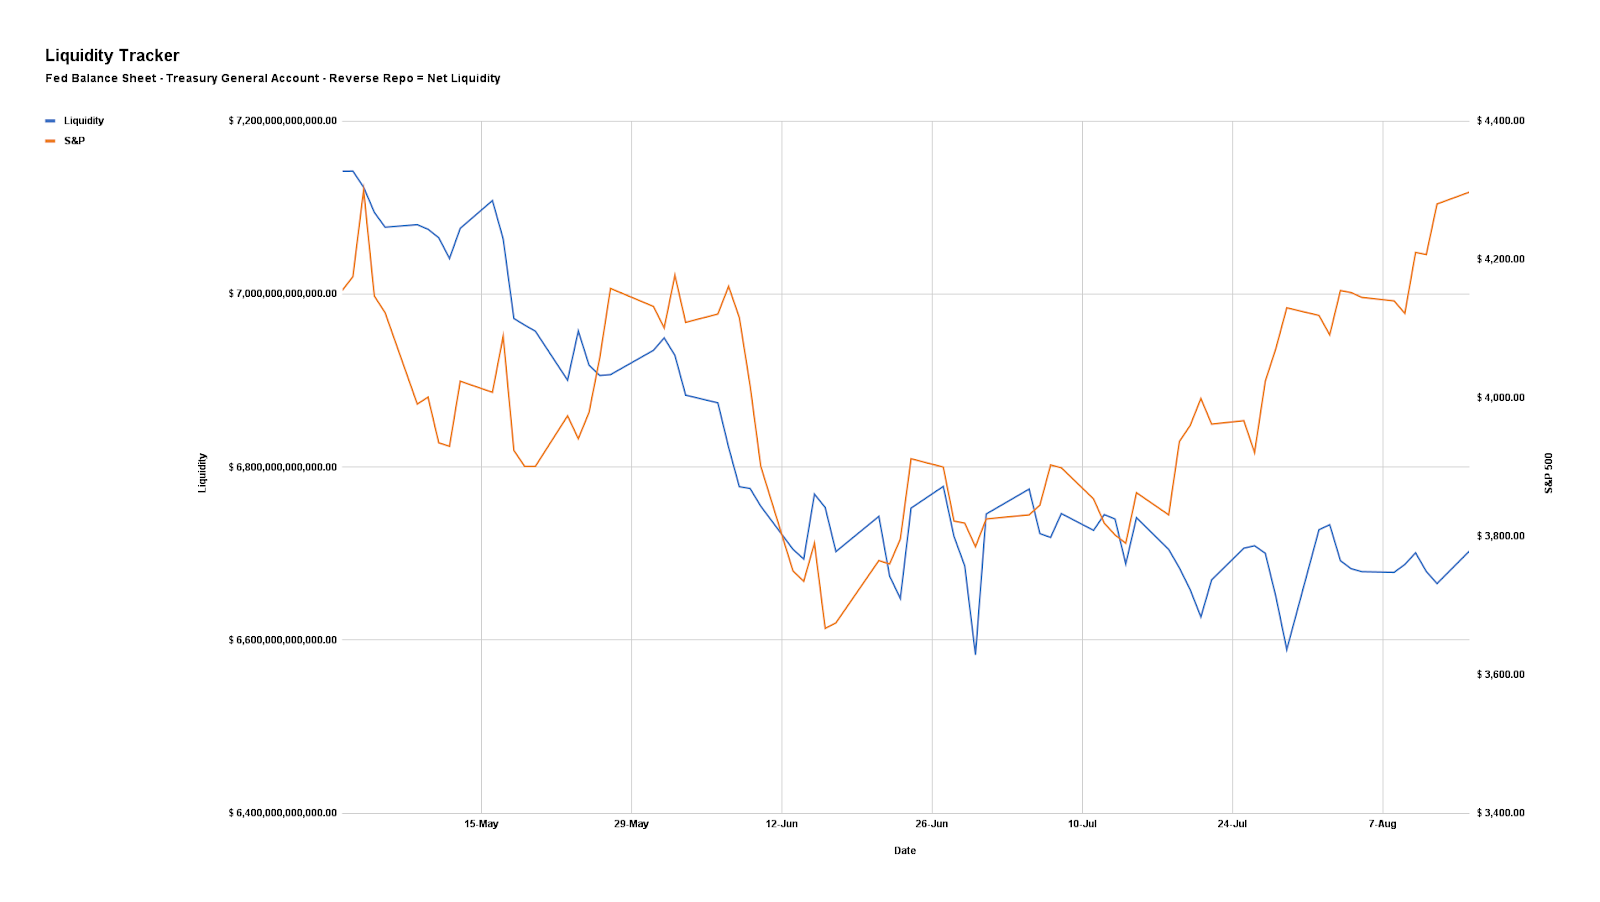
Graphic: Via Physik Invest. Data compiled by @jkonopas623. Fed Balance Sheet data, here. Treasury General Account Data, here. Reverse Repo data, here. NL = BS – TGA – RRP.
At the beginning of the 5-week expiration cycle, Karsan explained, Vanna and Charm flows are reduced; there is “significantly less buyback” of counterparty short stock and futures hedges to “the decay of options which sit at the October monthly expiration.”
So, “less support from Vanna and Charm, less support through QT, and less buyback,” presents a “fragile moment” with the next week representing the most “dangerous period” on record.
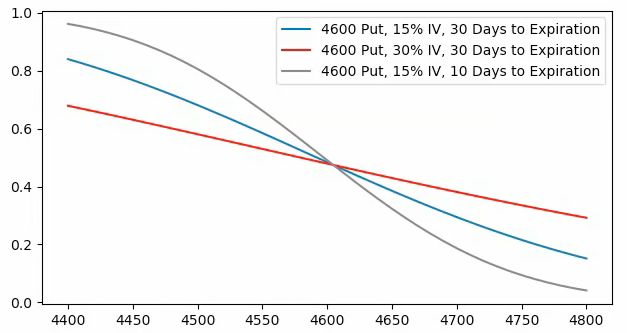
Graphic: Retrieved from SpotGamma. “SPX prices X-axis. Option Delta Y-axis. When the factors of implied volatility and time change, hedging ratios change. For instance, if SPX is at $4,700.00 and IV jumps 15% (all else equal), the dealer may sell an additional 0.2 Deltas to hedge their exposure to the addition of a positive 0.2 Delta. The graphic is for illustrational purposes, only.”
Ultimately, “December’s quarterly [OPEX] is now coming into the picture, … [where] volatility is generally highly demanded. When you get a lot of volatility supply in that area, you begin to see people who are short getting back the volatility they were short.”
In other words, equities down, implied volatility down is likely to persist for a little while longer as the risks for a “tail” build; “there’s a window that is opening for long volatility to perform probably starting in about a month or two,” through to “January and March.”
Technical
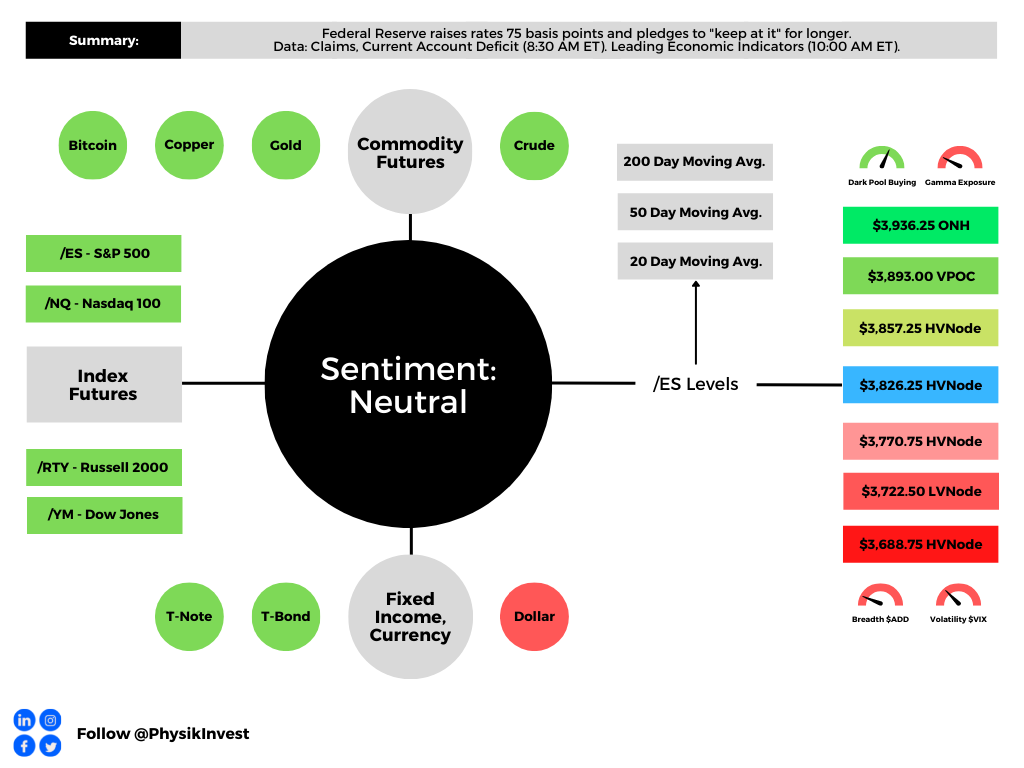
As of 8:30 AM ET, Monday’s regular session (9:30 AM – 4:00 PM ET), in the S&P 500, is likely to open in the lower part of a negatively-skewed overnight inventory, inside of prior-range and -value, suggesting a limited potential for immediate directional opportunity.
In the best case, the S&P 500 trades higher.
Any activity above the $3,688.75 HVNode puts into play the $3,722.50 LVNode. Initiative trade beyond the LVNode could reach as high as the $3,771.25 and $3,826.25 HVNode, or higher.
In the worst case, the S&P 500 trades lower.
Any activity below the $3,688.75 HVNode puts into play the $3,638.25 LVNode. Initiative trade beyond the LVNode could reach as low as the $3,610.75 and $3,554.75 HVNode, or lower.
Click here to load today’s key levels into the web-based TradingView charting platform. Note that all levels are derived using the 65-minute timeframe. New links are produced, daily.
Graphic: 65-minute profile chart of the Micro E-mini S&P 500 Futures.
Definitions
Volume Areas: A structurally sound market will build on areas of high volume (HVNodes). Should the market trend for long periods of time, it will lack sound structure, identified as low volume areas (LVNodes). LVNodes denote directional conviction and ought to offer support on any test.
If participants were to auction and find acceptance into areas of prior low volume (LVNodes), then future discovery ought to be volatile and quick as participants look to HVNodes for favorable entry or exit.
About
After years of self-education, strategy development, mentorship, and trial-and-error, Renato Leonard Capelj began trading full-time and founded Physik Invest to detail his methods, research, and performance in the markets.
Capelj also develops insights around impactful options market dynamics at SpotGamma and is a Benzinga reporter.
In no way should the materials herein be construed as advice. Derivatives carry a substantial risk of loss. All content is for informational purposes only.
The daily brief is a free glimpse into the prevailing fundamental and technical drivers of U.S. equity market products. Join the 950+ that read this report daily, below!
Graphic updated 8:00 AM ET. Sentiment Neutral if expected /ES open is inside of the prior day’s range. /ES levels are derived from the profile graphic at the bottom of the following section. Levels may have changed since initially quoted; click here for the latest levels. SqueezeMetrics Dark Pool Index (DIX) and Gamma (GEX) calculations are based on where the prior day’s reading falls with respect to the MAX and MIN of all occurrences available. A higher DIX is bullish. At the same time, the lower the GEX, the more (expected) volatility. Learn the implications of volatility, direction, and moneyness. Breadth reflects a reading of the prior day’s NYSE Advance/Decline indicator. VIX reflects a current reading of the CBOE Volatility Index (INDEX: VIX) from 0-100.
Administrative
An easy read, today. For more complex, see the September 20 and 19 letters. Also, there will not be a letter published for Friday, September 23, 2022. See you next week, team!
Fundamental
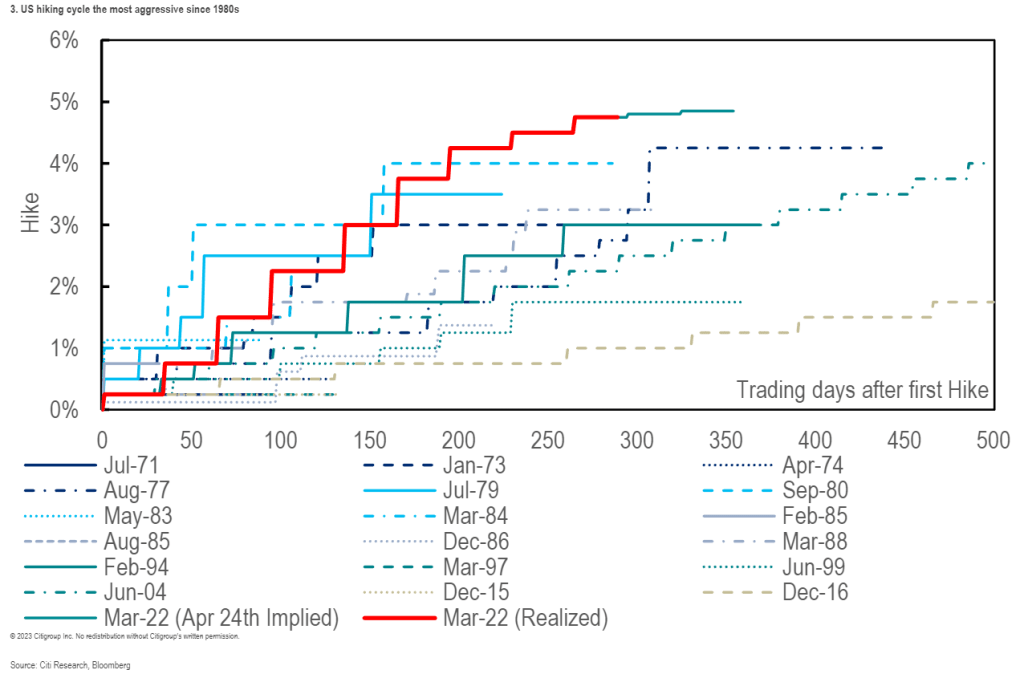
Equity markets traded down, yesterday, on the heels of the Federal Reserve’s (Fed) decision to raise interest rates by 0.75% and “keep at it” for longer, eyeing a 1.25% jump, in sum, by 2023.
This puts the current target rate at 3.00-3.25%.
Separately, if the “keep at it” quote sounds familiar, that’s because it is. The Fed Paul Volcker’s memoir is titled “Keeping at It.”
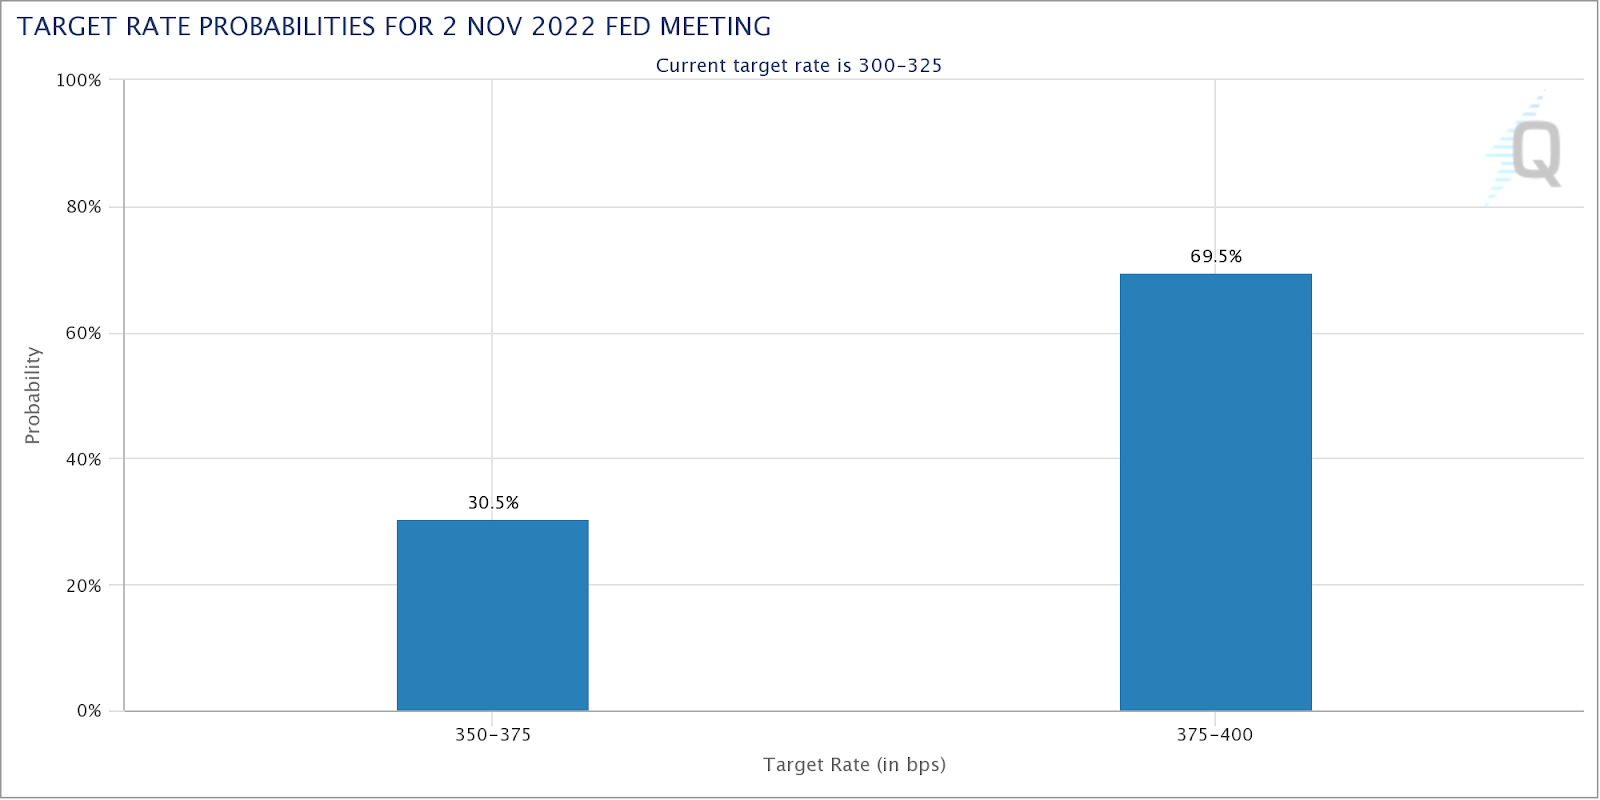
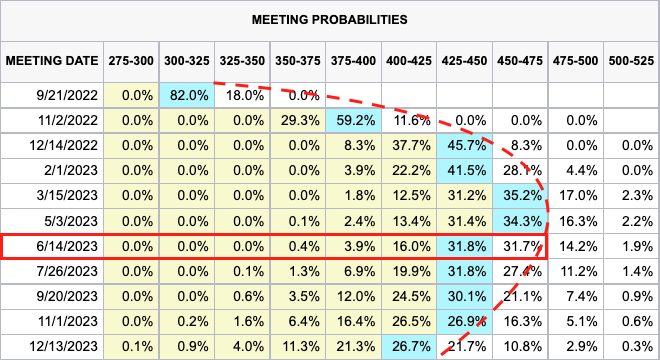
Graphic: CME Group Inc’s (NASDAQ: CME) FedWatch Tool shows higher odds of a 75 to 100 basis point rate hike in November, along the lines of what the futures market was pricing heading into the event.
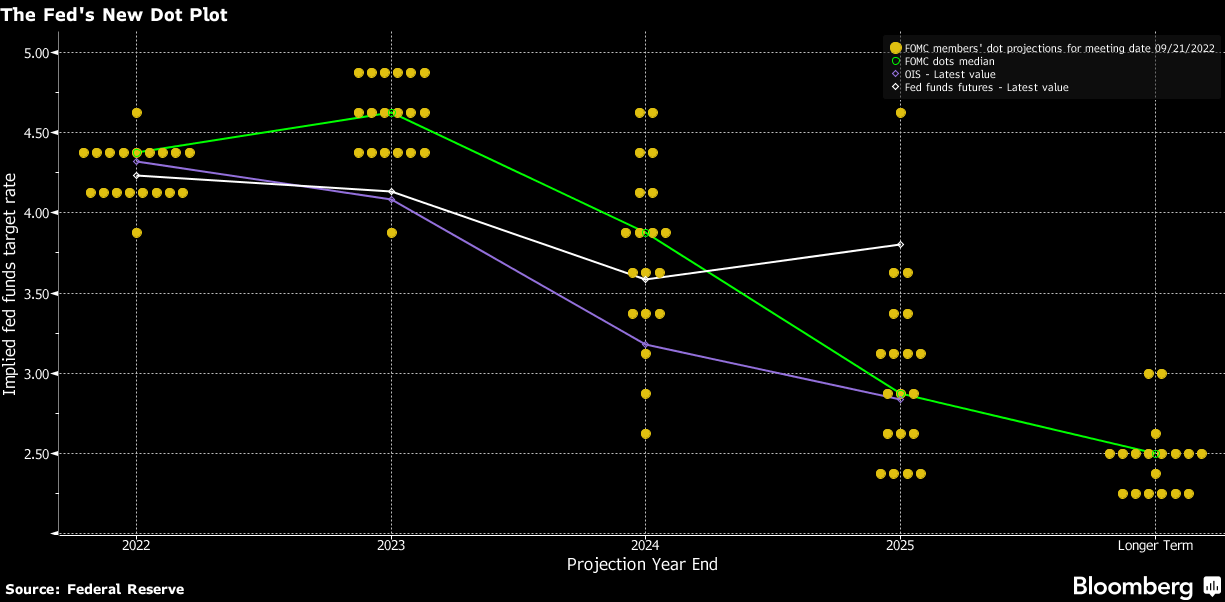
The Fed Chair Jerome Powell admitted there may be below-trend growth and the potential for unemployment to reach 4.4% next year, up from the current rate of 3.7%. Projected increases, as of yesterday, show interest rates at 4.4% by 2023, and 4.6% in 2023, before moderation in 2024 to 3.9%, as well summarized by Bloomberg.
Moreover, economists suggest that raising rates to 4.5% would cost the economy nearly 1.7 million jobs while rates at 5% would bring that number to 2 million. A higher savings rate and increased funds at the state level would likely cushion the blow, however.
In response, the likes of Ark Invest’s Cathie Wood, who we quoted recently regarding her thoughts on why the Fed needs to lower the pace of tightening and/or cut, said:
“Most disappointing about the Fed’s decision today was its unanimity. None of those voting on the Federal Reserve is focused on the significant price deflation in the pipeline. The Fed seems to be making decisions based on lagging indicators and analogies.”
She adds that the Fed is setting the stage for deflation:
“The Fed is solving supply chain issues by crushing demand and, in my view, unleashing deflation, setting it up for a major pivot.”
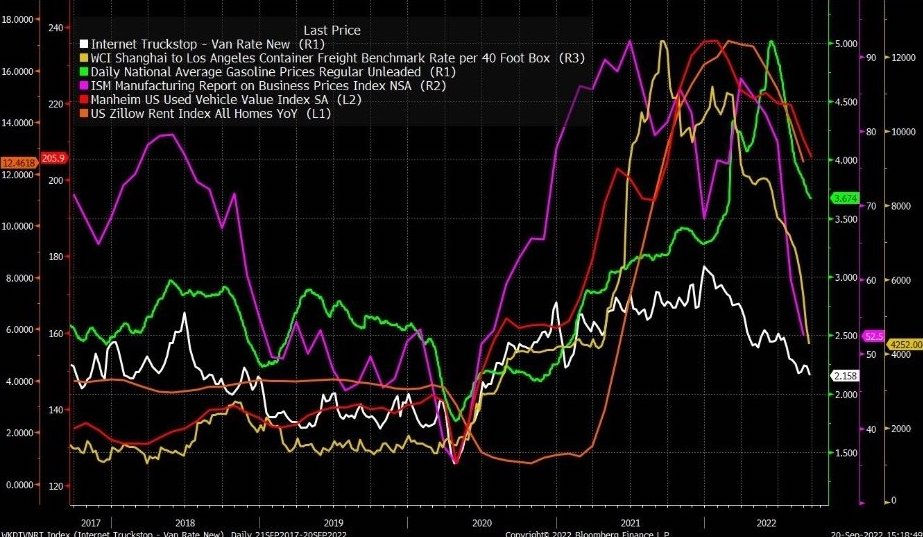
Graphic: Initially retrieved from Bloomberg. Taken from Ophir Gottlieb who concludes costs are dropping, as observed via shipping, gasoline, manufacturing, cars, and rent measures.
Moreover, it’s the case that “[a]s rates rise and debt servicing costs increase, ‘many zombie institutions, zombie households, corporates, banks, shadow banks, and zombie countries are going to die,’” said economist Nouriel Roubini, who predicted the 2008 financial crisis.
Prior to the Fed event, Roubini forecasted a 75 basis point hike in September, followed by a 50 basis point hike in November. The market is pricing more than what Roubini thought the Fed would probably do after Wednesday’s Fed meeting.
In his opinion, stay “light on equities and have more cash, … [as] equities and other assets can fall by 10%, 20%, 30%.”
Positioning
In short, unexpected was the post-event response. In recent times, post-Fed moves have been positive, driven by the “rebalancing of dealer inventory,” per Kai Volatility’s Cem Karsan.
That didn’t happen and let’s unpack why.
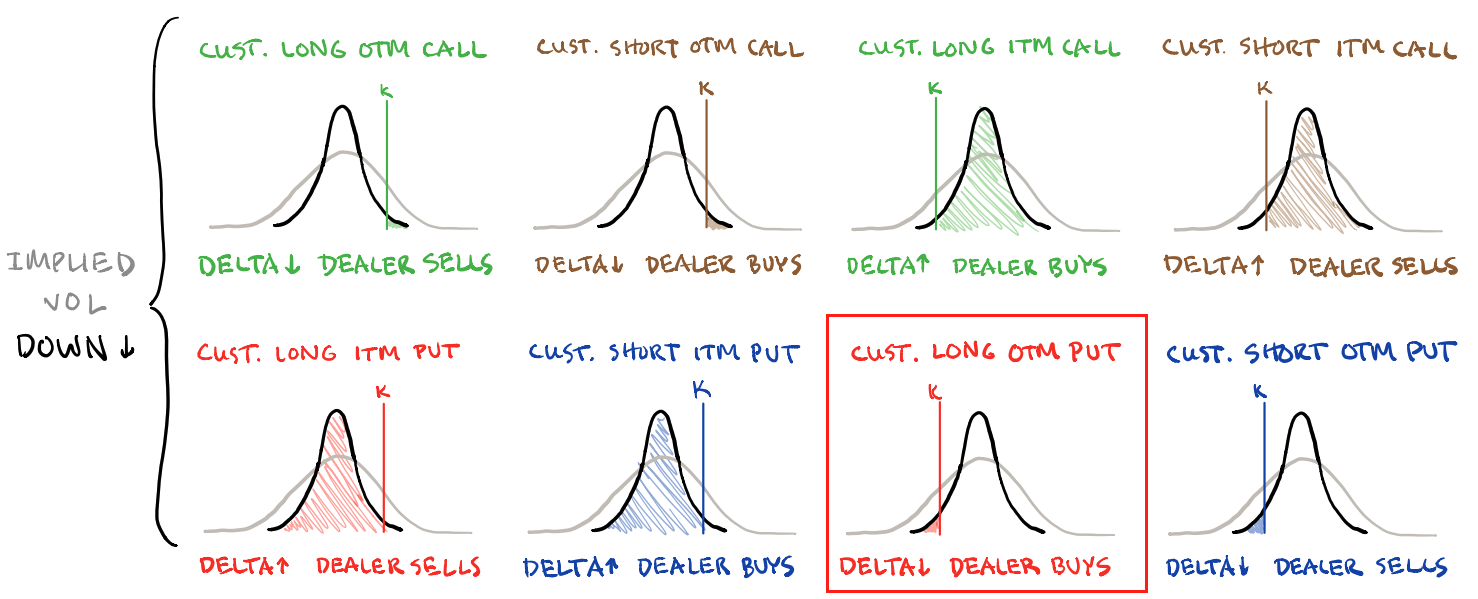
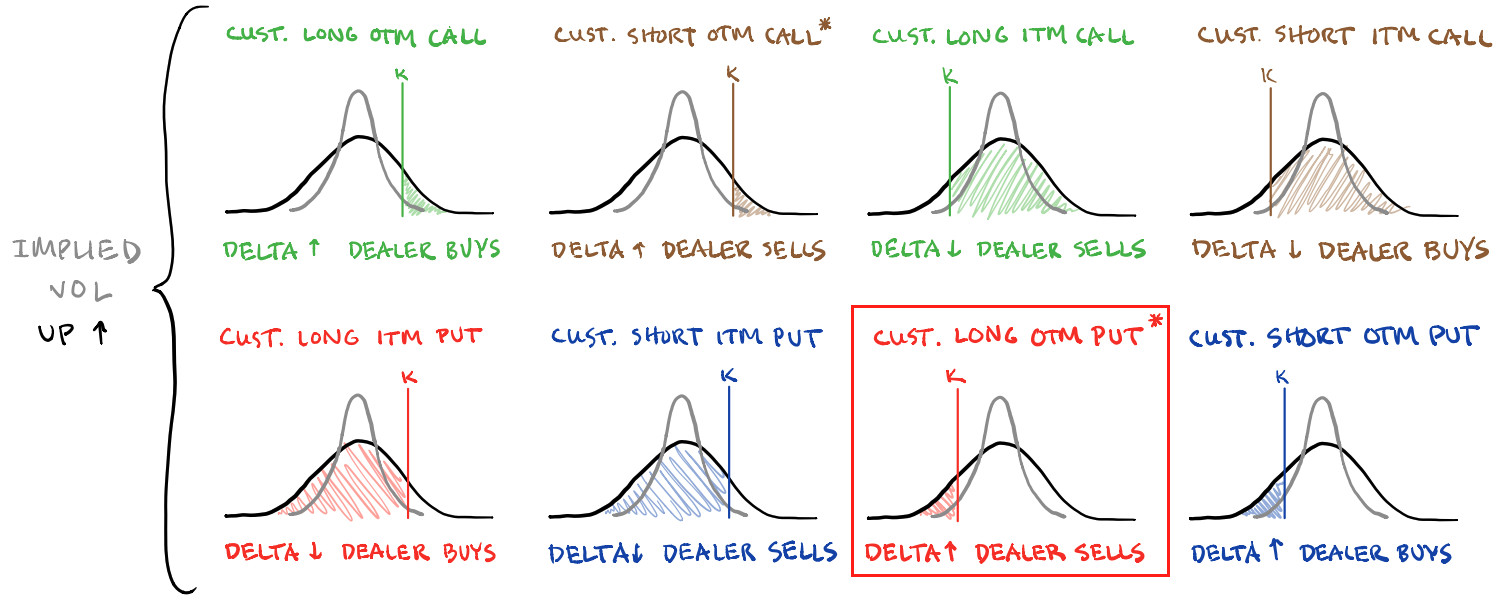
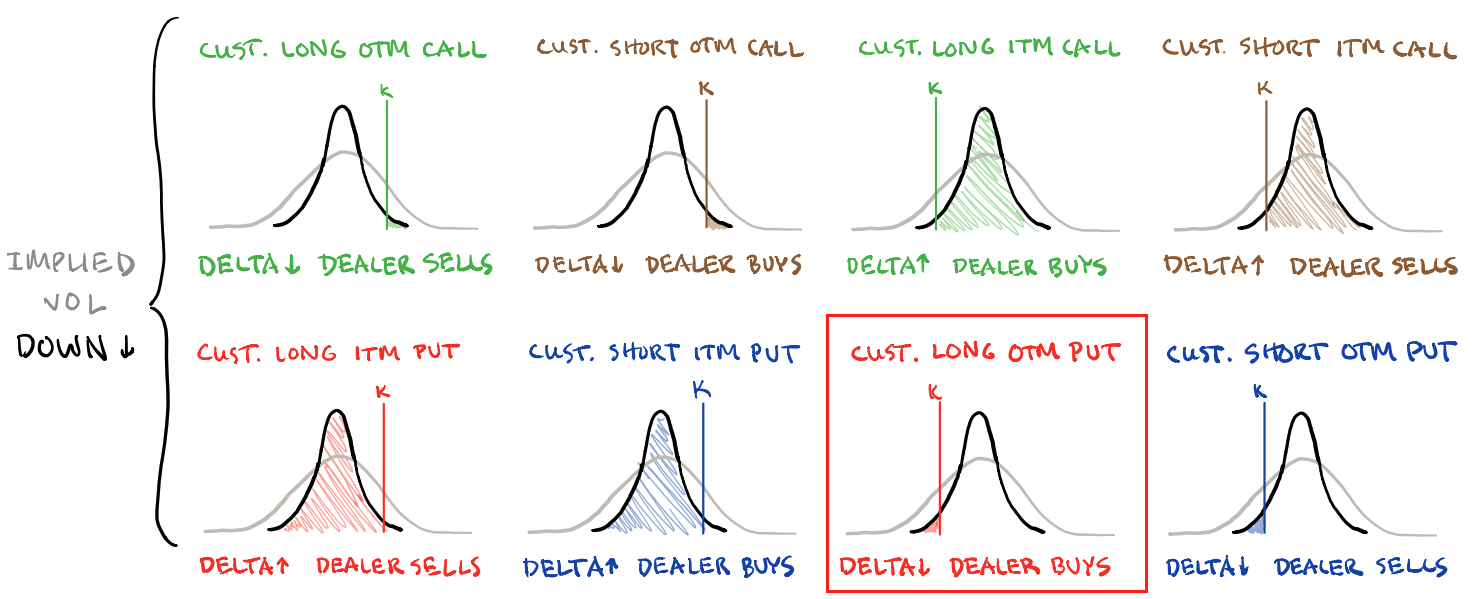
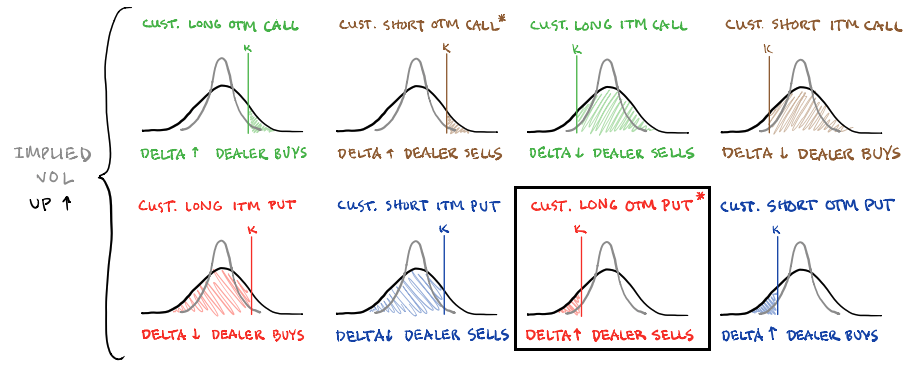
Basically, into the event, traders demanded protection and bid implied volatility (IVOL). The assumption is that counterparties, who are likely on the other end, have exposure to positive Delta and negative Gamma, which they hedge through negative Delta trades in the underlying.
Should fears have been assuaged, the supply of that protection once demanded, would have decreased IVOL (and options Delta), providing the markets a boost.
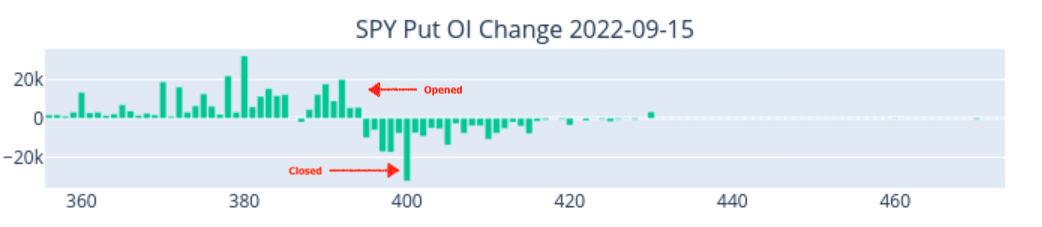
That didn’t happen. Instead, traders added protection, as shown by this SpotGamma graphic tracking changes in put open interest on the S&P 500 (INDEX: SPX).
Graphic: Retrieved from SpotGamma.Updated September 22, 2022.
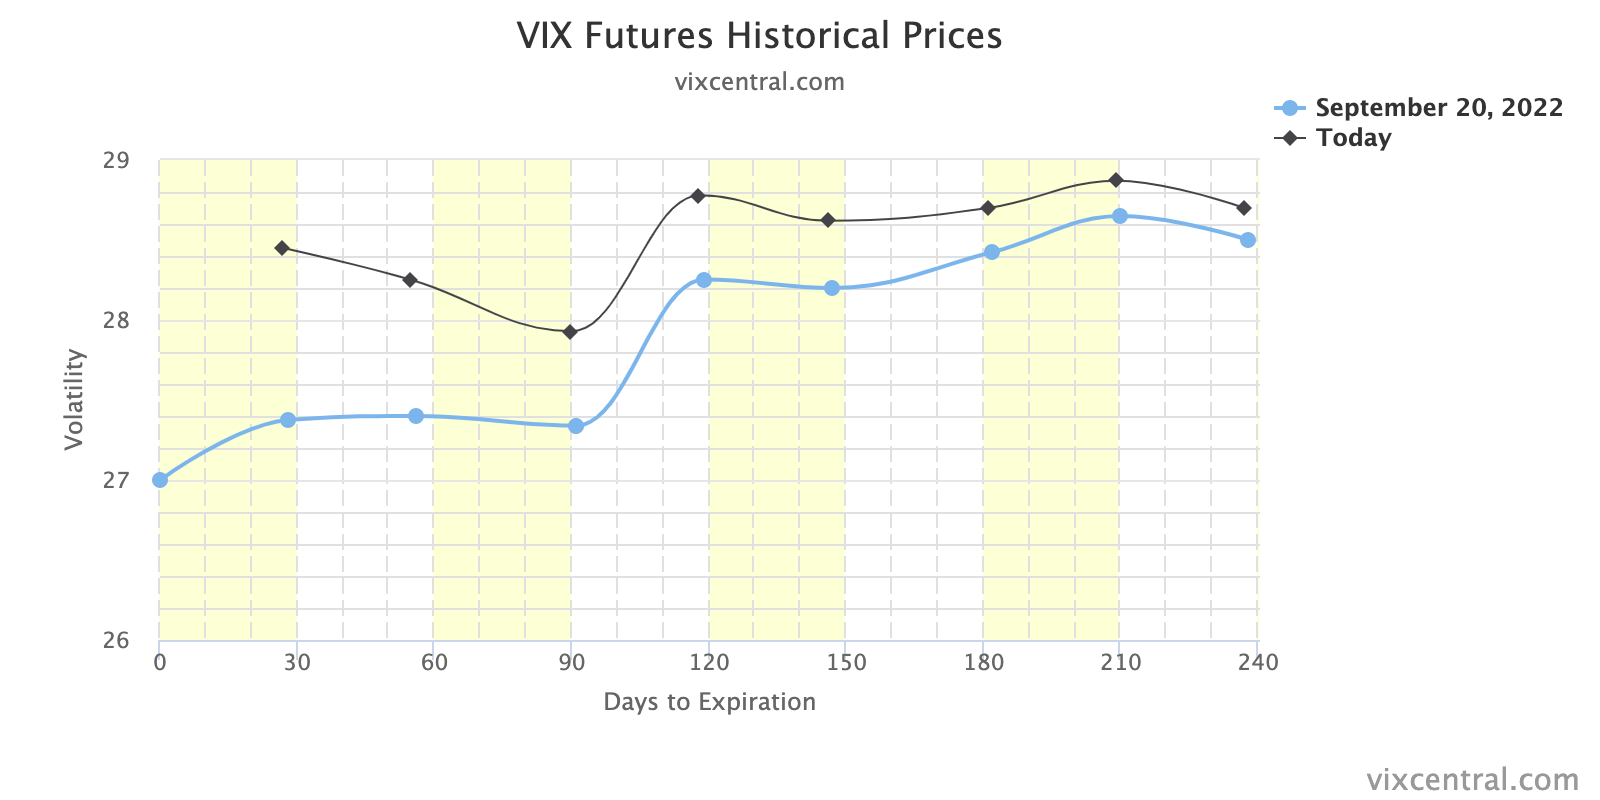
This bid some basic measures of IVOL into the close.
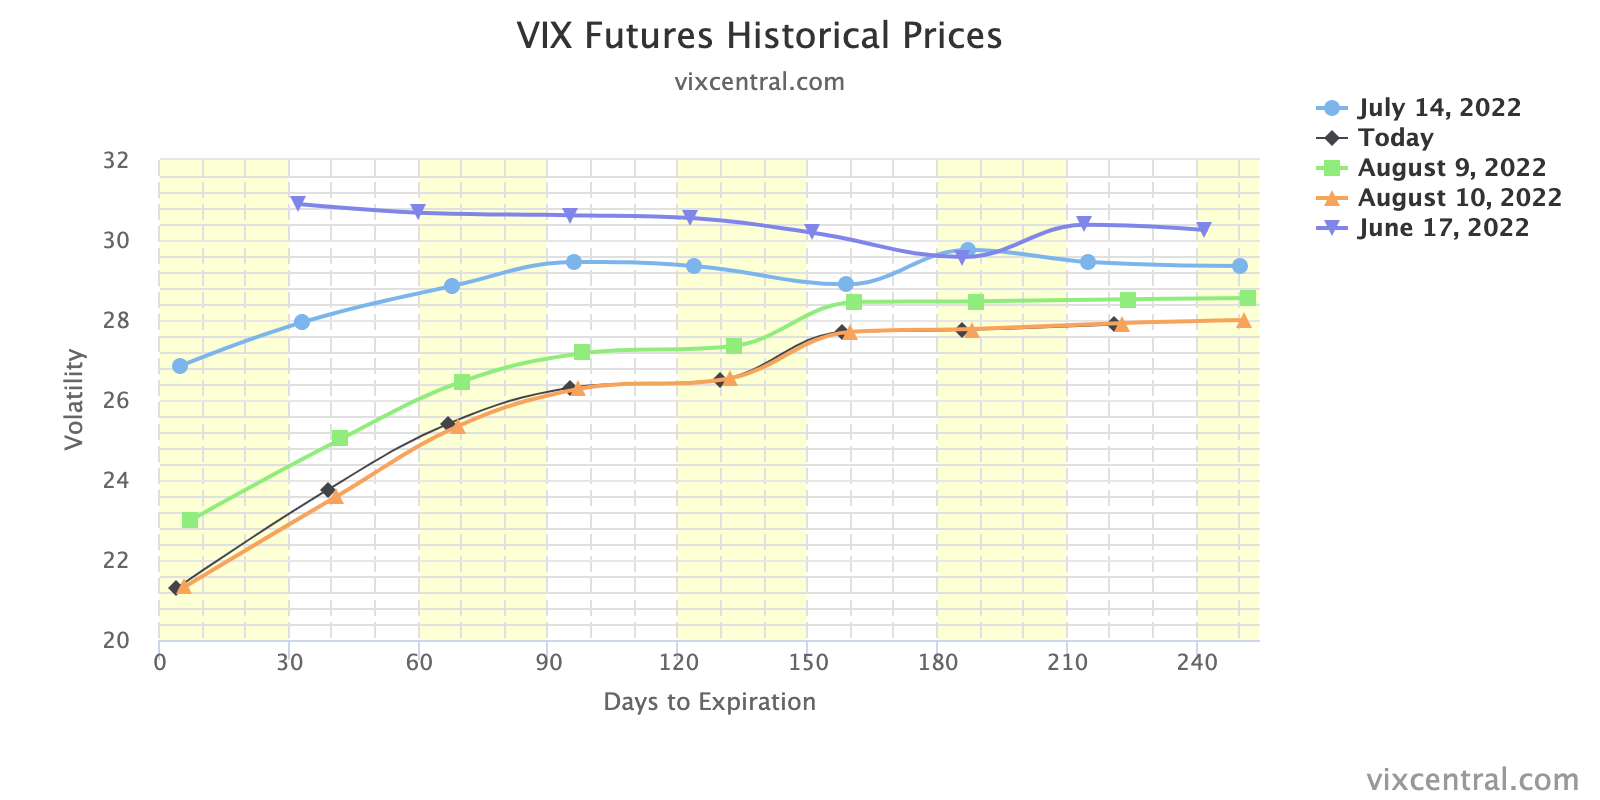
Graphic: Retrieved from VIX Central. Updated September 21, 2022.
That’s as these particular options, which were added at much lower prices, as I explained in a SpotGamma note, recently, “are far more sensitive to changes in direction and IVOL.”
These options can go “from having very little Delta (exposure to direction) to a lot more Delta on the move lower,” quickly. “If we maintain that liquidity providers are short those puts, a positive Delta trade, then those liquidity providers [will sell] futures and stock, a negative Delta trade to stay hedged.”
Notwithstanding, it’s still the case that a “reload on fresh short-dated downside” flows heighten the risk of a “negative Delta squeeze … into month end,” said Nomura Holdings Inc’s (NYSE: NMR) Charlie McElligott.
Therefore, “you have to consider a move up [to] $4,000.00 as part of your distribution of outcomes to the upside,” as that is near where “market makers are ‘long,’” as part of an impactful collar trade many are aware sits.
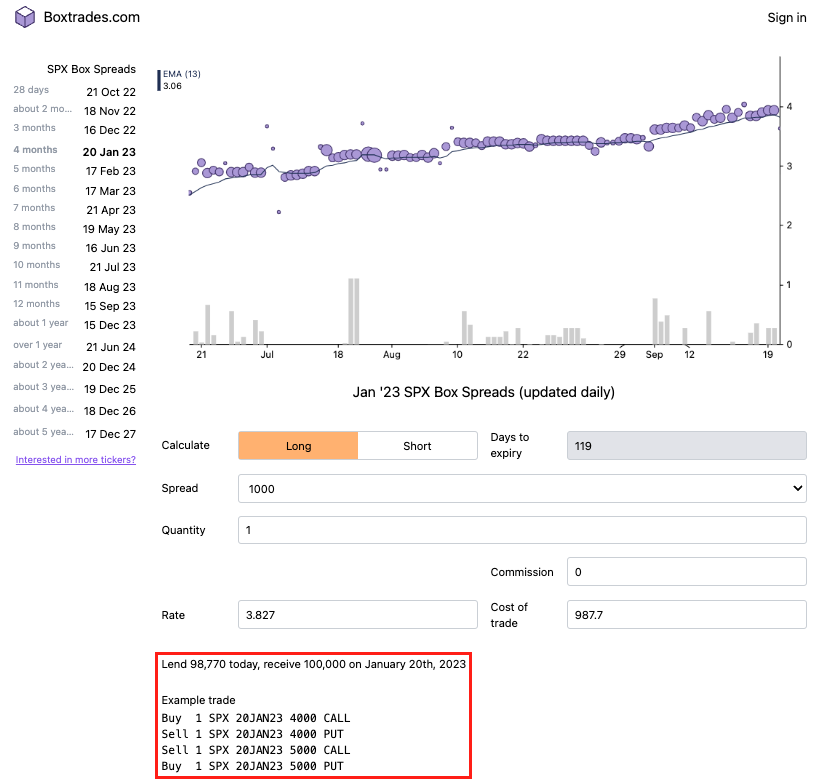
As an aside, some online conversation was sparked around placing cash into riskless trades for some small, but guaranteed, rates of return. In that conversation, Box Spreads were put forth as a solution to lend cash and earn a competitive interest rate.
For context, “Boxes allow market participants to create a loan structure similar to a Treasury bill. T-bills are ‘discount’ instruments that are purchased at a value less than the stated face value. Upon maturity, bills call for the return of the stated face value.”
“For example, one might buy a $1 million 90-day T-bill for $998,000. Ninety days later, the $1 million face or principal value is returned and the $2,000 discount is earned as interest. One may represent the rate on this transaction as a 0.80% or 80 basis point discount yield [= (360/90) x ($2,000/$1,000,000)]. The effective rate on a box represents a ‘discount yield’ similar to a quoted T-bill rate.”
IPS Strategic Capital’s Pat Hennessy explains that SPX boxes “typically yield[] 20-40 bps above [the] corresponding maturity risk-free rate.” Additionally, there are tax advantages to using the S&P 500’s 1256 contracts.
For easier fills, use the “3K/4K line in an AM settled expiry,” Hennessy noted. “Helps if you know where the broker market is.”
Technical
As of 8:00 AM ET, Thursday’s regular session (9:30 AM – 4:00 PM ET), in the S&P 500, is likely to open in the upper part of a balanced overnight inventory, inside of prior-range and -value, suggesting a limited potential for immediate directional opportunity.
In the best case, the S&P 500 trades higher.
Any activity above the $3,826.25 HVNode puts into play the $3,857.25 HVNode. Initiative trade beyond the latter could reach as high as the $3,893.00 VPOC and $3,936.25 ONH, or higher.
In the worst case, the S&P 500 trades lower.
Any activity below the $3,826.25 HVNode puts into play the $3,770.75 HVNode. Initiative trade beyond the HVNode could reach as low as the $3,722.50 LVNode and $3,688.75 HVNode, or lower.
Click here to load today’s key levels into the web-based TradingView charting platform. Note that all levels are derived using the 65-minute timeframe. New links are produced, daily.
Graphic: 65-minute profile chart of the Micro E-mini S&P 500 Futures.
Definitions
Volume Areas: A structurally sound market will build on areas of high volume (HVNodes). Should the market trend for long periods of time, it will lack sound structure, identified as low volume areas (LVNodes). LVNodes denote directional conviction and ought to offer support on any test.
If participants were to auction and find acceptance into areas of prior low volume (LVNodes), then future discovery ought to be volatile and quick as participants look to HVNodes for favorable entry or exit.
POCs: POCs are valuable as they denote areas where two-sided trade was most prevalent in a prior day session. Participants will respond to future tests of value as they offer favorable entry and exit.
MCPOCs: POCs are valuable as they denote areas where two-sided trade was most prevalent over numerous day sessions. Participants will respond to future tests of value as they offer favorable entry and exit.
About
After years of self-education, strategy development, mentorship, and trial-and-error, Renato Leonard Capelj began trading full-time and founded Physik Invest to detail his methods, research, and performance in the markets.
Capelj also develops insights around impactful options market dynamics at SpotGamma and is a Benzinga reporter.
In no way should the materials herein be construed as advice. Derivatives carry a substantial risk of loss. All content is for informational purposes only.
The daily brief is a free glimpse into the prevailing fundamental and technical drivers of U.S. equity market products. Join the 900+ that read this report daily, below!
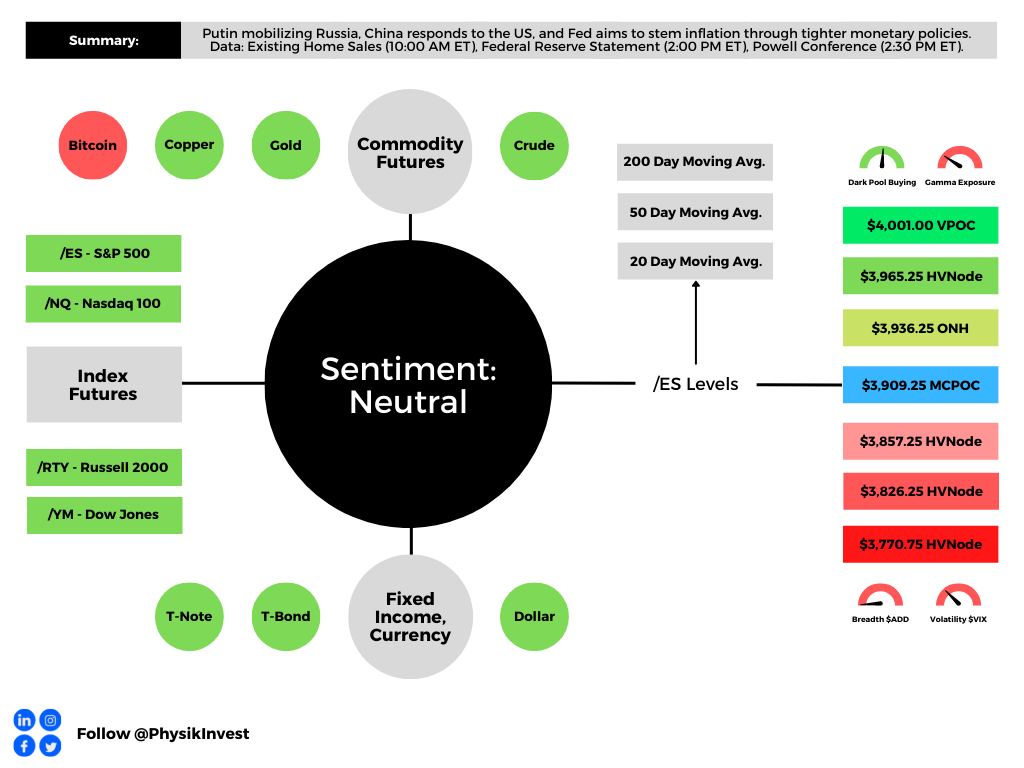
Graphic updated 7:00 AM ET. Sentiment Neutral if expected /ES open is inside of the prior day’s range. /ES levels are derived from the profile graphic at the bottom of the following section. Levels may have changed since initially quoted; click here for the latest levels. SqueezeMetrics Dark Pool Index (DIX) and Gamma (GEX) calculations are based on where the prior day’s reading falls with respect to the MAX and MIN of all occurrences available. A higher DIX is bullish. At the same time, the lower the GEX, the more (expected) volatility. Learn the implications of volatility, direction, and moneyness. Breadth reflects a reading of the prior day’s NYSE Advance/Decline indicator. VIX reflects a current reading of the CBOE Volatility Index (INDEX: VIX) from 0-100.
Administrative
Short and to the point, today, after yesterday’s detailed letter on inflation, monetary policy action, and beyond. Good luck, everyone!
Fundamental
Ongoing is a “messy divorce” between large powers. We have talked about this in the past.
In the news was Putin’s mobilization of troops and renewed warning of a nuclear threat. This is a day after Biden said the US would defend Taiwan against China. In response, Mao Ning, the Chinese foreign ministry spokesperson, said this:
“The US remarks seriously violate the one-China principle … and send a severely wrong signal to the separatist forces of Taiwan independence. China strongly deplores and rejects it and has made solemn complaints with the US side.”
“We will do our utmost to strive for the prospect of peaceful reunification with the utmost sincerity, while we will not tolerate any activities aimed at splitting China and reserve the option to take all necessary measures.”
The aforementioned do more to shift “the pillars of the low inflation world” – de-globalization and populism – which the Federal Reserve (Fed) has a limited toolkit to solve for.
Pending is a large “L”-shaped recession to slow inflation, generate negative wealth effects, lower demand, and position for a recovery that will likely be “fiscally funded industrial policy.”
Shifting to today, the Federal Reserve is to step up its efforts to tame inflation by raising interest rates to the highest level since 2008. The consensus calls for up to a 75 basis point rate hike.
Bloomberg economist Anna Wong, Andrew Husby, and Eliza Winger put forth:
“Powell will emphasize the committee’s determination to hold rates higher for longer. He will be more forthcoming in acknowledging the likely pain involved in bringing down inflation. He may opt not to say that the committee plans to downshift the pace of rate hikes.”
Positioning
Yesterday, we briefly talked about post-event moves which are often positive and driven by the structural “rebalancing of dealer inventory,” per Kai Volatility’s Cem Karsan.
“In the past four Fed Days, the benchmark index has climbed an average of roughly 1.4% on all days, with more than 2% gains on three of the four,” said Bloomberg’s John Authers. Adding, “the S&P 500 has averaged a gain of more than 1% on Fed Days over the last 10 meetings.”
Graphic: Retrieved from Bloomberg. Via the Bespoke Investment Group.
Basically, into the event, traders have demanded protection and bid implied volatility (IVOL).
Graphic: Retrieved from SpotGamma.
Should fears be assuaged, the supply of that protection should decrease IVOL, this is what may provide markets a boost.
From thereon, the “second move and final resolution, if you wait for it, is usually tied to the incremental effects on liquidity (QE/QT).”
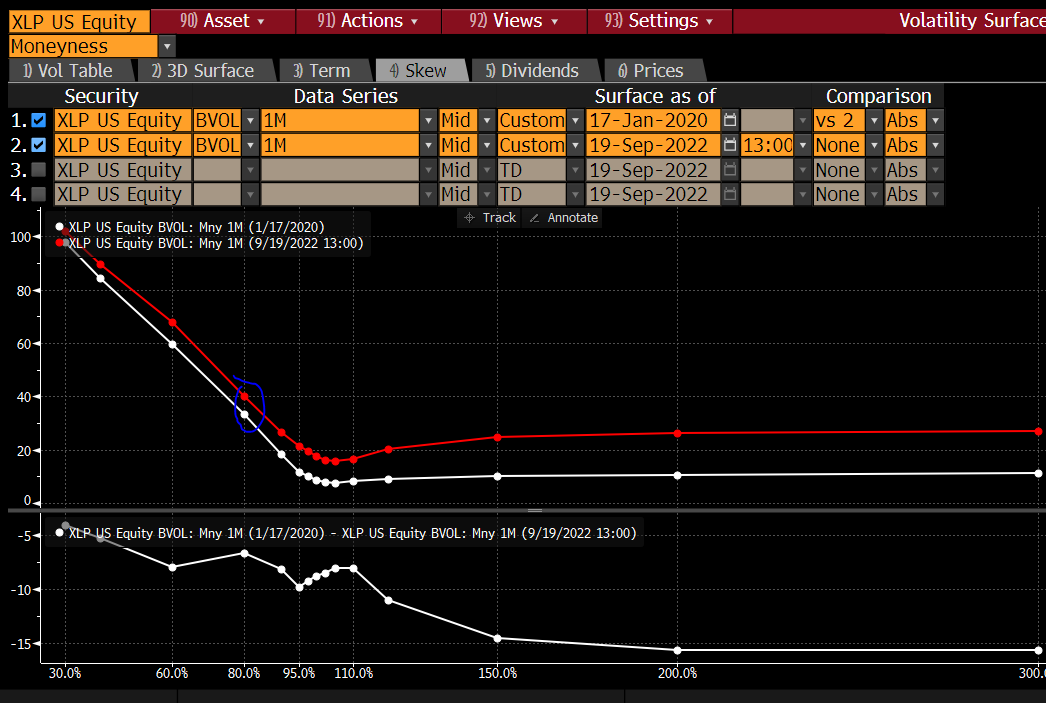
In the case of the latter, per The Ambrus Group’s Kris Sidial, “[o]utright tails in single stocks continue to be ‘cheap’ relative to what you are seeing in the broad market.”
“Market is discounting any sort of crash risk. Which seems reasonable granted that a lot of the current macro theme is geared towards a longer-term effect.”
Graphic: Retrieved from Bloomberg. Taken from Kris Sidial. “January 2022 was a time that was associated with really low vol (VIX = ~12). Consumer Staples Select Sector SPDR Fund (NYSE: XLP) 1M 80MNY tails today are only 4 vols over where they were during that time.”
Technical
As of 7:00 AM ET, Wednesday’s regular session (9:30 AM – 4:00 PM ET), in the S&P 500, is likely to open in the upper part of a negatively skewed overnight inventory, inside of prior-range and -value, suggesting a limited potential for immediate directional opportunity.
In the best case, the S&P 500 trades higher.
Any activity above the $3,909.25 MCPOC puts into play the $3,936.25 ONH. Initiative trade beyond the ONH could reach as high as the $3,965.25 HVNode and $4,001.00 VPOC, or higher.
In the worst case, the S&P 500 trades lower.
Any activity below the $3,909.25 MCPOC puts into play the $3,857.25 HVNode. Initiative trade beyond the latter could reach as low as the $3,826.25 and $3,770.75 HVNode, or lower.
Click here to load today’s key levels into the web-based TradingView charting platform. Note that all levels are derived using the 65-minute timeframe. New links are produced, daily.
Graphic: 65-minute profile chart of the Micro E-mini S&P 500 Futures.
Definitions
Volume Areas: A structurally sound market will build on areas of high volume (HVNodes). Should the market trend for long periods of time, it will lack sound structure, identified as low volume areas (LVNodes). LVNodes denote directional conviction and ought to offer support on any test.
If participants were to auction and find acceptance into areas of prior low volume (LVNodes), then future discovery ought to be volatile and quick as participants look to HVNodes for favorable entry or exit.
POCs: POCs are valuable as they denote areas where two-sided trade was most prevalent in a prior day session. Participants will respond to future tests of value as they offer favorable entry and exit.
MCPOCs: POCs are valuable as they denote areas where two-sided trade was most prevalent over numerous day sessions. Participants will respond to future tests of value as they offer favorable entry and exit.
About
After years of self-education, strategy development, mentorship, and trial-and-error, Renato Leonard Capelj began trading full-time and founded Physik Invest to detail his methods, research, and performance in the markets.
Capelj also develops insights around impactful options market dynamics at SpotGamma and is a Benzinga reporter.
In no way should the materials herein be construed as advice. Derivatives carry a substantial risk of loss. All content is for informational purposes only.
The daily brief is a free glimpse into the prevailing fundamental and technical drivers of U.S. equity market products. Join the 900+ that read this report daily, below!
Graphic updated 6:20 AM ET. Sentiment Neutral if expected /ES open is inside of the prior day’s range. /ES levels are derived from the profile graphic at the bottom of the following section. Levels may have changed since initially quoted; click here for the latest levels. SqueezeMetrics Dark Pool Index (DIX) and Gamma (GEX) calculations are based on where the prior day’s reading falls with respect to the MAX and MIN of all occurrences available. A higher DIX is bullish. At the same time, the lower the GEX, the more (expected) volatility. Learn the implications of volatility, direction, and moneyness. Breadth reflects a reading of the prior day’s NYSE Advance/Decline indicator. VIX reflects a current reading of the CBOE Volatility Index (INDEX: VIX) from 0-100.
Fundamental
A hot topic over the past sessions is speculation on the Federal Reserve’s (Fed) next steps and the impact those steps may have.
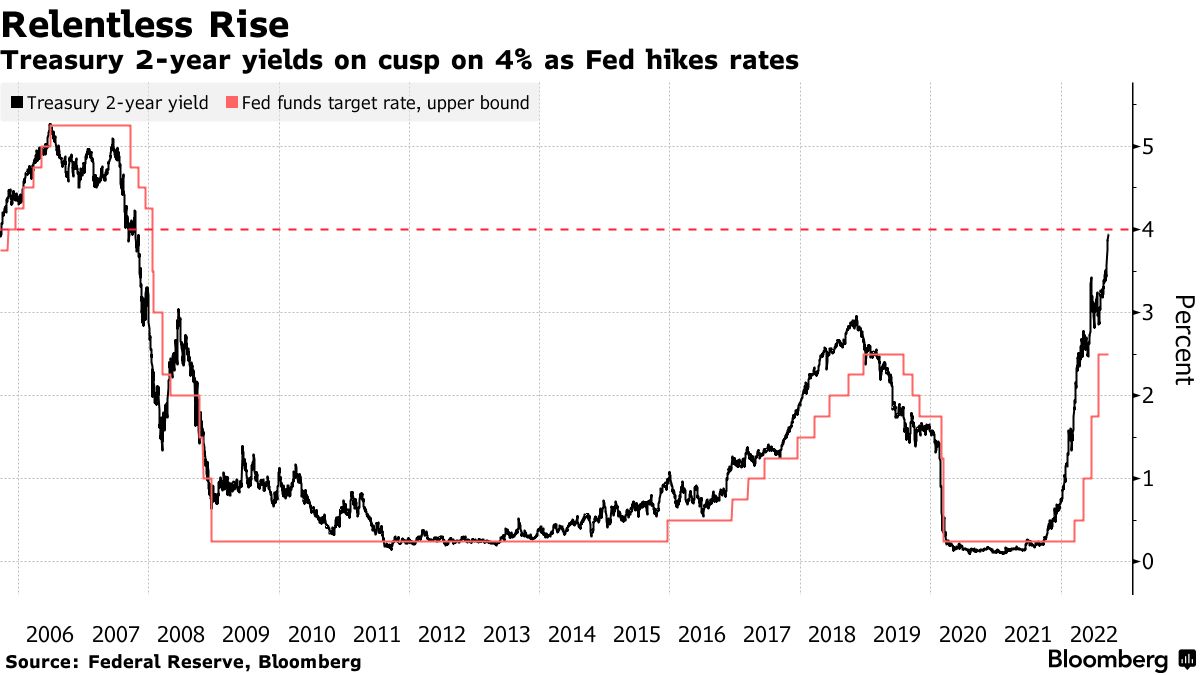
Further, in the news, last night, aside from the prospects of another big hike, was “the biggest annual increase since 1994” in two-year Treasury yields. That’s in part due to recent upside surprises in inflation talked about yesterday and last week.
Graphic: Retrieved from Bloomberg. US Government Bonds 2 YR Yield and Fed Funds.
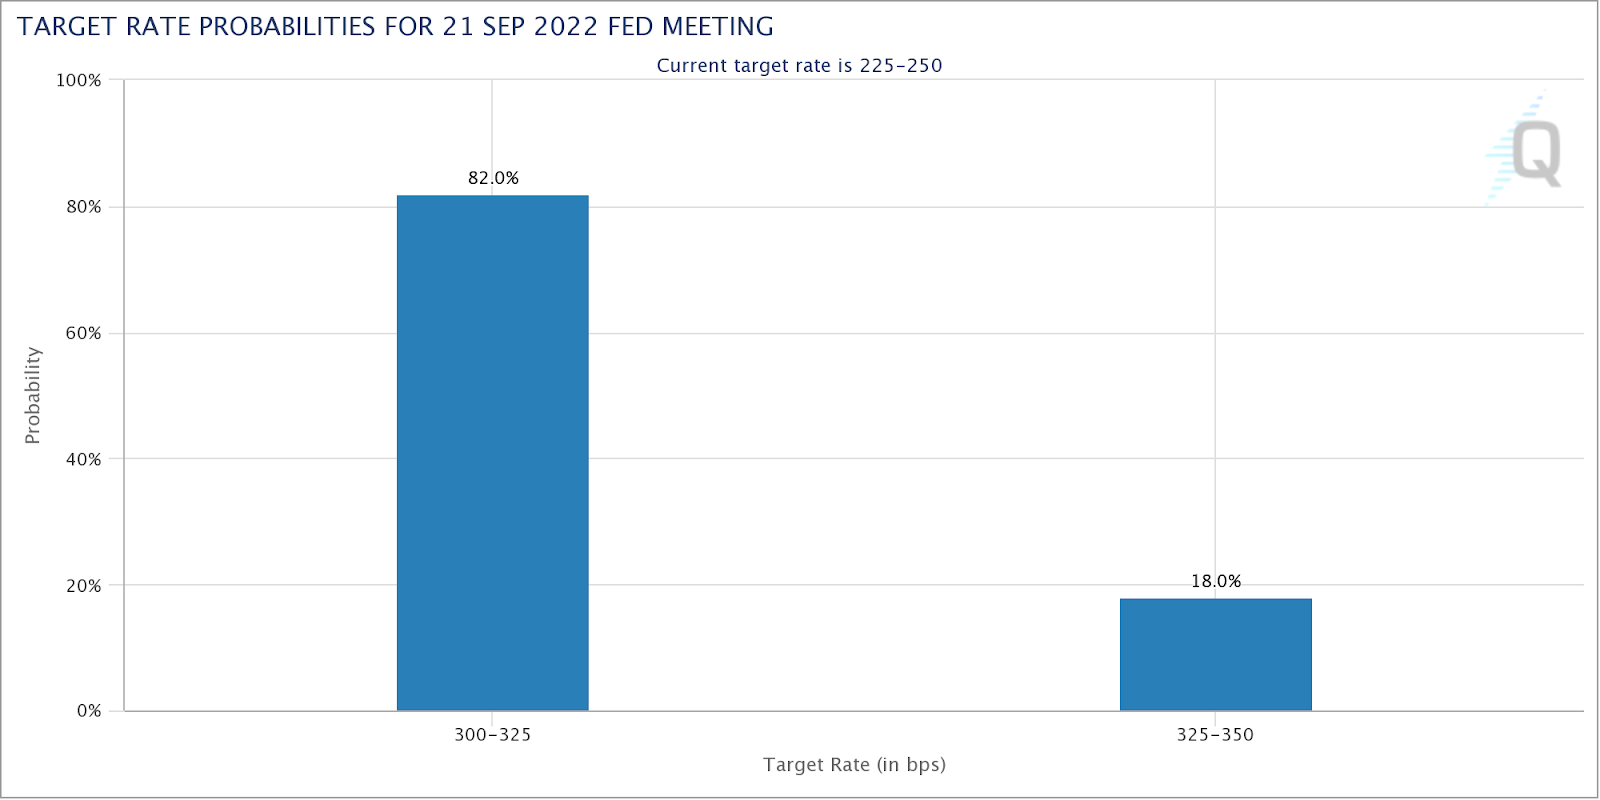
Per the CME Group Inc’s (NASDAQ: CME) FedWatch Tool, there’s a near-80% chance of a 50 to 75 basis point bump to the target rate, as the Fed looks to stem inflation.
Graphic: Retrieved from CME Group Inc (NASDAQ: CME).
This is all the while the Fed will let their Treasuries mature and, “instead of using the proceeds to buy another Treasury,” they will “buy nothing and reduce their balance sheet,” explained the Damped Spring’s Andy Constan.
Accordingly, “to pay that bond off, the US Treasury has to issue a bond,” and this bond will need to be “bought by the private sector” which has “to sell something to buy the bond, and that starts at the riskiest asset,” like crypto, watches, and cars, for instance.
Let’s unpack this further, below.
The transmission mechanism of quantitative easing (QE) and tightening (QT) is very weak “to economic activity but very strong to financial markets.”
In a detailed explainer, initially quoted in the September 16 letter, we learned “QE creates new reserves on bank balance sheets. The added cushion gives banks … more room to lend or to finance trading activity by hedge funds, … further enhancing market liquidity.”
Therefore, QE (QT) will mildly inflate (deflate) the economy as asset owners are pushed further out (in) on the risk curve. In practice, with QE, owners get pushed from Treasury to corporate bonds, bonds to equities, equities to crypto, and, finally, homes, watches, cars, and beyond.
With QT, as put forth, earlier, the reverse happens.
As Joseph Wang, author of Central Banking 101, said, in short, with QT “consumers have less wealth to spend” and this means that drops in financial markets and the tightening of “financial conditions impact the real economy,” negatively, albeit not as harshly as a rise in interest rates.
Unpacking further, with the Treasury set to increase issuance, thus boosting the government’s checking account, or Treasury General Account (TGA), “the level of reserves in the banking system declines, or the level of RRP could also decline,” Wang added.
This is as all of the above are liabilities to the Fed. Therefore, money comes out of the economy, via a fall in reserves, and this is put into the government’s checking account (TGA boost).
The linked reduction in bank deposits and reserves bolsters “repurchase agreement rates and borrowing benchmarks linked to them,” per Bloomberg. This, then, may play into “an additional tightening of overall financial conditions,” as mentioned, earlier.
Graphic: Via Physik Invest. Data compiled by @jkonopas623. Fed Balance Sheet data, here. Treasury General Account Data, here. Reverse Repo data, here. NL = BS – TGA – RRP.
Here’s a provision.
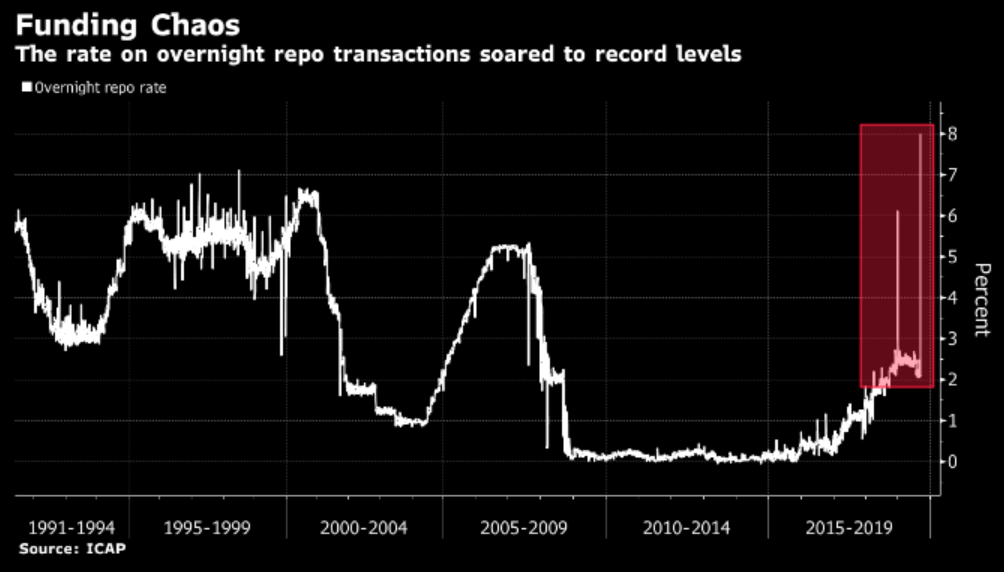
It’s the case that the Fed believes it needs a certain level of reserves for the proper functioning of the financial system (~$2 trillion). Wang explained that in 2019, banks dumped a lot of their reserves into repo to earn some extra return.
When QT was about to end, there was less money in their reserves which preceded a spike in rates and a blow-up among those who needed the money the most, as explained here.
“The Fed saw the system breaking at around 8% GDP and thinks that is where the limit is,” he added. “This suggests, going forward, the Fed is going to have to do something to top up the reserves in the banking system, and they have tools to do that.”
What’s the result, then?
These tools include capping the RRP, “forcing money out into the banking system,” as well as modifying the supplementary leverage ratio (SLR), making it “cheaper for banks to maintain a large balance sheet.”
Together, this, ultimately, may increase “the capacity of banks to make loans [and] create credit, so that is financial easing.”
As Wang said in another work best: These “easing effects may even overwhelm the tightening impact of a marginally longer QT.”
So, what can we expect?
In terms of timelines, Wang puts forth that economic data will likely prompt a mid-2023 cut in rates, which is in line with what the futures market is pricing.
Graphic: Retrieved from CME Group Inc (NASDAQ: CME).
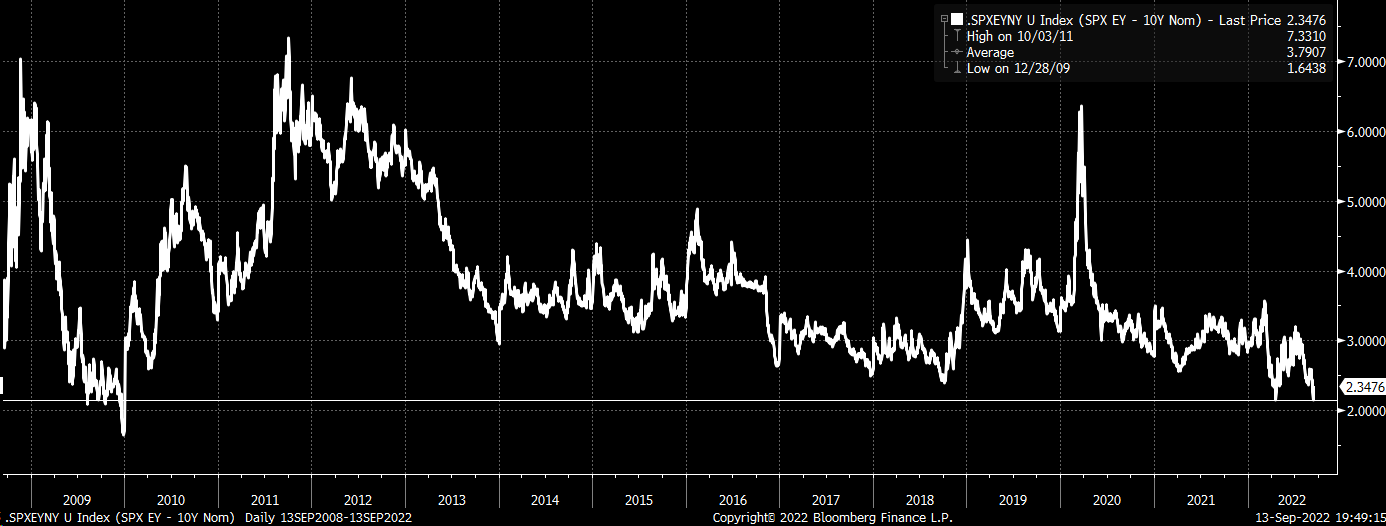
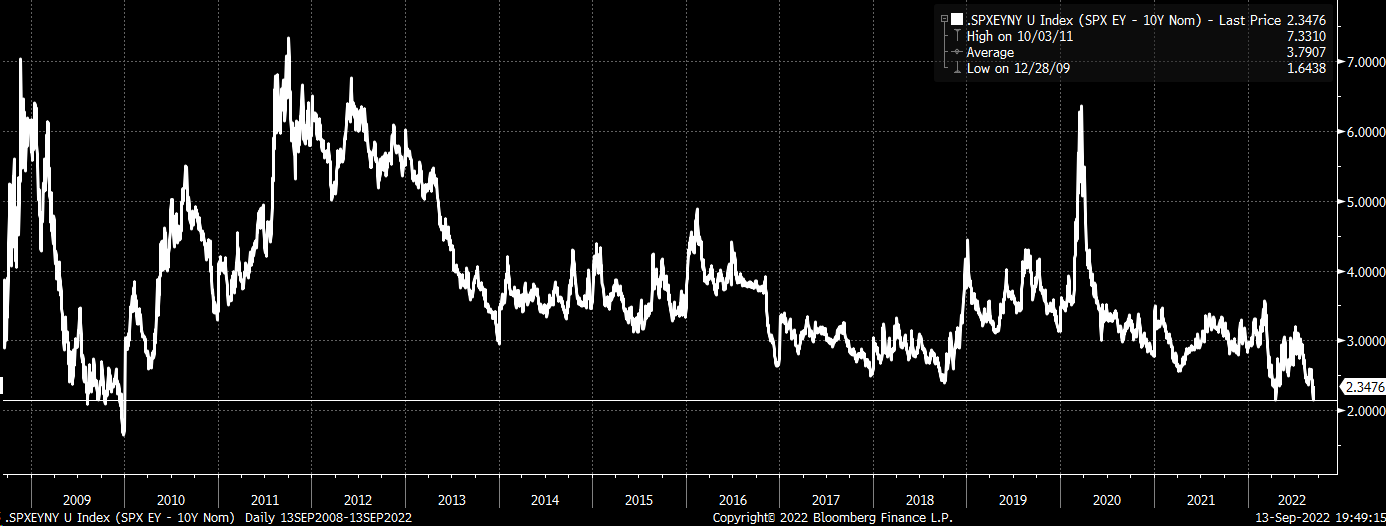
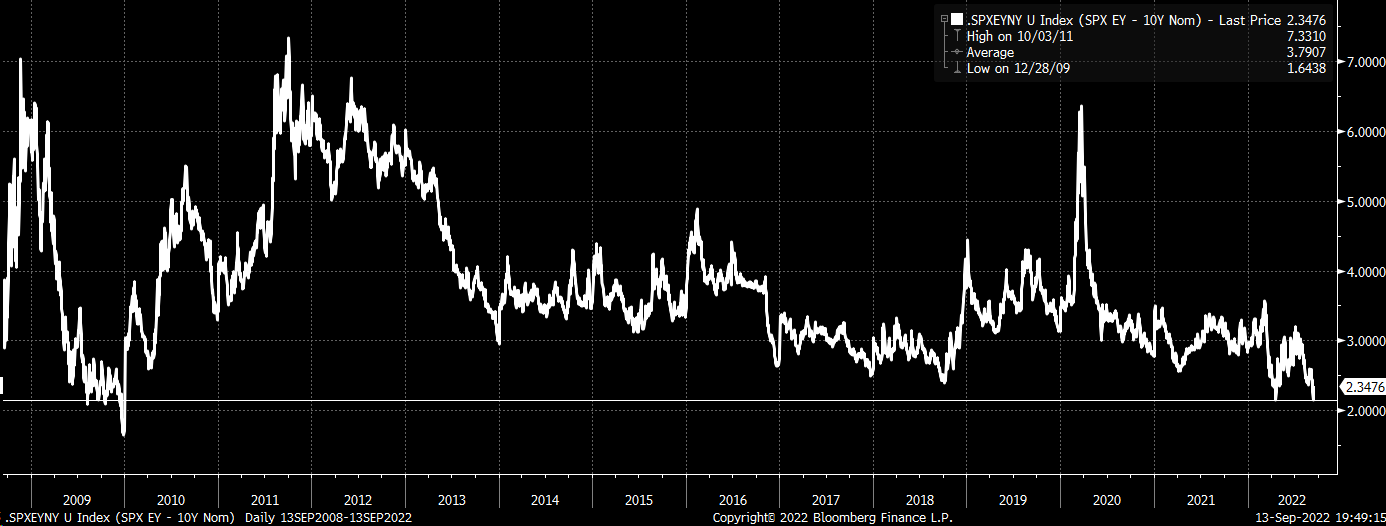
Before then, traders are pricing nearly 225 to 250 basis points of rate increases. Based on where rates are at, now, some argue the market may still be too expensive.
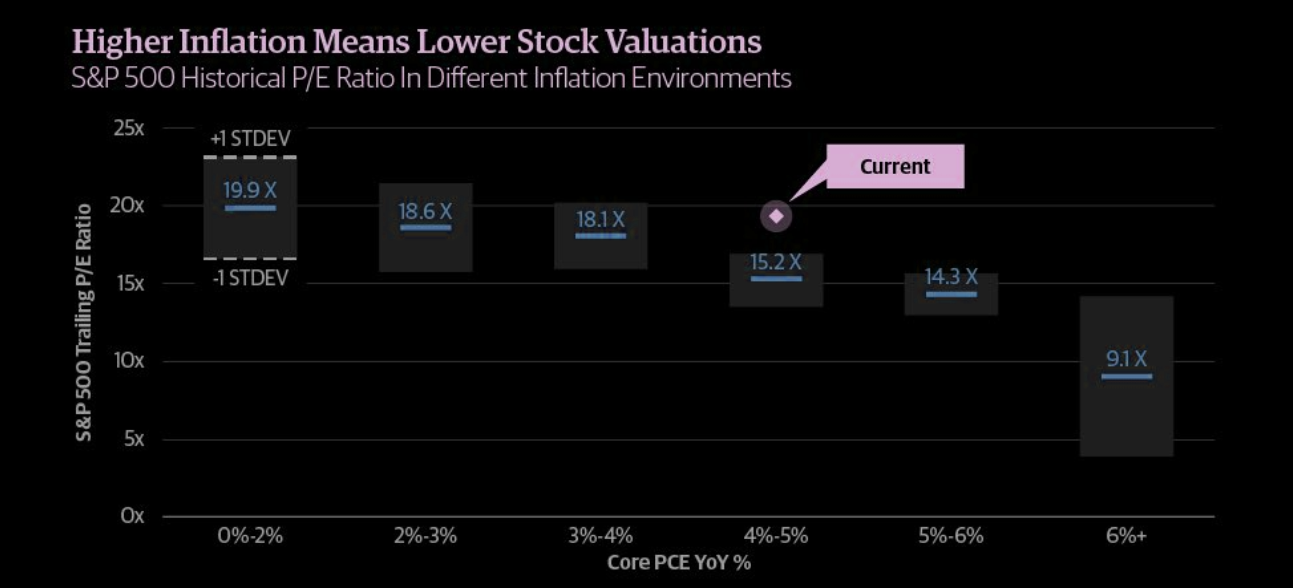
Graphic: Retrieved from Bloomberg via Michael J. Kramer. “What is amazing is how expensive this market is relative to rates. The spread between the S&P 500 Earnings yield and the 10-Yr nominal rate is at multi-year lows.”
Positioning
We’ve talked about this before but what is expected, after Wednesday’s Fed update, is a move that is “structural,” as Kai Volatility’s Cem Karsan has put it before, and “a function of inevitable rebalancing of dealer inventory post-event.”
“The second move and final resolution, if you wait for it, is usually tied to the incremental effects on liquidity (QE/QT).”
Should participants’ fears with respect to the pace of tightening, for one, be assuaged, then it is likely that the protection demanded heading into the meeting, that’s bidding measures of implied volatility (IVOL), is supplied. This likely provides a boost.
From thereon, markets are more at the whims of macro-type positioning on rising rates and the withdrawal of liquidity.
Technical
As of 6:20 AM ET, Tuesday’s regular session (9:30 AM – 4:00 PM ET), in the S&P 500, is likely to open in the lower part of a negatively skewed overnight inventory, inside of prior-range and -value, suggesting a limited potential for immediate directional opportunity.
In the best case, the S&P 500 trades higher.
Any activity above the $3,909.25 MCPOC puts into play the $3,936.25 ONH. Initiative trade beyond the ONH could reach as high as the $3,964.75 HVNode and $4,001.00 VPOC, or higher.
In the worst case, the S&P 500 trades lower.
Any activity below the $3,909.25 MCPOC puts into play the $3,885.00 VPOC. Initiative trade beyond the VPOC could reach as low as the $3,857.25 and $3,826.25 HVNode, or lower.
Click here to load today’s key levels into the web-based TradingView charting platform. Note that all levels are derived using the 65-minute timeframe. New links are produced, daily.
Graphic: 65-minute profile chart of the Micro E-mini S&P 500 Futures.
Definitions
Volume Areas: A structurally sound market will build on areas of high volume (HVNodes). Should the market trend for long periods of time, it will lack sound structure, identified as low volume areas (LVNodes). LVNodes denote directional conviction and ought to offer support on any test.
If participants were to auction and find acceptance into areas of prior low volume (LVNodes), then future discovery ought to be volatile and quick as participants look to HVNodes for favorable entry or exit.
POCs: POCs are valuable as they denote areas where two-sided trade was most prevalent in a prior day session. Participants will respond to future tests of value as they offer favorable entry and exit.
MCPOCs: POCs are valuable as they denote areas where two-sided trade was most prevalent over numerous day sessions. Participants will respond to future tests of value as they offer favorable entry and exit.
About
After years of self-education, strategy development, mentorship, and trial-and-error, Renato Leonard Capelj began trading full-time and founded Physik Invest to detail his methods, research, and performance in the markets.
Capelj also develops insights around impactful options market dynamics at SpotGamma and is a Benzinga reporter.
In no way should the materials herein be construed as advice. Derivatives carry a substantial risk of loss. All content is for informational purposes only.
The daily brief is a free glimpse into the prevailing fundamental and technical drivers of U.S. equity market products. Join the 900+ that read this report daily, below!
Graphic updated 6:50 AM ET. Sentiment Risk-Off if expected /ES open is below the prior day’s range. /ES levels are derived from the profile graphic at the bottom of the following section. Levels may have changed since initially quoted; click here for the latest levels. SqueezeMetrics Dark Pool Index (DIX) and Gamma (GEX) calculations are based on where the prior day’s reading falls with respect to the MAX and MIN of all occurrences available. A higher DIX is bullish. At the same time, the lower the GEX, the more (expected) volatility. Learn the implications of volatility, direction, and moneyness. Breadth reflects a reading of the prior day’s NYSE Advance/Decline indicator. VIX reflects a current reading of the CBOE Volatility Index (INDEX: VIX) from 0-100.
Administrative
A longer note so stick with me!
Updates are pending for the above dashboard. Exciting! Beyond this, the newsletter is getting a revamp in other parts. If you have any feedback on what should be changed, please comment!
Also, I am going to refer everyone to a conversation between Joseph Wang and Andy Constan, as well as some updates Cem Karsan of Kai Volatility made (HERE and HERE). That is, in part, a primer for what we will be talking more about, soon.
Fundamental
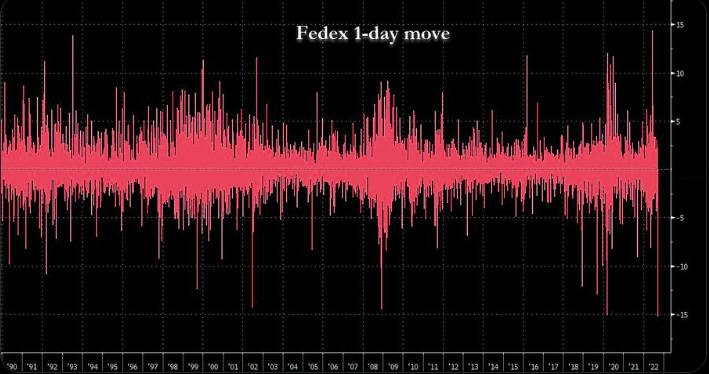
Talked about yesterday was the prospects of contractionary monetary policy reducing inflation and growth. BlackRock Inc (NYSE: BLK) strategists, even, put forth that a “deep recession” is needed to stem inflation. In short, “there is no way around this,” they claim.
Graphic: Retrieved from The Market Ear. FedEx Corporation (NYSE: FDX) sold 20% on warning about the global economy.
From thereon, we talked about how rates rising would “bring private sector credit growth down,” as well as “private sector spending and, hence, the economy.”
Based on where rates are at, the market may still be too expensive.
Graphic: Retrieved from Bloomberg via Michael J. Kramer. “What is amazing is how expensive this market is relative to rates. The spread between the S&P 500 Earnings yield and the 10-Yr nominal rate is at multi-year lows.”
On the other hand, some argue inflation peaks are in. ARK Invest’s Cathie Wood suggests “deflation [is] in the pipeline, heading for the PPI, CPI, PCE Deflator.”
Tesla Inc’s (NASDAQ: TSLA) Elon Musk added that he thinks the Federal Reserve (Fed) may make a mistake noting “a major Fed rate hike risks deflation.” Musk suggested the Fed should drop 0.25%, basing his decision on non-lagging indicators, unlike the Fed.
That’s not in line with what CME Group Inc’s (NASDAQ: CME) FedWatch tool shows. Through this tool we see traders pricing an 80% chance of a 0.50-0.75% hike, all the while quantitative tightening (reducing Fed Treasuries and mortgage-backed securities holdings) accelerated on September 15.
UST and MBS will roll off (which could turn into “outright sales”) at a pace of $95 billion per month, now, increasing competition for funding among commercial banks, and bolstering borrowing costs, as explained, below.
Graphic: Via Physik Invest. Data compiled by @jkonopas623. Fed Balance Sheet data, here. Treasury General Account Data, here. Reverse Repo data, here. NL = BS – TGA – RRP.
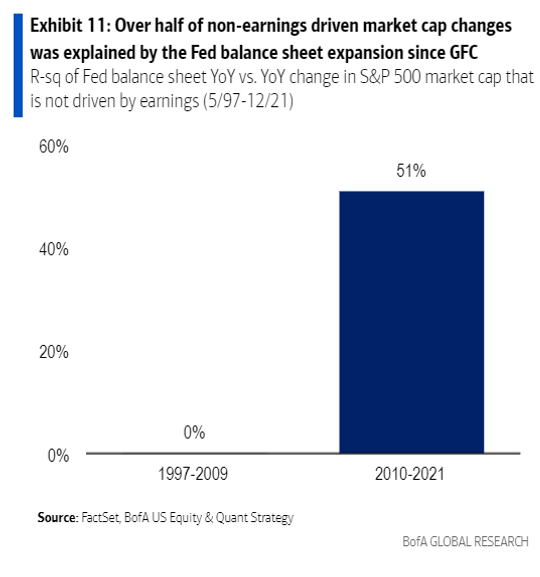
According to Bank of America Corporation (NYSE: BAC), since 2010, nearly 50% of the moves in market price-to-earnings multiples were explained by quantitative easing (QE), the inverse of QT, through which the Fed (or central banks, in general) creates credit used to buy securities in open markets, MarketWatch explains.
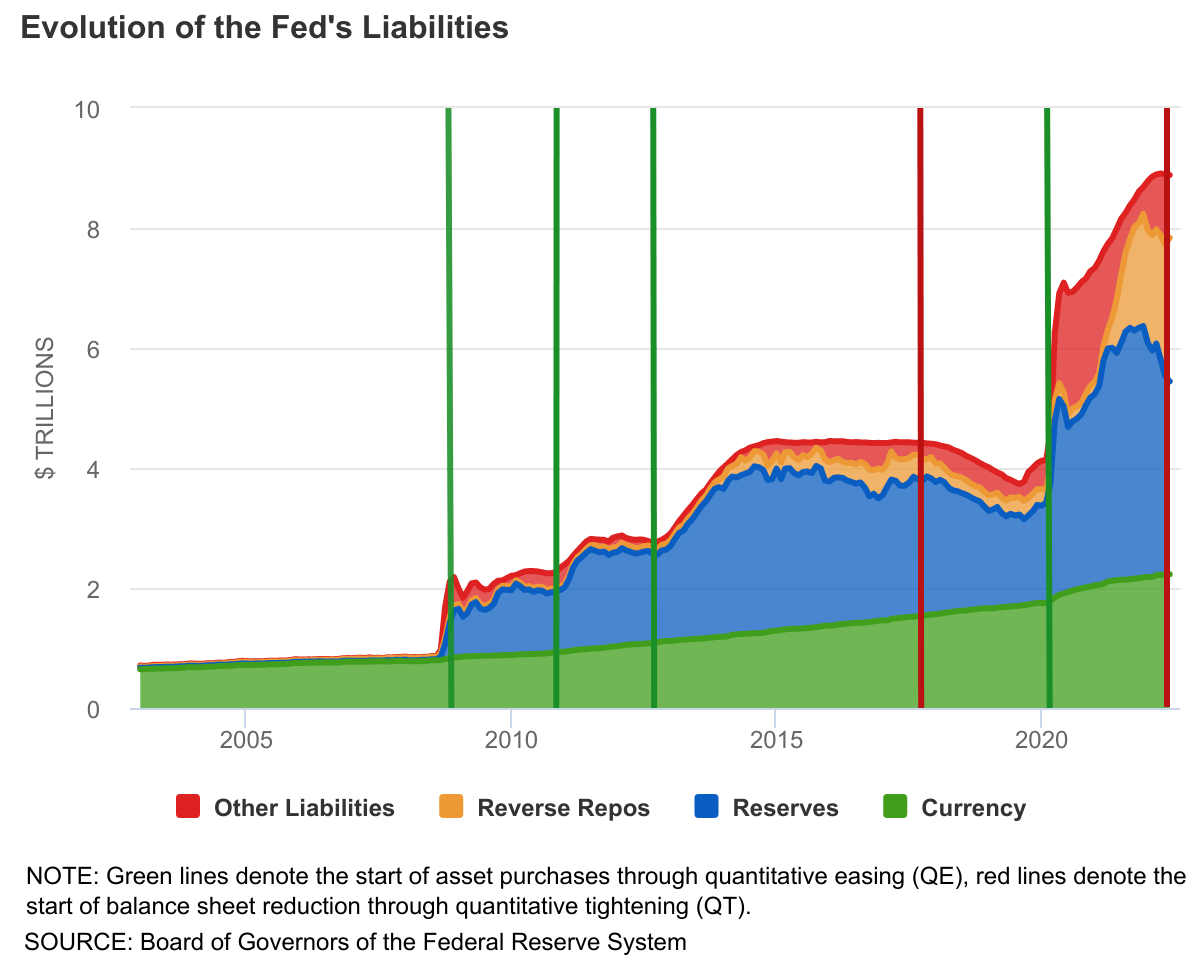
Graphic: Retrieved from the Federal Reserve Bank of Richmond. “The Fed Is Shrinking Its Balance Sheet. What Does That Mean?”
The “purchases of long-dated bonds are intended to drive down yields, which is seen enhancing appetite for risk assets as investors look elsewhere for higher returns. QE creates new reserves on bank balance sheets. The added cushion gives banks, which must hold reserves in line with regulations, more room to lend or to finance trading activity by hedge funds and other financial market participants, further enhancing market liquidity.”
Graphic: Retrieved from Bank of America Corporation (NYSE: BAC) via MarketWatch.
The liability side of the Fed’s balance sheet is what “matters to financial markets.”
Thus far, “reductions in Fed liabilities have been concentrated in the Treasury General Account, or TGA, which effectively serves as the government’s checking account” to run the day-to-day business.
Given that we’re talking about balance sheets, here, Fed liabilities must match assets. Thus, a rise in the TGA must be accompanied by a decline in bank reserves (which are liabilities to the Fed). This, as a result, decreases the room banks have to “lend or to finance trading activity by hedge funds and other financial market participants, [which] further [cuts into] market liquidity.”
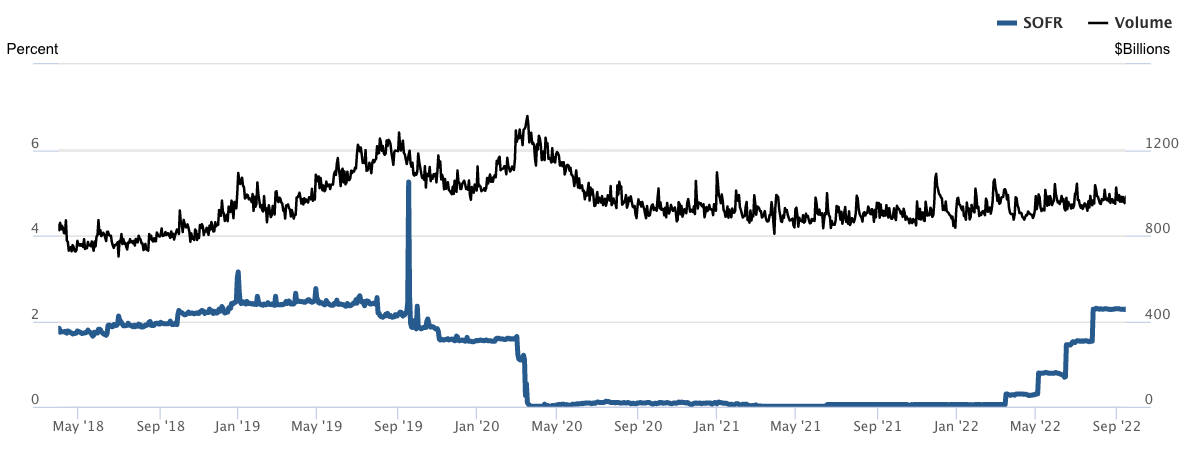
With the Treasury set to increase debt issuance, boosting TGA, it will effectively take “money out of the economy and put[] it into the government’s checking account.” The linked reduction in bank deposits and reserves bolsters “repurchase agreement rates and borrowing benchmarks linked to them, like the Secured Overnight Financing Rate,” per Bloomberg.
Graphic: Retrieved from the Federal Reserve Bank of New York. “The Secured Overnight Financing Rate (SOFR) is a broad measure of the cost of borrowing cash overnight collateralized by Treasury securities.”
Adding, this may play into “an additional tightening of overall financial conditions, in addition to the increase in the main fed funds rate target that the central bank intends to continue boosting.”
This will “put more pressure on the private sector to absorb those Treasurys, which means less money to put into other assets” that may be riskier, like equities, said Aidan Garrib, the head of global macro strategy and research at Montreal-based PGM Global.
Positioning
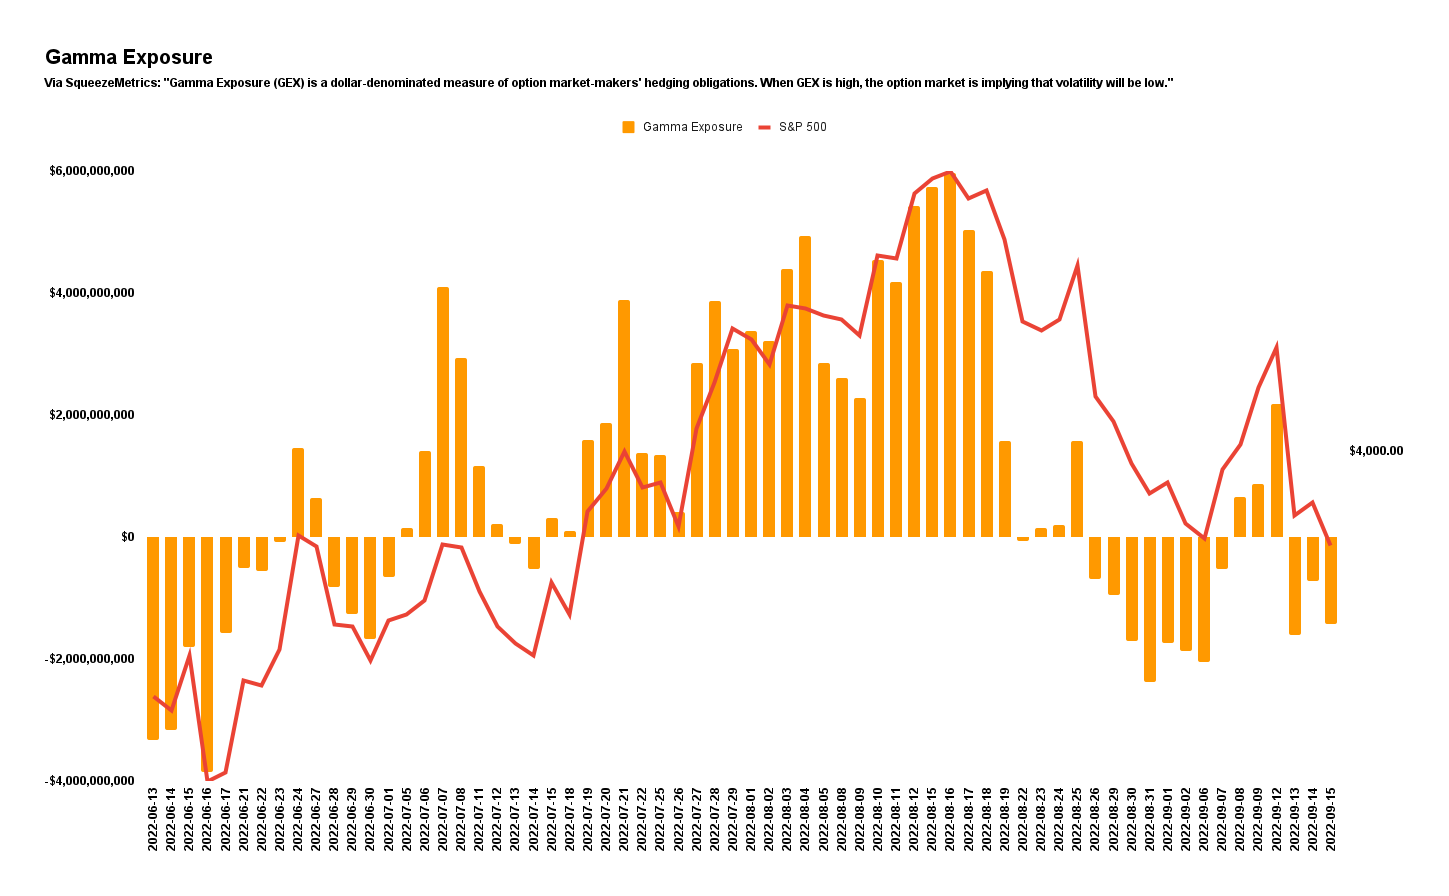
As of 6:50 AM ET, Friday’s expected volatility, via the Cboe Volatility Index (INDEX: VIX), sits at ~1.44%. Net gamma exposures decreasing may promote generally more expansive ranges.
Graphic: Via Physik Invest. Data retrieved from SqueezeMetrics.
Given where realized (RVOL) and implied (IVOL) volatility measures are, as well as skew, it is beneficial to be a buyer of options structures.
This is as there’s been a lot of speculation, particularly on the downside (put options), setting the stage for a more volatile and fragile market environment, says Kai Volatility’s Cem Karsan.
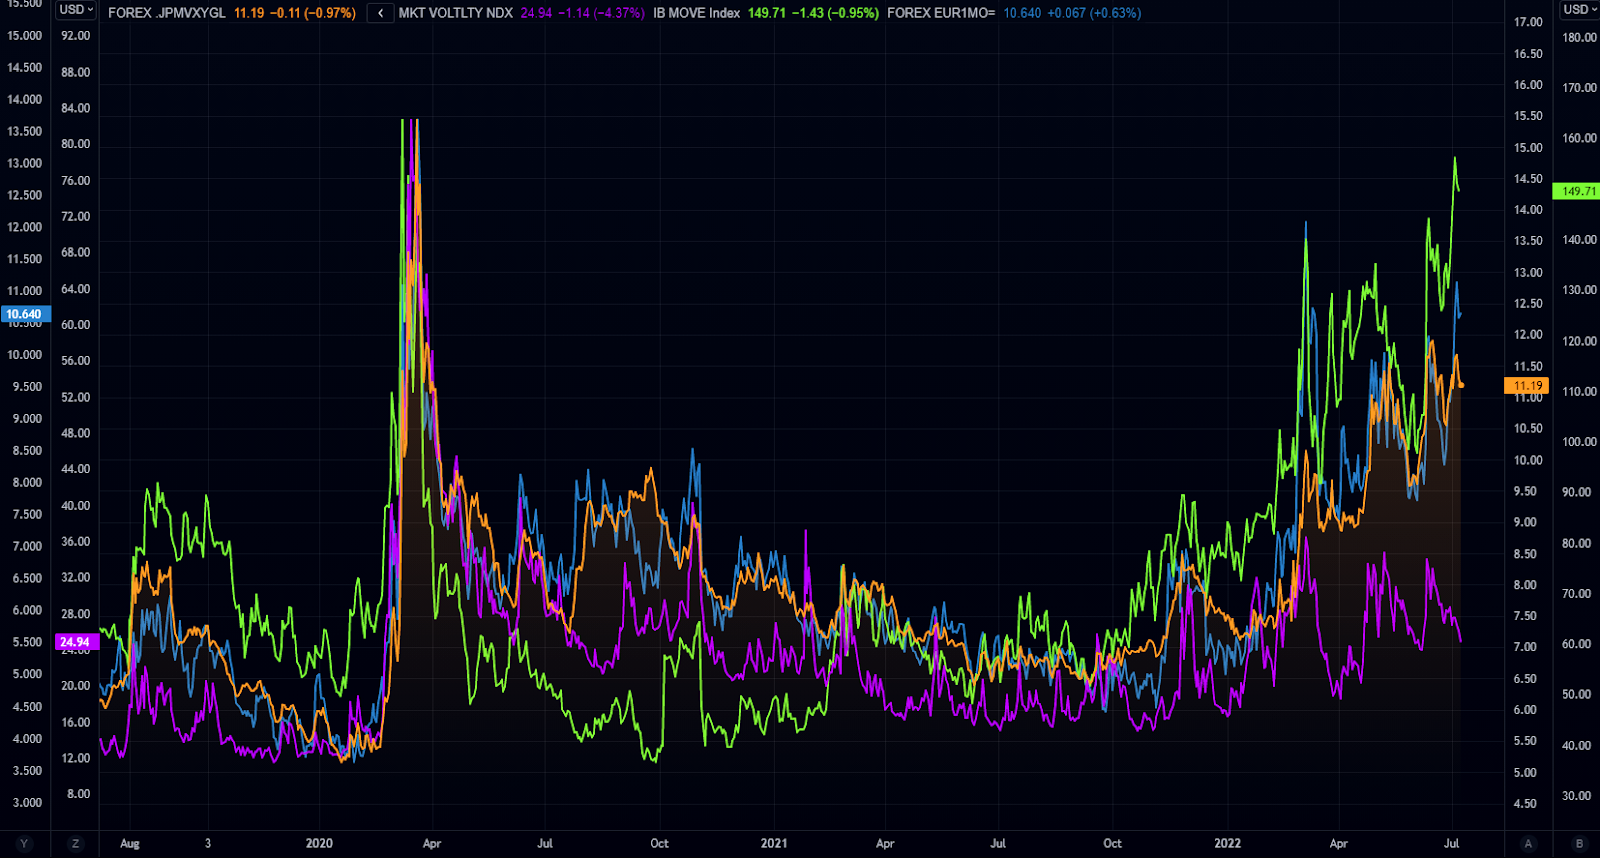
“On the index level, people are not well hedged,” a departure from what the case was heading into and through much of 2022. It’s the case that heading into 2022, traders were well hedged. Into and through the decline, traders’ monetization of existing hedges, as well as counterparty reactions, “compressed volatility” realized across US equities, as explained on July 15, 2022.
This made for some attractive trade opportunities seen here.
Graphic: Retrieved from The Market Ear. “VIX has decoupled from cross-asset volatilities.”
Now, given that the go-to trade is to sell stock and puts, short interest has grown, as have other risks, associated with this activity; essentially people are “los[ing] faith in convexity and risk premia’s ability to work,” as a result of “poor performance of vol,” and, the reaction to their “pain and financial loss,” is setting the stage for tail risks heading into the Q1 and Q2 2023.
The sale (purchase) of the front (back) expirations will bolster market pinning; as SpotGamma puts forth, “the positive impact of put closers and rolls, as well as decay,” is easing the market drop. However, this “positioning likely compounds drops and adds to volatility,” in the future.
To quote: “Though the removal of put-heavy exposures can boost markets higher, too add, the positive impacts are dulled via the demand for put exposures at much lower prices.”
Graphic: Retrieved from SpotGamma.
These particular options, which are at much lower prices, “are far more sensitive to changes in direction and IVOL,” as I explained in a SpotGamma note. These options can go “from having very little Delta (exposure to direction) to a lot more Delta on the move lower,” quickly.
Graphic: Via Mohamed Bouzoubaa et al’s Exotic Options and Hybrids.
“If we maintain that liquidity providers are short those puts, a positive Delta trade, then those liquidity providers [will sell] futures and stock, a negative Delta trade to stay hedged.”
Graphic: Via Banco Santander SA (NYSE: SAN) research.
Technical
As of 6:50 AM ET, Friday’s regular session (9:30 AM – 4:00 PM ET), in the S&P 500, is likely to open in the lower part of a negatively skewed overnight inventory, outside of prior-range and -value, suggesting a potential for immediate directional opportunity.
In the best case, the S&P 500 trades higher.
Any activity above the $3,909.25 MCPOC puts into play the $3,935.00 VPOC. Initiative trade beyond the latter could reach as high as the $3,964.75 HVNode and $4,001.00 VPOC, or higher.
In the worst case, the S&P 500 trades lower.
Any activity below the $3,909.25 MCPOC puts into play the $3,857.25 HVNode. Initiative trade beyond the latter could reach as low as the $3,826.25 and $3,770.75 HVNodes, or lower.
Click here to load today’s key levels into the web-based TradingView charting platform. Note that all levels are derived using the 65-minute timeframe. New links are produced, daily.
Graphic: 65-minute profile chart of the Micro E-mini S&P 500 Futures.
Considerations: A feature of this 2022 down market was responsiveness near key-technical areas (that are discernable visually on a chart). This suggested to us that technically-driven traders with shorter time horizons were very active.
Such traders often lack the wherewithal to defend retests and, additionally, the type of trade may be indicative of the other time frame participants waiting for more information to initiate trades.
That’s changing. The key levels, quoted above, are snapping far easier and are not as well respected. That means other time frame participants with wherewithal are initiating trades.
Those are the participants you should not fade.
Definitions
Volume Areas: A structurally sound market will build on areas of high volume (HVNodes). Should the market trend for long periods of time, it will lack sound structure, identified as low volume areas (LVNodes). LVNodes denote directional conviction and ought to offer support on any test.
If participants were to auction and find acceptance into areas of prior low volume (LVNodes), then future discovery ought to be volatile and quick as participants look to HVNodes for favorable entry or exit.
POCs: POCs are valuable as they denote areas where two-sided trade was most prevalent in a prior day session. Participants will respond to future tests of value as they offer favorable entry and exit.
MCPOCs: POCs are valuable as they denote areas where two-sided trade was most prevalent over numerous day sessions. Participants will respond to future tests of value as they offer favorable entry and exit.
Gamma: Gamma is the sensitivity of an option to changes in the underlying price. Dealers that take the other side of options trades hedge their exposure to risk by buying and selling the underlying. When dealers are short-gamma, they hedge by buying into strength and selling into weakness. When dealers are long-gamma, they hedge by selling into strength and buying into weakness. The former exacerbates volatility. The latter calms volatility.
About
After years of self-education, strategy development, mentorship, and trial-and-error, Renato Leonard Capelj began trading full-time and founded Physik Invest to detail his methods, research, and performance in the markets.
Capelj also develops insights around impactful options market dynamics at SpotGamma and is a Benzinga reporter.
In no way should the materials herein be construed as advice. Derivatives carry a substantial risk of loss. All content is for informational purposes only.
The daily brief is a free glimpse into the prevailing fundamental and technical drivers of U.S. equity market products. Join the 900+ that read this report daily, below!
Graphic updated 7:45 AM ET. Sentiment Neutral if expected /ES open is inside of the prior day’s range. /ES levels are derived from the profile graphic at the bottom of the following section. Levels may have changed since initially quoted; click here for the latest levels. SqueezeMetrics Dark Pool Index (DIX) and Gamma (GEX) calculations are based on where the prior day’s reading falls with respect to the MAX and MIN of all occurrences available. A higher DIX is bullish. At the same time, the lower the GEX, the more (expected) volatility. Learn the implications of volatility, direction, and moneyness. Breadth reflects a reading of the prior day’s NYSE Advance/Decline indicator. VIX reflects a current reading of the CBOE Volatility Index (INDEX: VIX) from 0-100.
Administrative
Apologies – yesterday the above graphic was not properly updated. The sentiment reading was incorrect, as were a couple of other figures. Separately, a lighter note, today, followed by more in-depth stuff currently being worked on in the coming sessions. Thanks!
Fundamental
First – going to refer everyone to yesterday’s letter, a conversation between Joseph Wang and Andy Constan, as well as some updates Cem Karsan of Kai Volatility made. That is, in part, a primer for what we will be talking more about, soon.
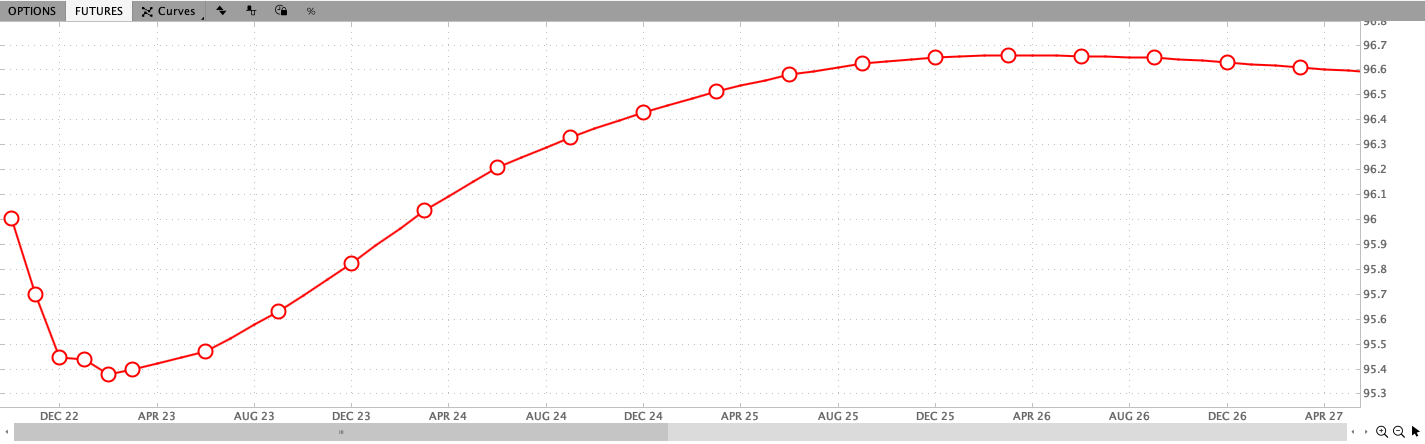
Next – we have futures markets pricing rate a peak in the overnight rate at ~4.6% in February of 2023. From thereon, rate cuts are implied.
Graphic: Via Charles Schwab Corporation’s (NYSE: SCHW) TD Ameritrade thinkorswim. Observed is the Eurodollar, the interest offered on U.S. dollar-denominated deposits held at banks outside of the U.S. (i.e., participants’ outlook on interest rates).
It’s becoming the consensus that “[f]or hikes to reduce inflation, they need to hurt growth,” Jean Boivin and Alex Brazier of BlackRock Inc (NYSE: BLK) explained.
“There is no way around this,” they add. “We estimate it would require a deep recession in the U.S., with around as much as 2% hit to growth in the U.S., and 3 million more unemployed, and an even deeper recession in Europe.”
It’s the impact of rising rates and quantitative tightening (the latter which will compound the impacts of the former) that are part of the toolkit used to cool the sticky inflation.
Graphic: Via Physik Invest. Data compiled by @jkonopas623. Fed Balance Sheet data, here. Treasury General Account Data, here. Reverse Repo data, here. NL = BS – TGA – RRP.
Ray Dalio, of Bridgewater Associates LP, said that rates rising “toward the higher end of the 4.5% to 6% range … will bring private sector credit growth down, which will bring private sector spending and, hence, the economy down with it.”
Accordingly, equity prices could plunge upwards of 20%, as a result.
Graphic: Retrieved from Bloomberg via Michael J. Kramer. “What is amazing is how expensive this market is relative to rates. The spread between the S&P 500 Earnings yield and the 10-Yr nominal rate is at multi-year lows.”
Further, per Bloomberg’s John Authers, it’s the case that “[a]ll major global synchronized crises ended with moderate inflation and low growth; that hasn’t been reached yet.” Separately, a peak in inflation “doesn’t come close to guaranteeing equity gains.”
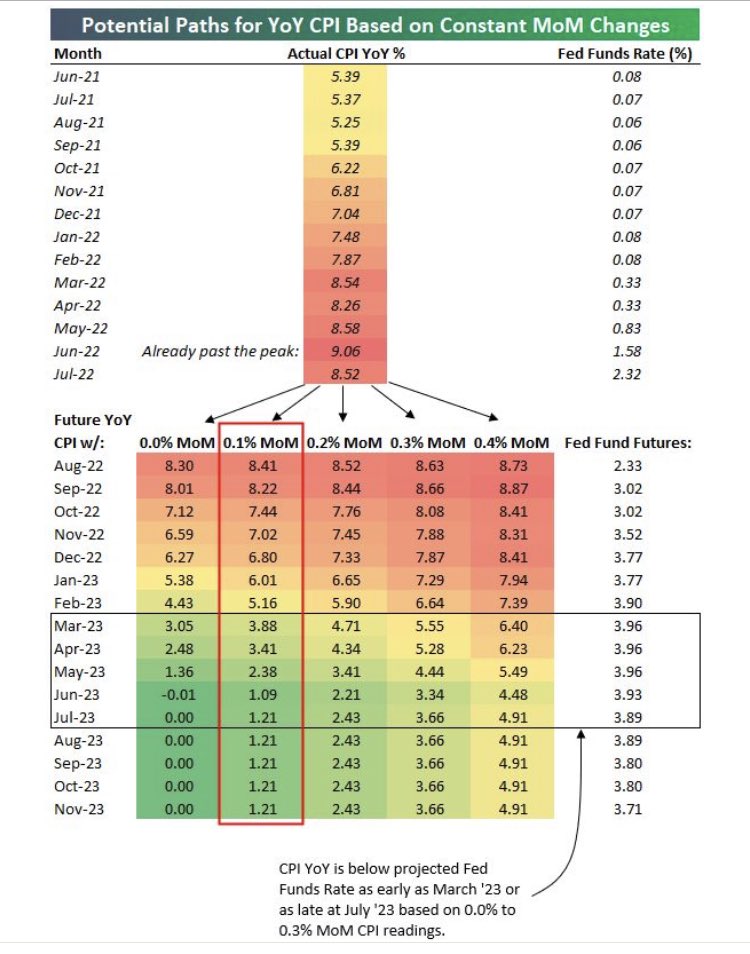
The pivot will come when there’s a “sustainable path to 2% (not 3 or 4%) inflation” and a “fed funds that is greater than CPI for a few quarters,” explained Alfonso Peccatiello of The Macro Compass.
“The timing mostly depends [on] the MoM CPI ahead,” he added, pointing to a graphic that suggests “there is no ‘pivot’ earlier than mid-2023, and it could well be later. Looking at the SOFR curve, that’s also what’s roughly priced in.”
Graphic: Retrieved from Bespoke Investment Group via Alfonso Peccatiello.
Positioning
Ahead of a multi-derivative expiry, markets are trading sideways to lower. Demands to protect equity downside (with puts), compounded macro-type selling earlier this week.
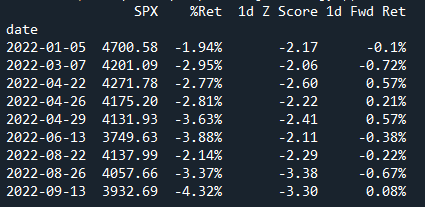
Now, with traders well hedged, Kai Volatility’s Cem Karsan put forth that there is a “race to monetize,” which is lending to “relatively flat” trade and “lack of follow-through.”
Graphic: Retrieved from Pat Hennessy. “Every large down move in SPX this year (quantified by <= -2 Zscore) has been followed by a relatively flat day/lack of follow through. Any ideas as to why this is?”
From hereon, as we said, a lot of the exposure demanded is short-dated. Should that exposure not be rolled forward in time, and allowed to expire, “SPX/ES dealers [who] are well hedged,” will unwind their hedges which may drive bullishness “through OpEx,” added Karsan.
Notwithstanding, this “has [the] potential to drive a tail post” OpEx. In [the] tech/meme market melt-up of 2020-2021, positioning was [the] exact opposite.”
Technical
As of 7:45 AM ET, Thursday’s regular session (9:30 AM – 4:00 PM ET), in the S&P 500, is likely to open in the middle part of a balanced overnight inventory, inside of prior-range and -value, suggesting a limited potential for immediate directional opportunity.
In the best case, the S&P 500 trades higher.
Any activity above the $3,965.75 HVNode puts into play the $4,001.00 VPOC. Initiative trade beyond the VPOC could reach as high as the $4,018.75 and $4,069.25 HVNodes, or higher.
In the worst case, the S&P 500 trades lower.
Any activity below the $3,965.75 HVNode puts into play the $3,925.00 VPOC. Initiative trade beyond the VPOC could reach as low as the $3,867.75 LVNode and $3,829.75 HVNode, or lower.
Click here to load today’s key levels into the web-based TradingView charting platform. Note that all levels are derived using the 65-minute timeframe. New links are produced, daily.
Graphic: 65-minute profile chart of the Micro E-mini S&P 500 Futures.
Definitions
Volume Areas: A structurally sound market will build on areas of high volume (HVNodes). Should the market trend for long periods of time, it will lack sound structure, identified as low volume areas (LVNodes). LVNodes denote directional conviction and ought to offer support on any test.
If participants were to auction and find acceptance into areas of prior low volume (LVNodes), then future discovery ought to be volatile and quick as participants look to HVNodes for favorable entry or exit.
POCs: POCs are valuable as they denote areas where two-sided trade was most prevalent in a prior day session. Participants will respond to future tests of value as they offer favorable entry and exit.
MCPOCs: POCs are valuable as they denote areas where two-sided trade was most prevalent over numerous day sessions. Participants will respond to future tests of value as they offer favorable entry and exit.
About
After years of self-education, strategy development, mentorship, and trial-and-error, Renato Leonard Capelj began trading full-time and founded Physik Invest to detail his methods, research, and performance in the markets.
Capelj also develops insights around impactful options market dynamics at SpotGamma and is a Benzinga reporter.
In no way should the materials herein be construed as advice. Derivatives carry a substantial risk of loss. All content is for informational purposes only.
The daily brief is a free glimpse into the prevailing fundamental and technical drivers of U.S. equity market products. Join the 850+ that read this report daily, below!
Graphic updated 8:00 AM ET. Sentiment Risk-On if expected /ES open is above the prior day’s range. /ES levels are derived from the profile graphic at the bottom of the following section. Levels may have changed since initially quoted; click here for the latest levels. SqueezeMetrics Dark Pool Index (DIX) and Gamma (GEX) calculations are based on where the prior day’s reading falls with respect to the MAX and MIN of all occurrences available. A higher DIX is bullish. At the same time, the lower the GEX, the more (expected) volatility. Learn the implications of volatility, direction, and moneyness. Breadth reflects a reading of the prior day’s NYSE Advance/Decline indicator. VIX reflects a current reading of the CBOE Volatility Index (INDEX: VIX) from 0-100.
Fundamental
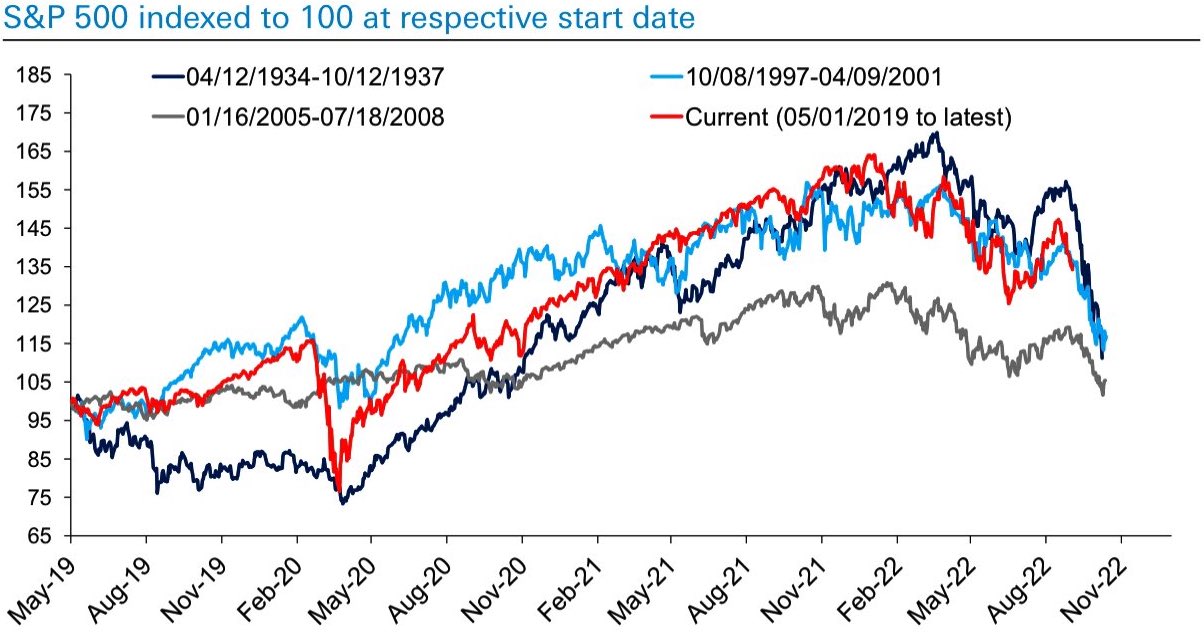
As much as it may be a so-called chart crime to overlap past market environments and project or forecast what may happen, it’s quite eerie that today’s path of returns appears similar to that of 1394-1937, 2005-2008, and 1997-2001, for example.
Graphic: Retrieved from Deutsche Bank AG (NYSE: DB).
Moreover, this time around, it’s the case that markets have fallen on participants’ pricing of higher interest rates and quantitative tightening (QT).
Graphic: Retrieved from The Market Ear. Via Guggenheim Partners.
Some argue there is more to go on the pricing of a potential economic slowing happening here, in the U.S., abroad in China, and beyond.
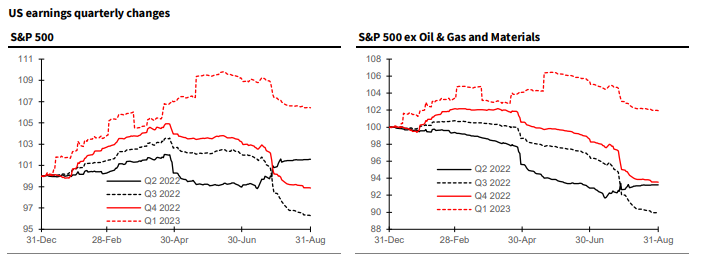
Graphic: Retrieved from Bloomberg. “Earnings are related to the economic cycle, but not tightly, and expectations for next year are intertwined with macroeconomic concerns.”
Notwithstanding, and we will end the fundamental section with this, today, Credit Suisse Group AG’s (NYSE: CS) Jonathan Golub puts forth the following:
“Although revisions are negative, projected EPS growth rates remain positive for the remainder of 2022-23. While 3Q growth has fallen to 4.7%, EPS should expand 9-10%, assuming similar beats as experienced in 2Q. Historically, earnings hold up best when inflation is elevated. Many investors are interpreting the recent decline in estimates as a harbinger to recession. Our work shows that in high inflationary periods (1973, 1980, 1981) earnings peak just 2 months prior to a recession’s onset. With EPS growth projections still positive, revisions would have to fall much more to signal an economic contraction.”
Positioning
Referring traders to a recent case study (HERE) on how to play this market environment, as well as the impacts of implied volatility (IVOL) compression September 8 (HERE).
After a period of sideways-to-lower, markets are rebounding, boosted by IVOL compression and traders’ re-positioning ahead of potential including inflation and monetary policy updates.
Notwithstanding, as Kai Volatility’s Cem Karsan well explained to Charles Schwab Corporation’s (NYSE: SCHW) TD Ameritrade Network, traders must look out for the “window of real risk.”
The energy for a downside move “is significant” after this year’s decimation of “skew and volatility,” he said. “Hedging for convexity is in the 5th percentile.”
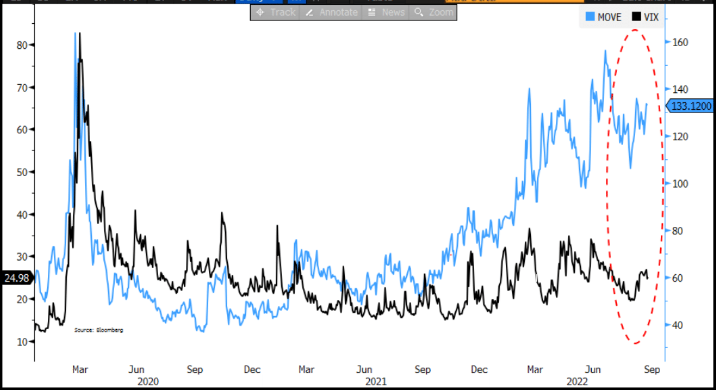
This is because participants hedged heading into the decline, and sold skew as the markets explored lower. After the current period of volatility supply passes, Karsan added, and markets were to trade lower, there is the risk of a reach for protection and a fatter tail.
Graphic: Merrill Lynch Options Volatility Estimate (INDEX: MOVE), a measure of volatility for the US Treasury market, versus the Cboe Volatility Index (INDEX: VIX), a measure of volatility for the equity market, diverged this year. This is, in part, due to the supply of volatility in equities.
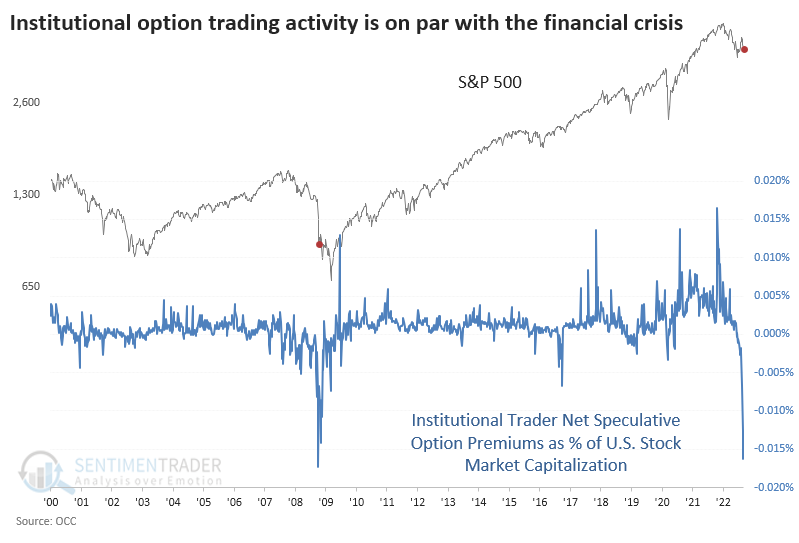
Should nothing happen, then the unwind of the recent speculation amongst “family offices and institutions front-running the speculative hedges that are more than 50 units,” will add support.
Graphic: Retrieved from SentimenTrader on September 7, 2022.
Technical
As of 6:40 AM ET, Friday’s regular session (9:30 AM – 4:00 PM ET), in the S&P 500, is likely to open in the upper part of a positively skewed overnight inventory, outside of prior-range and -value, suggesting a potential for immediate directional opportunity.
In the best case, the S&P 500 trades higher.
Any activity above the $4,069.25 HVNode puts into play the $4,107.00 VPOC. Initiative trade beyond the VPOC could reach as high as the $4,136.75 MCPOC and $4,189.25 LVNode, or higher.
In the worst case, the S&P 500 trades lower.
Any activity below the $4,069.25 HVNode puts into play the $4,018.75 HVNode. Initiative trade beyond the HVNode could reach as low as the $3,991.00 VPOC and $3,952.75 LVNode, or lower.
Click here to load today’s key levels into the web-based TradingView charting platform. Note that all levels are derived using the 65-minute timeframe. New links are produced, daily.
Graphic: 65-minute profile chart of the Micro E-mini S&P 500 Futures.
Considerations: Responsiveness near key-technical areas (that are discernable visually on a chart), suggests technically-driven traders with short time horizons are very active.
Such traders often lack the wherewithal to defend retests and, additionally, the type of trade may be indicative of the other time frame participants waiting for more information to initiate trades.
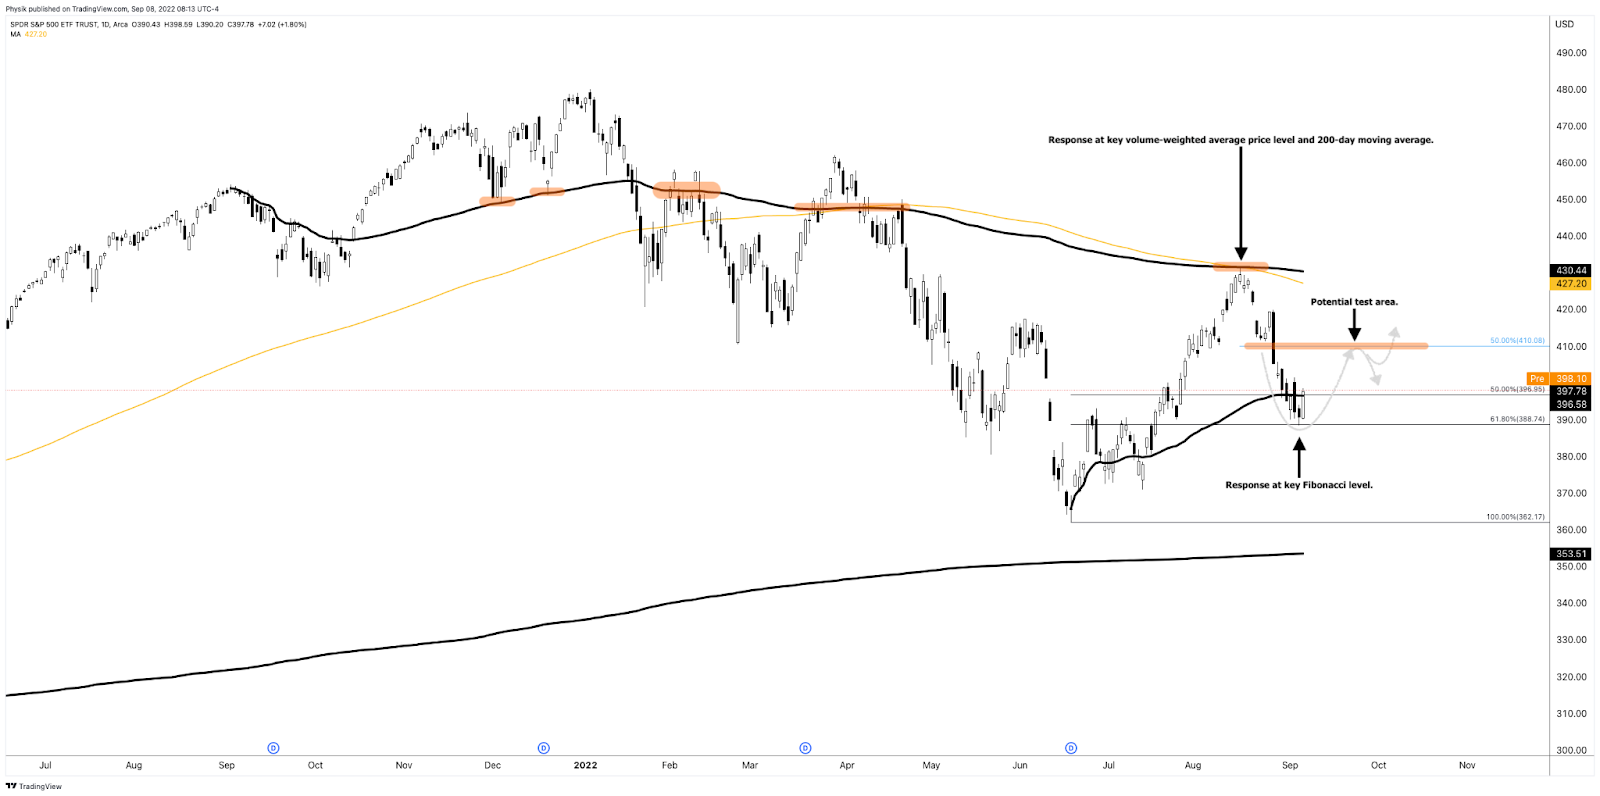
Graphic: Updated 9/8/2022. The daily chart of the SPDR S&P 500 ETF Trust (NYSE: SPY).
Definitions
Volume Areas: A structurally sound market will build on areas of high volume (HVNodes). Should the market trend for long periods of time, it will lack sound structure, identified as low volume areas (LVNodes). LVNodes denote directional conviction and ought to offer support on any test.
If participants were to auction and find acceptance into areas of prior low volume (LVNodes), then future discovery ought to be volatile and quick as participants look to HVNodes for favorable entry or exit.
POCs: POCs are valuable as they denote areas where two-sided trade was most prevalent in a prior day session. Participants will respond to future tests of value as they offer favorable entry and exit.
MCPOCs: POCs are valuable as they denote areas where two-sided trade was most prevalent over numerous day sessions. Participants will respond to future tests of value as they offer favorable entry and exit.
Volume-Weighted Average Prices (VWAPs): A metric highly regarded by chief investment officers, among other participants, for quality of trade. Additionally, liquidity algorithms are benchmarked and programmed to buy and sell around VWAPs.
About
After years of self-education, strategy development, mentorship, and trial-and-error, Renato Leonard Capelj began trading full-time and founded Physik Invest to detail his methods, research, and performance in the markets.
Capelj also develops insights around impactful options market dynamics at SpotGamma and is a Benzinga reporter.
In no way should the materials herein be construed as advice. Derivatives carry a substantial risk of loss. All content is for informational purposes only.
The daily brief is a free glimpse into the prevailing fundamental and technical drivers of U.S. equity market products. Join the 800+ that read this report daily, below!
Graphic updated 7:00 AM ET. Sentiment Risk-Off if expected /ES open is below the prior day’s range. /ES levels are derived from the profile graphic at the bottom of the following section. Levels may have changed since initially quoted; click here for the latest levels. SqueezeMetrics Dark Pool Index (DIX) and Gamma (GEX) calculations are based on where the prior day’s reading falls with respect to the MAX and MIN of all occurrences available. A higher DIX is bullish. At the same time, the lower the GEX, the more (expected) volatility. Learn the implications of volatility, direction, and moneyness. Breadth reflects a reading of the prior day’s NYSE Advance/Decline indicator. VIX reflects a current reading of the CBOE Volatility Index (INDEX: VIX) from 0-100.
Fundamental
Working through some in-depth coverage for this fundamental section. Report back, soon.
Positioning
As of 7:00 AM ET, Wednesday’s expected volatility, via the Cboe Volatility Index (INDEX: VIX), sits at ~1.07%. Tighter ranges, as a result of a sticky, long-gamma environment (in which the participants, who are on the other side of customer trades, hedge in a manner that takes from volatility) are likely to remain.
The potential for trading ranges to expand increases after large options expiries this week.
Further, given where realized (RVOL) and implied (IVOL) volatility measures are, as well as skew, it is beneficial to be a buyer of options structures. It is weeks prior to this near-vertical price rise that we mulled rotating into dynamic (options) bets and structures lined up against some key resistances.
Graphic: Retrieved from Bloomberg. Drawn on by Physik Invest.
Moreover, where are we, right now?
As well explained in the Daily Brief for July 21, 2022, heading into the 2022 decline, institutions repositioned and hedged, even allocating to “commodity trend following,” per our Daily Brief for July 15, 2022, which worked well the first two quarters.
The monetization and counterparty hedging of existing customer hedges, as well as the sale of short-dated volatility, particularly in some of the single names where there was “rich” volatility, into the fall, lent to lackluster performance in equity IVOL and index mean reversion.
This trend came to an end as entities were squeezed out of trades not working (i.e., participants rotated out of volatility and commodities). This, alongside a re-leveraging on inflation cooling and better-than-expected earnings, bolstered a historic near-vertical price rise in equity markets.
Graphic: Retrieved from The Market Ear. Via Goldman Sachs Group Inc.
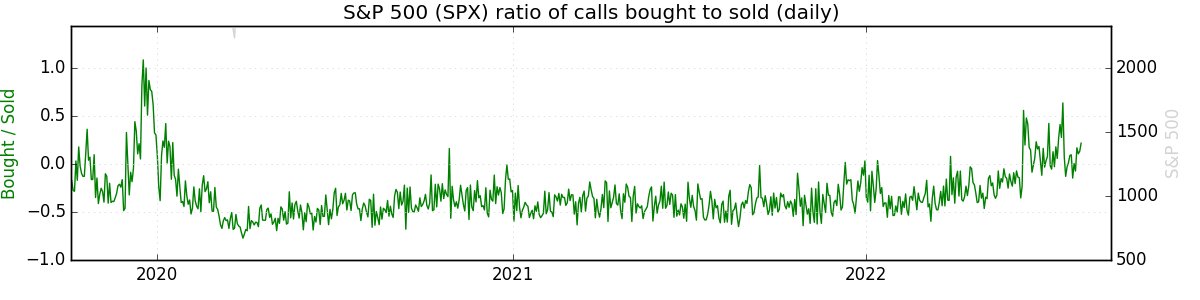
Continuing to bolster the near-vertical price rise is a rotation into bets on upside (call options). It is the hedging of this exposure, by counterparties, that can add to the follow-on buying (i.e., in selling a call option, the liquidity provider will, all else equal, buy underlying stock).
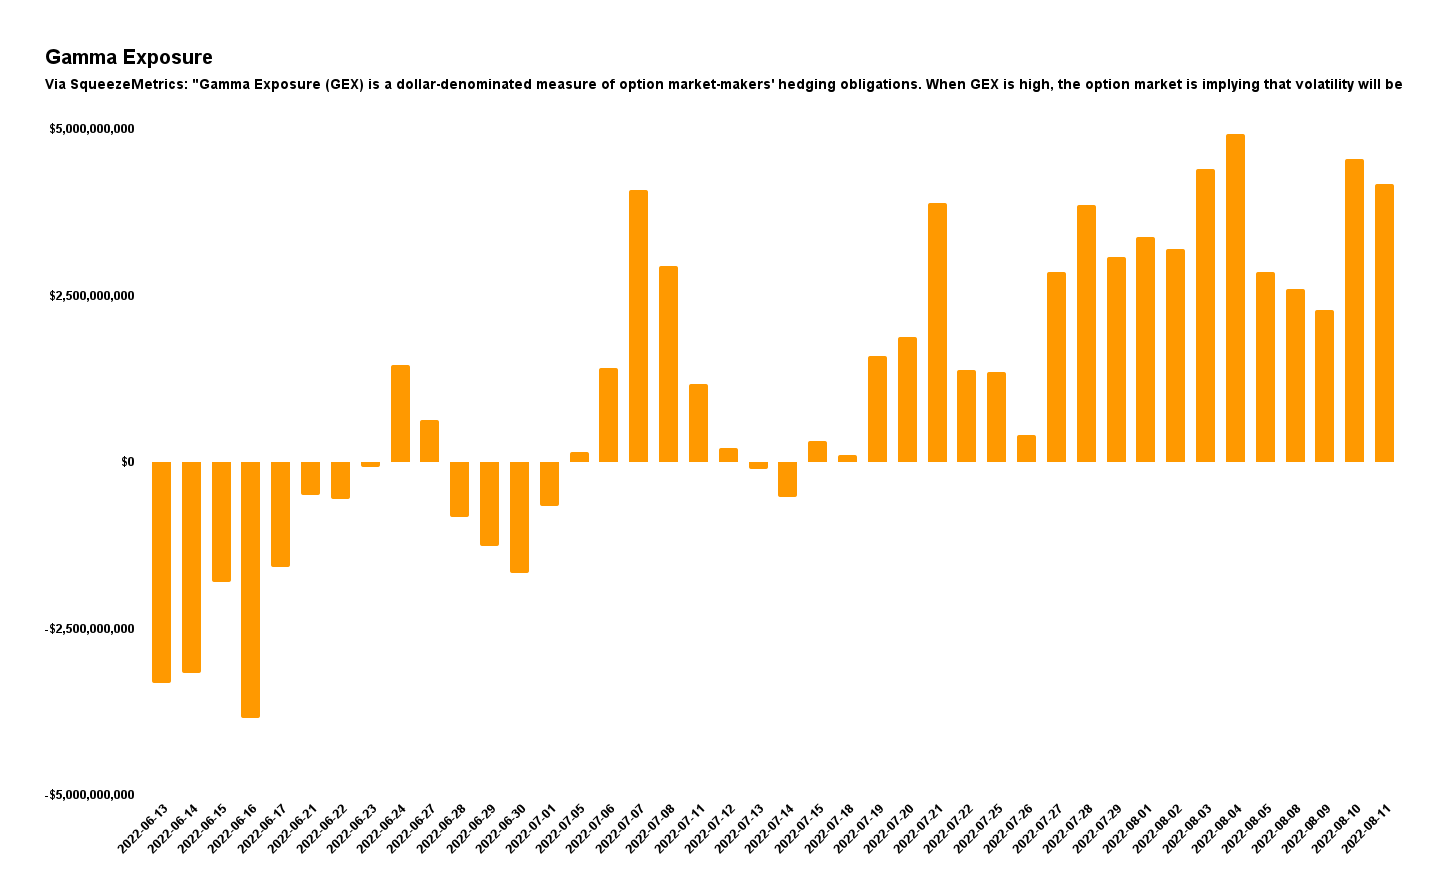
Graphic: Updated 8/15/2022. Retrieved from SqueezeMetrics.
Accordingly, participants have been squeezed out of their (put) volatility hedges, “on the equity side,” and are now “less and less hedged,” as Kai Volatility’s Cem Karsan explains.
Given this, the “market can really begin to respond to the core macro factors.”
It is the case that when the macro re-leveraging ceases, and the present supportive volatility conditions ease, “the incremental effects” of liquidity (i.e., quantitative easing and tightening) may set the stage for a rollover.
Graphic: Via Physik Invest. Data compiled by @jkonopas623. Fed Balance Sheet data, here. Treasury General Account Data, here. Reverse Repo data, here. NL = BS – TGA – RRP.
If during this rollover, some shock was to surface, then the demand for hedges may assist in an “untethering” in IVOL, “one of the most supportive things into the decline,” Karsan explained.
Graphic: Retrieved from SqueezeMetrics. Learn the implications of volatility, direction, and moneyness.
So, what’s the takeaway?
The near-vertical price rise (alongside reports of better-than-expected earnings and the potential that inflation is beginning to cool) is sputtering. Follow-on support from a desire by participants to participate in upside synthetically and continued re-leveraging may ease in the next weeks.
Technical
As of 7:00 AM ET, Wednesday’s regular session (9:30 AM – 4:00 PM ET), in the S&P 500, is likely to open in the lower part of a negatively skewed overnight inventory, outside of prior-range and -value, suggesting a potential for immediate directional opportunity.
In the best case, the S&P 500 trades higher.
Any activity above the $4,271.00 VPOC puts into play the $4,294.25 HVNode. Initiative trade beyond the HVNode could reach as high as the $3,337.00 VPOC and $4,393.75 HVNode, or higher.
In the worst case, the S&P 500 trades lower.
Any activity below the $4,271.00 VPOC puts into play the $4,253.25 HVNode. Initiative trade beyond the HVNode could reach as low as the $4,231.00 VPOC and $4,202.75 RTH Low, or lower.
Click here to load today’s key levels into the web-based TradingView charting platform. Note that all levels are derived using the 65-minute timeframe. New links are produced, daily.
Graphic: 65-minute profile chart of the Micro E-mini S&P 500 Futures.
Considerations: Responsiveness near key-technical areas (that are discernable visually on a chart), suggests technically-driven traders with short time horizons are very active.
Such traders often lack the wherewithal to defend retests and, additionally, the type of trade may be indicative of the other time frame participants waiting for more information to initiate trades.
Definitions
Volume Areas: A structurally sound market will build on areas of high volume (HVNodes). Should the market trend for long periods of time, it will lack sound structure, identified as low volume areas (LVNodes). LVNodes denote directional conviction and ought to offer support on any test.
If participants were to auction and find acceptance into areas of prior low volume (LVNodes), then future discovery ought to be volatile and quick as participants look to HVNodes for favorable entry or exit.
POCs: POCs are valuable as they denote areas where two-sided trade was most prevalent in a prior day session. Participants will respond to future tests of value as they offer favorable entry and exit.
About
After years of self-education, strategy development, mentorship, and trial-and-error, Renato Leonard Capelj began trading full-time and founded Physik Invest to detail his methods, research, and performance in the markets.
Capelj also develops insights around impactful options market dynamics at SpotGamma and is a Benzinga reporter.
In no way should the materials herein be construed as advice. Derivatives carry a substantial risk of loss. All content is for informational purposes only.
The daily brief is a free glimpse into the prevailing fundamental and technical drivers of U.S. equity market products. Join the 800+ that read this report daily, below!
Graphic updated 7:30 AM ET. Sentiment Neutral if expected /ES open is inside of the prior day’s range. /ES levels are derived from the profile graphic at the bottom of the following section. Levels may have changed since initially quoted; click here for the latest levels. SqueezeMetrics Dark Pool Index (DIX) and Gamma (GEX) calculations are based on where the prior day’s reading falls with respect to the MAX and MIN of all occurrences available. A higher DIX is bullish. At the same time, the lower the GEX, the more (expected) volatility. Learn the implications of volatility, direction, and moneyness. Breadth reflects a reading of the prior day’s NYSE Advance/Decline indicator. VIX reflects a current reading of the CBOE Volatility Index (INDEX: VIX) from 0-100.
Fundamental
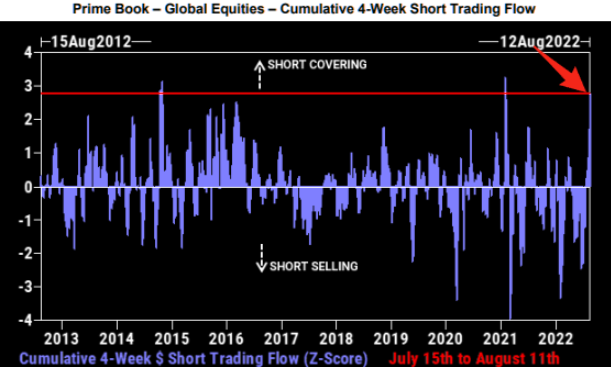
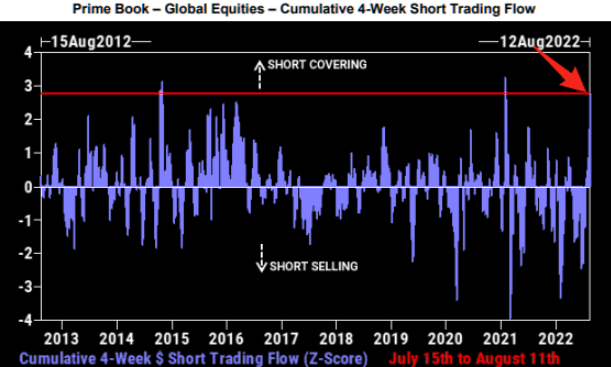
According to Goldman Sachs Group Inc (NYSE: GS) Prime Services, this is the third largest short-covering rally in three years.
Graphic: Retrieved from The Market Ear. Via Goldman Sachs Group Inc.
The rally, as discussed in past commentaries, is, in part, the result of “volatility-target funds” and “trend-following funds” getting back into the market as volatility falls, sentiment and data on jobs improve, as well as cooler-than-expected inflation figures.
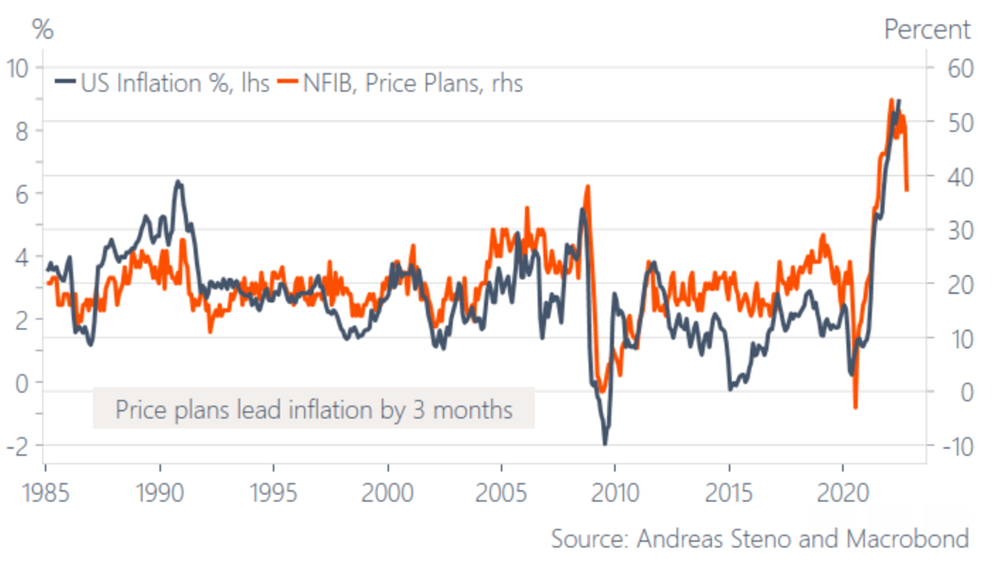
Graphic: Retrieved from Stenos Signals. “Unless SMEs are lying, inflation has peaked for now … Will it change the market psychology?”
“The machines seem hell-bent on pushing the financial conditions easing trade,” said Dennis DeBusschere, the founder of 22V Research.
“Machines are eating the words from the Fed speakers for breakfast.”
Graphic: Retrieved from Bloomberg. “The issue is the giant pool of systematic funds that moves in and out of the market based on how turbulent prices are. With peace at hand of late amid a four-week rally, so-called volatility-target funds and similar strategies such as risk parity are buying between $2 billion to $4 billion of stocks per day, according to an estimate by JPMorgan Chase & Co.’s Kate Gandolfo.”
Notwithstanding, JPMorgan Chase & Co (NYSE: JPM) estimates overall CTA exposures remain subdued. To incite ultra-impactful “buy signals” the S&P 500 would have to rise to $4,400.00.
This “would prompt CTAs to step up buying” and, potentially, turn “‘max long’ on stocks, buying probably $100 billion to $200 billion across various trend-following strategies.”
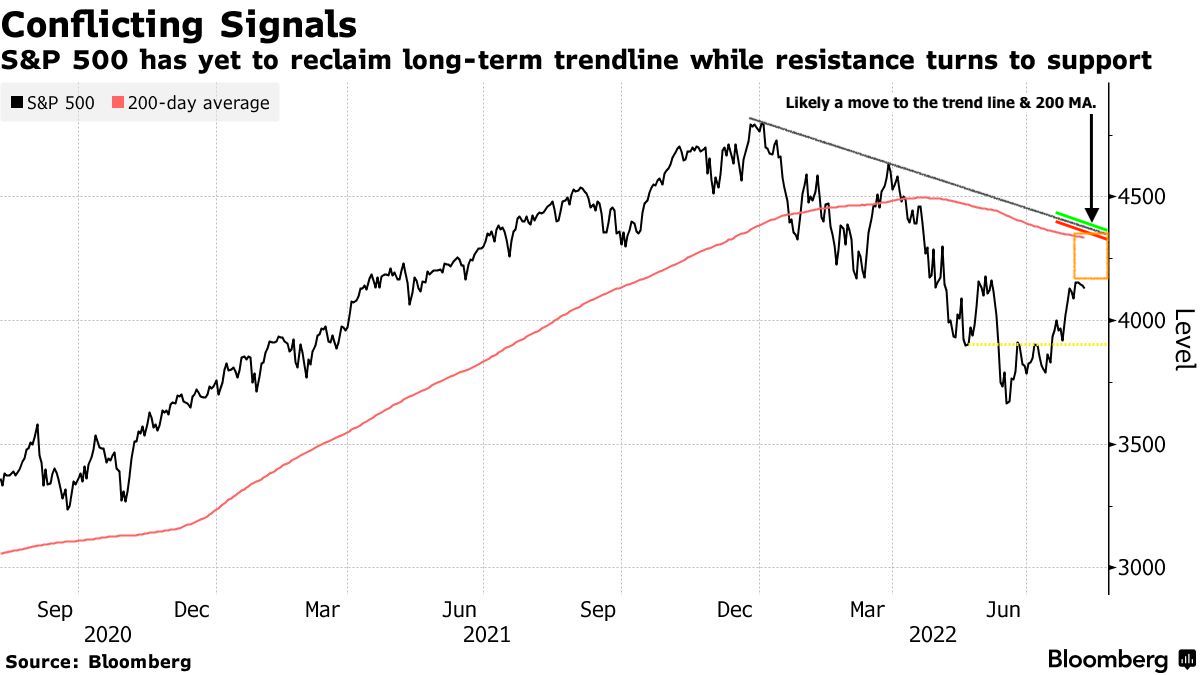
Though the S&P 500 has yet to retake the $4,400.00 level, likely to remain as support until the end of the week, at least, are options hedging flows, which we talked about last week.
“That can last perhaps another 100 days if volatility stays low,” JPM’s Kate Gandolfo suggested.
For context, at least at the index level, customers are short call, long put against their equity. In a rising market, the call side solicits increased hedging on the part of counterparties.
If counterparties are long the call, and the market is rising (falling), they must sell (buy) underlying to re-hedge. This can further contain realized volatility and support the market.
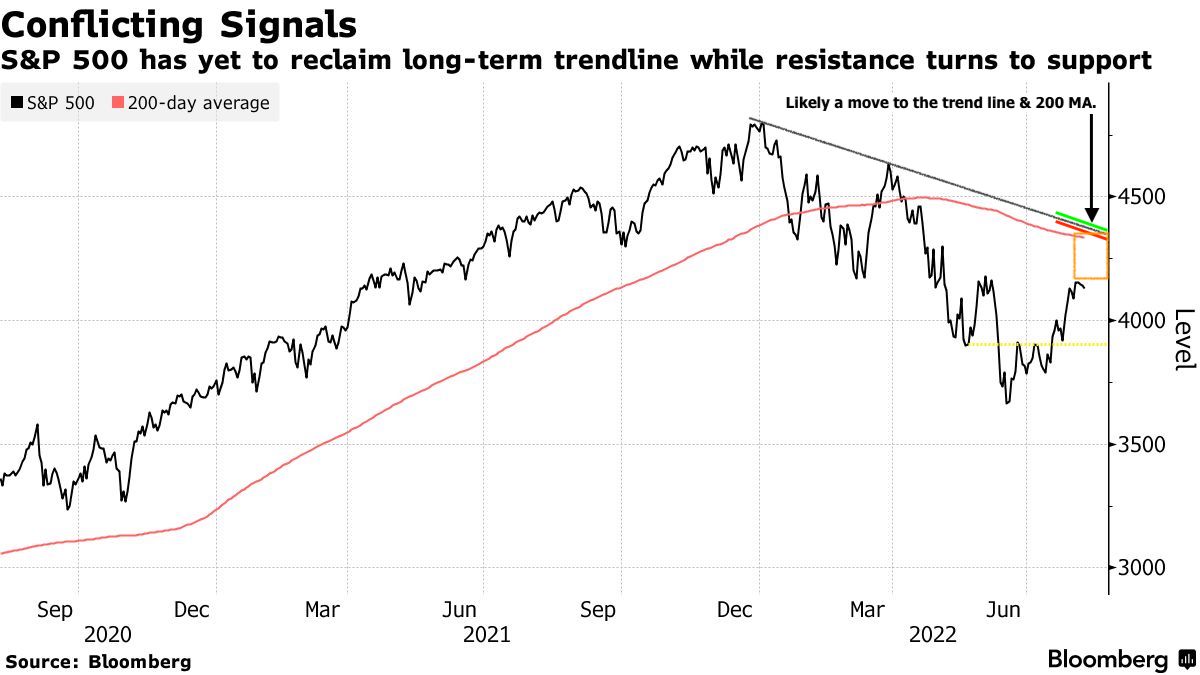
To act on this information, you are best off shrinking your timeframe and using if/then statements to put on trades. For instance, if the market rises past the downtrend line in the S&P 500, then the 2022 equity bear market is over. We should bias ourselves long, at that point.
Graphic: Retrieved from Bloomberg. Drawn on by Physik Invest.
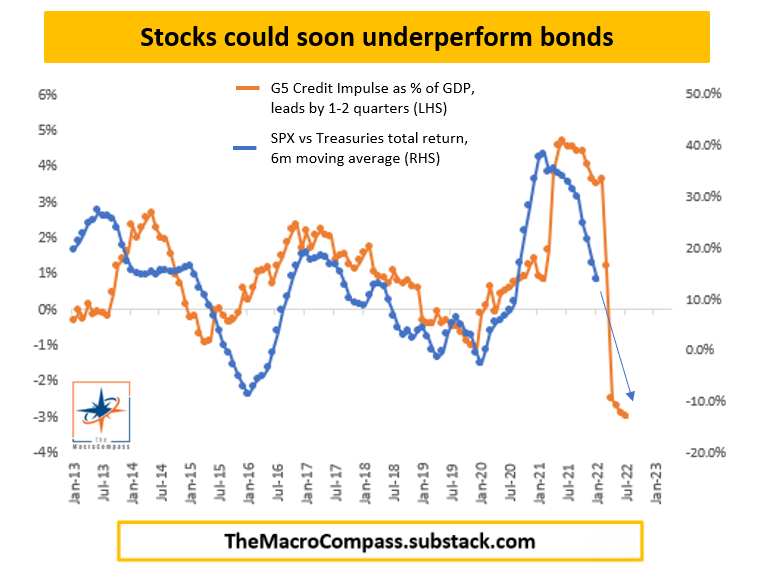
Accordingly, over a larger horizon, its growth impulses, as well as the availability of credit and liquidity determine whether a market’s movements have legs.
Accordingly, “in the 1970s, the peak in inflation proved THE timing to load up on risk assets, but the missing link is a bottoming growth cycle,” Andreas Steno Larsen explained.
“The swiftly weakening growth cycle may rather be the EXACT reason why inflation has started to fade.”
In fact, Credit Suisse Group AG’s (NYSE: CS) Zoltan Pozsar sees inflation as a longer-lasting structural issue as “the pillars of the low inflation world – [de-globalization and populism] – are changing.”
As Crossmark Global Investments’ Victoria Fernandez puts it well, “We have probably reached peak inflation, but the stickiness of the inflation that remains (i.e., rents) keeps pressure on the Fed and therefore the markets.”
“We expected a summer rally due to better-than-expected earnings, but we aren’t satisfied that this is sustainable. A soft landing is still achievable, but we still anticipate volatility with so many unknowns out there.”
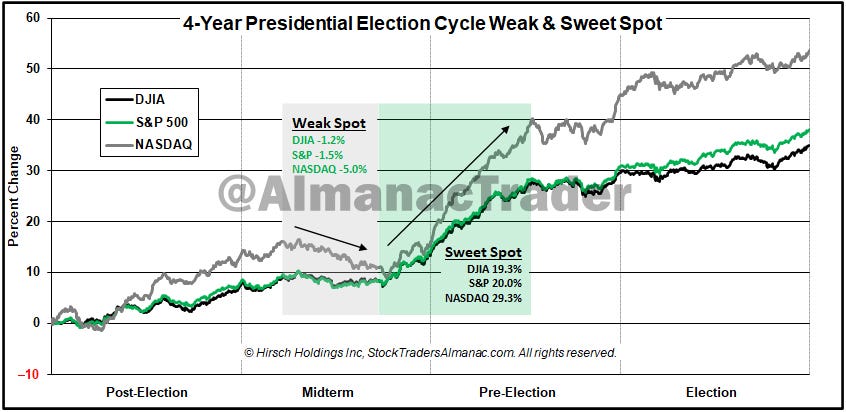
Graphic: Retrieved from Callum Thomas’ Weekly S&P 500 ChartStorm. The “seasonal/cycle outlook is for a lower low or retest of the lows over the next three months as we are in the worst two months of the year and are smack dab in the *Weak Spot* of the 4-Year Cycle”
As of 7:30 AM ET, Monday’s regular session (9:30 AM – 4:00 PM ET), in the S&P 500, is likely to open in the lower part of a negatively skewed overnight inventory, inside of prior-range and -value, suggesting a limited potential for immediate directional opportunity.
In the best case, the S&P 500 trades higher.
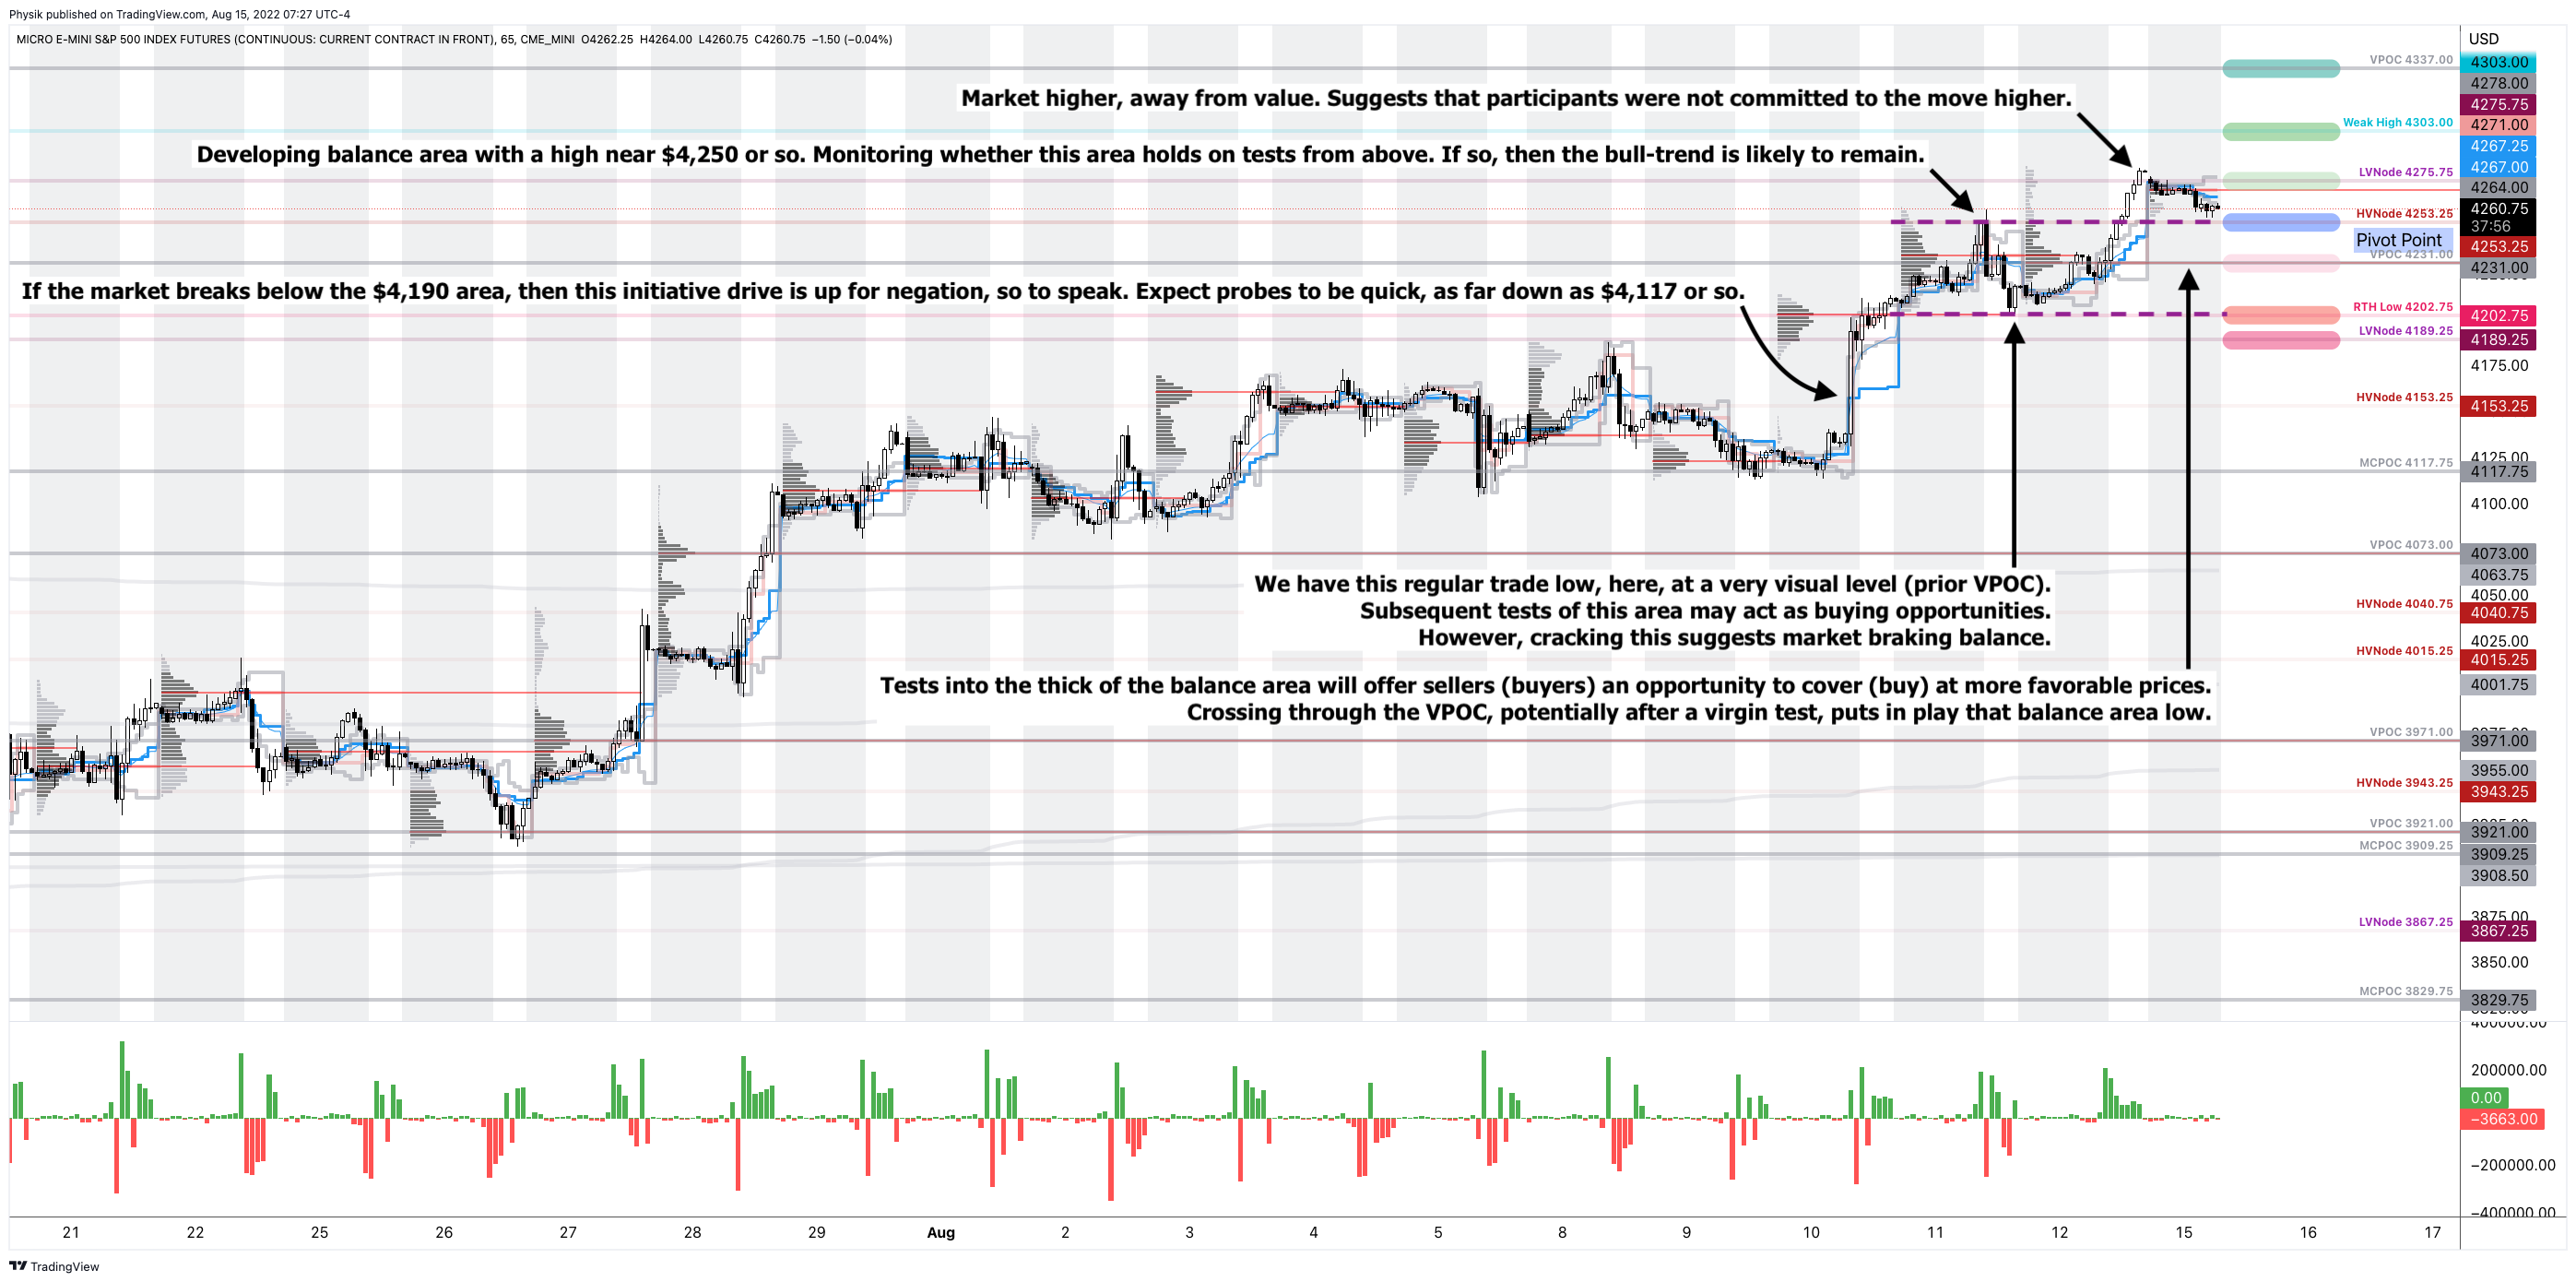
Any activity above the $4,253.25 HVNode puts into play the $4,275.75 LVNode. Initiative trade beyond the LVNode could reach as high as the $4,303.00 Weak High and $4,337.00 VPOC, or higher.
In the worst case, the S&P 500 trades lower.
Any activity below the $4,253.25 HVNode puts into play the $4,231.00 VPOC. Initiative trade beyond the VPOC could reach as low as the $4,202.75 RTH Low and $4,189.25 LVNode, or lower.
Click here to load today’s key levels into the web-based TradingView charting platform. Note that all levels are derived using the 65-minute timeframe. New links are produced, daily.
Graphic: 65-minute profile chart of the Micro E-mini S&P 500 Futures.
Definitions
Volume Areas: A structurally sound market will build on areas of high volume (HVNodes). Should the market trend for long periods of time, it will lack sound structure, identified as low volume areas (LVNodes). LVNodes denote directional conviction and ought to offer support on any test.
If participants were to auction and find acceptance into areas of prior low volume (LVNodes), then future discovery ought to be volatile and quick as participants look to HVNodes for favorable entry or exit.
POCs: POCs are valuable as they denote areas where two-sided trade was most prevalent in a prior day session. Participants will respond to future tests of value as they offer favorable entry and exit.
MCPOCs: POCs are valuable as they denote areas where two-sided trade was most prevalent over numerous day sessions. Participants will respond to future tests of value as they offer favorable entry and exit.
Volume-Weighted Average Prices (VWAPs): A metric highly regarded by chief investment officers, among other participants, for quality of trade. Additionally, liquidity algorithms are benchmarked and programmed to buy and sell around VWAPs.
About
After years of self-education, strategy development, mentorship, and trial-and-error, Renato Leonard Capelj began trading full-time and founded Physik Invest to detail his methods, research, and performance in the markets.
Capelj also develops insights around impactful options market dynamics at SpotGamma and is a Benzinga reporter.
In no way should the materials herein be construed as advice. Derivatives carry a substantial risk of loss. All content is for informational purposes only.
The daily brief is a free glimpse into the prevailing fundamental and technical drivers of U.S. equity market products. Join the 750+ that read this report daily, below!
Graphic updated 7:00 AM ET. Sentiment Neutral if expected /ES open is inside of the prior day’s range. /ES levels are derived from the profile graphic at the bottom of the following section. Levels may have changed since initially quoted; click here for the latest levels. SqueezeMetrics Dark Pool Index (DIX) and Gamma (GEX) calculations are based on where the prior day’s reading falls with respect to the MAX and MIN of all occurrences available. A higher DIX is bullish. At the same time, the lower the GEX, the more (expected) volatility. Learn the implications of volatility, direction, and moneyness. Breadth reflects a reading of the prior day’s NYSE Advance/Decline indicator. VIX reflects a current reading of the CBOE Volatility Index (INDEX: VIX) from 0-100.
Fundamental
We’ll skip the fundamentals section, today, and do an in-depth review, sometime next week.
Positioning
As of 7:00 AM ET, Friday’s expected volatility, via the Cboe Volatility Index (INDEX: VIX), sits at ~1.06%. Net gamma exposures generally rising may promote tighter trading ranges.
Graphic: Via Physik Invest. Data retrieved from SqueezeMetrics.
As stated yesterday, it may be beneficial for traders to shift their focus to dynamic structures. In other words, be a buyer of options structures (i.e., replace static directional exposures or Delta with those that are dynamic).
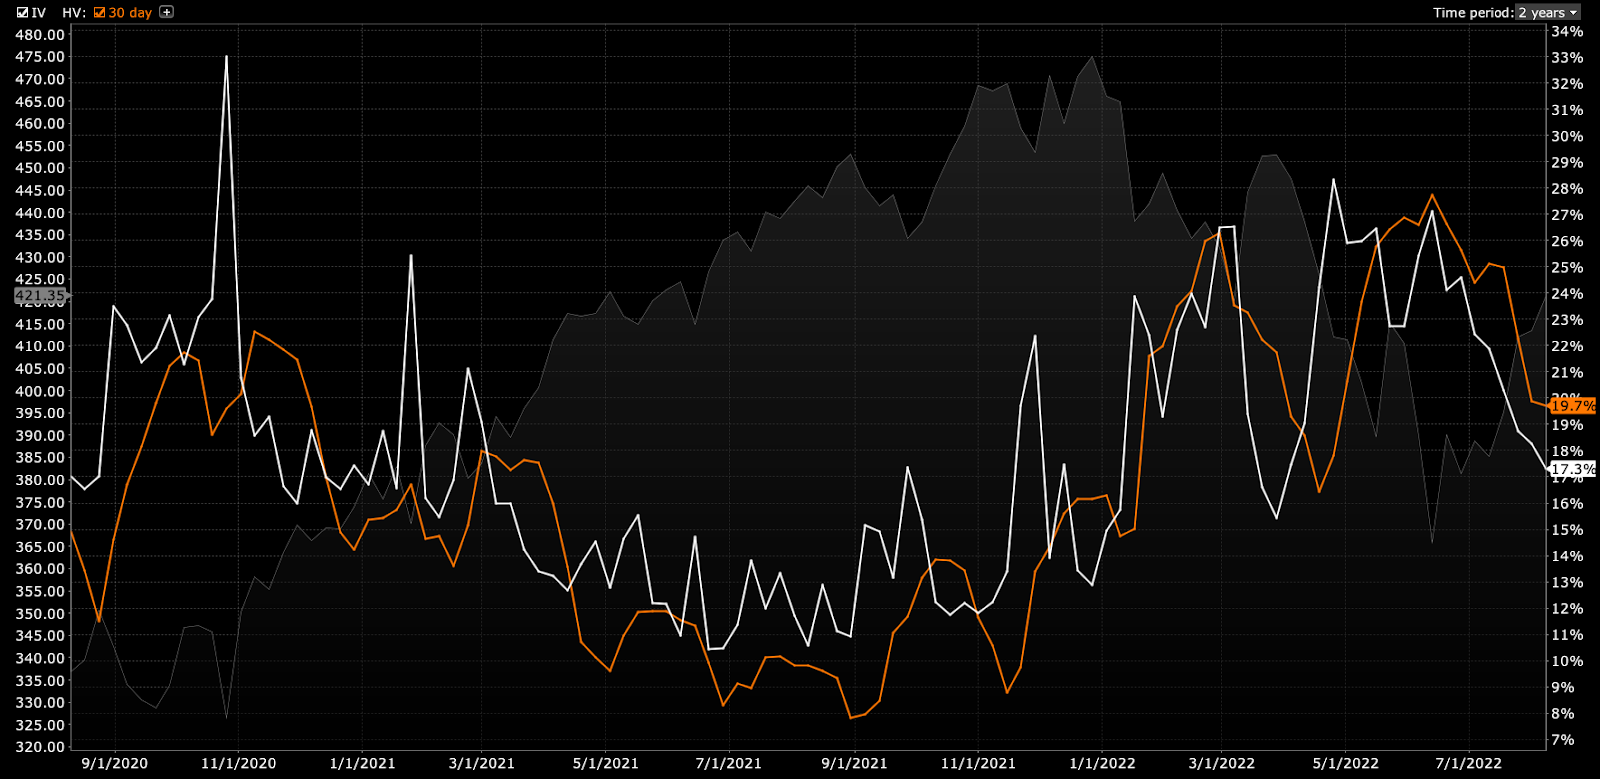
This is (1) due to where realized (RVOL) and implied (IVOL) volatility measures, and skew.
Graphic: Retrieved from Interactive Brokers Group Inc’s (NASDAQ: IBKR) Trader Workstation.
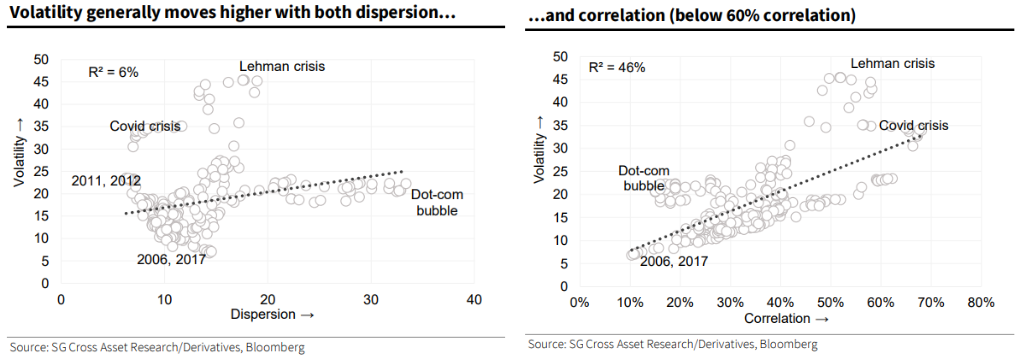
As well as (2) increased average stock correlation and lower return dispersion which, per Societe Generale SA (OTC: SCGLY) research, make stock picking hard(er).
It can be the case that Delta hedging becomes easier, too, as one asset, in a more correlated environment, can better offset the first-order sensitivities elsewhere.
Graphic: Retrieved from Bloomberg. Via Societe Generale.
The reason why?
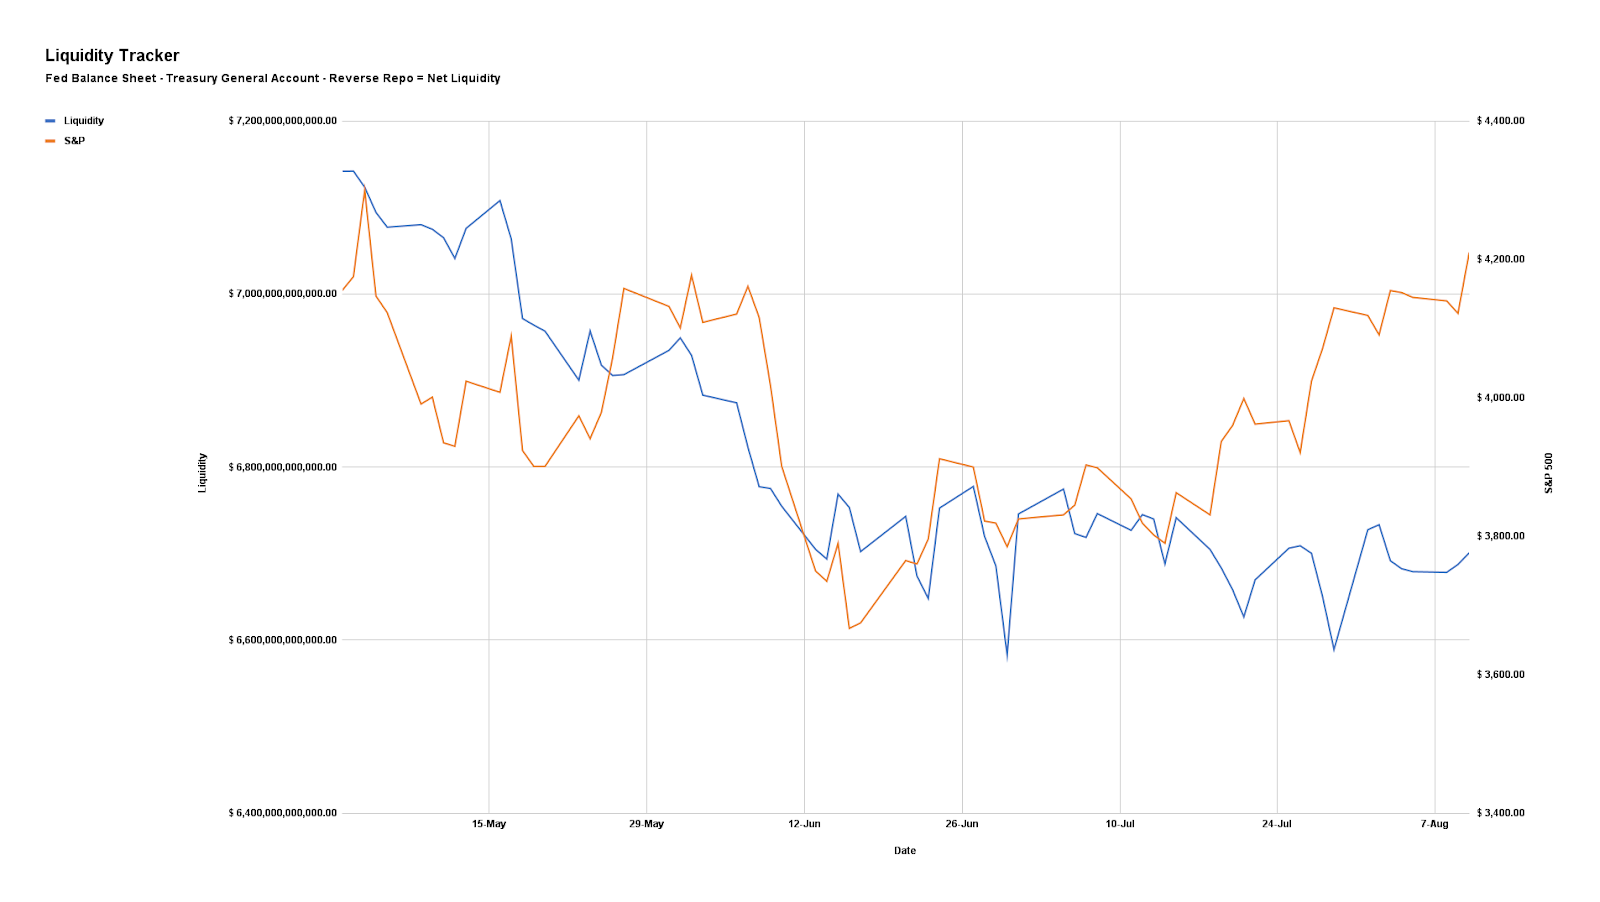
In regards to the correlation and dispersion remark, that’s more to do with the risk-off sentiment and the impact of tightening liquidity affecting all risk assets, basically.
Graphic: Via PhysikInvest. Data compiled by @jkonopas623. Fed Balance Sheet data, here. Treasury General Account Data, here. Reverse Repo data, here. NL = BS – TGA – RRP.
Regarding the volatility issue (RVOL, IVOL, and skew), that’s more to do with hedging trends.
Essentially, the monetization and counterparty hedging of existing customer hedges, as well as the sale of short-dated volatility, particularly in some of the single names where there was “rich” volatility, into the fall, lent to lackluster performance in IVOL and index mean reversion.
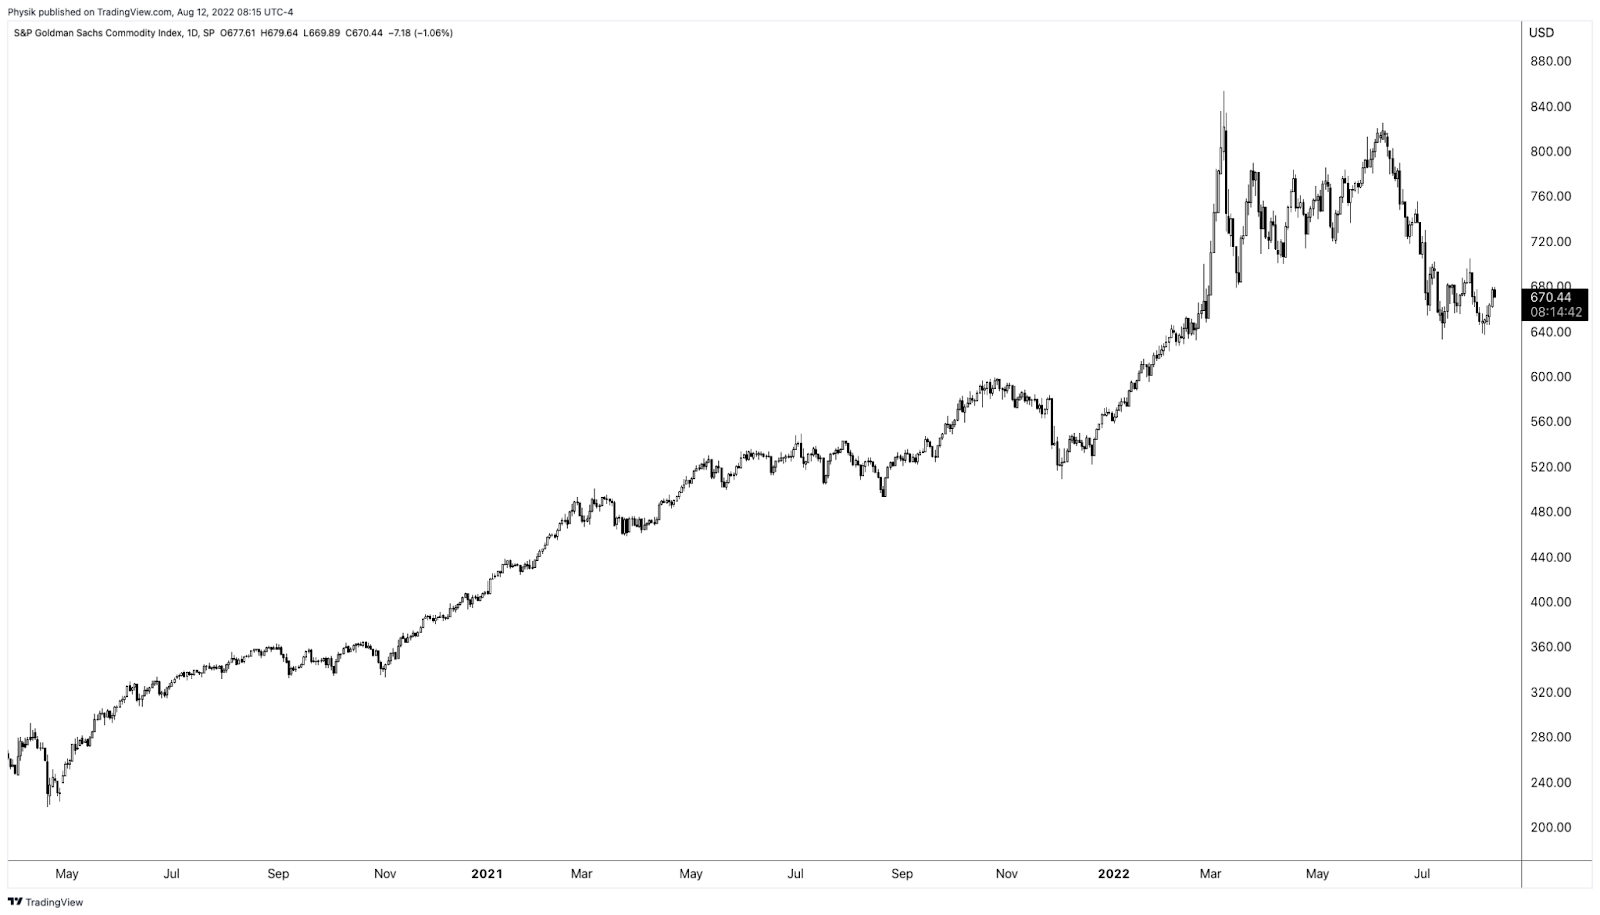
Accordingly, “if commodities are not performing … as a hedge, that opens the door,” to markets falling and traders demand equity volatility hedges, per The Ambrus Group’s Kris Sidial.
Learn about options dealer flows, inflation, and investing in a changing world with Cem Karsan.
Graphic: Retrieved by Physik Invest from TradingView. S&P Goldman Sachs Commodity Index.
Adding, per to SpotGamma, “a lot of the boost from volatility compression has played out. With IVOL at a lower bound, it may be opportune to replace static Delta bets for those that are dynamic (i.e., long option exposures) and have less to lose in this lower volatility environment.”
Graphic: Retrieved from Vix Central. The term structure of IVOL.
“In a case where market participants see the Fed keeping its commitment to aggressive monetary policy action, negative Delta options exposures may outperform static short equity (bets on the downside).”
Graphic: Retrieved from Bloomberg. “Thursday’s message was that on mature reflection, the progress on the economy didn’t justify taking the stock market any higher than it was at the start of the day.”
If bullish, sample structures to consider, given a smiley skew, include low- or zero-cost bullish call ratio spreads, against the trend resistances in products like the S&P 500 (INDEX: SPX).
Graphic: Retrieved from Bloomberg. Drawn on by Physik Invest.
Technical
As of 7:00 AM ET, Friday’s regular session (9:30 AM – 4:00 PM ET), in the S&P 500, is likely to open in the middle part of a nearly balanced overnight inventory, inside of prior-range and -value, suggesting a limited potential for immediate directional opportunity.
In the best case, the S&P 500 trades higher.
Any activity above the $4,227.75 HVNode puts into play the $4,253.25 HVNode. Initiative trade beyond the latter could reach as high as the $4,275.75 LVNode and $4,303.00 Weak High, or higher.
In the worst case, the S&P 500 trades lower.
Any activity below the $4,227.75 HVNode puts into play the $4,202.75 RTH Low. Initiative trade beyond the RTH Low could reach as low as the $4,189.25 LVNode and $4,153.25 HVNode, or lower.
Click here to load today’s key levels into the web-based TradingView charting platform. Note that all levels are derived using the 65-minute timeframe. New links are produced, daily.
Graphic: 65-minute profile chart of the Micro E-mini S&P 500 Futures.
Definitions
Volume Areas: A structurally sound market will build on areas of high volume (HVNodes). Should the market trend for long periods of time, it will lack sound structure, identified as low volume areas (LVNodes). LVNodes denote directional conviction and ought to offer support on any test.
If participants were to auction and find acceptance into areas of prior low volume (LVNodes), then future discovery ought to be volatile and quick as participants look to HVNodes for favorable entry or exit.
POCs: POCs are valuable as they denote areas where two-sided trade was most prevalent in a prior day session. Participants will respond to future tests of value as they offer favorable entry and exit.
MCPOCs: POCs are valuable as they denote areas where two-sided trade was most prevalent over numerous day sessions. Participants will respond to future tests of value as they offer favorable entry and exit.
Volume-Weighted Average Prices (VWAPs): A metric highly regarded by chief investment officers, among other participants, for quality of trade. Additionally, liquidity algorithms are benchmarked and programmed to buy and sell around VWAPs.
About
After years of self-education, strategy development, mentorship, and trial-and-error, Renato Leonard Capelj began trading full-time and founded Physik Invest to detail his methods, research, and performance in the markets.
Capelj also develops insights around impactful options market dynamics at SpotGamma and is a Benzinga reporter.
In no way should the materials herein be construed as advice. Derivatives carry a substantial risk of loss. All content is for informational purposes only.