Categories
Commentary

Daily Brief For November 15, 2022

Physik Invest’s Daily Brief is read by over 1,200 people. To join this community and learn about the fundamental and technical drivers of markets, subscribe below.
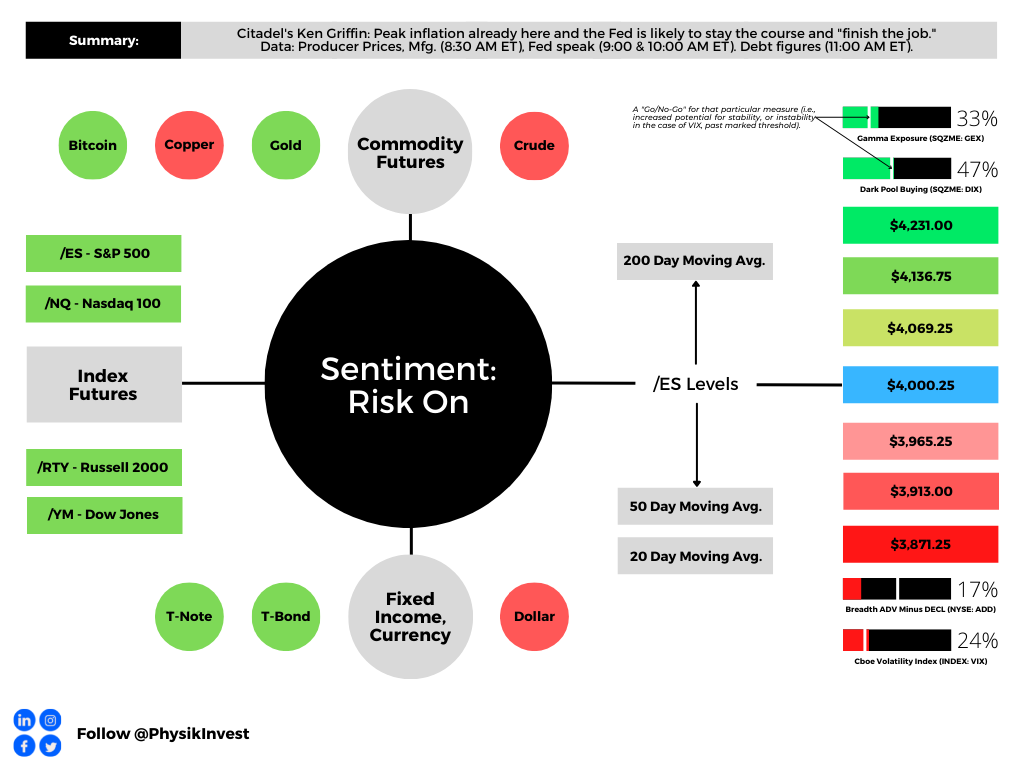
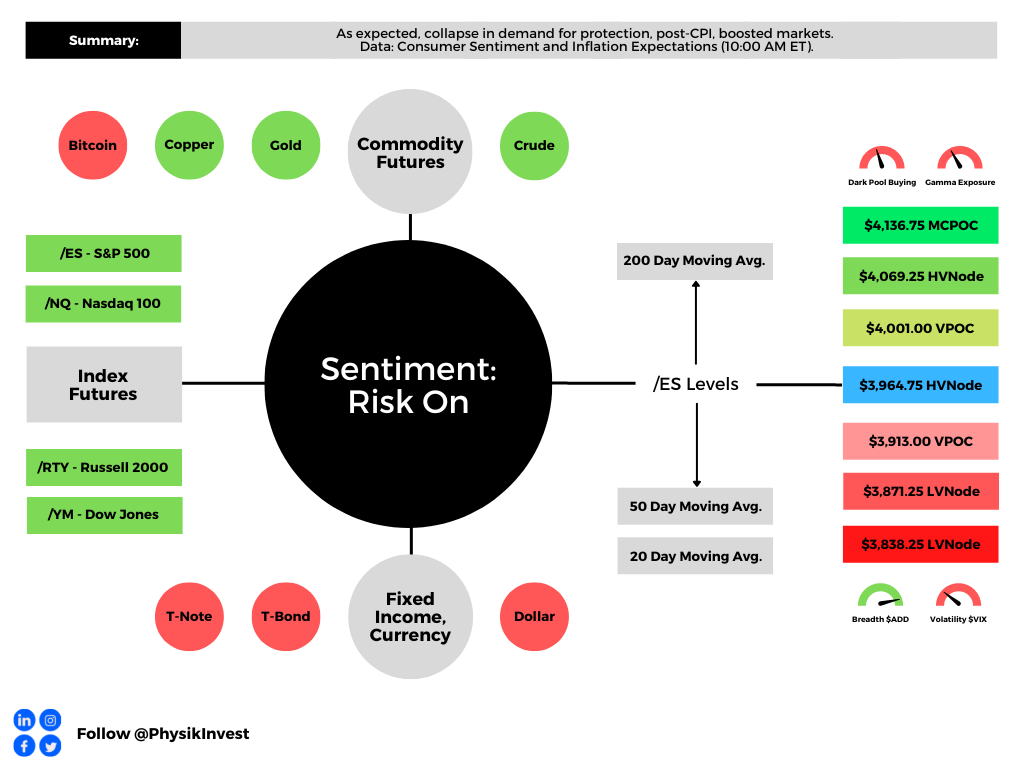
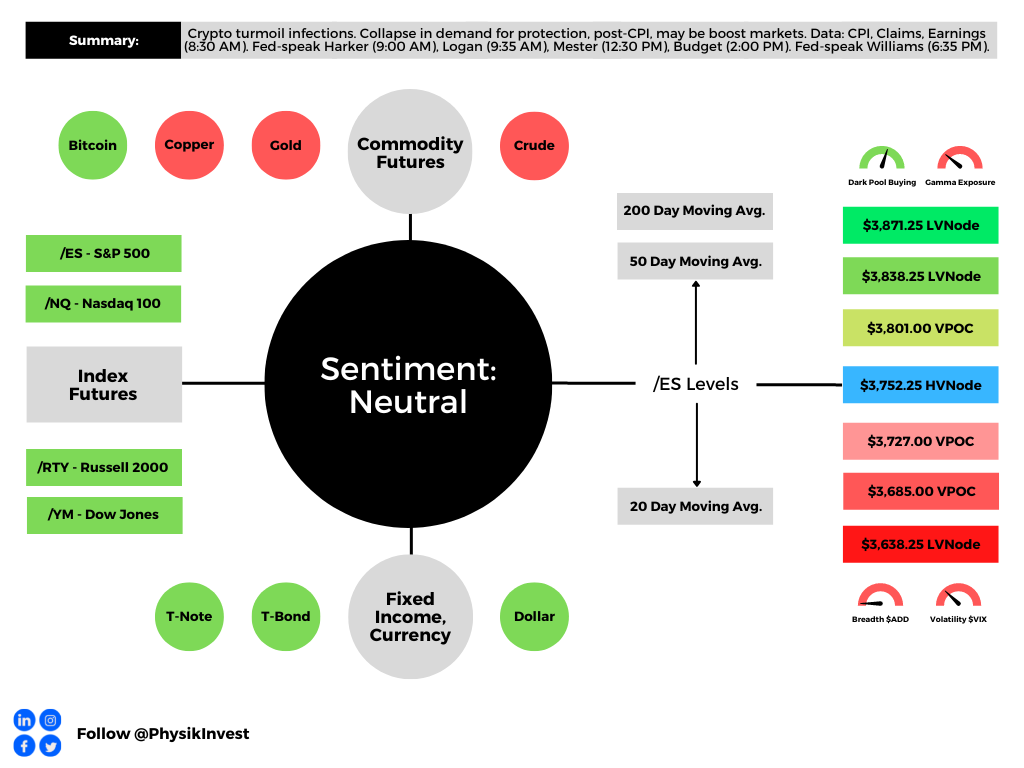
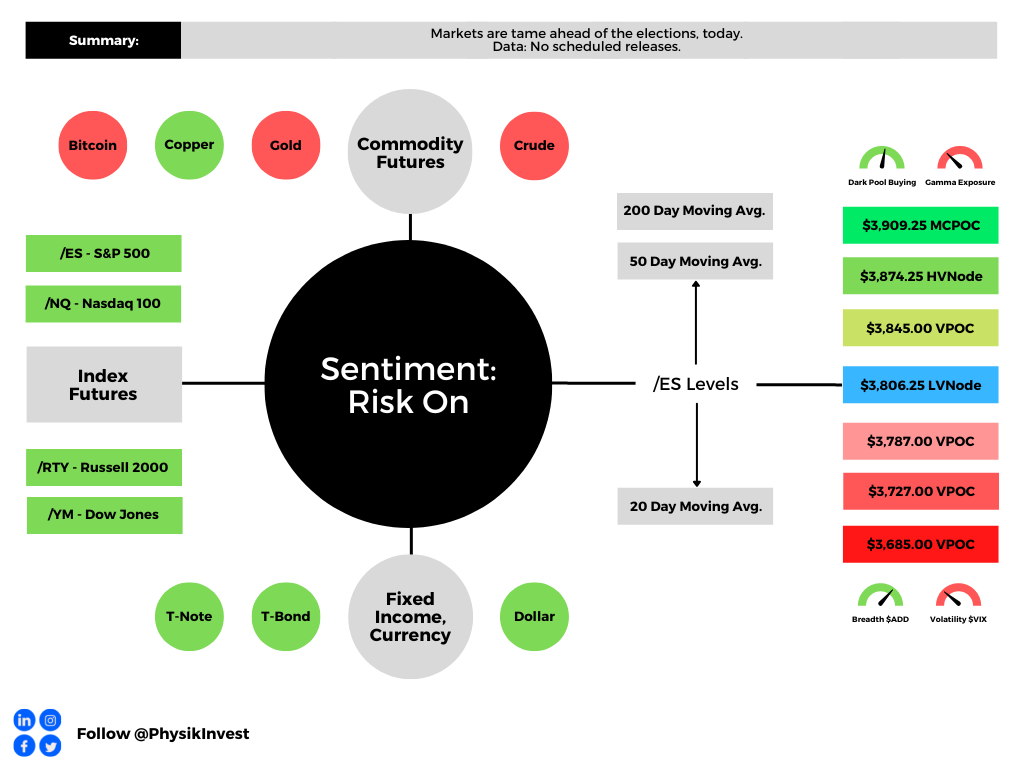
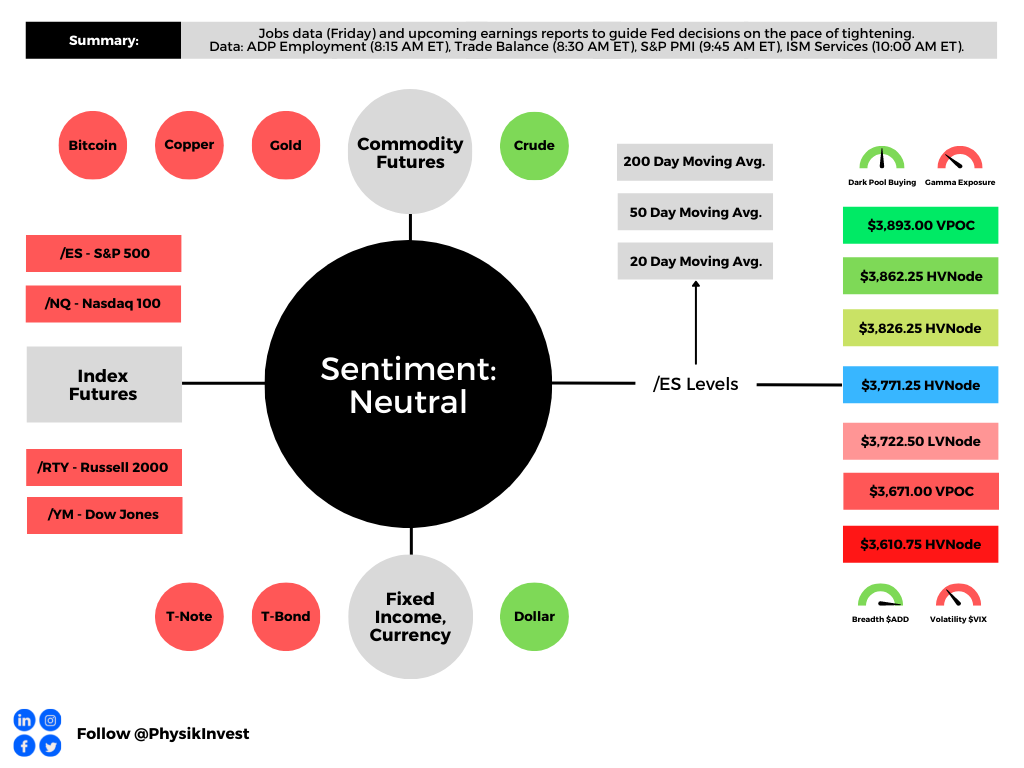
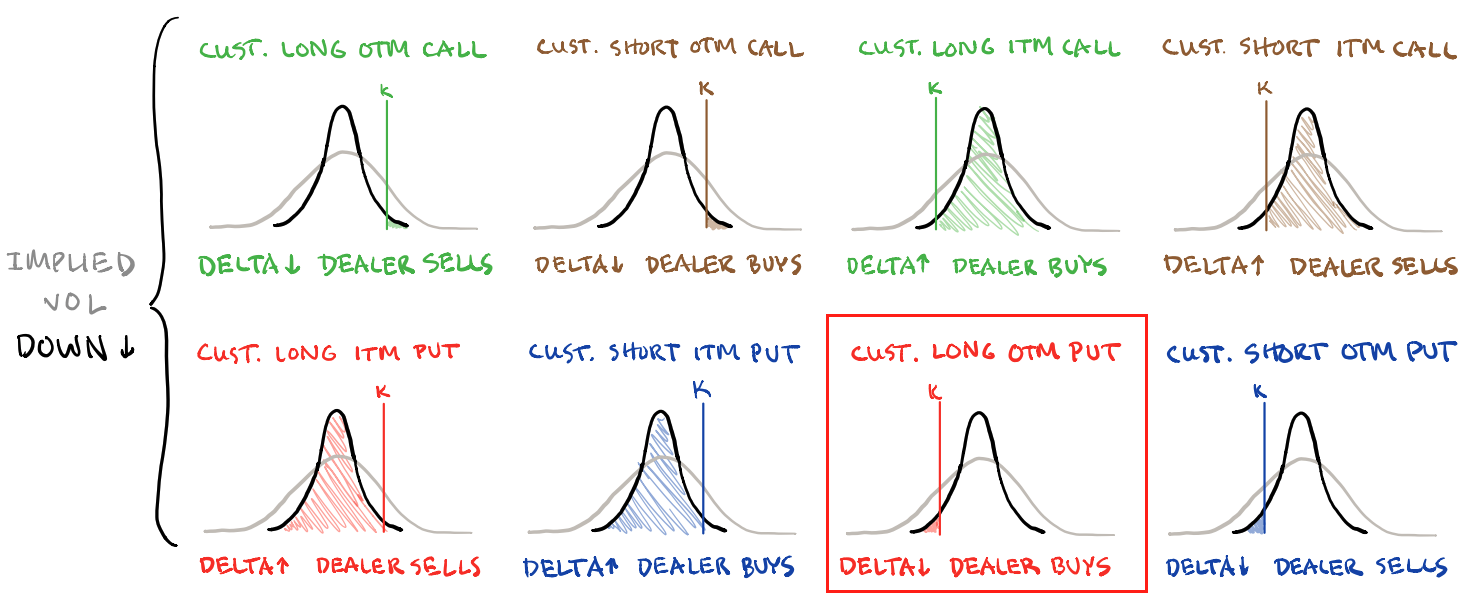
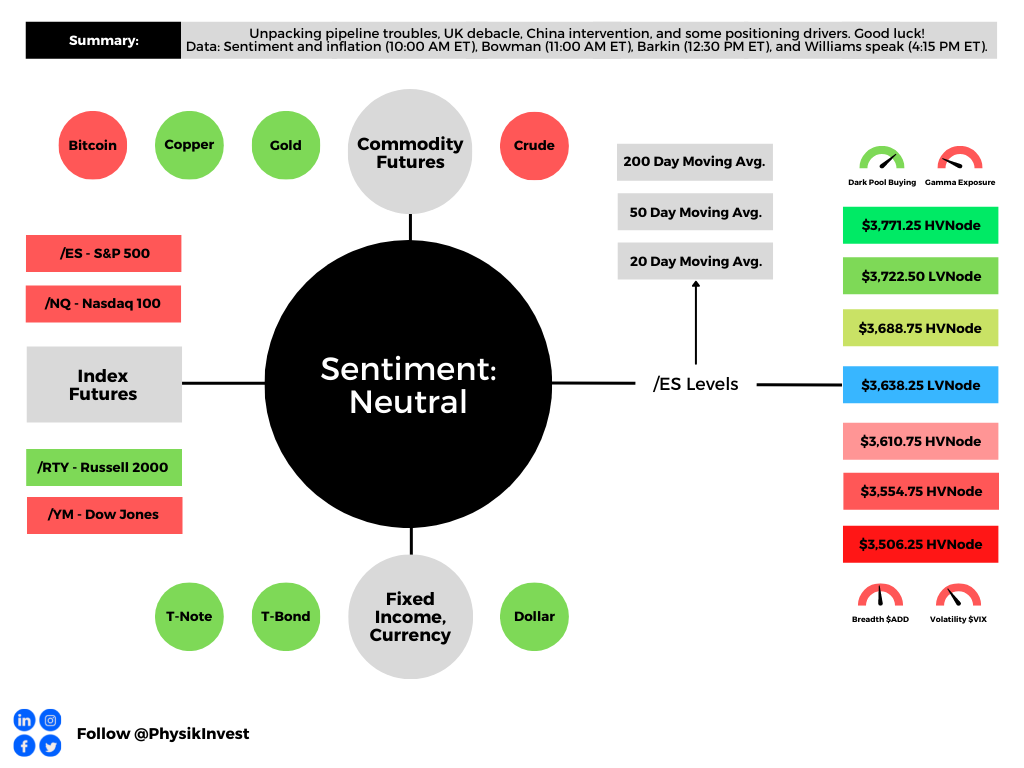
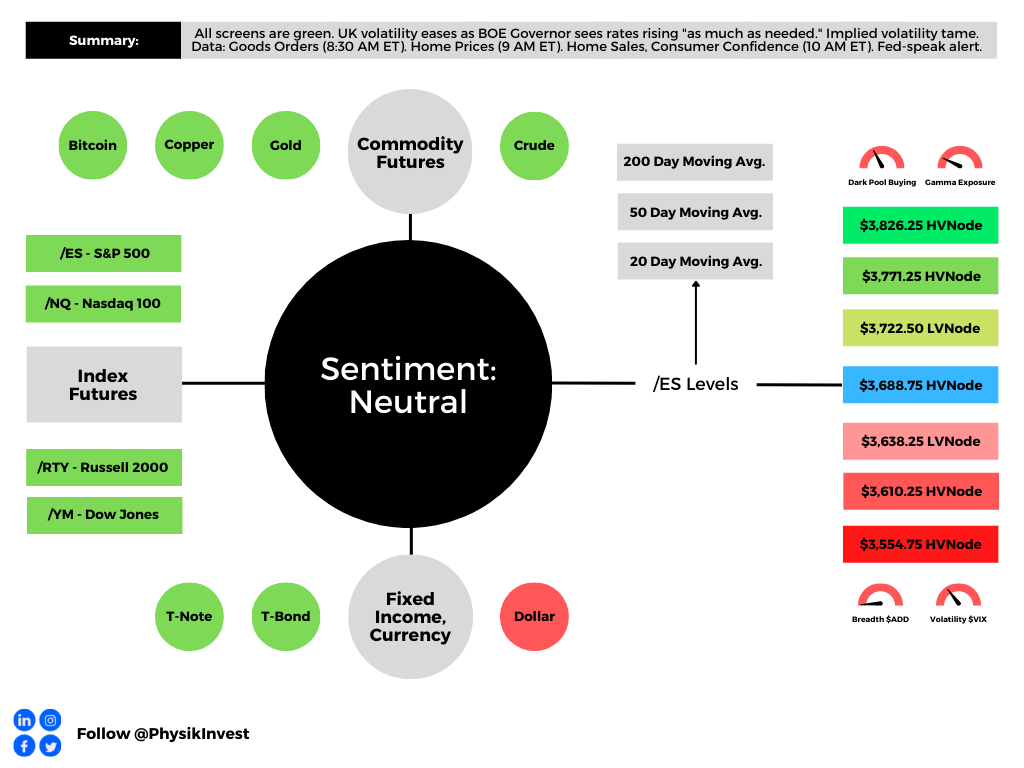
Graphic updated 9:00 AM ET. Sentiment Risk-On if expected /ES open is above the prior day’s range. /ES levels are derived from the profile graphic at the bottom of this letter. Levels may have changed since initially quoted; click here for the latest levels. SqueezeMetrics Dark Pool Index (DIX) and Gamma (GEX) with the latter calculated based on where the prior day’s reading falls with respect to the MAX and MIN of all occurrences available. A higher DIX is bullish. At the same time, the lower the GEX, the more (expected) volatility. Click to learn the implications of volatility, direction, and moneyness. Breadth reflects a reading of the prior day’s NYSE Advance/Decline indicator. VIX reflects a current reading of the CBOE Volatility Index (INDEX: VIX) from 0-100.

Fundamental

S&P Global Inc (NYSE: SPGI) put it really well in a recent update comparing today to the events of the mid-to-late 1630s. Dutch tulip bulbs traded as high as $750,000 per bulb (today’s money) before collapsing to near-zero.

That’s akin to what happened with the non-fungible token (NFT) craze of the late 2010s and early 2020s. Pictures of rocks sold for millions as recently as last year. Those pictures are worthless, now, and this has done a bit to dent the ecosystem’s apparent value, as well.
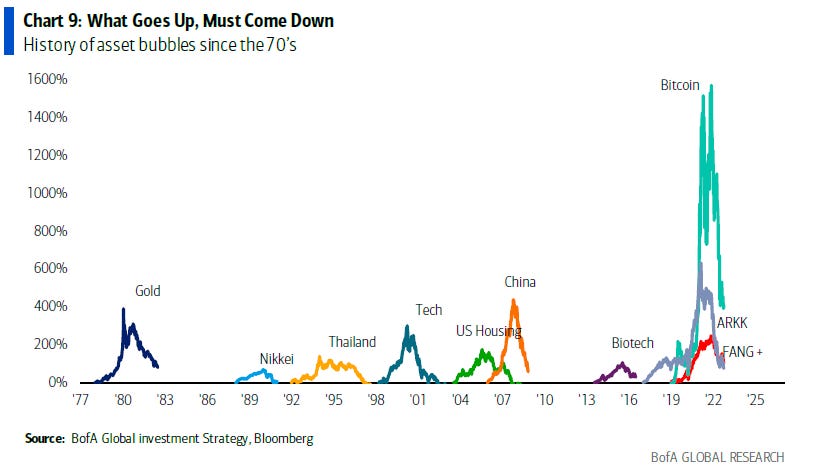
Graphic: Retrieved from Bank of America Corporation (NYSE: BAC) via @LanceRoberts.

What’s going on to cause this:

It’s basically the case that easy money policies enabled market participants to borrow and fund longer-duration bets on ideas with (potential) promise in the future.

Financial asset investments, too, were far more attractive, and that’s why we saw the asset inflation accelerate, followed by goods and services inflation that was bolstered by chokepoints and trends (e.g., deglobalization via supply chain security and geopolitics) and, ultimately, prompted policymakers to pivot.

FTX (CRYPTO: FTT) is among the victims of this pivot. It’s apparent that the events surrounding the collapse of crypto ecosystems months back prompted a so-called “credit crunch,” an insider close to FTX’s leadership explained.

“Many loaners suddenly recalled all of their loans just to see who was still liquid. Alameda lost a lot from giving out loans to firms [that] defaulted. Alameda was now, also, on the hook for money they didn’t have since they had given a lot of the loan money to FTX or had lost it loaning to now bankrupt counterparties. [Founder and CEO Sam Bankman-Fried] had two choices at this point, let Alameda get liquidated or send user money from FTX to ensure Alameda’s survival.”

Bankman-Fried, a massive risk taker at heart, chose the latter.

The repercussions include the following:

Apart from “strong governance and transparency [to] grow in importance as the cryptocurrency industry attempts to reassure investors and customers, … regulation of cryptocurrency markets, which was already a matter of serious debate, could accelerate,” SPGI explained, noting that some “other areas of the decentralized finance [or DeFi] market may be affected. And lastly, these contagion effects are unlikely to ripple into traditional finance [or TradFi].”

Check out Reuters (FTX bankruptcy filings in, French central bank wants quick regulation) and The Information (Startups should prepare for ‘second order fallout’ from FTX collapse).

Simplify Asset Management’s Michael W. Green (who we quoted in the past for his perspective and belief that we are in “a dot-com type collapse” that’s happened “underneath the surface of the indices which is [a result of] … passive flows supporting the largest stocks within the index, whereas the smaller stocks can be influenced to a greater extent by [] discretionary managers”) said a likely result is a Central Bank Digital Currency (CBDC) and an “almost certain … change in the monetary system,” echoing what Kai Volatility’s Cem Karsan said a long-time ago: “I don’t see … a clear window where cryptocurrency is not subject to constraints and I think it’s highly likely that we move towards a digital dollar.”

CBDCs are highly controversial per my chats with the likes of Edge & Node’s Tegan Kline. She said they could “be used as a mass surveillance tool. Leaders have done little to invalidate her beliefs given their recent discussions on, for example, using CBDCs to derive “carbon footprint.” 

That means having a read on where people are “traveling, how are they traveling, what are they eating, what are they consuming … This is something we’re working on,” leaders have put forth.

The point of this all is as follows:

As many may know, “there’s no ultimate buyer” in spaces like crypto and DeFi, as ex-Goldman Sachs Group Inc (NYSE: GS) emerging market FX and yield trader Seraphim Czecker, who is now heading risk and product management at Euler Labs, said

It’s that and the persistent interest in illiquid products that leave the door open to manipulation. Barring illiquidity, “if there’s a 10 or 15 standard deviation move, the liquidity will allow for … you [to] offload those assets quickly.

However, that’s not the widespread case.

“For example, look at what happened in the UK with the pension funds and margin calls. That is a classic DeFi strategy. You take your bonds and borrow cash against them. Then, you put it back into bonds and loop it a couple of times. That way, you have a leveraged interest rate exposure. That’s the same principle of lending staked Ethereum (CRYPTO: ETH), borrowing ETH, and doing it a couple of times.”

So, there may be “second order fallout” amid all this tightening. Markets, everywhere, are to de-rate. Ultimately, there’s probably a pivot to happen, in the future, with many leaders and strategists in finance unable to agree whether that (pivot) is the result of a recession.

“To take the foot off the brake right now and not finish the job, I think it’s the absolute worst mistake that the Fed could possibly make,” Citadel’s Ken Griffin said at the Bloomberg New Economy Forum in Singapore. In spite of Citadel seeing a recession averted, Griffin said: “I am finding it a bit hard to believe we are not going to have a recession at that point of time, sometime in the middle to back half of 2023,” adding this year finishes with “modest growth.”

Those in agreement include Stanley Druckenmiller, who once managed George Soros’ funds. “You don’t even need to talk about Black Swans to be worried here. To me, the risk-reward of owning assets doesn’t make a lot of sense,” Druckenmiller said

“When you make a mistake, you got to admit you’re wrong and move on that nine or 10 months, that [policymakers] just sat there and bought $120 billion in bonds,” he added. The “repercussions of that are going to be with us for a long, long time.”

Positioning

From a positioning perspective, much of what we’ve discussed in past notes is still true. Among others, Goldman Sachs Group Inc calculates up to $40 billion in buying over the next weeks with more than $80 billion of buying in an up market.
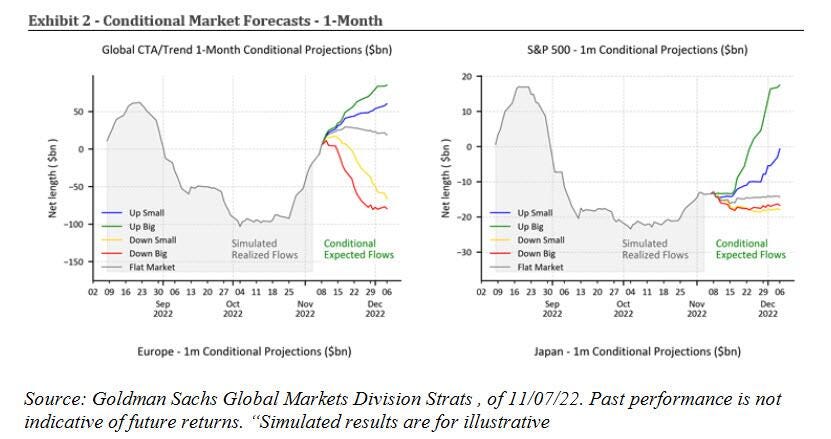
Graphic: Retrieved from @LanceRoberts. “Goldman calculates a whopping $38 billion to buy over the next week and substantially more (green line) if the market is up big. The chart below shows that the bank expects more than +$79 billion of net buying over the month.”

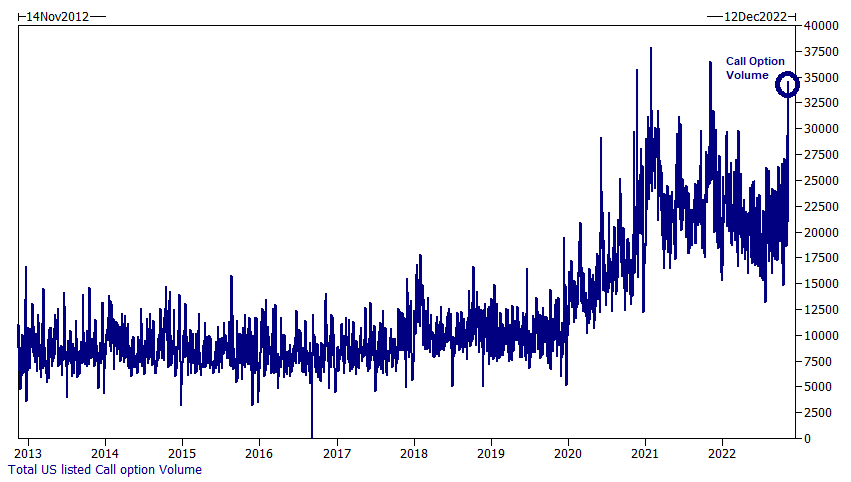
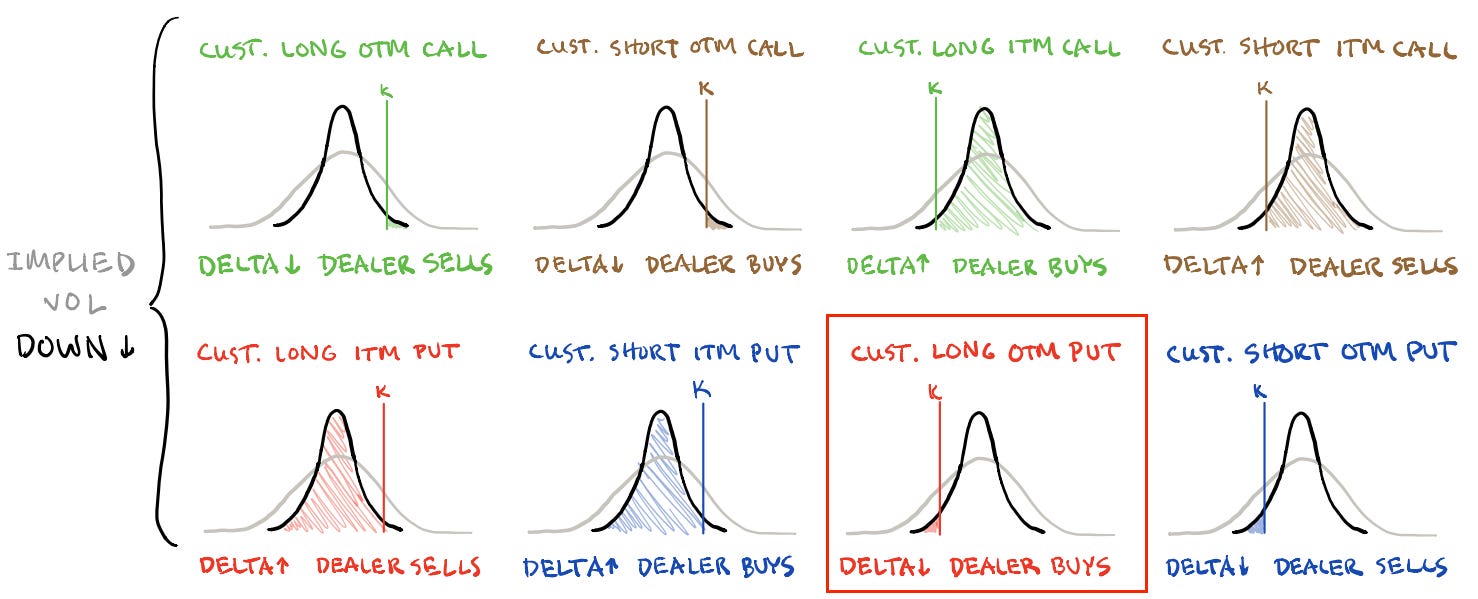
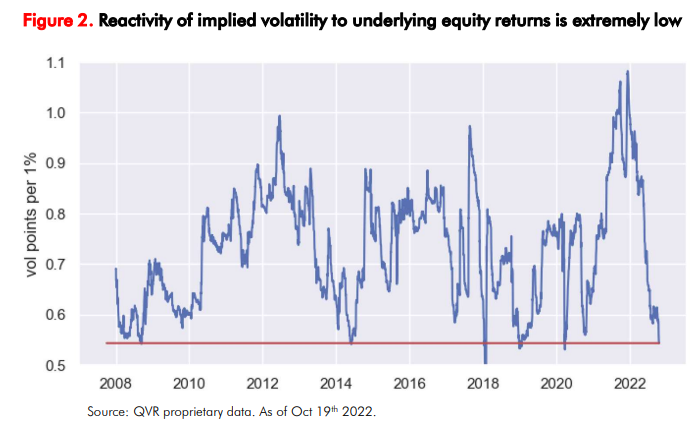
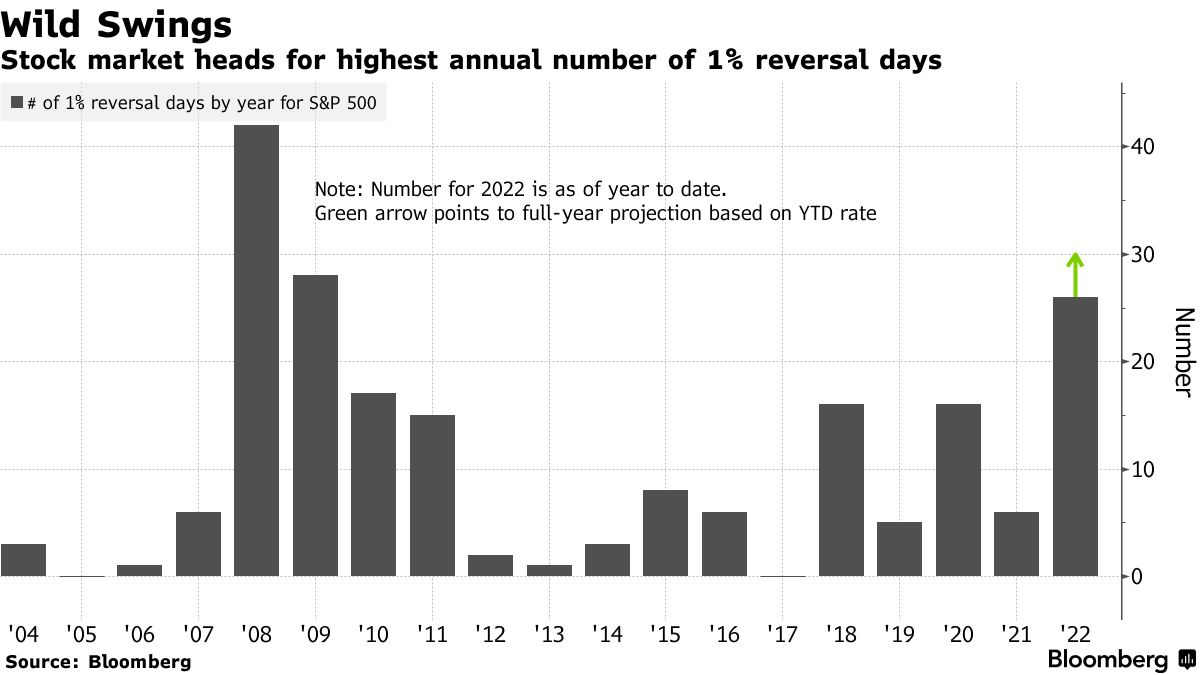
This is pursuant to our statements on the compression of implied volatility (evidenced by a shift lower in the term structure, particularly at the front end where options are most sensitive) compounding macro-type repositioning, with follow-on support coming from the reach for “Deltas and leverage” to the upside (call options)

Graphic: Retrieved from Goldman Sachs Group Inc (NYSE: GS).

As Alfonso Peccatiello of The Macro Compass puts it well: “incentive schemes drive people to be much more willing to pay and chase upside.” 

Preferred are “convex structures” that would benefit from rallies. 

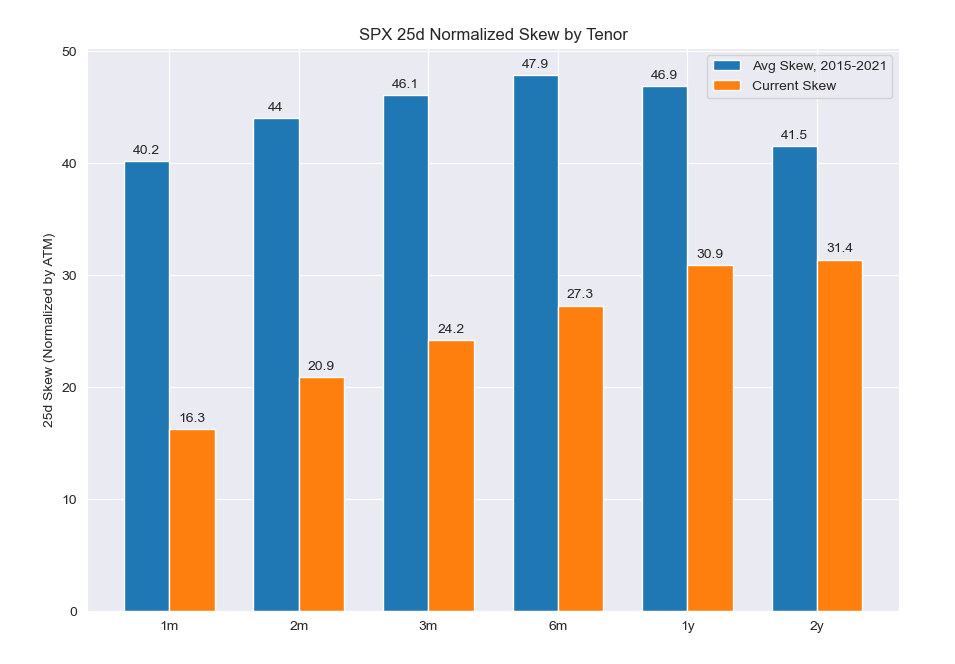
However, in traders’ monetization of put protection they owned, as well as reach for upside calls (to not miss out on a potential reversal), skew is at its lows.
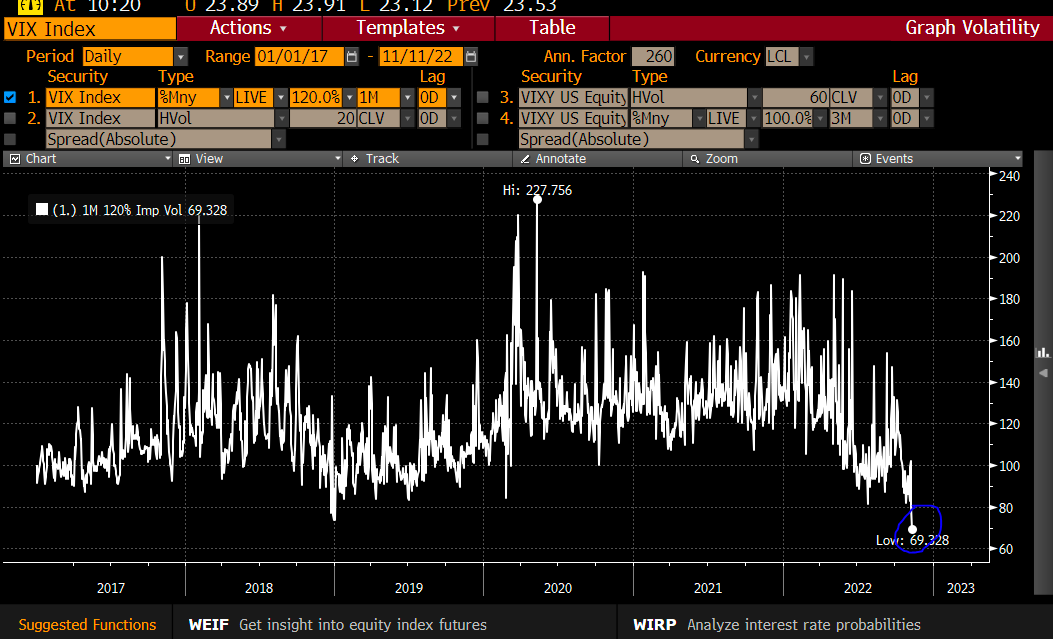
Graphic: Retrieved from The Ambrus Group’s Kris Sidial. “2017 is a year that is notorious for extremely low implied and realized vol. It is fascinating to see how insanely low the call-side volatility has been this year. There is low vol and then there is, in the gutter low vol.”

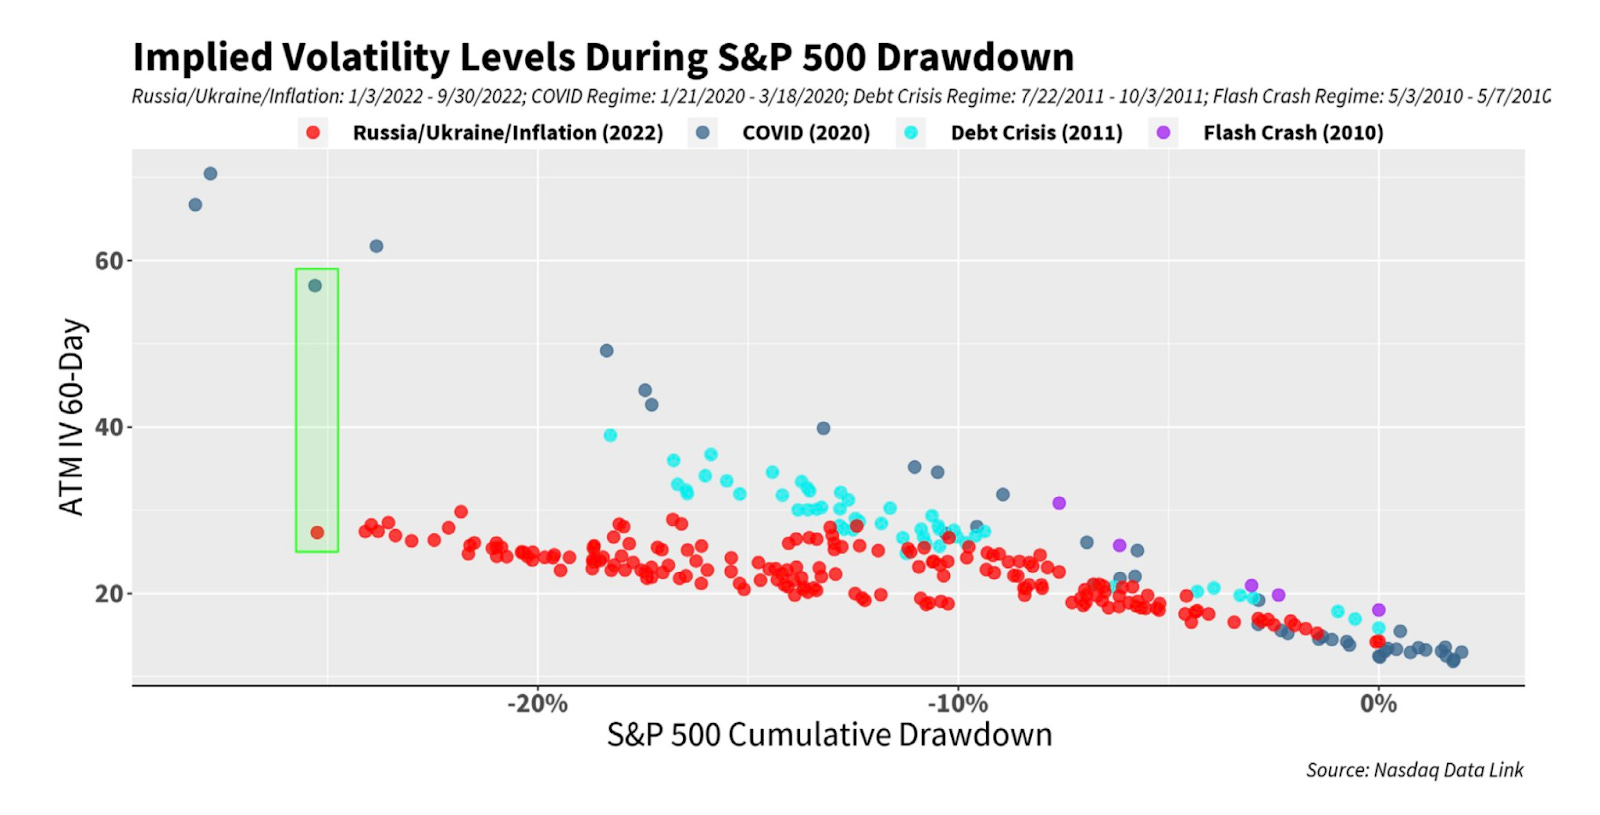
If the assumption is that “further tightening monetary policy and draining liquidity off the market might cause some problems down the road,” per Fabian Wintersberger, downside convexity (bets that trade non-linearly to changes in underlying price and volatility) are attractive.
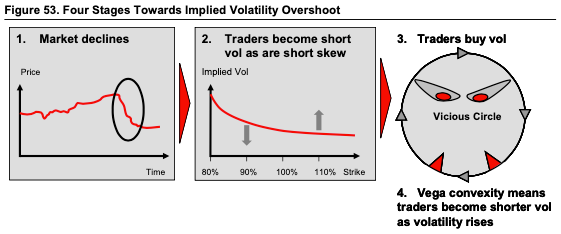
Graphic: Retrieved from Banco Santander SA (NYSE: SAN).

Trades that may be attractive include collars, as well explained in a recent thread by IPS Strategic Capital’s Pat Hennessy. 

“[T]he combination of historically flat skew [and] the highest rates we’ve seen in 15 years makes longer dated collars an attractive trade for those who are worried about the performance of stocks over the next year but do not want to sell or try timing the market.”

Technical

As of 9:00 AM ET, Tuesday’s regular session (9:30 AM – 4:00 PM ET), in the S&P 500, is likely to open in the upper part of a positively skewed overnight inventory, outside of prior-range and -value, suggesting a potential for immediate directional opportunity.

Our S&P 500 pivot for today is $4,000.25. 

Key levels to the upside include $4,069.25, $4,136.75, and $4,231.00. 

Key levels to the downside include $3,965.25, $3,913.00, and $3,871.25.

Click here to load today’s key levels into the web-based TradingView platform. All levels are derived using the 65-minute timeframe. New links are produced, daily.
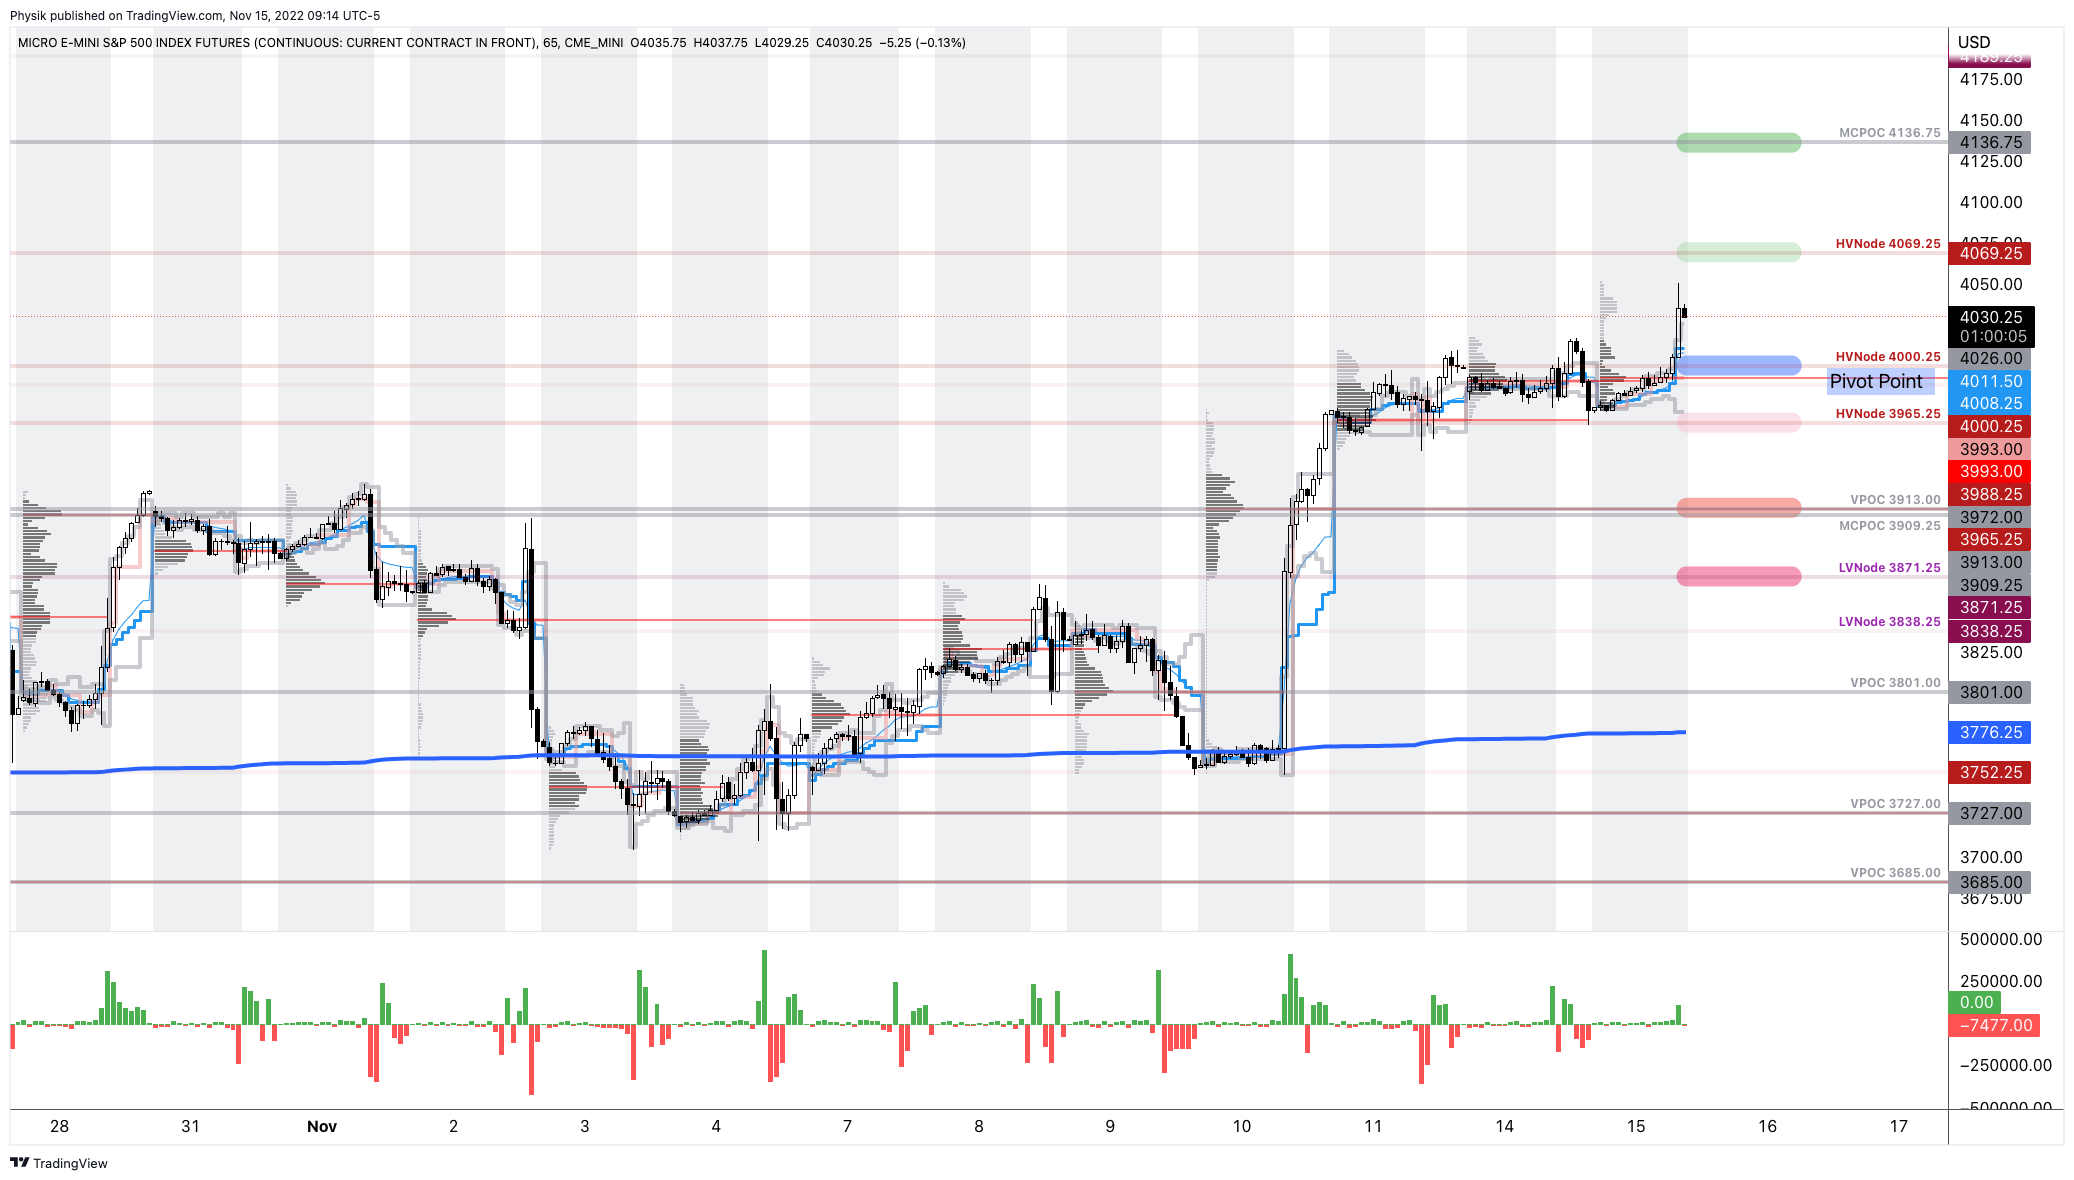
Graphic: 65-minute profile chart of the Micro E-mini S&P 500 Futures.

Definitions

Volume Areas: A structurally sound market will build on areas of high volume (HVNodes). Should the market trend for long periods of time, it will lack sound structure, identified as low volume areas (LVNodes). LVNodes denote directional conviction and ought to offer support on any test. 

If participants were to auction and find acceptance into areas of prior low volume (LVNodes), then future discovery ought to be volatile and quick as participants look to HVNodes for favorable entry or exit.

POCs: POCs are valuable as they denote areas where two-sided trade was most prevalent in a prior day session. Participants will respond to future tests of value as they offer favorable entry and exit.

MCPOCs: POCs are valuable as they denote areas where two-sided trade was most prevalent over numerous day sessions. Participants will respond to future tests of value as they offer favorable entry and exit.

About

After years of self-education, strategy development, mentorship, and trial-and-error, Renato Leonard Capelj began trading full-time and founded Physik Invest to detail his methods, research, and performance in the markets. 

Capelj also develops insights around impactful options market dynamics at SpotGamma and is a Benzinga journalist.

His works include private discussions with ARK Invest’s Catherine Wood, investors Kevin O’Leary and John Chambers, the infamous Sam Bankman-Fried of FTX, ex-Bridgewater Associate Andy Constan, Kai Volatility’s Cem Karsan, The Ambrus Group’s Kris Sidial, the Lithuanian Delegation’s Aušrinė Armonaitė, among many others.

Contact

Direct queries to renato@physikinvest.com or Renato Capelj#8625 on Discord.

Disclaimer

Do not construe this newsletter as advice. All content is for informational purposes.

Categories
Commentary

Daily Brief For November 11, 2022

The daily brief is a free glimpse into the prevailing fundamental and technical drivers of U.S. equity market products. Join the 1,200+ that read this report daily, below!

Graphic updated 8:45 AM ET. Sentiment Risk-On if expected /ES open is above the prior day’s range. /ES levels are derived from the profile graphic at the bottom of the following section. Levels may have changed since initially quoted; click here for the latest levels. SqueezeMetrics Dark Pool Index (DIX) and Gamma (GEX) calculations are based on where the prior day’s reading falls with respect to the MAX and MIN of all occurrences available. A higher DIX is bullish. At the same time, the lower the GEX, the more (expected) volatility. Learn the implications of volatility, direction, and moneyness. Breadth reflects a reading of the prior day’s NYSE Advance/Decline indicator. VIX reflects a current reading of the CBOE Volatility Index (INDEX: VIX) from 0-100.

Administrative

A light letter. We’ll go into far more detail to start next week. See you, then!

Positioning

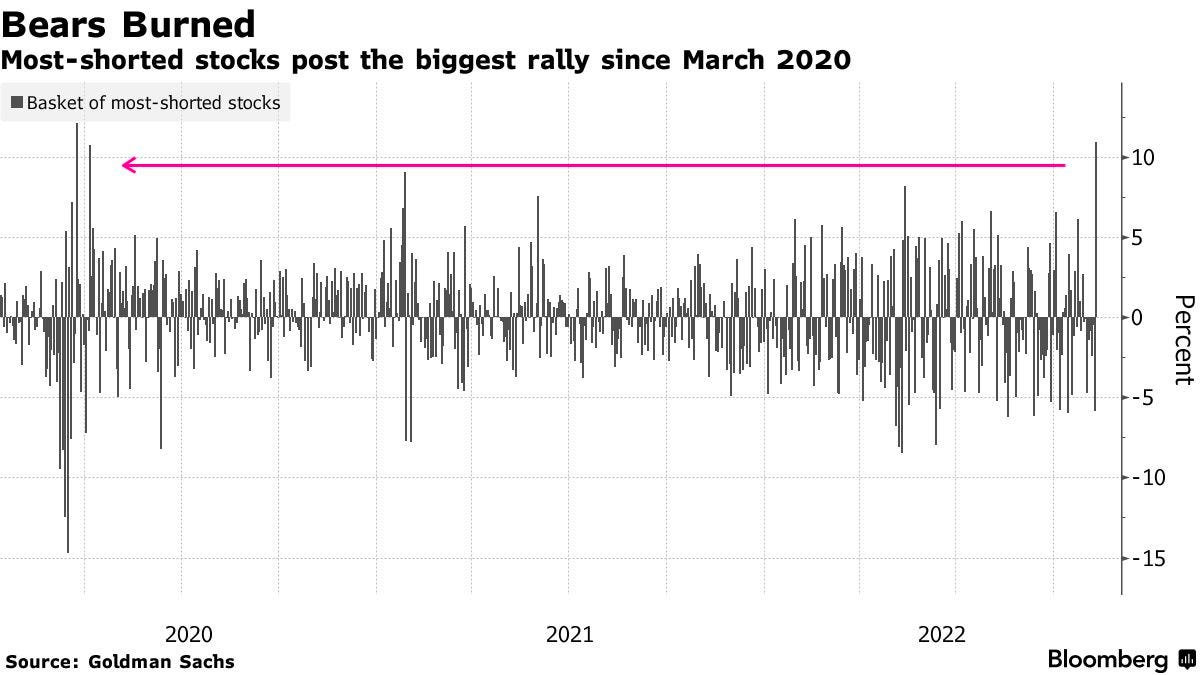
Assets rallied following a downside surprise in figures for headline annual inflation. Some policymakers also expressed a view that the pace of rate hikes could slow.

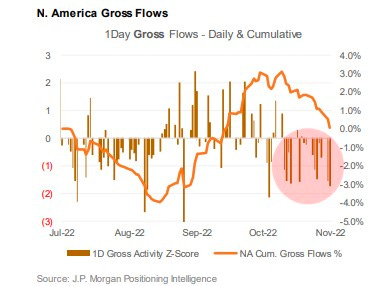
Graphic: Retrieved from Bloomberg. It’s not a coincidence that the most-shorted stocks of 2022 posted their biggest rally since 2020.

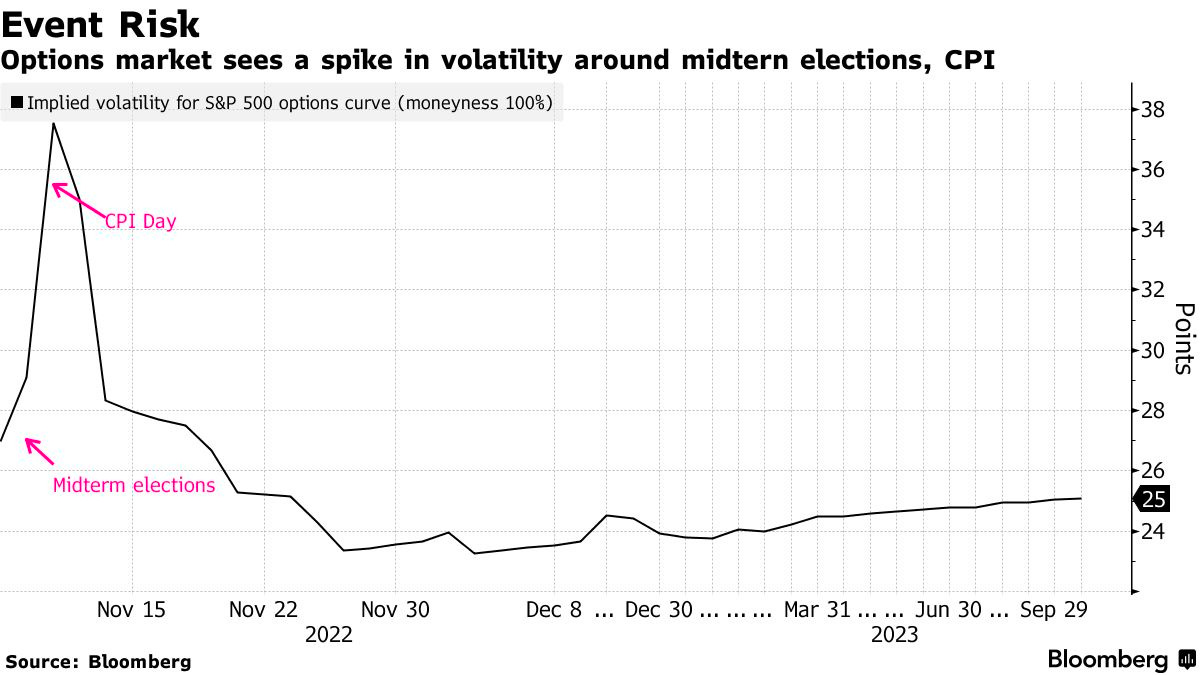
Barring the worst case, the stage was set for relief. Traders sought protection, as evidenced by a persistent bid in implied volatility (IVOL), which compounded the pressures of de-grossing.

Graphic: Retrieved from Bloomberg.

There was a “clustering of vol[atility] demand to hedge” elections and CPI, per Kai Volatility’s Cem Karsan. On the back of that, “the potential Vanna flows that [would] come from these events” are very positive.

Per SpotGamma, when “nothing bad happen[ed], and traders close[d] those puts, that … bolster[ed] [upside].”

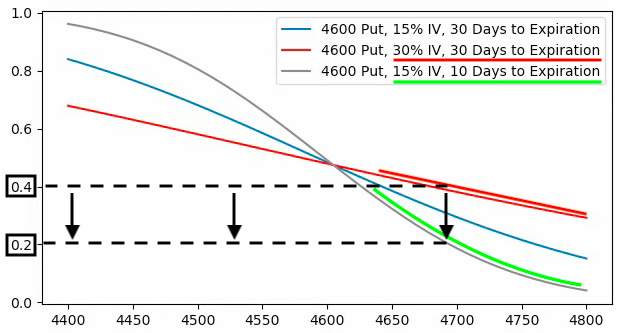
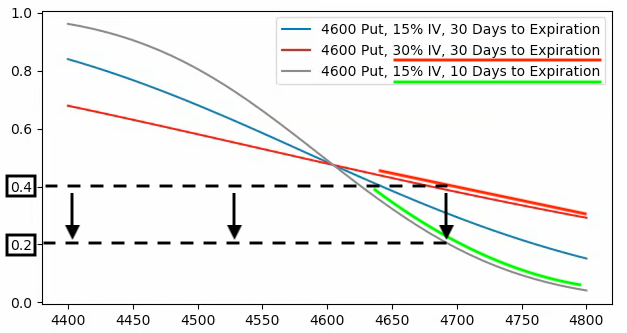
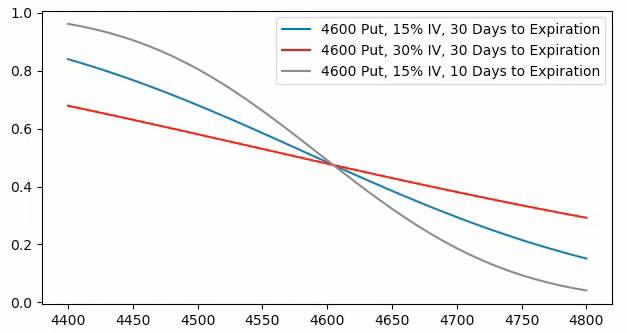
Graphic: Retrieved from SpotGamma. SPX prices X-axis. Option Delta Y-axis. When the factors of implied volatility (Vanna) and time (Charm) change, hedging ratios change. The graphic is for illustrational purposes, only.

Karsan adds the market is entering a period during which there’s less liquidity to absorb decaying protection with respect to time (Charm).

This may drive (bullish) seasonality.

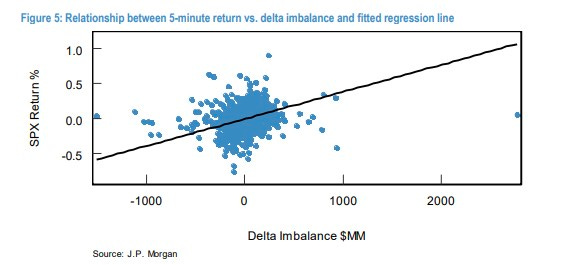
Risks are brewing, though. The very poor hedging heading into this next rally may set the stage for a violent downside. Traders not well-hedged may seek protection when something bad happens, and this will compound macro-type sales, particularly if the activity is in options with less time to expiration (note the below graphic).

Graphic: Retrieved from JPMorgan Chase & Co (NYSE: JPM) via Bloomberg. “There is indeed some market impact on the SPX from [ultra-short-dated options],” the team wrote. 

Technical

As of 7:45 AM ET, Friday’s regular session (9:30 AM – 4:00 PM ET), in the S&P 500, is likely to open in the middle part of a positively skewed overnight inventory, outside of prior-range and -value, suggesting a potential for immediate directional opportunity.

In the best case, the S&P 500 trades higher.

Any activity above the $3,964.75 HVNode puts into play the $4,001.00 VPOC. Initiative trade beyond the VPOC could reach as high as the $4,069.25 HVNode and $4,136.75 MCPOC, or higher.

In the worst case, the S&P 500 trades lower.

Any activity below the $3,964.75 HVNode puts into play the $3,913.00 VPOC. Initiative trade beyond the VPOC could reach as low as the $3,871.25 and $3,838.25 LVNode, or lower.

Click here to load today’s key levels into the web-based TradingView charting platform. Note that all levels are derived using the 65-minute timeframe. New links are produced, daily.

Graphic: 65-minute profile chart of the Micro E-mini S&P 500 Futures.

Definitions

Volume Areas: A structurally sound market builds on high-volume (HVNodes) areas.

Should the market trend for long periods of time, it will lack sound structure, identified as low-volume areas (LVNodes). LVNodes denote directional conviction and ought to offer support on any test. 

If participants were to auction and find acceptance into areas of low volume, then future discovery ought to be volatile and quick as participants look to HVNodes for favorable entry or exit.

POCs: POCs are valuable as they denote areas where two-sided trade was most prevalent in a prior day session. Participants will respond to future tests of value as they offer favorable entry and exit.

MCPOCs: POCs are valuable as they denote areas where two-sided trade was most prevalent over numerous day sessions. Participants will respond to future tests of value as they offer favorable entry and exit.

About

After years of self-education, strategy development, mentorship, and trial-and-error, Renato Leonard Capelj began trading full-time and founded Physik Invest to detail his methods, research, and performance in the markets.

Capelj also develops insights around impactful options market dynamics at SpotGamma and is a Benzinga reporter.

Some of his works include conversations with ARK Invest’s Catherine Wood, investors Kevin O’Leary and John Chambers, FTX’s Sam Bankman-Fried, ex-Bridgewater Associate Andy Constan, Kai Volatility’s Cem Karsan, The Ambrus Group’s Kris Sidial, among many others.

Disclaimer

In no way should the materials herein be construed as advice. Derivatives carry a substantial risk of loss. All content is for informational purposes only.

Categories
Commentary

Daily Brief For November 10, 2022

The daily brief is a free glimpse into the prevailing fundamental and technical drivers of U.S. equity market products. Join the 1,200+ that read this report daily, below!

Graphic updated 8:00 AM ET. Sentiment Neutral if expected /ES open is inside of the prior day’s range. /ES levels are derived from the profile graphic at the bottom of the following section. Levels may have changed since initially quoted; click here for the latest levels. SqueezeMetrics Dark Pool Index (DIX) and Gamma (GEX) calculations are based on where the prior day’s reading falls with respect to the MAX and MIN of all occurrences available. A higher DIX is bullish. At the same time, the lower the GEX, the more (expected) volatility. Learn the implications of volatility, direction, and moneyness. Breadth reflects a reading of the prior day’s NYSE Advance/Decline indicator. VIX reflects a current reading of the CBOE Volatility Index (INDEX: VIX) from 0-100.

Administrative

Yesterday, this letter unpacked the events surrounding recent crypto-market turmoil. There were some loose ends we will continue to clean up below and in the coming letters.

Fundamental

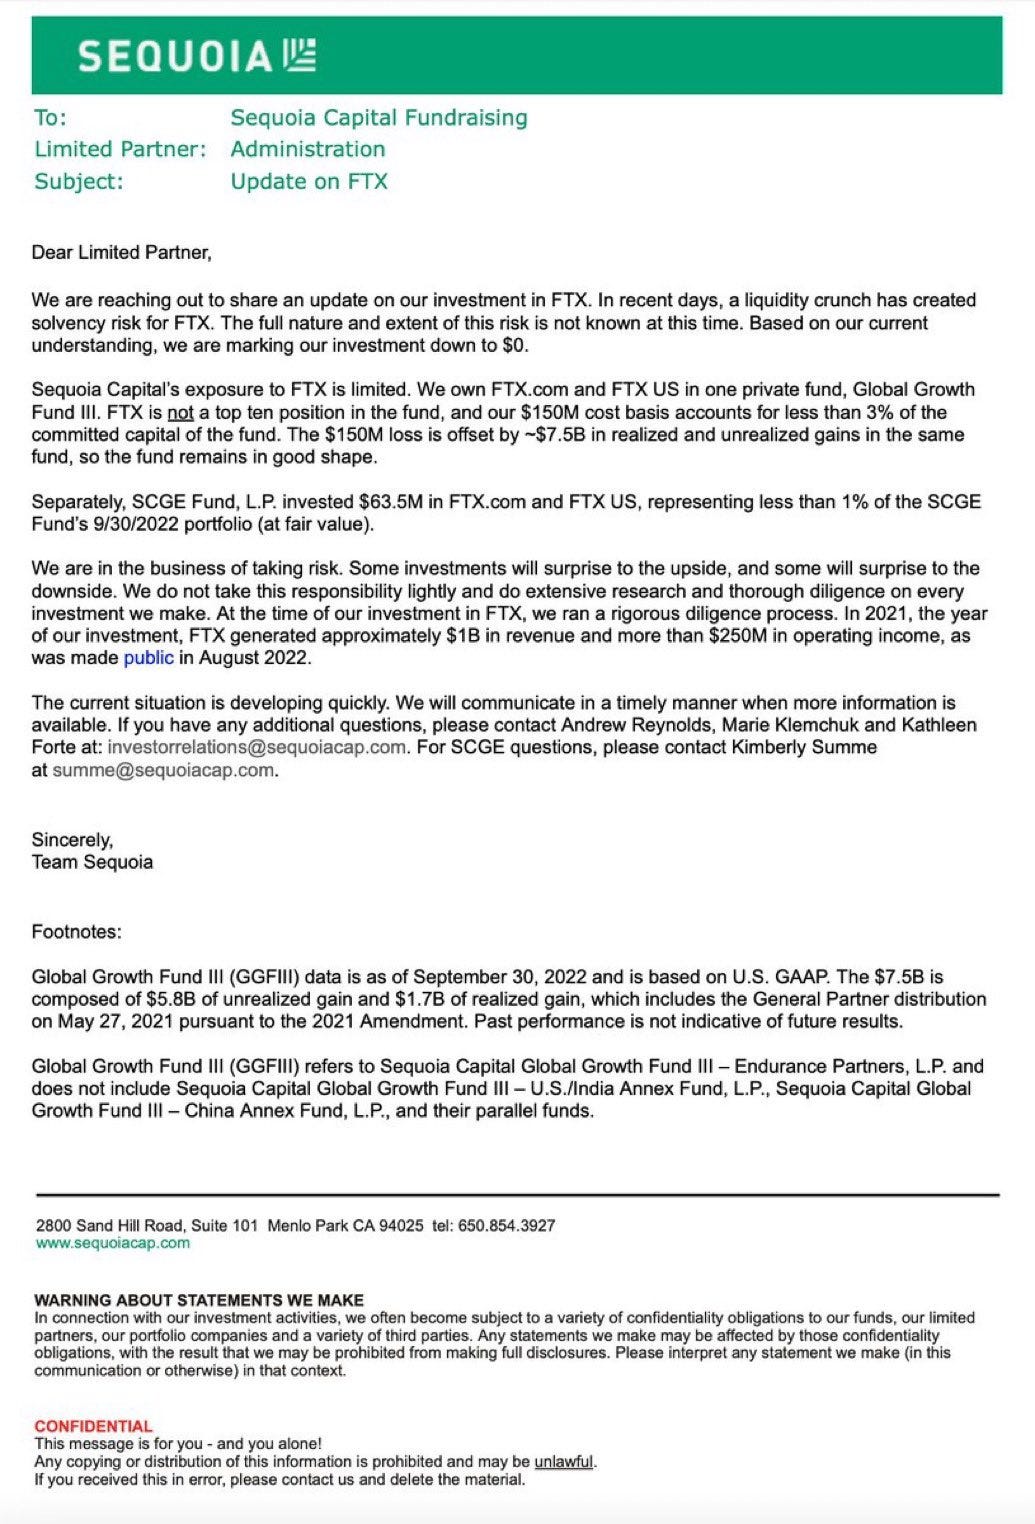
As a recap, the “seemingly untouchable” FTX.com (CRYPTO: FTT) is on a path toward bankruptcy online reports appear to show. In short, the firm has a shortfall of ~$8 billion prompting investors like Sequoia Capital to write down the full value of their investments in FTX.com and FTX.US, the latter of which owns names like Blockfolio and LedgerX, and is allegedly “unaffected by its parent company’s liquidity.”

Graphic: Retrieved from Litquidity’s Exec Sum newsletter.

It’s the case that, unlike what I was explained to by Sam Bankman-Fried (SBF), with FTX.com (not FTX.US which is required to hold customer assets 1:1) there is counterparty risk, of sorts. 

As well put by Bloomberg’s Matt Levine, there’s a timing problem that’s “connected to a real economic risk.” The safety provided by “systems that automatically liquidate trades” was overwhelmed by the dangers of volatility and a simultaneous bank run.

The complicated part is as follows: “whereas the basic model of Coinbase Global Inc (NASDAQ: COIN) is ‘they buy Bitcoin (CRYPTO: BTC) for you and put it in an envelope,’ the basic model of FTX has to be ‘they lend your money to buy crypto and then make use of your crypto to get money.’ In financial terms, they … rehypothecate your collateral; you can’t expect them to just keep it in an envelope if they’re lending you the money” for leveraged trading.

Accordingly, “[t]he reason for a run on FTX is if you think that FTX loaned Alameda [Research, a trading firm also founded by SBF], a bunch of customer assets and got back FTT in exchange. If that’s the case, then a crash in the price of FTT will destabilize FTX. If you’re worried about that, you should take your money out of FTX before the crash. If everyone is worried about that, they will all take their money out of FTX. But FTX doesn’t have their money; it has FTT and a loan to Alameda. If they all take their money out, that’s a bank run.”

“[D]ue to recent revelations,” Binance Holdings Ltd’s (CRYPTO: BNB) founder Changpeng Zhao (CZ) was prompted to sell large FTT holdings. “People worried that this would tank the price of FTT and put pressure on FTX, so they started withdrawing money from FTX. FTX didn’t have the money, and SBF started calling around asking for a loan or a bailout.”

The proposed bailout has since been withdrawn and CZ established some major takeaways as a result of the event: “1: Never use a token you created as collateral [and] 2: Don’t borrow if you run a crypto business. Don’t use capital ‘efficiently’. Have a large reserve.”

Now that the deal has fallen through, Coinbase’s CEO Brian Armstrong says it is likely users of FTX will “take losses.”

In summary, Alameda and FTX were far closer than they appeared. Alameda tapped into some large reserves of FTT and used them as collateral when borrowing customer funds from FTX. 

Per The Milk Road: If “Alameda’s investments go south, or the FTT collateral starts to dump in value, then Alameda goes down, and it pulls FTX down with it.”

Some Knew Earlier Than Others:

A fall in volumes and market share, “splintered attention”, the departure of executives including but not limited to FTX.US’ Brett Harrison and Alameda’s Sam Trabucco, “market manipulation allegations,” and “bad bull market decisions” such as partaking in NFT community “Doodles’ insane $54 million raise,” were some of the reasons prompting users to turn on FTX early.

Potential Follow-On Implication:

As Kai Volatility’s Cem Karsan puts eloquently, “[T]he collapse[s] of crypto will increasingly feed the [fire] of more traditional populism as its promise as a solution to the populism that fueled its ascent fades, leaving anger in its wake.”

That’s a narrative Karsan has maintained for as long as I can remember. Back in 2021, he and I spoke about the revolutionary technology of blockchain and its “broad association [and] use for cryptocurrency [being] tied up in the liquidity bubble that exists across all assets.”

Read the Daily Brief for November 9 to better understand this “liquidity bubble that exists across all assets.”

On the heels of scrutiny that was likely to come with some collapses, Karsan said there would likely be no “clear window where cryptocurrency is not subject to constraints,” adding that it’s likely “we move towards a digital dollar.”

Graphic: Retrieved from Bloomberg.

Circle (CRYPTO: USDC) co-founder and CEO Jeremy Allaire noted, too: 

“Once again, it’s moments like these that require all of us to hold crypto to a higher standard, a standard with greater transparency and accountability, enshrined in practice and in law,” adding that “Circle has no material exposure to FTX and Alameda.”

A ‘Good Practice For Indie Traders’: 

Independent volatility trader Darrin Johnson suggests traders “[s]weep excess cash into short-term T-notes or [money-market] accounts.” In case of some catastrophic events, “securities will be reimbursed at a higher notional value than cash.”

FTX’s Roadmap ‘For The Next Week’:

An online whistleblower shared messages allegedly sent by SBF to employees. 

In short, SBF’s “number one priority, right now, is to do right by customers.” To do so requires “a raise” which “may end up being a combined FTX Int[ernational] and FTX.US infusion.” Without a cash injection, the company would likely file for bankruptcy.

It’s reported SBF et al transferred ~$4 billion in FTX funds (e.g., customer deposits) to help buoy Alameda Research after severe losses including a $500 million loan agreement with Voyager.

Technical

As of 8:00 AM ET, Thursday’s regular session (9:30 AM – 4:00 PM ET), in the S&P 500, is likely to open in the upper part of a positively skewed overnight inventory, inside of prior-range and -value, suggesting a limited potential for immediate directional opportunity.

In the best case, the S&P 500 trades higher.

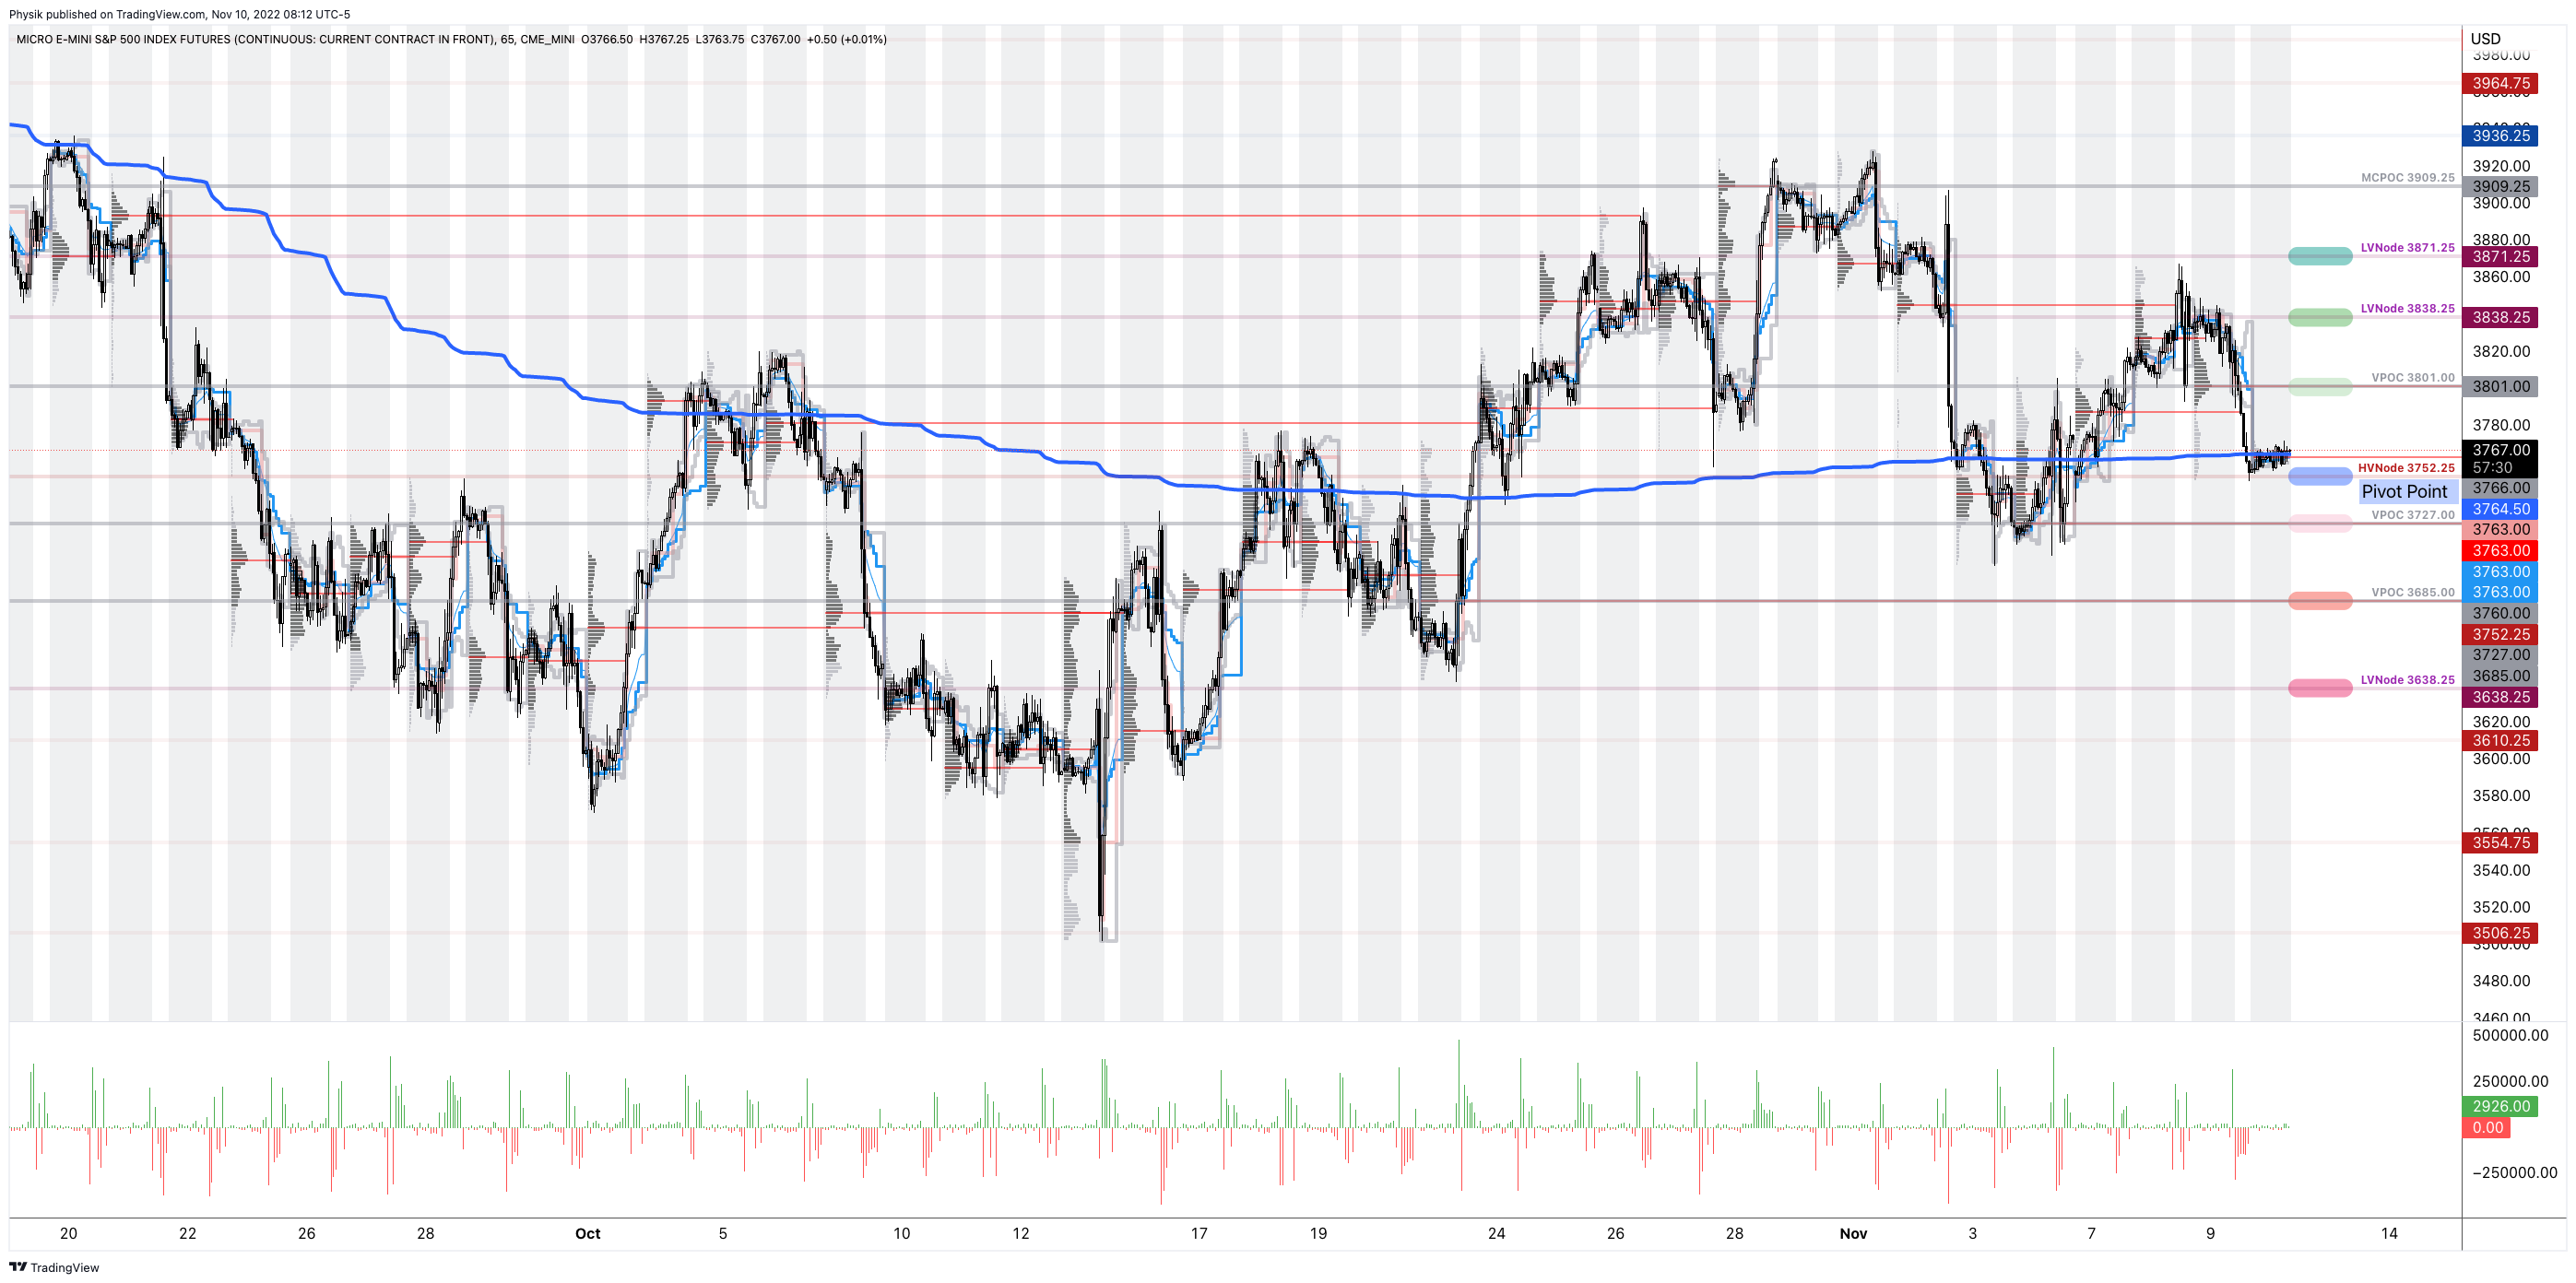
Any activity above the $3,752.25 HVNode puts into play the $3,801.00 VPOC. Initiative trade beyond the VPOC could reach as high as the $3,838.25 and $3,871.25 LVNode, or higher.

In the worst case, the S&P 500 trades lower.

Any activity below the $3,752.25 HVNode puts into play the $3,727.00 VPOC. Initiative trade beyond the latter could reach as low as the $3,685.00 VPOC and $3,638.25 LVNode, or lower.

Click here to load today’s key levels into the web-based TradingView charting platform. Note that all levels are derived using the 65-minute timeframe. New links are produced, daily.

Graphic: 65-minute profile chart of the Micro E-mini S&P 500 Futures.

Considerations: Futures tied to the S&P 500 are trading within close proximity to a blue line in the above graphic. This blue line depicts a volume-weighted average price (VWAP) anchored to price action following the release of consumer price data on September 13, 2022.

The VWAP metric is highly regarded by chief investment officers, among other participants, for the quality of trade. Additionally, liquidity algorithms are benchmarked and programmed to buy and sell around VWAPs.

Should the S&P 500 auction away from this level, and come back to it, a prudent response is to fade. If the price is above the VWAP, and it auctions lower, into the VWAP, traders would buy. On the other hand, if the price is below the VWAP, and it auctions higher, into the VWAP, sell.

At this time, the S&P 500 is near VWAP offering traders lower (directional) opportunities.

Definitions

Volume Areas: A structurally sound market will build on areas of high volume (HVNodes). Should the market trend for long periods of time, it will lack sound structure, identified as low volume areas (LVNodes). LVNodes denote directional conviction and ought to offer support on any test. 

If participants were to auction and find acceptance into areas of prior low volume (LVNodes), then future discovery ought to be volatile and quick as participants look to HVNodes for favorable entry or exit.

POCs: POCs are valuable as they denote areas where two-sided trade was most prevalent in a prior day session. Participants will respond to future tests of value as they offer favorable entry and exit.

About

After years of self-education, strategy development, mentorship, and trial-and-error, Renato Leonard Capelj began trading full-time and founded Physik Invest to detail his methods, research, and performance in the markets.

Capelj also develops insights around impactful options market dynamics at SpotGamma and is a Benzinga reporter.

Some of his works include conversations with ARK Invest’s Catherine Wood, investors Kevin O’Leary and John Chambers, FTX’s Sam Bankman-Fried, ex-Bridgewater Associate Andy Constan, Kai Volatility’s Cem Karsan, The Ambrus Group’s Kris Sidial, among many others.

Disclaimer

In no way should the materials herein be construed as advice. Derivatives carry a substantial risk of loss. All content is for informational purposes only.

Categories
Commentary

Daily Brief For November 8, 2022

The daily brief is a free glimpse into the prevailing fundamental and technical drivers of U.S. equity market products. Join the 1,200+ that read this report daily, below!

Graphic updated 9:15 AM ET. Sentiment Risk-On if expected /ES open is above the prior day’s range. /ES levels are derived from the profile graphic at the bottom of the following section. Levels may have changed since initially quoted; click here for the latest levels. SqueezeMetrics Dark Pool Index (DIX) and Gamma (GEX) calculations are based on where the prior day’s reading falls with respect to the MAX and MIN of all occurrences available. A higher DIX is bullish. At the same time, the lower the GEX, the more (expected) volatility. Learn the implications of volatility, direction, and moneyness. Breadth reflects a reading of the prior day’s NYSE Advance/Decline indicator. VIX reflects a current reading of the CBOE Volatility Index (INDEX: VIX) from 0-100.

Administrative

This letter’s author is ramping up coverage and returning to speed after a short hiatus. Today’s focus will be on adding to the “Positioning” section of Monday’s letter.

Positioning

After some late-October weakness that is coinciding with the Federal Reserve’s (Fed) decision to raise rates, stocks are tame. This is heading into midterm elections, today, and inflation updates, Thursday.

Graphic: Retrieved from Bloomberg. Created by JPMorgan Chase & Co (NYSE: JPM).

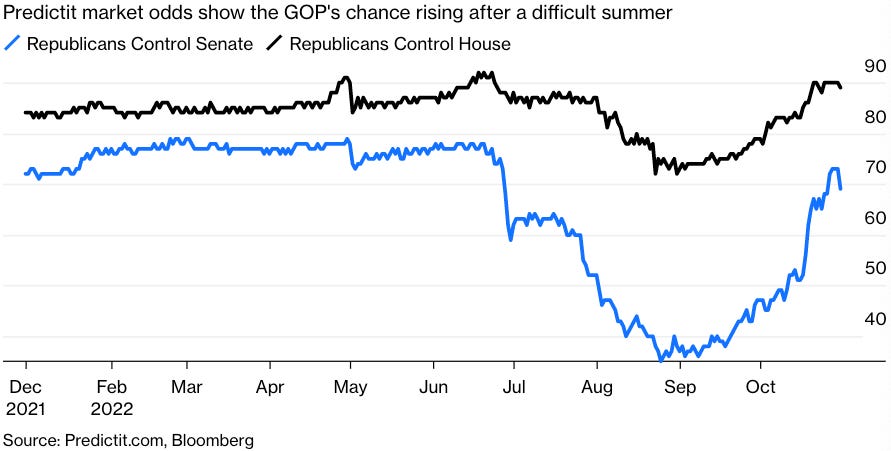
Republicans are likely to add to their control of the House and Senate.

Having fewer Democrats in Congress would lower “the odds of fiscal measures [that would] embolden a hawkish Federal Reserve.” 

This is a boon for stocks.

Graphic: Retrieved from Bloomberg. “With things looking that bad, current polls show the Democrats appear to be headed for a drubbing, almost certain to lose control of the House and increasingly likely to see the Senate slip away.”

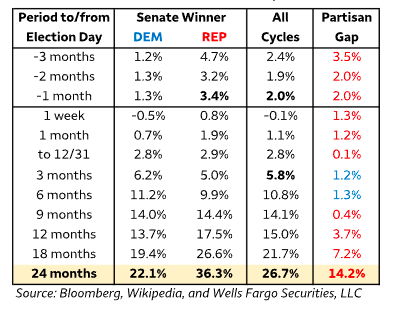
Indeed, Wells Fargo & Co (NYSE: WFC) strategists found a “GOP-controlled Senate historically is associated with superior equity returns.”

Graphic: Retrieved from Wells Fargo & Co (NYSE: WFC).

In spite of recessions, even, the S&P 500, a year after midterms, often netted positive 20% or so returns Citigroup Inc (NYSE: C) strategists add.

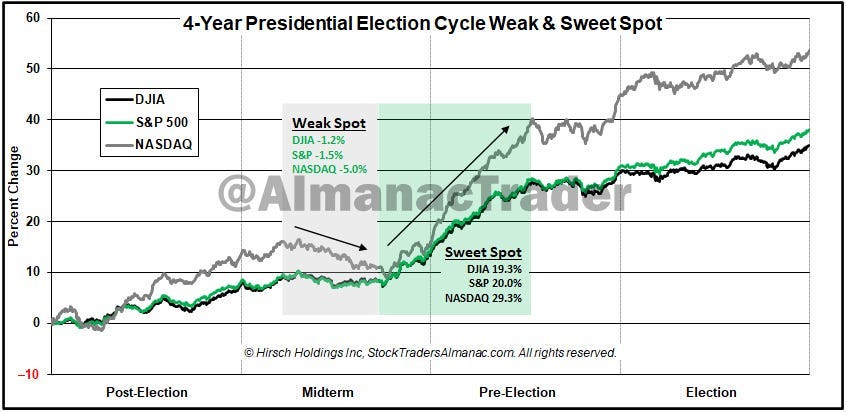
Graphic: Retrieved from Callum Thomas’ Weekly S&P 500 ChartStorm. The “seasonal/cycle outlook is for a lower low or retest of the lows over the next three months as we are in the worst two months of the year and are smack dab in the *Weak Spot* of the 4-Year Cycle”

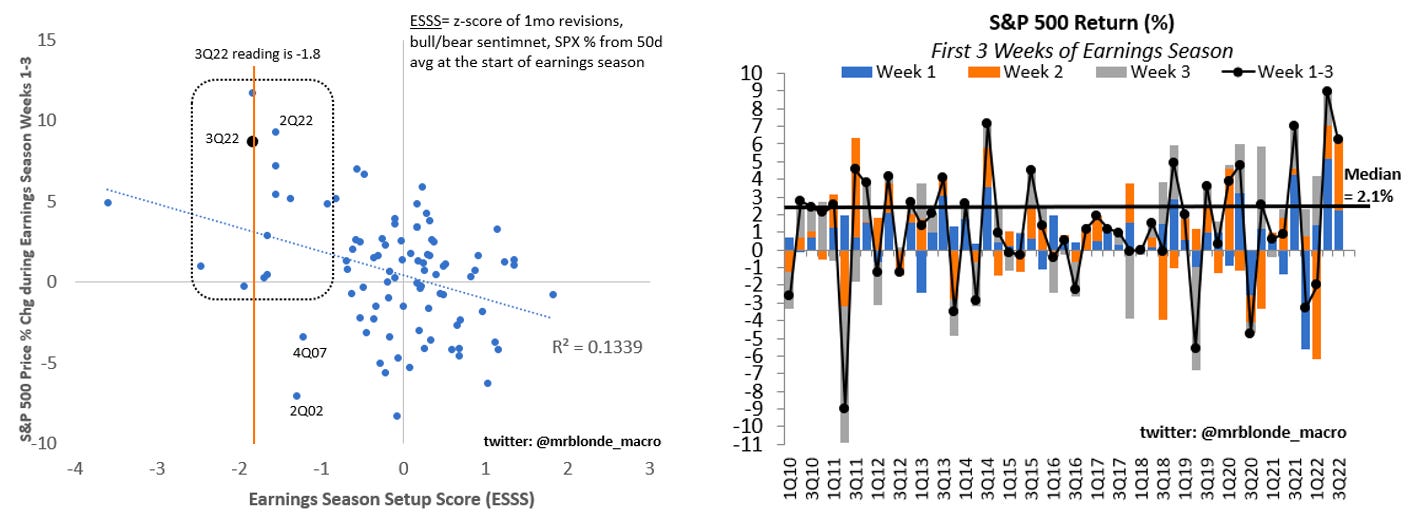
A post-election bump is on top of the general positiveness of equity performance during the earnings season and periods of strong pessimism as we have today.

Graphic: Retrieved from Mr. Blonde’s Stuck in the Middle letter.

Why all the potential positivity over this short period?

The aforementioned events are happening during a period wherein market liquidity eases (i.e., the holiday season).

It’s during this period, from a positioning perspective, the effects of decay (which we discuss more below) accelerate, and a lack of liquidity, according to Kai Volatility’s Cem Karsan, makes markets sensitive to positive-leaning flows.

Pessimism and hedging may indirectly give rise to bullishness. Why is that?

Demand for options exposures, especially across shorter time horizons, evidenced by heightened implied volatility (IVOL) at the front end (see below), has indirectly added to the pressures of de-grossing, as observed.

Graphic: Retrieved from Bloomberg.

Though positioning is generally thin, as we also talked about in yesterday’s newsletter, thus reducing the impact of the hedging of this positioning, demand remains “strong,” per Karsan, and “dealers are short that volatility.”

Derivatives strategists at the likes of the Royal Bank of Canada (NYSE: RY) agree with Karsan’s remarks; Amy Wu Silverman said that the Cboe Volatility Index’s (INDEX: VIX) elevation was the result of demand for hedges after October options expiry.

“Part of today’s move at least is a function of new positions. There is likely demand for future months since we just went through October options expiry,” she said. “Part of it is a function of the ‘floor’ of a new volatility regime.”

So, what’s the point to make?

For IVOL measures to remain wound, something bad needs to happen, in short.

Otherwise, per SpotGamma, a “decline in IVOL … can aid in a push-and-pull that actually serves to … resist far-reaching weakness” and keep selling orderly.

That’s because, from here, the removal of the protection that’s been demanded in the past days and weeks compounds the sped-up effects of Charm.

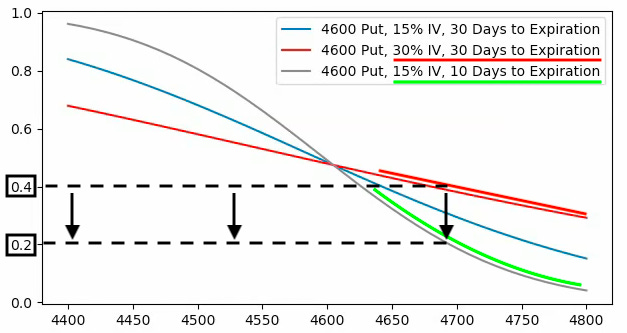
Graphic: Retrieved from SpotGamma. SPX prices X-axis. Option delta Y-axis. When the factors of implied volatility (Vanna) and time change (Charm), hedging ratios change. The graphic is for illustrational purposes, only.

Charm, which is the change in options Delta (i.e., exposure to direction) with respect to changes in time, “drives a positive window or seasonality”; “the reduction in time” and “lack of liquidity” make markets more sensitive to those positive flows.

Graphic: Retrieved from SqueezeMetrics.

In the long term, however, weakness is here to stay. Poor IVOL performance and little skew also likely set the stage for a post-holiday tail. More on this, later.

Graphic: Retrieved from Corey Hoffstein on Twitter.

Technical

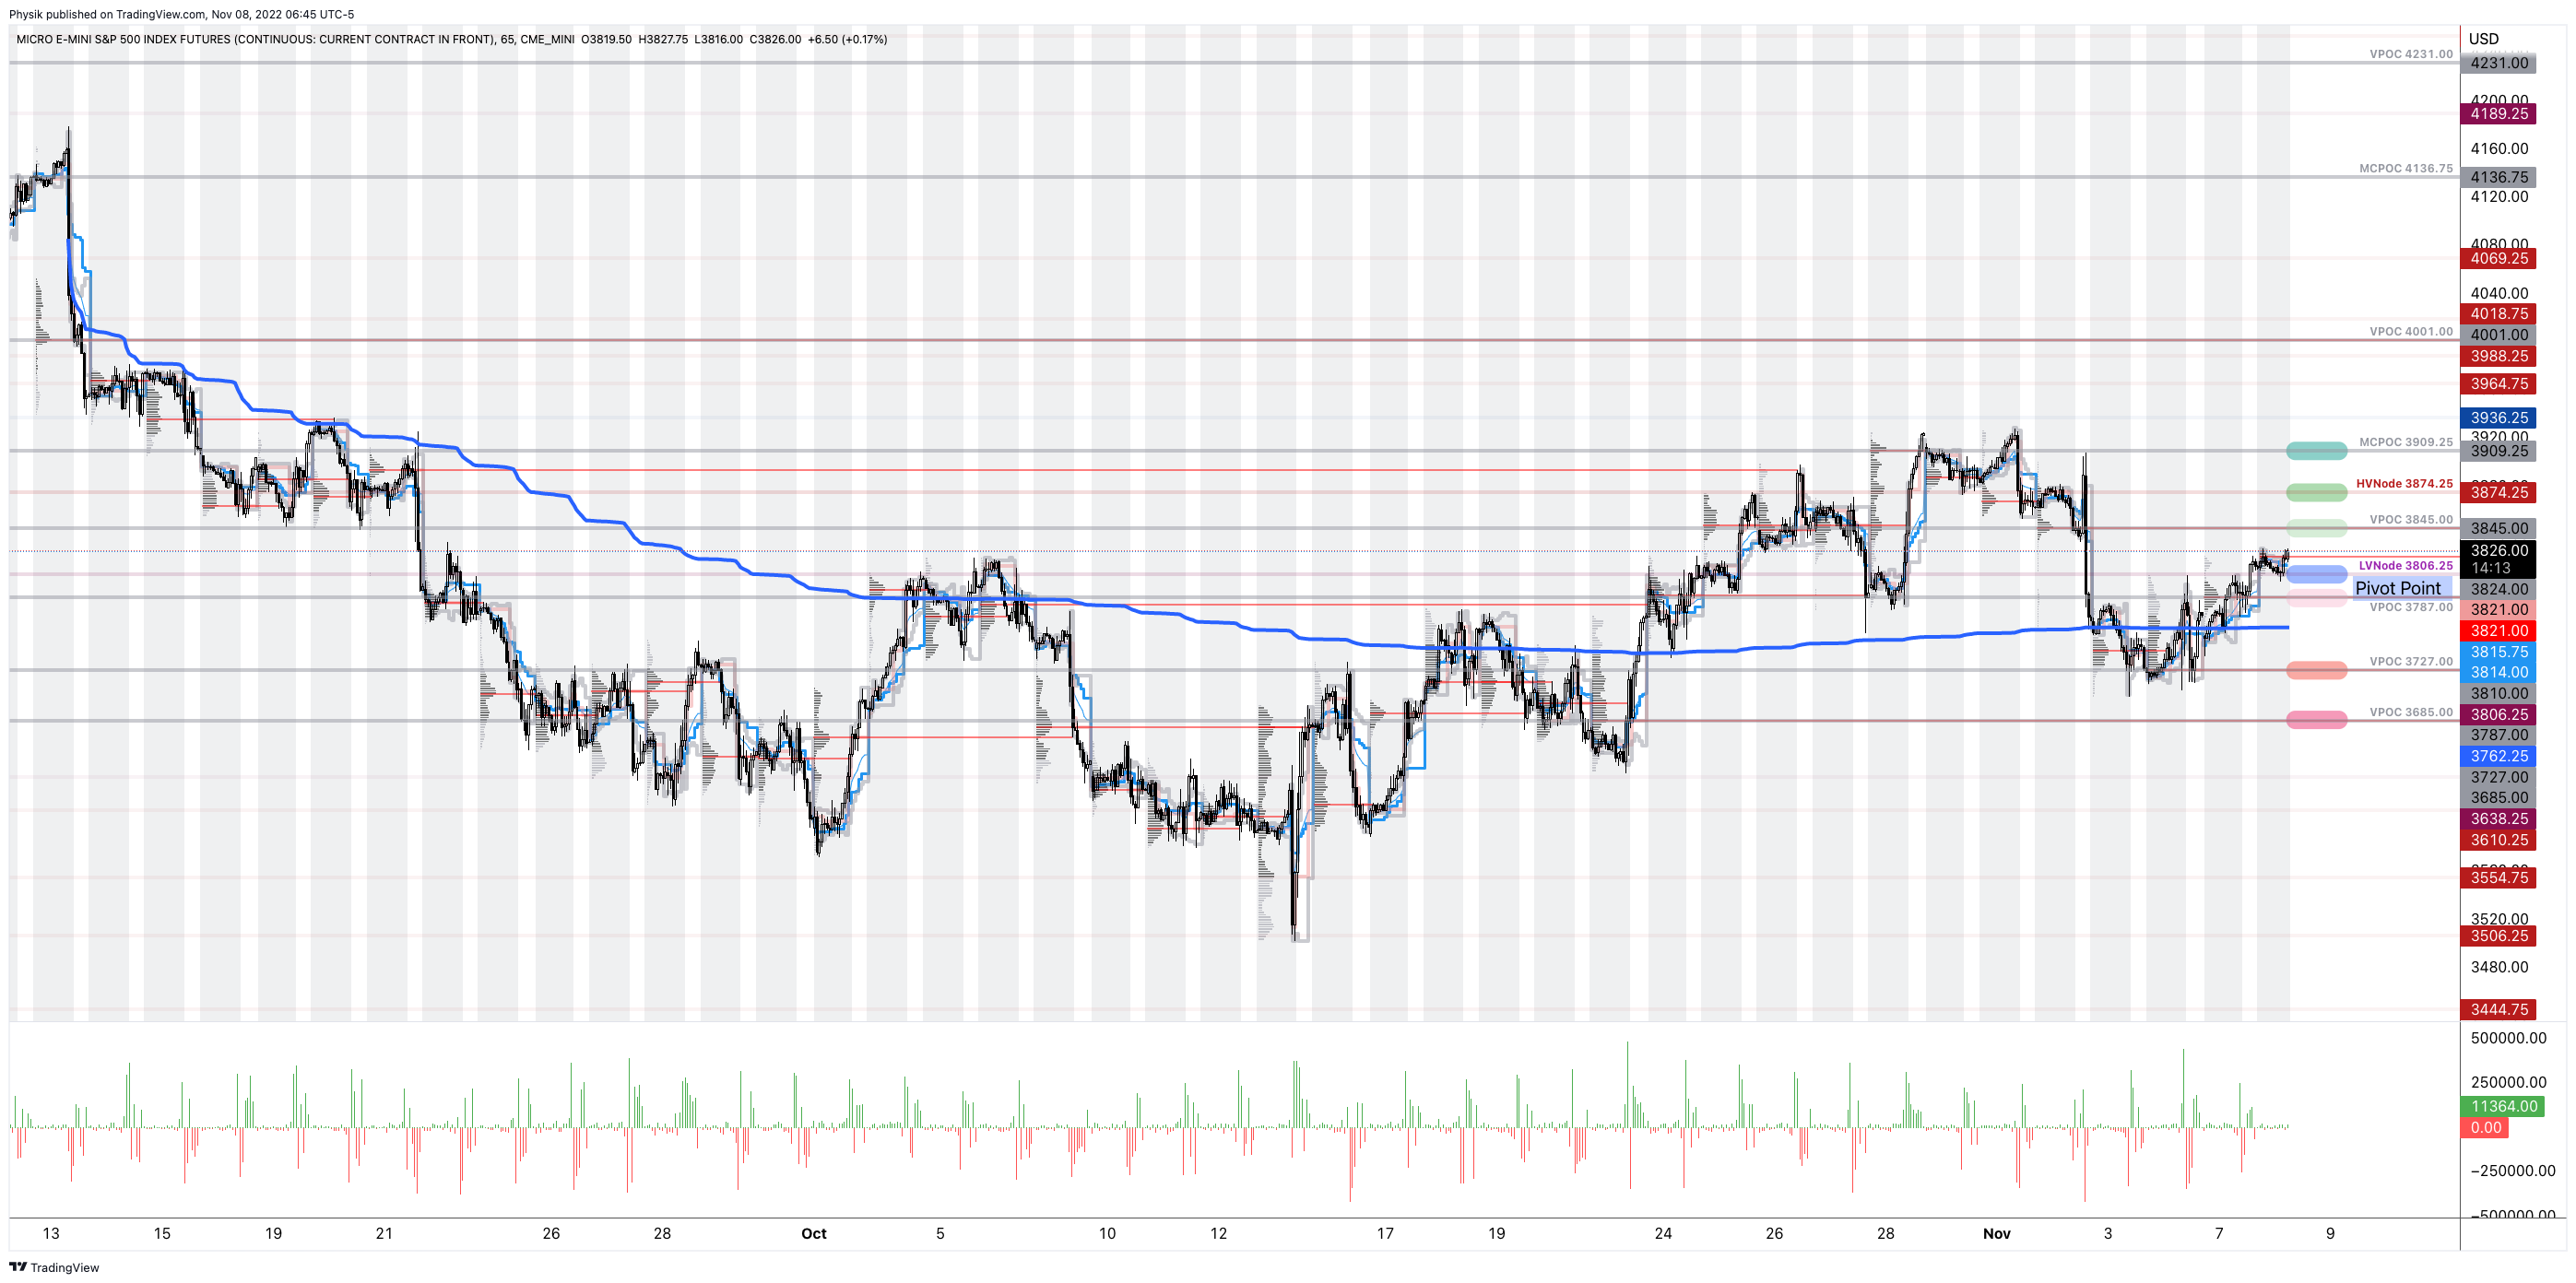
As of 6:45 AM ET, Tuesday’s regular session (9:30 AM – 4:00 PM ET), in the S&P 500, is likely to open in the upper part of a positively skewed overnight inventory, just outside of prior-range and -value, suggesting a limited potential for immediate directional opportunity.

In the best case, the S&P 500 trades higher.

If above the $3,806.25 LVNode, the $3,845.00 VPOC is in play. Initiative trade beyond the latter could reach as high as the $3,874.25 HVNode and $3,909.25 MCPOC, or higher.

In the worst case, the S&P 500 trades lower.

If above the $3,806.25 LVNode, the $3,787.00 VPOC is in play. Initiative trade beyond the latter could reach as low as the $3,727.00 and $3,685.00 VPOC, or lower.

Click here to load today’s key levels into the web-based TradingView charting platform. Note that all levels are derived using the 65-minute timeframe. New links are produced, daily.

Graphic: 65-minute profile chart of the Micro E-mini S&P 500 Futures.

Considerations: Futures tied to the S&P 500 are trading within close proximity to a blue line in the above graphic. This blue line depicts a volume-weighted average price (VWAP) anchored to price action following the release of consumer price data on September 13, 2022.

The VWAP metric is highly regarded by chief investment officers, among other participants, for the quality of trade. Additionally, liquidity algorithms are benchmarked and programmed to buy and sell around VWAPs.

Should the S&P 500 auction away from this level, and come back to it, a prudent response is to fade. If the price is above the VWAP, and it auctions lower, into the VWAP, traders would buy. On the other hand, if the price is below the VWAP, and it auctions higher, into the VWAP, sell.

At this time, the S&P 500 is near VWAP offering traders lower (directional) opportunities.


Definitions

Volume Areas: A structurally sound market will build on areas of high volume (HVNodes). Should the market trend for long periods of time, it will lack sound structure, identified as low volume areas (LVNodes). LVNodes denote directional conviction and ought to offer support on any test. 

If participants were to auction and find acceptance into areas of prior low volume (LVNodes), then future discovery ought to be volatile and quick as participants look to HVNodes for favorable entry or exit.

Gamma: Gamma is the sensitivity of an option to changes in the underlying price. Dealers that take the other side of options trades hedge their exposure to risk by buying and selling the underlying. When dealers are short-gamma, they hedge by buying into strength and selling into weakness. When dealers are long-gamma, they hedge by selling into strength and buying into weakness. The former exacerbates volatility. The latter calms volatility.

Vanna: The rate at which the delta of an option changes with respect to volatility.

Charm: The rate at which the delta of an option changes with respect to time.

POCs: POCs are valuable as they denote areas where two-sided trade was most prevalent in a prior day session. Participants will respond to future tests of value as they offer favorable entry and exit.

MCPOCs: POCs are valuable as they denote areas where two-sided trade was most prevalent over numerous day sessions. Participants will respond to future tests of value as they offer favorable entry and exit.


About

After years of self-education, strategy development, mentorship, and trial-and-error, Renato Leonard Capelj began trading full-time and founded Physik Invest to detail his methods, research, and performance in the markets.

Capelj also develops insights around impactful options market dynamics at SpotGamma and is a Benzinga reporter.

Some of his works include conversations with ARK Invest’s Catherine Wood, investors Kevin O’Leary and John Chambers, FTX’s Sam Bankman-Fried, ex-Bridgewater Associate Andy Constan, Kai Volatility’s Cem Karsan, The Ambrus Group’s Kris Sidial, among many others.

Disclaimer

In no way should the materials herein be construed as advice. Derivatives carry a substantial risk of loss. All content is for informational purposes only.


Categories
Commentary

Daily Brief For November 7, 2022

The daily brief is a free glimpse into the prevailing fundamental and technical drivers of U.S. equity market products. Join the 1,190+ that read this report daily, below!

Graphic updated 11:00 AM ET. Sentiment Neutral if expected /ES open is inside of the prior day’s range. /ES levels are derived from the profile graphic at the bottom of the following section. Levels may have changed since initially quoted; click here for the latest levels. SqueezeMetrics Dark Pool Index (DIX) and Gamma (GEX) calculations are based on where the prior day’s reading falls with respect to the MAX and MIN of all occurrences available. A higher DIX is bullish. At the same time, the lower the GEX, the more (expected) volatility. Learn the implications of volatility, direction, and moneyness. Breadth reflects a reading of the prior day’s NYSE Advance/Decline indicator. VIX reflects a current reading of the CBOE Volatility Index (INDEX: VIX) from 0-100.

Administrative

After a one-month hiatus, the Daily Brief by Physik Invest is back, albeit with new inspiration and direction.

Previously, the letter was focused on analyses of secondary and tertiary sources. New for the letter will be the inclusion of primary source information. It will be some time before these changes are most noticeable but that’s the general direction.

For instance, interviewing a country’s economic minister on policy and discussing how that policy impacts markets, at the end of it all, is on the table.

That said, apologies for not being there for the past month. I found a lot happened and I could not rid myself of the desire to unpack. This letter helps me structure trades through which real capital is at risk.

Not having the full picture did me a disservice, in short.

Going forward, I will try to feature a good mix of detail and pointedness. Take care and I look forward to learning and earning together!

Fundamental

Weekend news was centered around the tightening of financial conditions, the impact of central bank action, as well as geopolitics (e.g., Lithuania opening a trade office in Taiwan), and supply chokepoints.

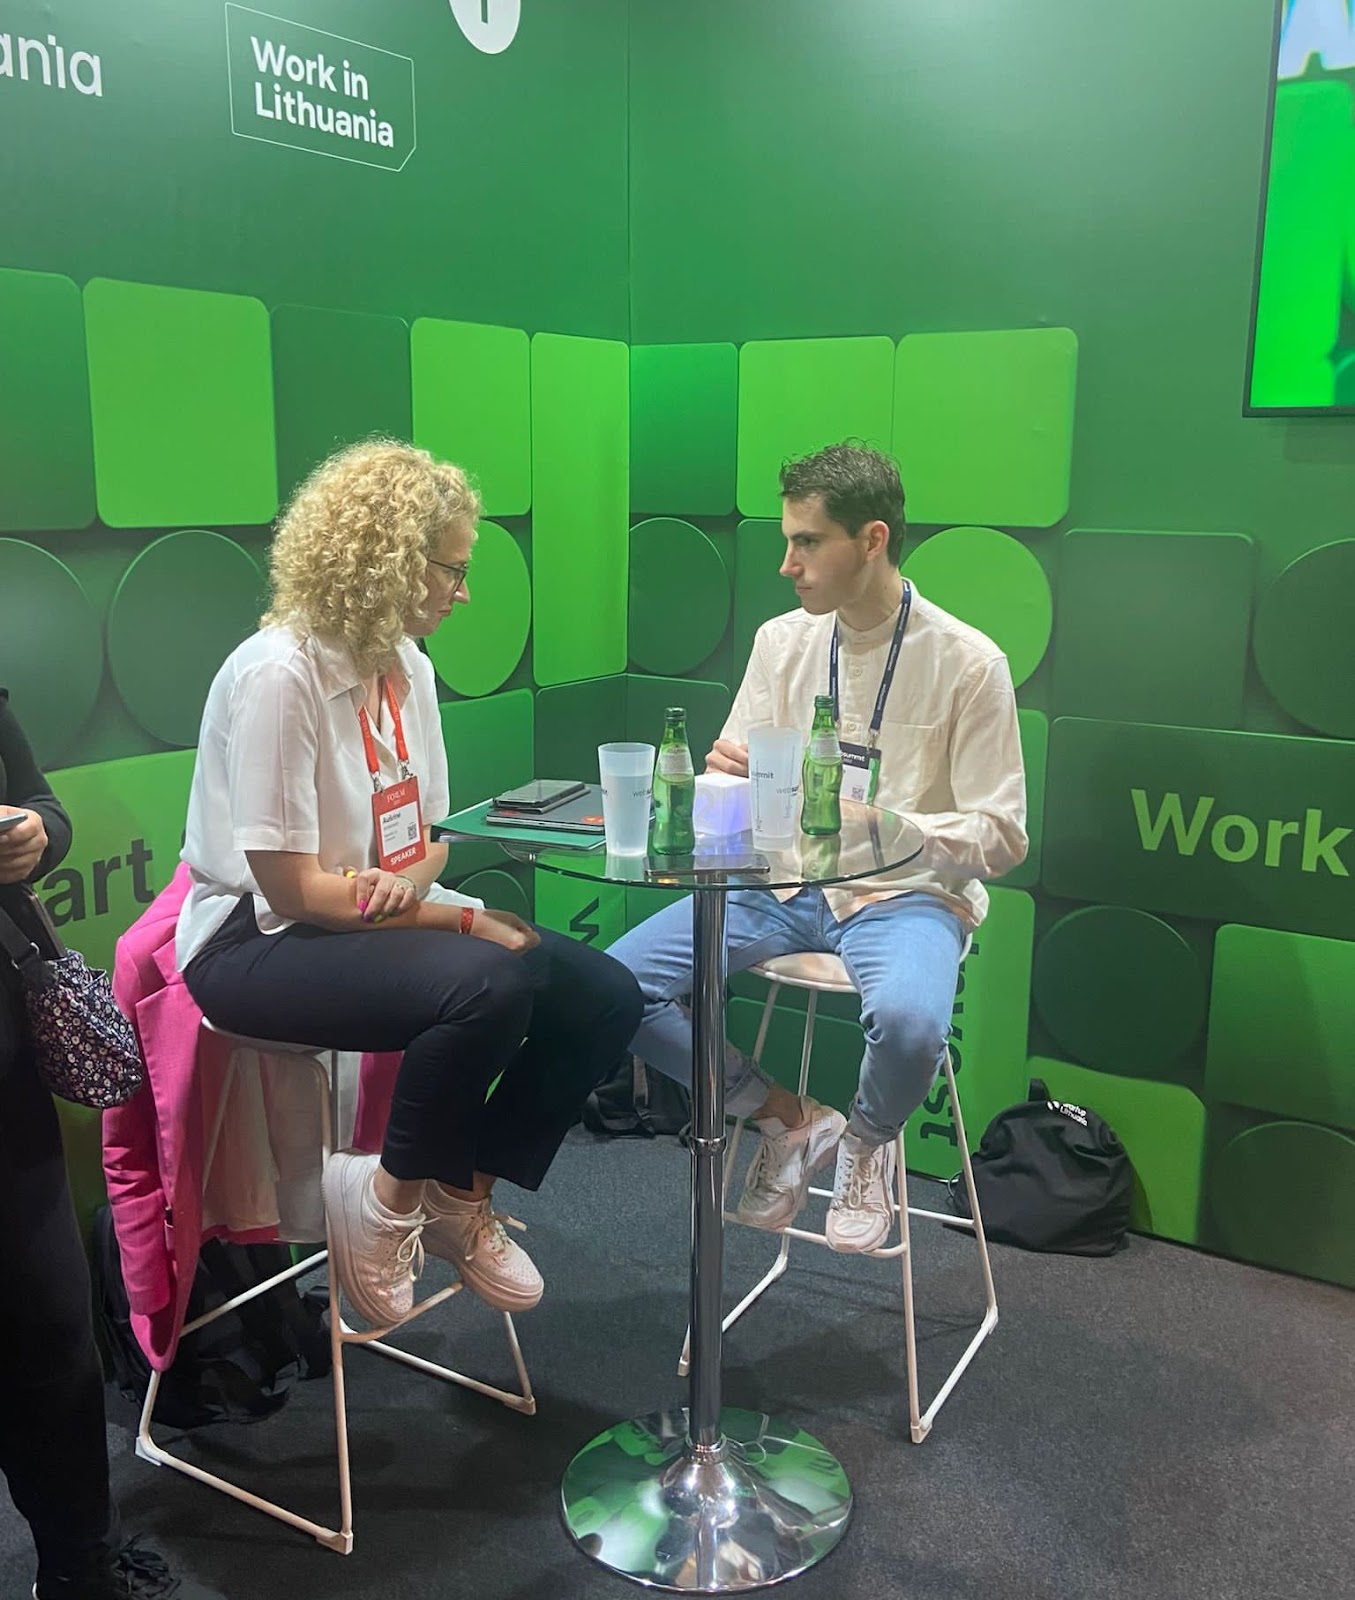
By happenstance, I interviewed the Lithuanian Economy Minister Ausrine Armonaite, quoted by Bloomberg in the above story, last week in Lisbon. More on this, later.

Graphic: Provided by the Lithuanian Delegation. Left, Lithuanian Economy Minister Ausrine Armonaite. Right, Renato Leonard Capelj conducting an interview on behalf of Benzinga.com.

The One Big Thing:

With labor still tight, former New York Fed President Bill Dudley commented that “there’s a lot of work to do … [so] inflation expectations don’t become unanchored” and force “something really, really harsh later.”

Unfortunately, the impact of actions here, in the US, is not isolated.

US tightening pains the rest of the world, too. Stronger dollars pressure emerging-market economies with dollar-denominated debts. This, ultimately, works to upend the dollar’s role as a reserve.

Margin Compression, Dollar Debt:

Dollar strength feeds margin compression (just now filtering through, according to Kai Volatility’s Cem Karsan, and impacting dollar-denominated debt), adding to the “billion[s] less in demand for assets per day” via quantitative tightening (QT).

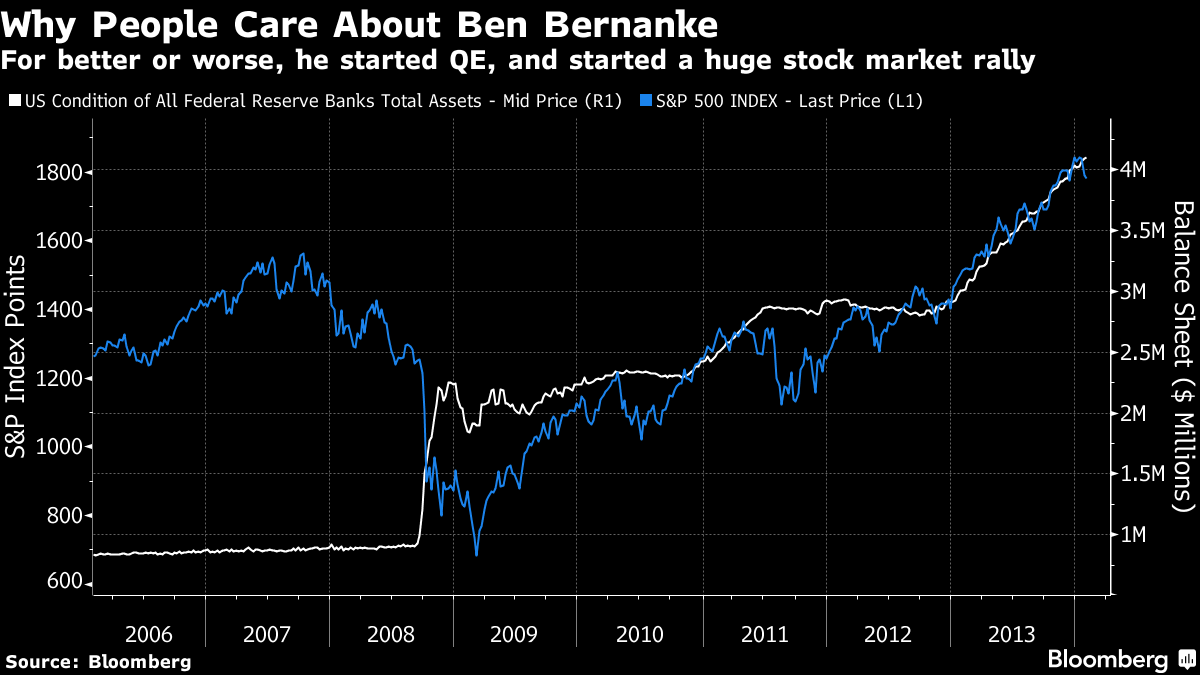
As a refresher, quantitative easing (QE) lowers interest rates and makes investments in financial assets more attractive. This bolsters asset inflation and deflation in the real economy.

Graphic: Retrieved from Bloomberg. The chart is an example showing “money-printing or ‘quantitative easing’ that [Ben Bernanke] pioneered seemed to prop up the stock market.”

QT Compounds Rising Rate Impact:

Moreover, in 2020, policymakers embarked on historic interventions.

Monetary authorities cut interest rates and bought bonds, all the while money was sent to people. Risk assets were the first to respond. Then, as the economy reopened, demand picked up, supply chains (that were slowed) tightened, and prices in the real economy inflated.

Threats to globalization and persistent supply chokepoints (e.g., Ukraine and Russia) have done little to help. Inflation remains a problem and investors are seeking safety amid Fed intervention. 

Financial assets are in less demand while real assets are in more demand; sticky inflation and the policymaker reactions are putting in jeopardy dollar carry (mentioned above) and the S&P 500, a focus point for this letter and a center of the global carry regime, among other things.

Responses Invoke Collateral Damage:

As Credit Suisse Group AG’s Zoltan Pozsar summarizes, inflation is a structural issue, and “we [have] to generate a round of negative wealth effects to lower demand such that it becomes more in line with the new realities of supply.”

That invokes “collateral damage to the US economy,” S&P Global Inc (NYSE: SPGI) economists have put forth “as households and businesses pull back spending and investment.” 

Ultimately, “[a]s demand erodes, businesses that changed inventory strategy to ‘just-in-case’ from ‘just-in-time’ are left with full shelves to unwind at a loss and less need for workers that were in high demand just a few months ago.” That’s a recession.

Positioning

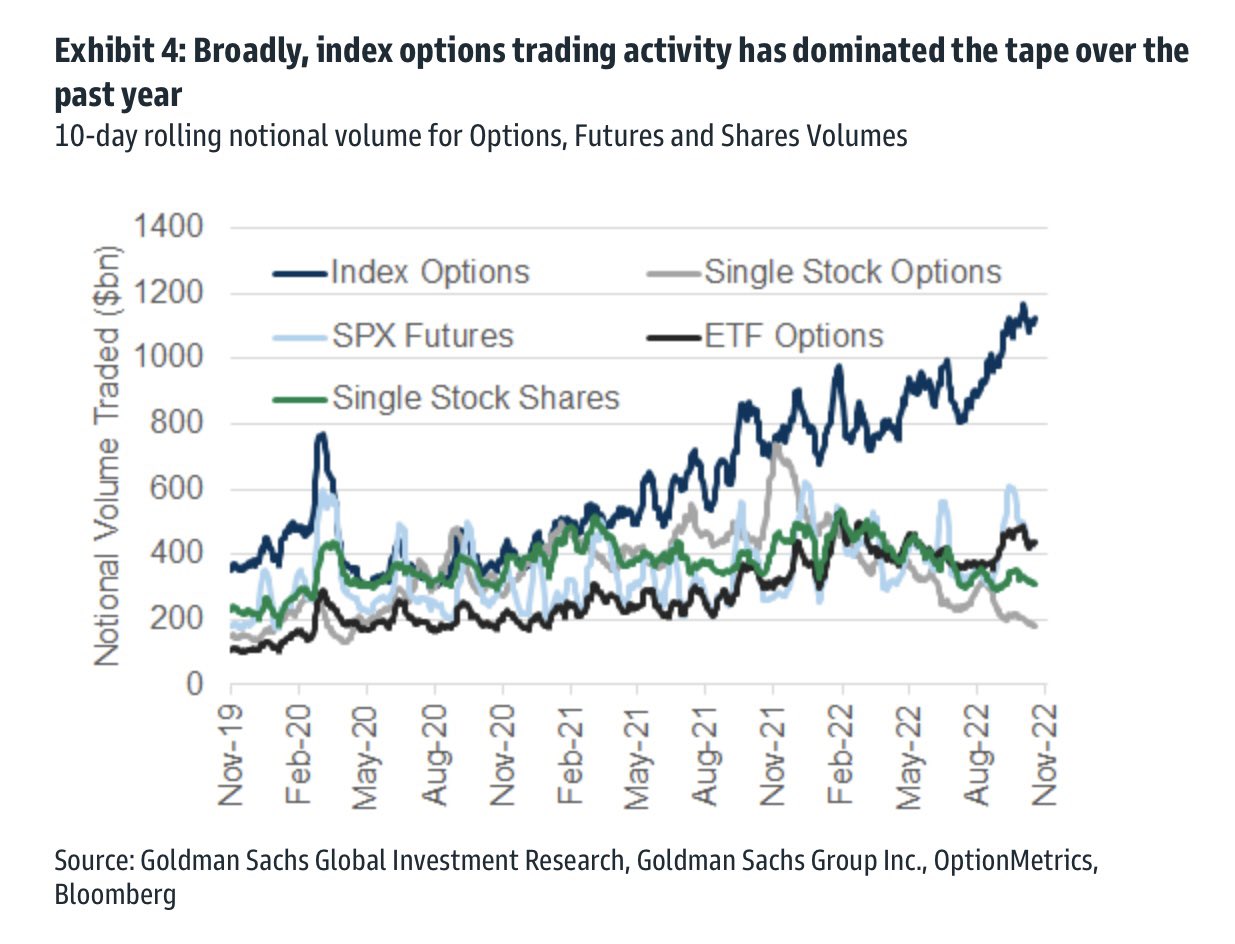
Equity market implied volatility (IVOL) remains subdued and part of the blame rests on the (1) growth of derivatives and …

Graphic: Retrieved from Goldman Sachs Group Inc (NYSE: GS). Reposted by Rob Emrich III.

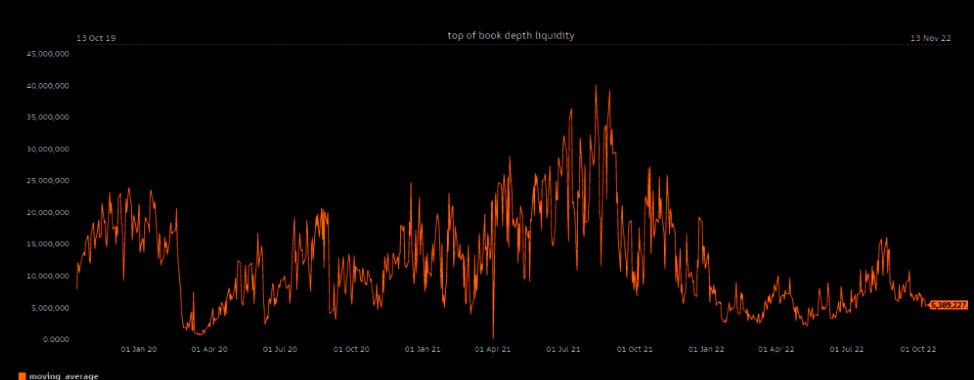
(2) a lower liquidity environment in which the hedging of these derivatives matters more.

Graphic: Retrieved from Goldman Sachs Group Inc (NYSE: GS). Taken from The Market Ear.

To recap, equity IVOL remains subdued, in part, because traders hedged into the 2022 decline.

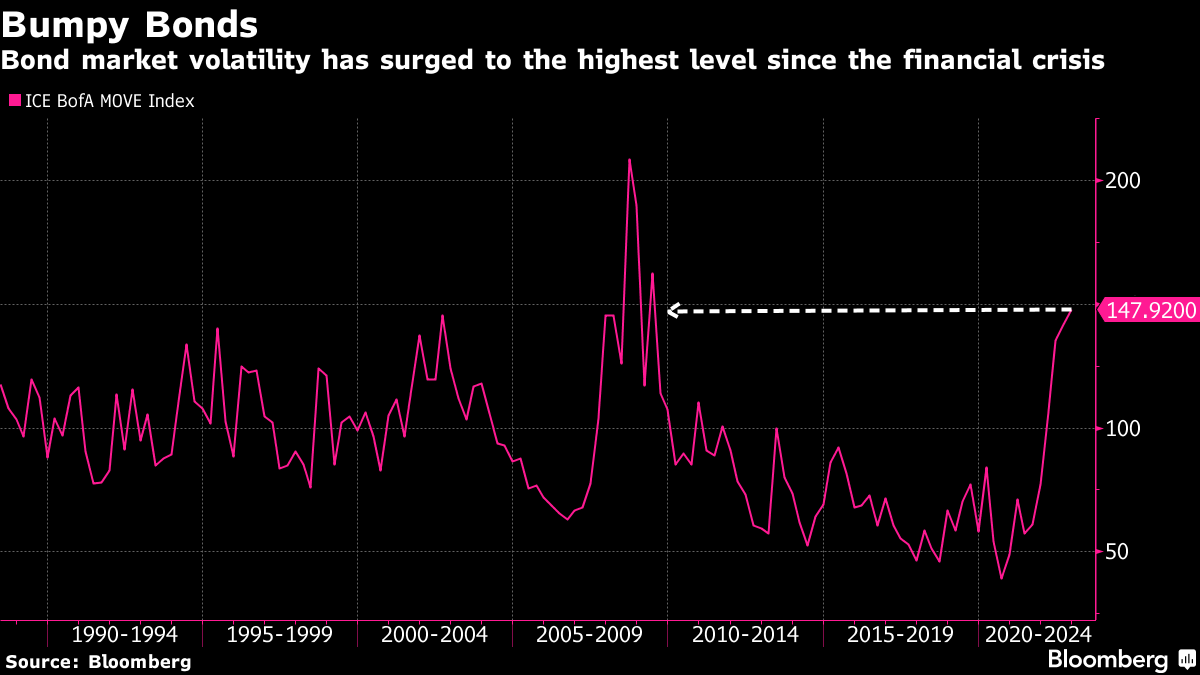
The liquidity providers’ response to the monetization of protection (i.e., trader sell put → liquidity provider buy put and stock and/or futures to hedge), as well as decreases in demand for equity exposure (and new protection), is keeping the Cboe Volatility Index (INDEX: VIX) tame while measures such as the Merrill Lynch Options Volatility Estimate (INDEX: MOVE) are surging.

Graphic: Retrieved from Bloomberg.

As well put in a recent Bloomberg article quoting QVR Advisors’ Benn Eifert, “[e]veryone was prepared for another jarring market crash, and that, in essence, is why certain categories of protective options have failed to pay off this year.”

Graphic: Retrieved from Bloomberg. Initially created by QVR Advisors. “When shares drop, demand for fresh protection remains subdued given the unusually thin positioning among big money. At the same time, put owners quickly book profits, often leading to a drop in implied vol. 

In support, IPS Strategic Capital’s Pat Hennessy puts forth that equity positioning is light and, “[I]f you have little to no equity exposure to hedge, why would you be buying puts?” That is all the while “[t]he last 5 years is still fresh in PMs heads though. This means that they have been quick to buy calls on any sign of a market bounce.” 

The first takeaways are that the above forces discussed have made for an orderly sell-off and the occasional quick reversal, particularly with more options activity spread across shorter-dated contracts where options (and hedging) are more sensitive.

Graphic: Retrieved from Bloomberg.

Another takeaway is that with skew at “near all-time lows, … [and] the highest rates we’ve seen in 15 years, [] longer dated collars [are] an attractive trade for those who are worried about the performance of stocks over the next year but do not want to sell or try timing the market.”

Graphic: Retrieved from Pat Hennessy of IPS Strategic Capital.

A last big takeaway includes some loss of structural support from hedging flows.

To explain, often, traders hedge into impactful events such as elections and Fed rate decisions. The demand for protection will pressure markets indirectly. After, however, the decay, as well as the removal of that protection, indirectly supports the market.

Graphic: Retrieved from Bespoke on Twitter. Into Fed days, traders often demand protection. Barring the worst case, traders’ closure of this protection bolsters a price rise, after. The same has been observed after elections (e.g., November 2020 election bottom).

As it sits, traders are hedged into events such as the elections. Per SpotGamma, “[i]f nothing bad happens, and traders close those puts, that would likely bolster a rally.”

This coincides with the market’s entry into a period of lower liquidity (i.e., the holiday season). It’s during this period the effects of decay accelerate and a lack of liquidity, per Karsan, makes markets sensitive to those positive positioning flows.

Ultimately, the very poor hedging that’s going on, heading into the next rally, is going to set the stage for a large tail, Karsan adds. Traders, who aren’t as well hedged, will seek protection and this will pressure markets, adding to any macro-type selling.

More explanation in the coming letters.

Technical

As of 6:30 AM ET, Monday’s regular session (9:30 AM – 4:00 PM ET), in the S&P 500, is likely to open in the upper part of a positively skewed overnight inventory, inside of prior-range and -value, suggesting a limited potential for immediate directional opportunity.

In the best case, the S&P 500 trades higher.

Any activity above the $3,806.25 LVNode puts into play the $3,845.00 VPOC. Initiative trade beyond the VPOC could reach as high as the $3,874.25 HVNode and $3,909.25 MCPOC, or higher.

In the worst case, the S&P 500 trades lower.

Any activity below the $3,806.25 LVNode puts into play the $3,773.00 VPOC. Initiative trade beyond the VPOC could reach as low as the $3,727.00 and $3,685.00 VPOC, or lower.

Click here to load today’s key levels into the web-based TradingView charting platform. Note that all levels are derived using the 65-minute timeframe. New links are produced, daily.

Graphic: 65-minute profile chart of the Micro E-mini S&P 500 Futures.

Considerations: Futures tied to the S&P 500 are trading within close proximity to a blue line in the above graphic. This blue line depicts a volume-weighted average price (VWAP) anchored to price action following the release of consumer price data on September 13, 2022.

The VWAP metric is highly regarded by chief investment officers, among other participants, for the quality of trade. Additionally, liquidity algorithms are benchmarked and programmed to buy and sell around VWAPs.

Should the S&P 500 auction away from this level, and come back to it, a prudent response is to fade. If the price is above the VWAP, and it auctions lower, into the VWAP, traders would buy. On the other hand, if the price is below the VWAP, and it auctions higher, into the VWAP, sell.

At this time, S&P 500 prices are near VWAP offering traders lower (directional) opportunities.


Definitions

Volume Areas: A structurally sound market will build on areas of high volume (HVNodes). Should the market trend for long periods of time, it will lack sound structure, identified as low volume areas (LVNodes). LVNodes denote directional conviction and ought to offer support on any test. 

If participants were to auction and find acceptance into areas of prior low volume (LVNodes), then future discovery ought to be volatile and quick as participants look to HVNodes for favorable entry or exit.

POCs: POCs are valuable as they denote areas where two-sided trade was most prevalent in a prior day session. Participants will respond to future tests of value as they offer favorable entry and exit.

MCPOCs: POCs are valuable as they denote areas where two-sided trade was most prevalent over numerous day sessions. Participants will respond to future tests of value as they offer favorable entry and exit.


Categories
Commentary

Daily Brief For October 5, 2022

The daily brief is a free glimpse into the prevailing fundamental and technical drivers of U.S. equity market products. Join the 1000+ that read this report daily, below!

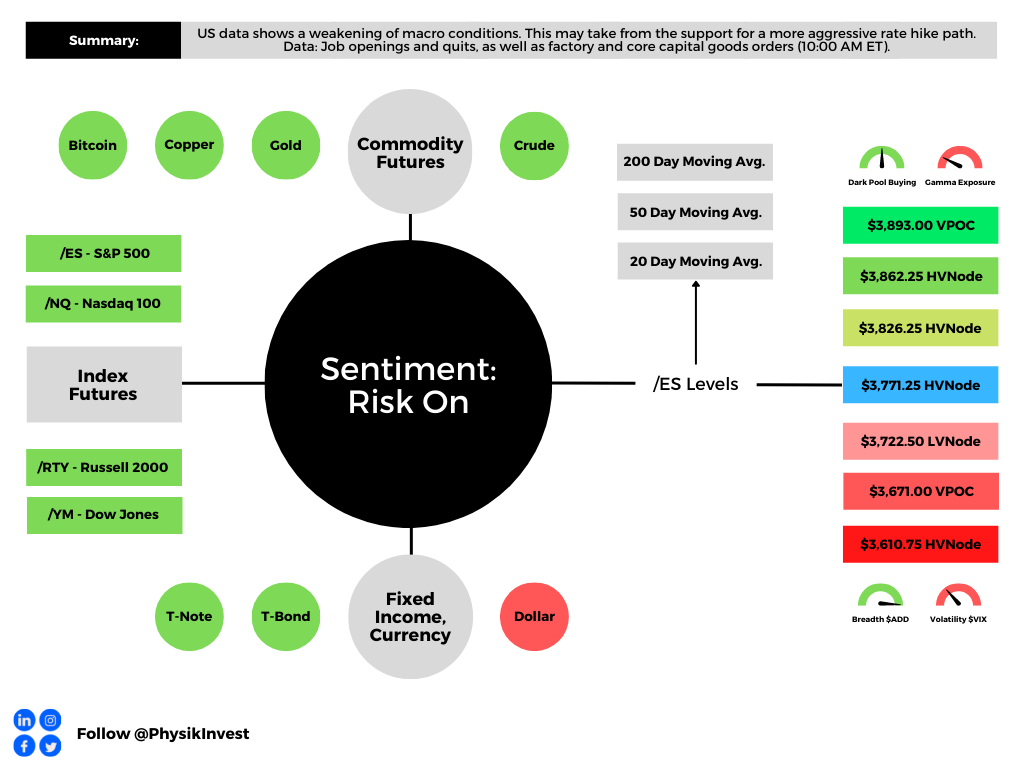
Graphic updated 6:45 AM ET. Sentiment Neutral if expected /ES open is inside of the prior day’s range. /ES levels are derived from the profile graphic at the bottom of the following section. Levels may have changed since initially quoted; click here for the latest levels. SqueezeMetrics Dark Pool Index (DIX) and Gamma (GEX) calculations are based on where the prior day’s reading falls with respect to the MAX and MIN of all occurrences available. A higher DIX is bullish. At the same time, the lower the GEX, the more (expected) volatility. Learn the implications of volatility, direction, and moneyness. Breadth reflects a reading of the prior day’s NYSE Advance/Decline indicator. VIX reflects a current reading of the CBOE Volatility Index (INDEX: VIX) from 0-100.

Administrative

Expect no letter on Friday, October 7, 2022.

Fundamental

Markets printed lower, this morning, ahead of the US cash-open. This bonds, commodities, and equities down phenomenon we’ve unpacked in detail many times before. 

At its core, supply chokepoints and a hot labor market are keeping inflation high and sticky. To lessen this inflation, policymakers are seeking to tighten monetary policy. 

That means raising interest rates and quantitative tightening (QT). 

As we discussed on September 20, the transmission mechanisms of these drivers vary with QT having a very weak transmission “to economic activity but very strong to financial markets.” On the other end are rates that have a stronger transmission to economic activity.

And so, on “the incremental effects on liquidity” these drivers pose, markets are trading more in sync; on the way up, through fiscal stimuli, interest rate decreases, and QE (i.e., buying of US Treasuries and mortgage securities), investors sought more yield elsewhere. 

Risk assets like stocks, crypto, and beyond thus enjoyed a boost.

In a way, the opposite is happening now, and selling across risk -on and -off assets is persistent. 

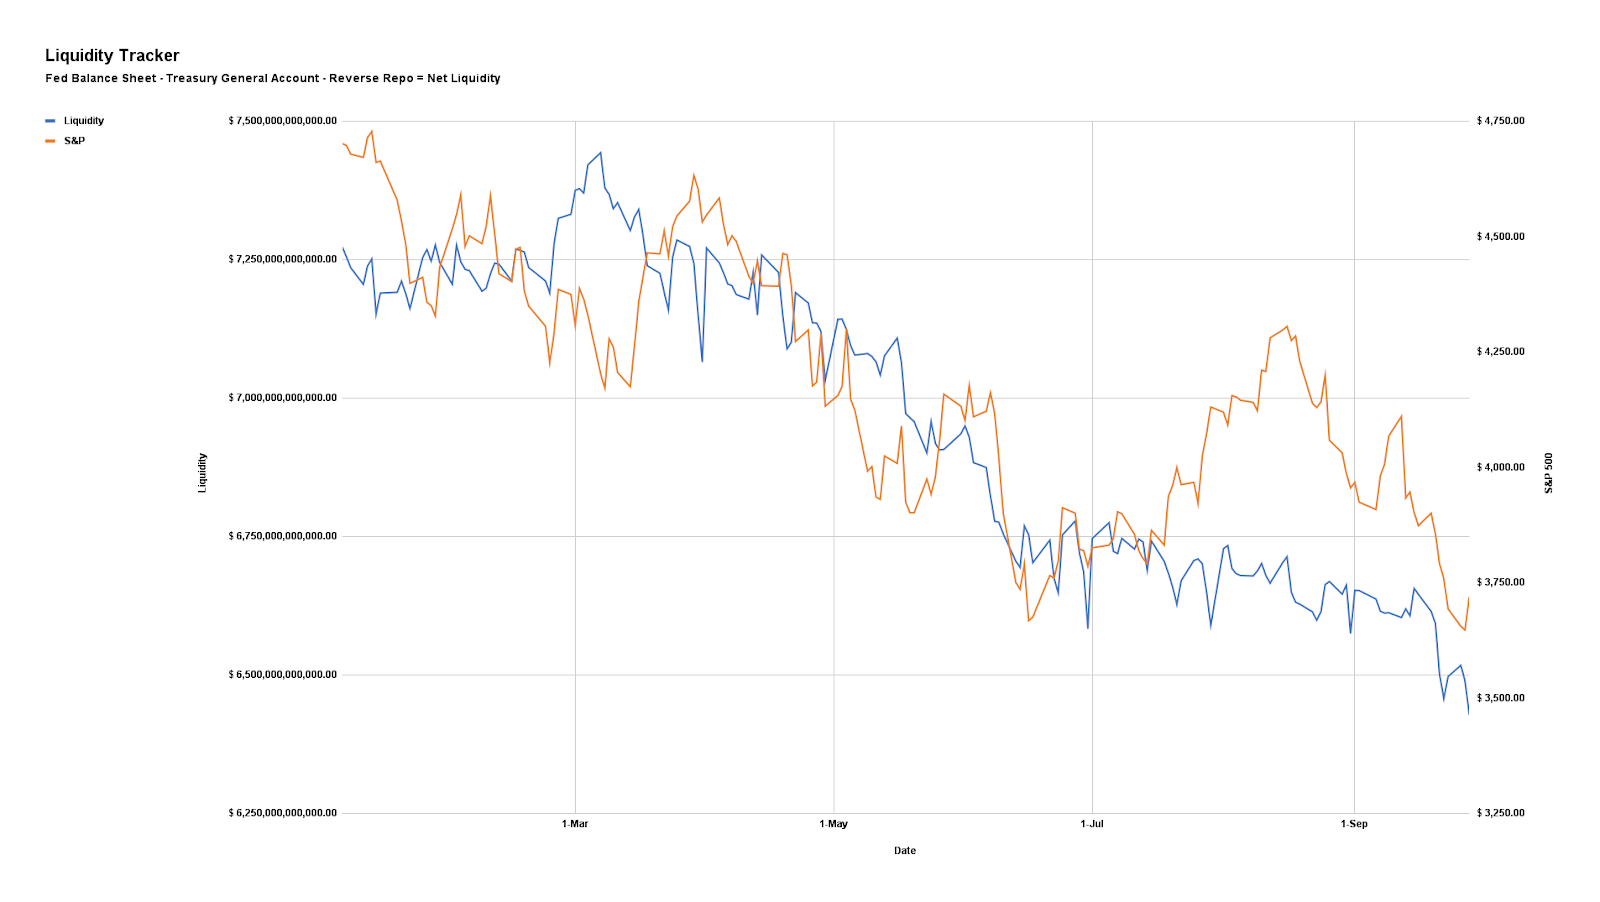
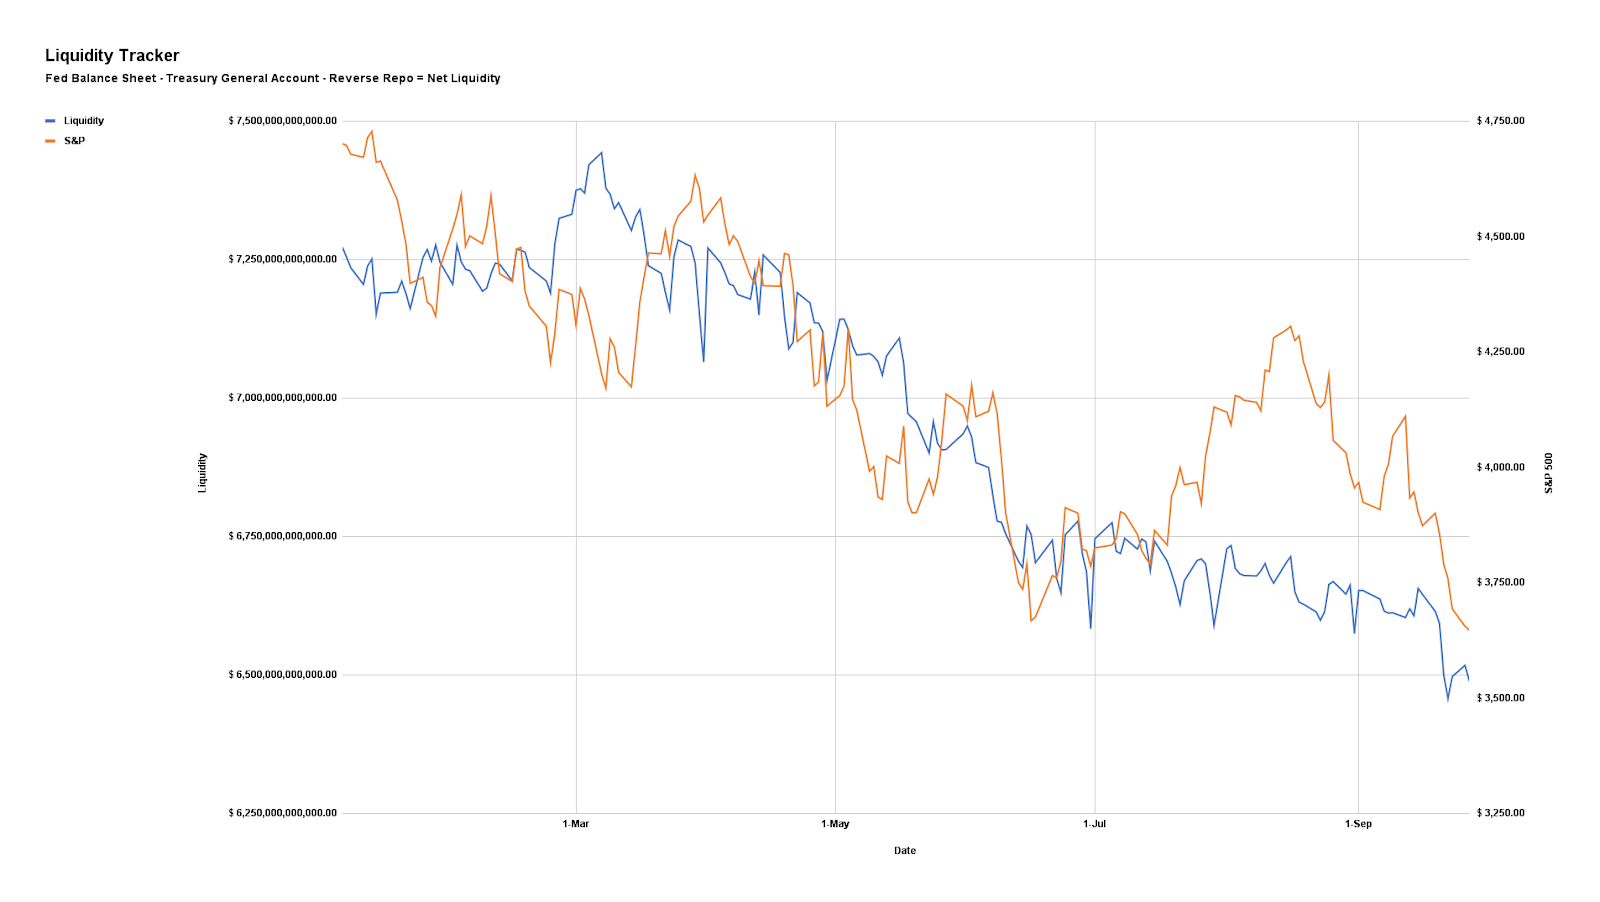
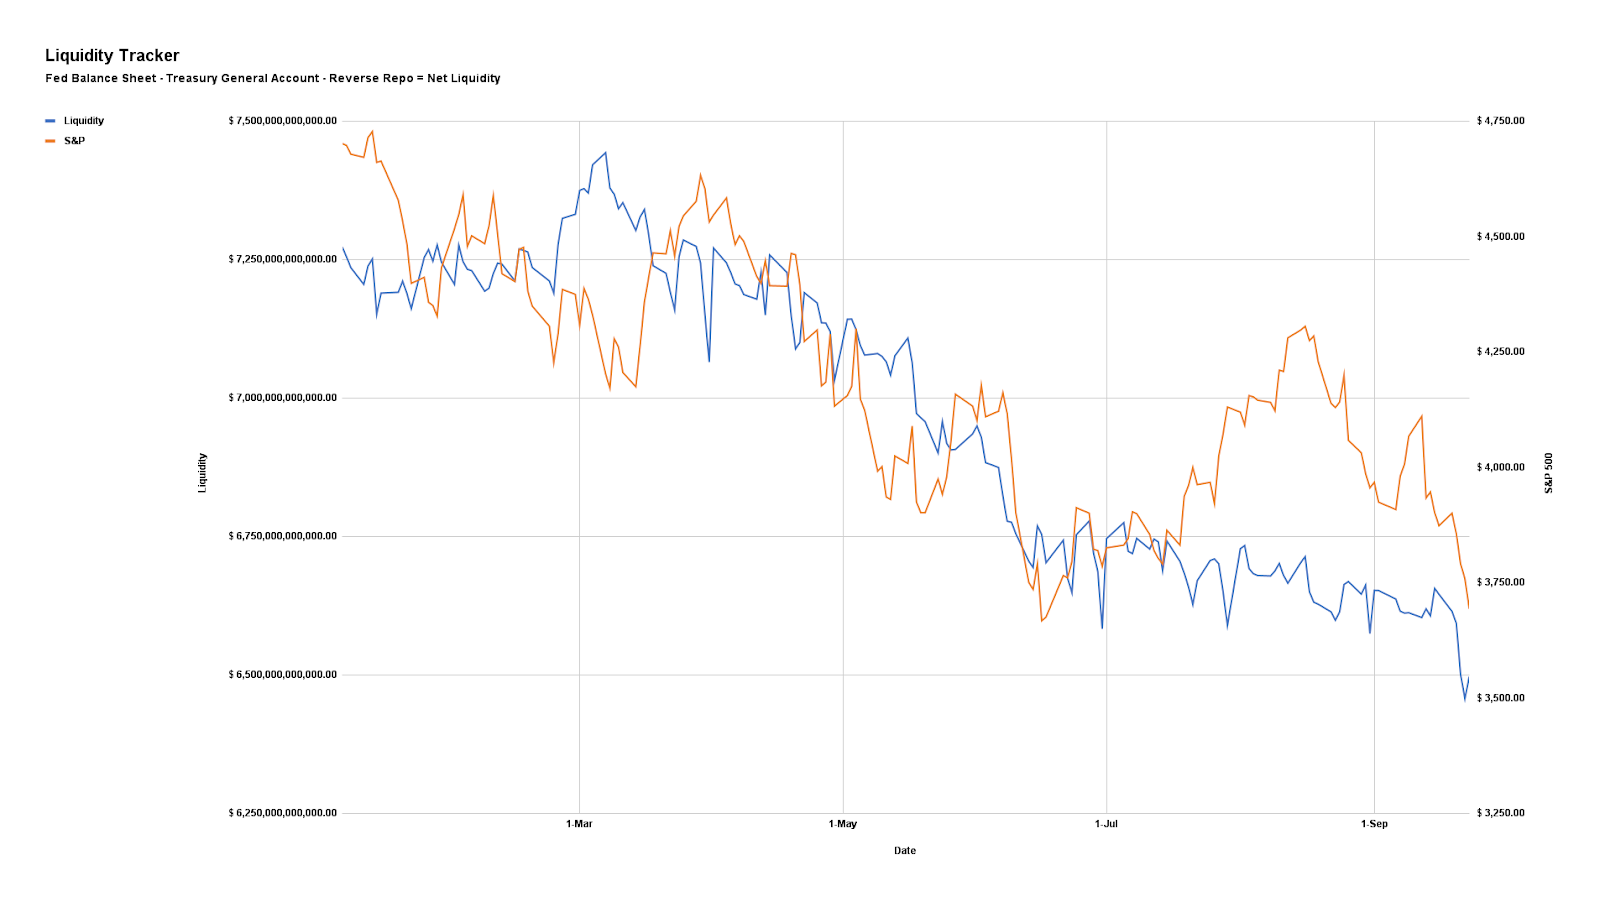
Liquidity measures (which we began unpacking months ago, and were covered in Bloomberg by Kevin Muir of TheMacroTourist.com, recently, too) show a near-lockstep decline in the S&P 500 (INDEX: SPX). Please check out Kevin Muir’s Substack, too!

Net liquidity (NL) we calculate by taking the size of the Fed’s balance sheet (BS) and subtracting both the amounts in the reverse repo operation (RRP) and Treasury General Account (TGA).

Muir said that “the liquidity created from QE and fiscal stimulus was so great that commercial banks no longer wanted deposits from large institutional clients because there were not enough safe assets available to purchase.” 

This prompted the expansion of RRP (beyond primary dealers to include the mutual funds and non-traditional accounts), a liquidity-draining operation (cash in the system removed through an increase in the number of bonds), through which the Fed would deliver “high-quality collateral with the promise to buy it back in a certain number of days at a higher price,” Muir explained.

Graphic: Retrieved from Bloomberg.

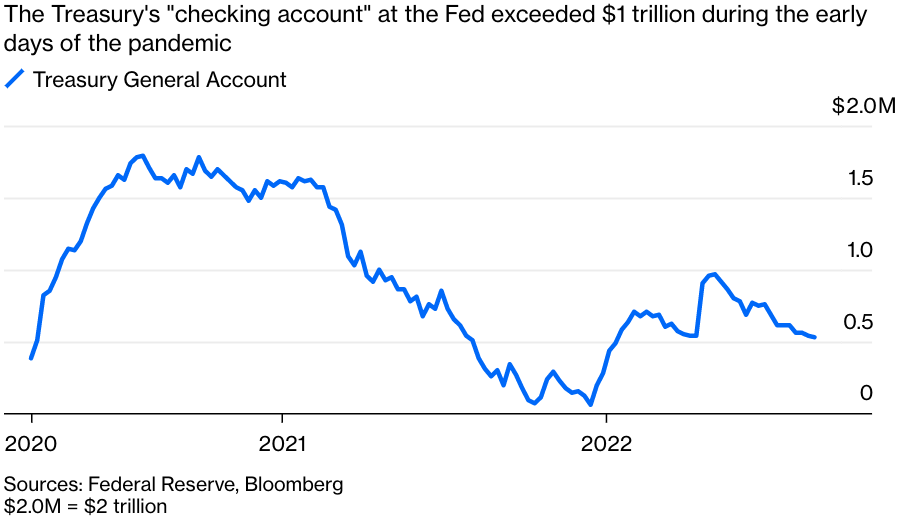
Other NL drivers include the TGA which, prior to Covid, was fairly well-balanced by taxes (i.e., money coming in) and the issue of fixed-income securities (i.e., money coming out). 

Post-Covid, the TGA increased a lot and this has “the same effect as QT … [as] bonds are issued and cash [is] withdrawn from the financial system, but the money is not distributed into the economy,” Muir elaborated.

Graphic: Retrieved from Bloomberg.

Combining the moves of the RRP and TGA, with the BS, provides us a measure of NL (shown below) that well explains stock price movements, as we’ve put forth in letters before.

Graphic: Via Physik Invest. Data compiled by @jkonopas623. Fed Balance Sheet data, here. Treasury General Account Data, here. Reverse Repo data, here. NL = BS – TGA – RRP.

And, despite the far-spreading risk-on and -off context (i.e., stocks, crypto, and bonds down), it is believed that the large amounts in liquidity-draining operations (RRP and TGA), the impacts of QT, from hereon, may be lessened; per Muir, “[i]f the Fed had securities on its balance sheet that matched the maturity profile demanded by the institutions engaging in reverse repos, it could sell an amount equal to the total reverse repo balance to these institutions, reducing the need for reverse repos and elicit no change in the financial or real economy.”

“On top of that, the actual amount of monthly QT [$95 billion per month] is not that large,” Muir added. That’s because, over the span of five months, into the end of 2021 and the beginning of 2022, the TGA was up $816 billion. This equates to ~$163.2 or so billion per month of QT.

At the end of the day, though, the programs outlined above do less to provide market support. One can argue that the market has priced the programs and some economic slowing. It is not likely the market has priced the impacts of a sharply slowing economy and business.

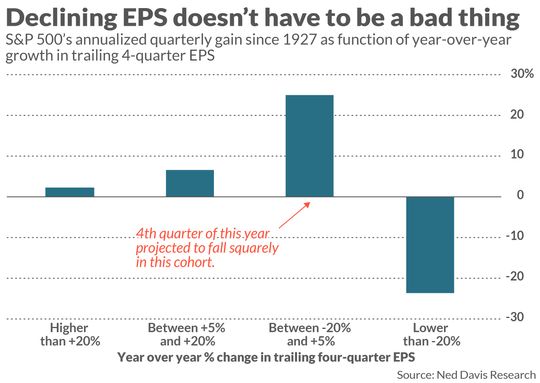
That said, some data – less corporate profits falling out of bed – suggests “the stock market tends to do better when EPS growth rates are negative than when they are hugely positive.”

Graphic: Retrieved from Ned Davis Research via MarketWatch. “[A]n inverse relationship between earnings growth rates and the market’s average return.”

The key to explaining this is to remember markets are a forward-looking mechanism. 

“By the time earnings growth rates are extremely high–as they were late last year and early this–they have long since been reflected in stock prices.”

“During such periods, the market has instead shifted its focus to earnings several quarters hence—to factors such as the Fed having to put the brakes on an overheating economy.”

The reverse will happen when the year-over-year growth rate in trailing fourth-quarter EPS is negative; “investors will have shifted their focus to earnings’ likely imminent rebound.”

Positioning

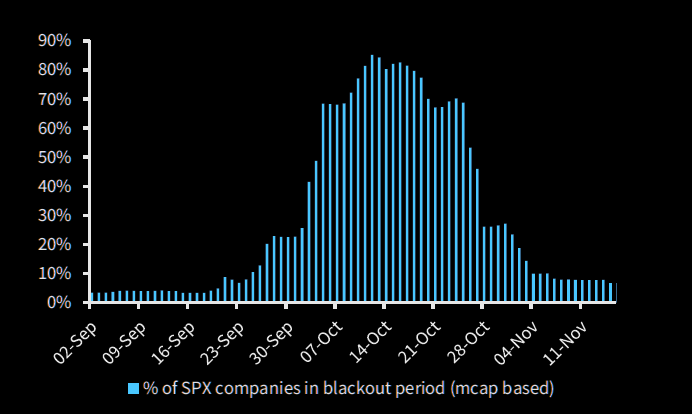
Pending is a final resolution “tied to the incremental effects on liquidity,” (e.g., QT manifesting itself as “$4.5 billion less in demand for assets per day,” and buyback blackout).

Graphic: Retrieved from Barclays PLC (NYSE: BCS) via The Market Ear.

This is all the while options repositioning may actually make the case for increased fragility, as traders’ falling demand for put protection opens the door to less supportive hedging flows and more impact from macro-type flows (talked about above) if we will.

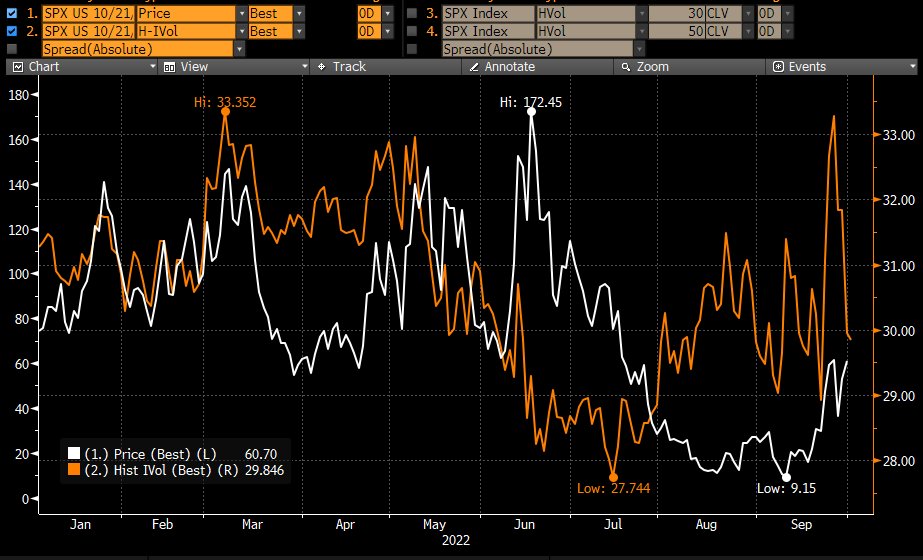
Graphic: Taken from @Alpha_Ex_LLC who retrieved from Bloomberg. S&P 500 (INDEX: SPX) October put option lower in price and volatility.

The last-mentioned SpotGamma explained well: 

“As traders realize that options protection is doing little to protect them, there may be a flip; the sale of volatility, which appears to be a good trade (now), could leave markets vulnerable to an event into which traders are no longer well-hedged. Should something bad happen and traders reach for protection, that could result in limit-down type of movement.”

If unsure of what direction to participate, consider pricing some Box Spreads that offer some competitive and guaranteed interest rates, similar to those earned with Treasury bills.

Technical

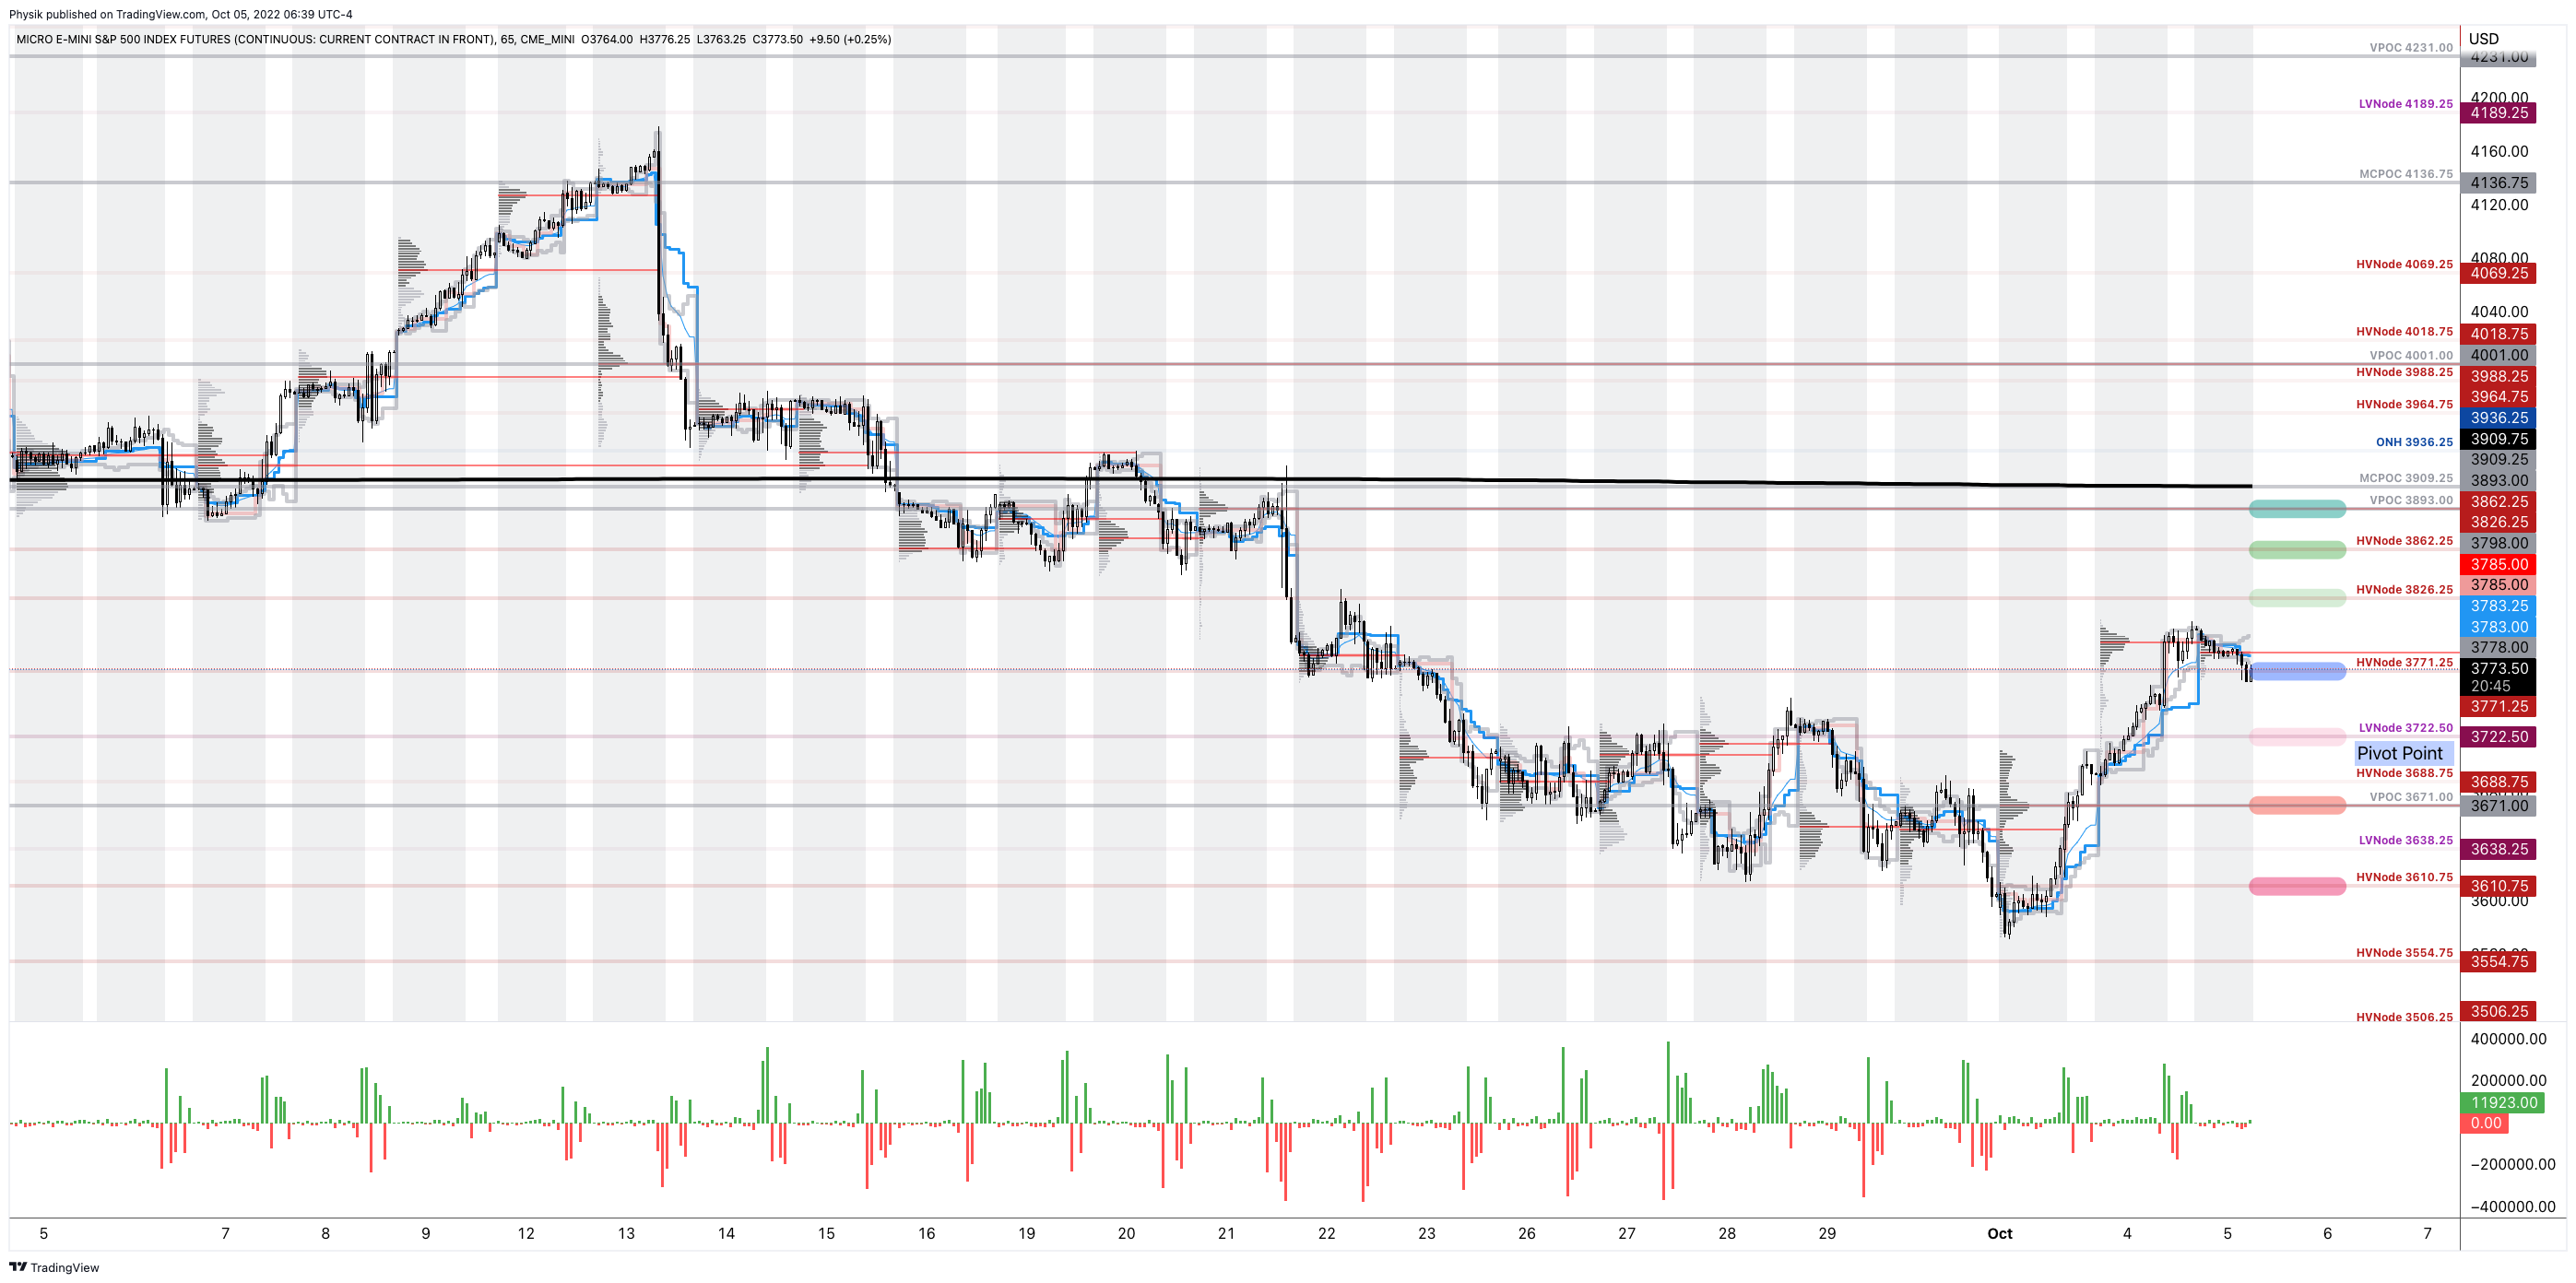
As of 6:40 AM ET, Wednesday’s regular session (9:30 AM – 4:00 PM ET), in the S&P 500, is likely to open in the lower part of a negatively skewed overnight inventory, inside of prior-range and -value, suggesting a limited potential for immediate directional opportunity.

In the best case, the S&P 500 trades higher.

Any activity above the $3,771.25 HVNode puts into play the $3,826.25 HVNode. Initiative trade beyond the last-mentioned could reach as high as the $3,862.25 HVNode and $3,893.00 VPOC, or higher.

In the worst case, the S&P 500 trades lower.

Any activity below the $3,771.25 HVNode puts into play the $3,722.50 LVNode. Initiative trade beyond the LVNode could reach as low as the $3,671.00 VPOC and $3,610.75 HVNode, or lower.

Click here to load today’s key levels into the web-based TradingView charting platform. Note that all levels are derived using the 65-minute timeframe. New links are produced, daily.
Graphic: 65-minute profile chart of the Micro E-mini S&P 500 Futures.

Definitions

Volume Areas: A structurally sound market will build on areas of high volume (HVNodes). Should the market trend for long periods of time, it will lack sound structure, identified as low volume areas (LVNodes). LVNodes denote directional conviction and ought to offer support on any test. 

If participants were to auction and find acceptance into areas of prior low volume (LVNodes), then future discovery ought to be volatile and quick as participants look to HVNodes for favorable entry or exit.

POCs: POCs are valuable as they denote areas where two-sided trade was most prevalent in a prior day session. Participants will respond to future tests of value as they offer favorable entry and exit.

About

After years of self-education, strategy development, mentorship, and trial-and-error, Renato Leonard Capelj began trading full-time and founded Physik Invest to detail his methods, research, and performance in the markets.

Capelj also develops insights around impactful options market dynamics at SpotGamma and is a Benzinga reporter.

Some of his works include conversations with ARK Invest’s Catherine Wood, investors Kevin O’Leary and John Chambers, FTX’s Sam Bankman-Fried, ex-Bridgewater Associate Andy Constan, Kai Volatility’s Cem Karsan, The Ambrus Group’s Kris Sidial, among many others.

Disclaimer

In no way should the materials herein be construed as advice. Derivatives carry a substantial risk of loss. All content is for informational purposes only.

Categories
Commentary

Daily Brief For October 4, 2022

The daily brief is a free glimpse into the prevailing fundamental and technical drivers of U.S. equity market products. Join the 990+ that read this report daily, below!

Graphic updated 9:20 AM ET. Sentiment Risk-On if expected /ES open is above the prior day’s range. /ES levels are derived from the profile graphic at the bottom of the following section. Levels may have changed since initially quoted; click here for the latest levels. SqueezeMetrics Dark Pool Index (DIX) and Gamma (GEX) calculations are based on where the prior day’s reading falls with respect to the MAX and MIN of all occurrences available. A higher DIX is bullish. At the same time, the lower the GEX, the more (expected) volatility. Learn the implications of volatility, direction, and moneyness. Breadth reflects a reading of the prior day’s NYSE Advance/Decline indicator. VIX reflects a current reading of the CBOE Volatility Index (INDEX: VIX) from 0-100.

Fundamental

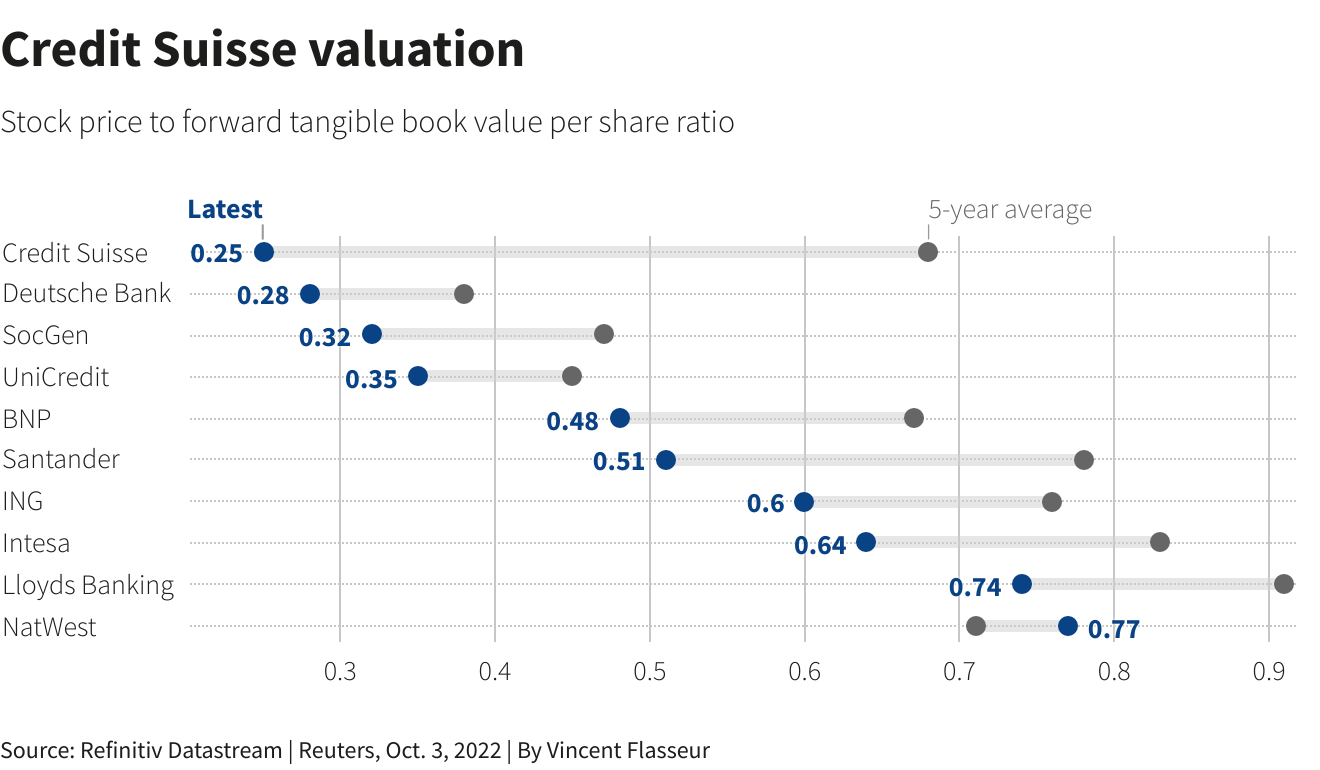
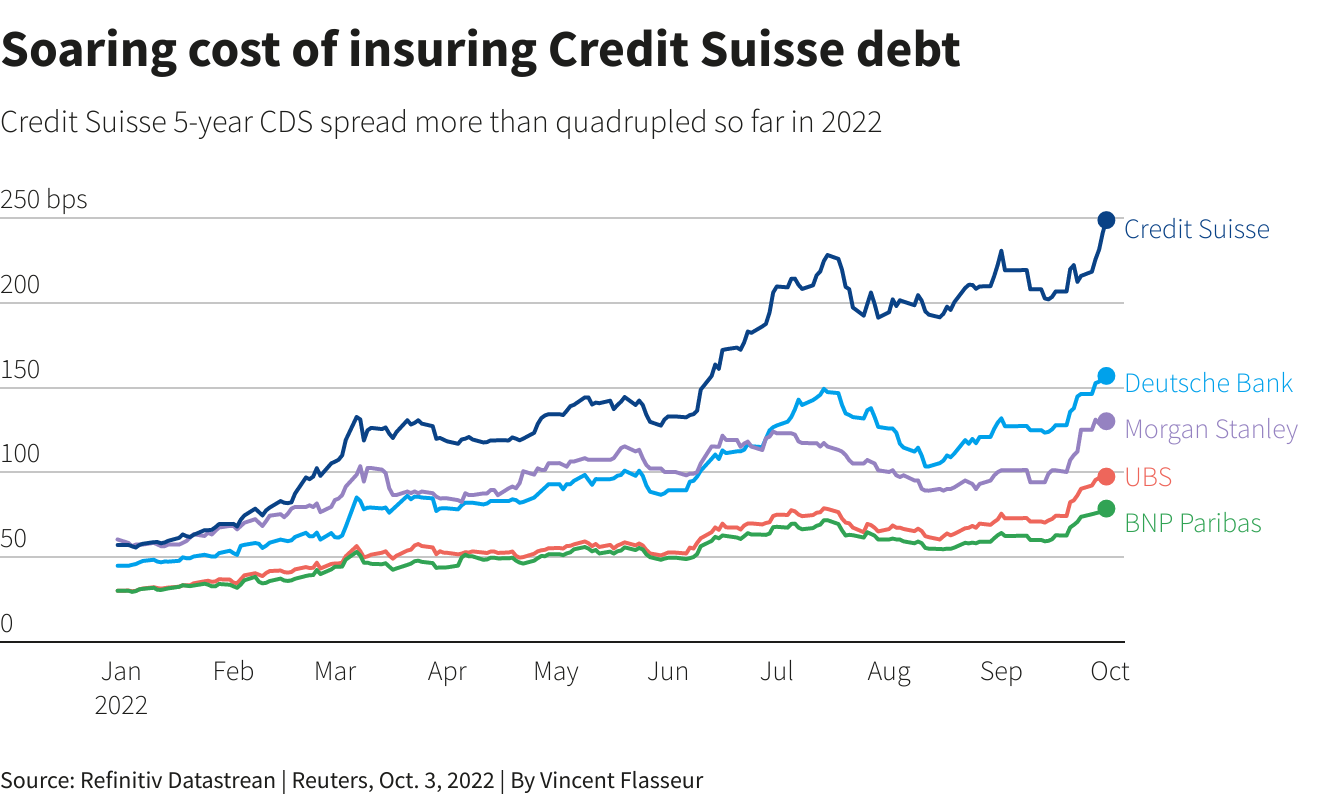
Fresh and top of mind, still, is the Credit Suisse Group AG (NYSE: CS) debacle. However, despite the bank’s “critical moment,” as discussed in yesterday’s letter, credit default swap (CDS) levels, though still rising, are “far from distressed.”

Graphic: Retrieved from Reuters.

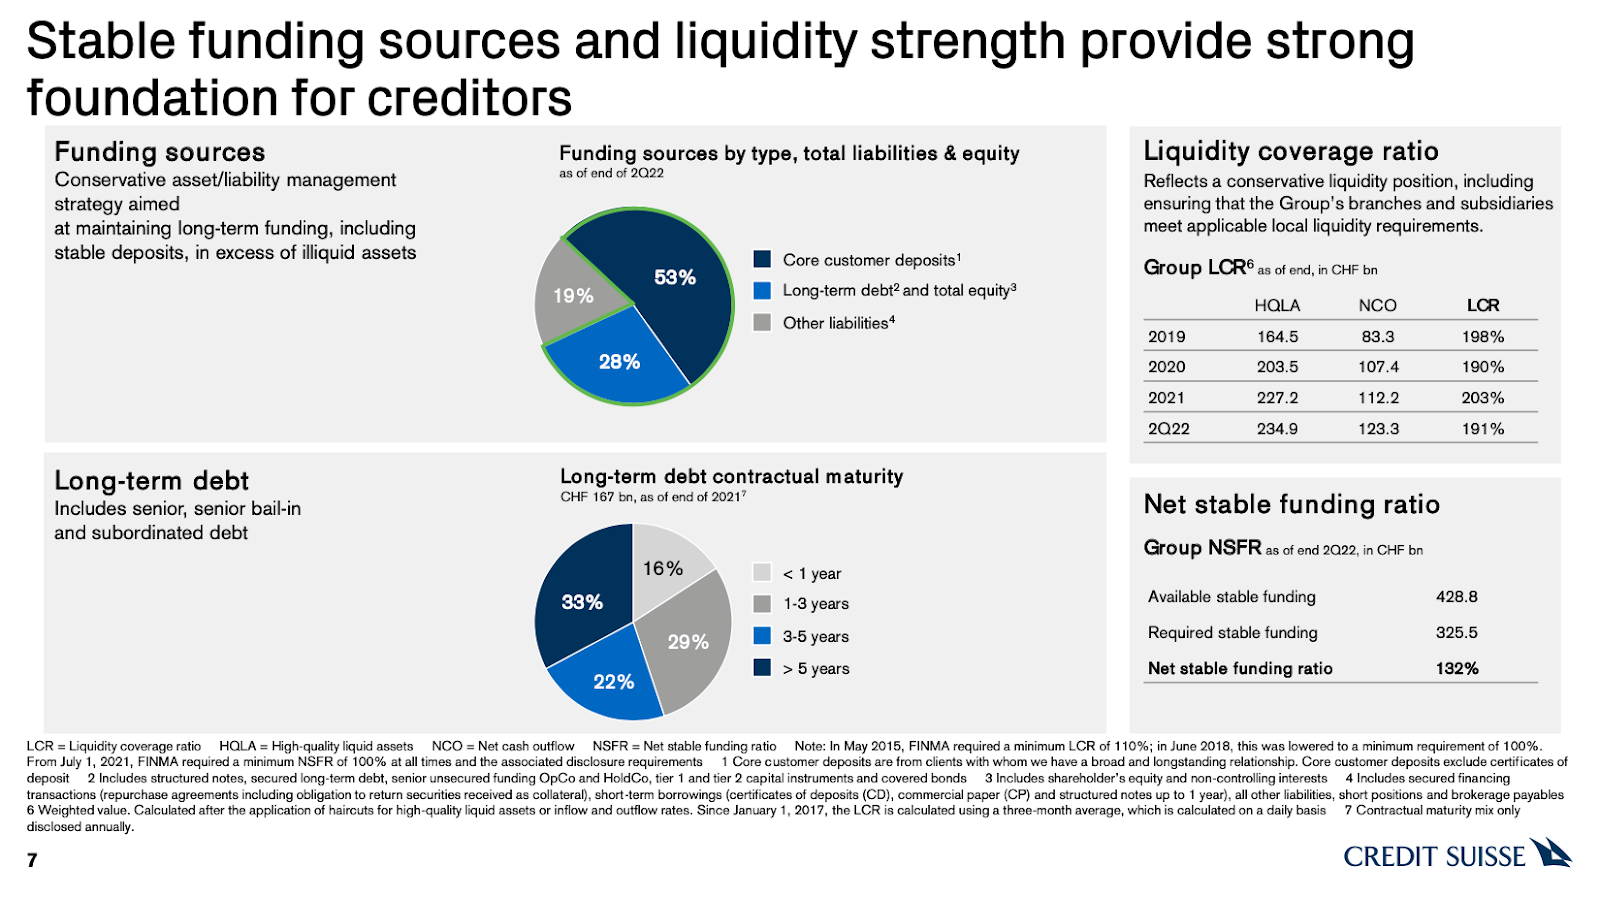
Adding, not reflected by the stock is a “strong capital base and liquidity position,” per CS.

Graphic: Retrieved from Credit Suisse Group AG (NYSE: CS).

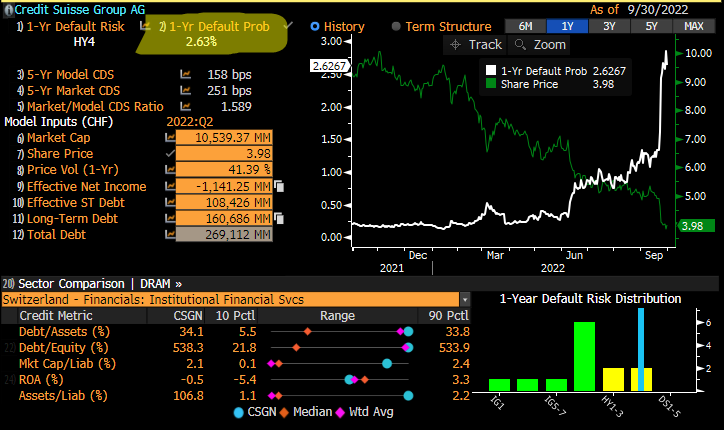
A big topic speculated on was CS’ probability of default. At its core, CDS spreads relate to the probability of default in the following way, per Deutsche Bank AG (NYSE: DB) research

(CDS Spread) / (1 – Recovery Rate) = Implied Probability Of Default.

The recovery rate is basically the (estimated) amount of a loan that will be repaid in the case of a bankruptcy or default. Per European Central Bank research, “the standard recovery rate used by the industry in price calculations is 40%.”

Roughly speaking, below is a quick calculation:

250 basis points / (1 – 0.40) = 416.67 basis points = 4.17% Implied Probability Of Default

In CS’ case, if the spread is 250 basis points, assuming a 40% recovery, that’s a 4.17% default probability implied. If the spread was at 150 basis points, then, assuming a 40% recovery, that’s a 2.5% chance of default.

Graphic: Taken from @EffMktHype who retrieved from Bloomberg. “So many [Bloomberg] screenshots of CS CDS levels and talking about massive default prob numbers. Zero people actually using [the] same terminal to look at default risk screen.”

Taken together, in short, similar to as we put forth, yesterday, “[t]his is not 2008,” per Citigroup Inc’s (NYSE: C) Andrew Coombs. Bloomberg adds that Morgan Stanley (NYSE: MS) faced its own credit spread debacle during 2011 European debt exposure rumors; “it took months for the price of the default swaps to fall as the feared losses never materialized.”

Graphic: Retrieved from Reuters.

Ahead of an October 27 CS review covering topics including “a large-scale investment banking retreat, … [i]nvestors are worried about how much the bank will [have to] cover” a restructuring.

Bloomberg adds: “A sale of Credit Suisse’s structured-products group, which trades securitized debt, has attracted interest from potential buyers, … [amid] rising interest rates.”

Per UBS Group AG (NYSE: UBS) research, a sale of such businesses, which may be worth more than the market is currently implying, “could help to avoid a dilutive capital increase.”

Positioning

“Month-end portfolio rebalances and [the] expiration of quarterly option strategies [acted] in support of the market,” JPMorgan Chase & Co’s (NYSE: JPM) Marko Kolanovic stated in a September 30, 2022 commentary titled “Throwing rocks in glass houses.”

In that same commentary, Kolanovic eased support for his 2022 price targets on economic volatility led by central banks, the war in Europe, and beyond.

As stated last week, per Kai Volatility’s Cem Karsan, it’s the case that the removal of options strategies and potential supply of protection (as investors further come to the realization that options protection has done little to protect against downside) may provide markets a boost.

Graphic: Taken from @Alpha_Ex_LLC who retrieved from Bloomberg. S&P 500 (INDEX: SPX) October put option lower in price and volatility.

Ultimately, though, a final resolution would be “tied to the incremental effects on liquidity,” (e.g., QT manifesting itself as “$4.5 billion less in demand for assets per day,” and buyback blackout) while options repositioning may make the case for increased fragility, as traders’ falling demand for put protection opens the door to less supportive hedging flows with respect to time (Charm) and volatility (Vanna) changes.

Graphic: Retrieved from SqueezeMetrics.

Therefore, trades such as the Short Ratio Put Spread, particularly if narrower, may be far riskier to employ into the end of this year and the middle half of next year. For context, this was a trade to have on this year.

As participants continue to make the aforementioned realizations and supply to the market put (downside protection), tails may “continue to be cheap,” and discount “crash risk,” according to The Ambrus Group’s Kris Sidial.

A lot more to resolve this jumbled mess of a newsletter in the coming days.

Technical

As of 9:10 AM ET, Tuesday’s regular session (9:30 AM – 4:00 PM ET), in the S&P 500, is likely to open in the upper part of a positively skewed overnight inventory, outside of prior-range and -value, suggesting a potential for immediate directional opportunity.

In the best case, the S&P 500 trades higher.

Any activity above the $3,771.25 HVNode puts into play the $3,826.25 HVNode. Initiative trade beyond the last-mentioned could reach as high as the $3,862.25 HVNode and $3,893.00 VPOC, or higher.

In the worst case, the S&P 500 trades lower.

Any activity below the $3,771.25 HVNode puts into play the $3,722.50 LVNode. Initiative trade beyond the LVNode could reach as low as the $3,671.00 VPOC and $3,610.75 HVNode, or lower.

Click here to load today’s key levels into the web-based TradingView charting platform. Note that all levels are derived using the 65-minute timeframe. New links are produced, daily.
Graphic: 65-minute profile chart of the Micro E-mini S&P 500 Futures.

Definitions

Volume Areas: A structurally sound market will build on areas of high volume (HVNodes). Should the market trend for long periods of time, it will lack sound structure, identified as low volume areas (LVNodes). LVNodes denote directional conviction and ought to offer support on any test. 

If participants were to auction and find acceptance into areas of prior low volume (LVNodes), then future discovery ought to be volatile and quick as participants look to HVNodes for favorable entry or exit.

POCs: POCs are valuable as they denote areas where two-sided trade was most prevalent in a prior day session. Participants will respond to future tests of value as they offer favorable entry and exit.

Vanna: The rate at which the delta of an option changes with respect to volatility.

Charm: The rate at which the delta of an option changes with respect to time.

About

After years of self-education, strategy development, mentorship, and trial-and-error, Renato Leonard Capelj began trading full-time and founded Physik Invest to detail his methods, research, and performance in the markets.

Capelj also develops insights around impactful options market dynamics at SpotGamma and is a Benzinga reporter.

Some of his works include conversations with ARK Invest’s Catherine Wood, investors Kevin O’Leary and John Chambers, FTX’s Sam Bankman-Fried, ex-Bridgewater Associate Andy Constan, Kai Volatility’s Cem Karsan, The Ambrus Group’s Kris Sidial, among many others.

Disclaimer

In no way should the materials herein be construed as advice. Derivatives carry a substantial risk of loss. All content is for informational purposes only.

Categories
Commentary

Daily Brief For September 30, 2022

The daily brief is a free glimpse into the prevailing fundamental and technical drivers of U.S. equity market products. Join the 980+ that read this report daily, below!

Graphic updated 9:50 AM ET. Sentiment Neutral if expected /ES open is inside of the prior day’s range. /ES levels are derived from the profile graphic at the bottom of the following section. Levels may have changed since initially quoted; click here for the latest levels. SqueezeMetrics Dark Pool Index (DIX) and Gamma (GEX) calculations are based on where the prior day’s reading falls with respect to the MAX and MIN of all occurrences available. A higher DIX is bullish. At the same time, the lower the GEX, the more (expected) volatility. Learn the implications of volatility, direction, and moneyness. Breadth reflects a reading of the prior day’s NYSE Advance/Decline indicator. VIX reflects a current reading of the CBOE Volatility Index (INDEX: VIX) from 0-100.

Administrative

Apologies for the delay. Hectic end-of-week! A little heavy on the fundamental side of things and light on the positioning. More to unpack next week. Have a great weekend!

Fundamental

As an update to our September 29, 2022 letter, Russia responded to the Nord Stream attack suggesting the incident spoke of state-sponsored “terrorism”, all the while “an EU official said the incident had fundamentally changed the nature of the conflict in Ukraine,” per Refinitiv.

Graphic: Retrieved from Bloomberg. Updated September 28, 2022.

In short, Russia’s throwing blame on the US, among others, suggesting it was likely to benefit through a boost in liquefied natural gas (LNG) sales. Russia previously said the leaks were in areas “fully under the control” of US intelligence agencies.

It’s the case that in February 2022, Joe Biden commented that if Russia invaded Ukraine, there would “no longer be a Nord Stream 2,” also.

In response, Nord Stream 1 leaks will be stopped on Monday with no forecasts yet on the future of the pipeline’s operation.

To note, the pipelines were not “supplying gas to Europe when the leaks were first detected, … [but] both had gas in them.” Regardless, the EU will be assessing the application of sanctions.

Moving on, as a recap, this week there was tons of volatility in overseas fixed income and FX markets. In short, the announcement of new fiscal policies coincided with market volatility that prompted reflexive feedback responses, which we dissected in our September 29, 2022 letter.

A cascade of margin calls, during the route to 7-8% yields, would have put in jeopardy 90% of UK pension funds. 

To explain, per Reuters, there are schemes “that pay pensioners a fixed annual amount, often a portion of the final salary they earned as employees.” The schemes invest about 50% of assets in bonds, in order to have cash on hand and pay pension liabilities.

To reduce the effects of market volatility, positions are hedged through derivatives “managed by so-called liability-driven investment (LDI) funds,” Reuters well explained. “For example, pension schemes might pay the floating rate leg of an interest rate swap and receive fixed rates.”

Due to the leverage, market moves have an amplified effect on the funds. Therefore, if bonds fall too much, too fast, more cash must be sent to these LDIs. 

“[P]ositions become loss-making – they are paying out more money in the transaction than they are receiving.”

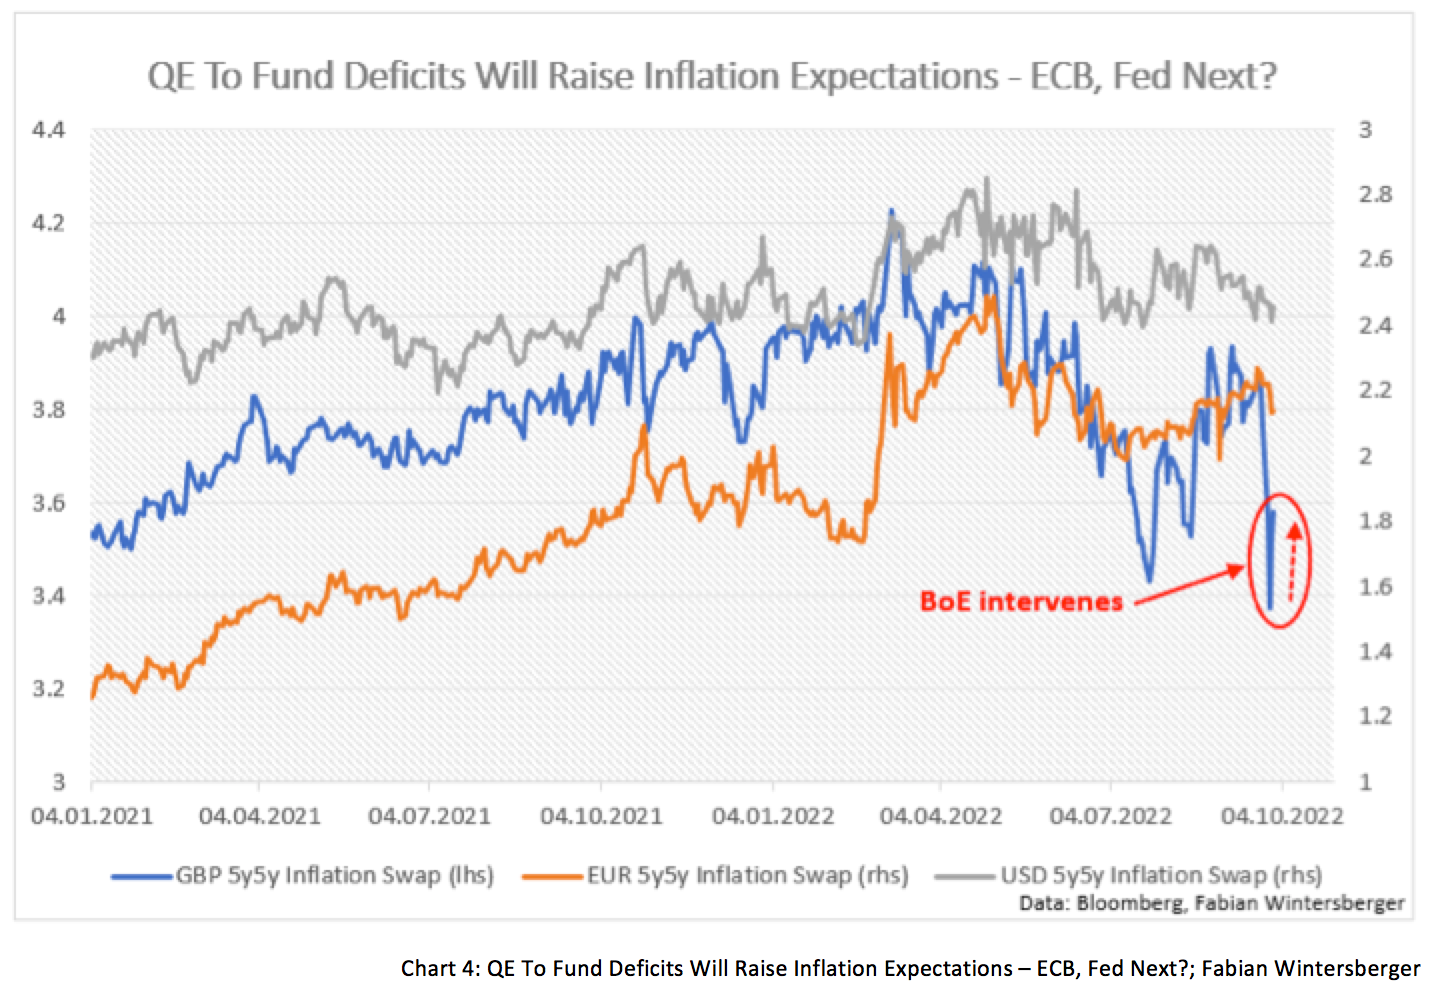
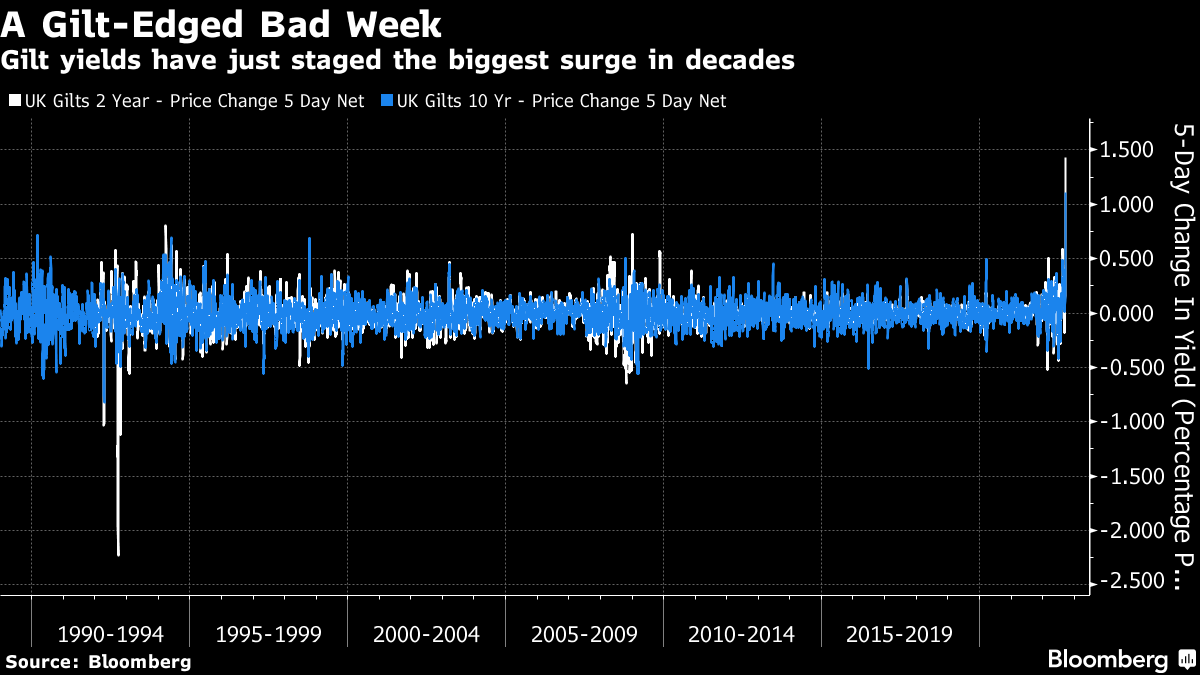
In some cases, schemes were to have “cash reserves to cope with a 200 bps rise in swap rates over a year. However, 30-year gilt interest rate swaps … rose 360 bps this year and 120 bps in the last few days before the BoE stepped in” and bought bonds, boosting inflation expectations, the thing that monetary tightening was, in part, intended to reduce.

Graphic: Retrieved from Fabian Wintersberger.

Accordingly, pensions sold gilts to “ready cash to meet those collateral calls, or they were kicked out of their derivatives positions because they could not pay up in time and had to sell gilts to avoid having a naked exposure to further sharp moves.”

The BoE’s actions calm the market allowing for the more orderly processing of transactions. 

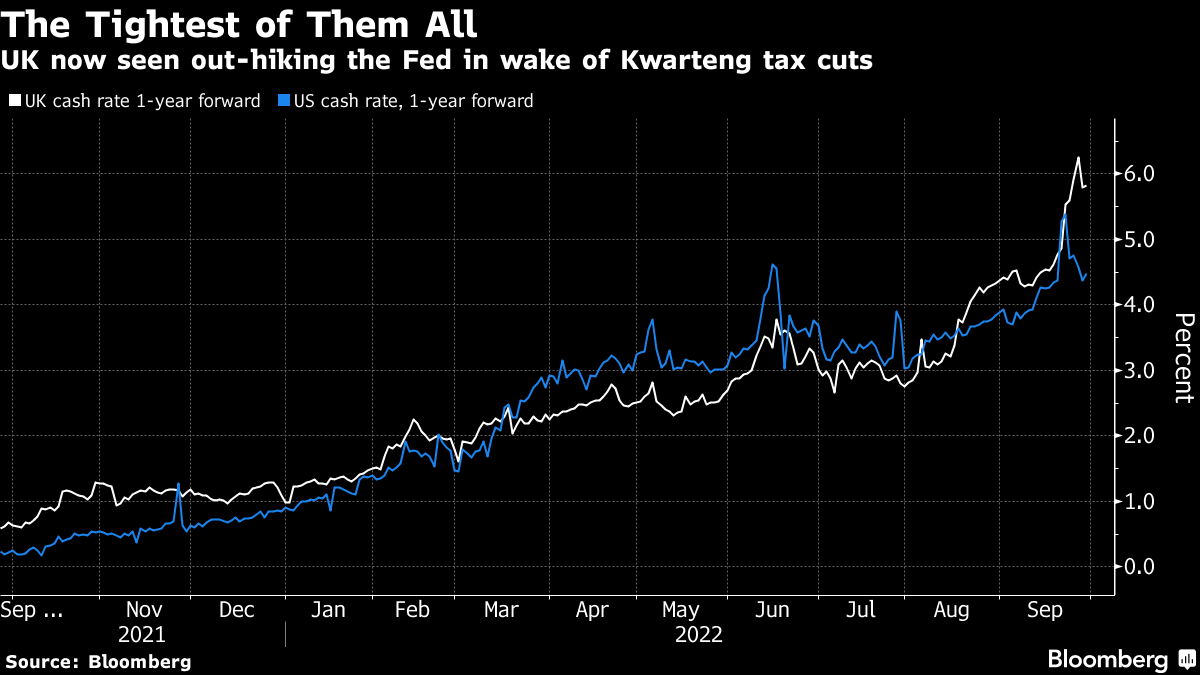
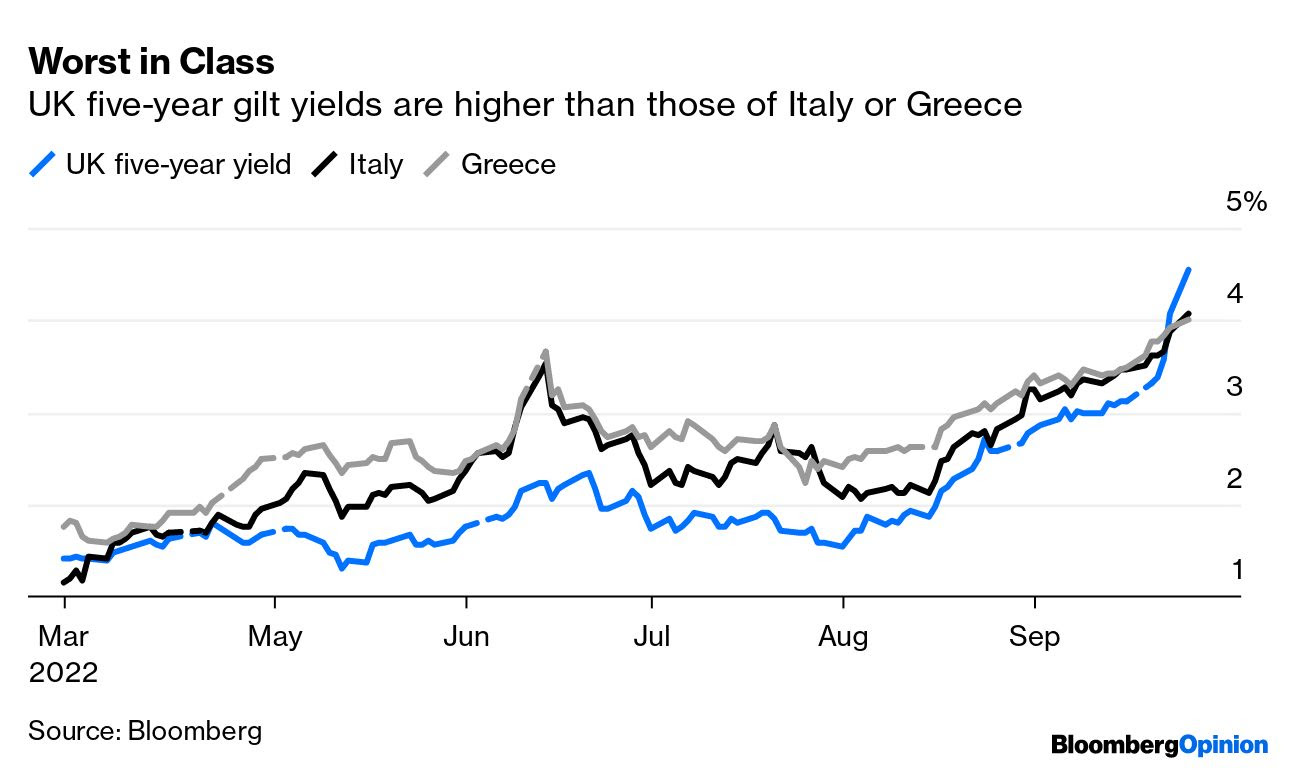
Still, the UK is seen “out-hiking the Fed in the wake of Kwarteng tax cuts,” while “schemes are running out of cash.”

Graphic: Retrieved via Bloomberg.

The risks don’t just stop there, though, we added. 

For one, there’s damage to be had if FX hedges go awry, which we said would likely prompt a call for collateral, too; investors will “buy overseas assets and hedge away the currency risk,” Jim Leaviss explained. “[I]f you had bought a dollar bond and hedged it, the dollars that you have effectively sold ‘short’ against sterling as the hedge have rallied, and the counterparty to the FX hedge will call for a collateral payment.”

The actions of the recent days likely put investors in a position of less liquid assets to meet the (potential) collateral calls, and this is part of the aforementioned technical factors that are likely to have a bearing on the direction of bonds and yields “over coming months.”

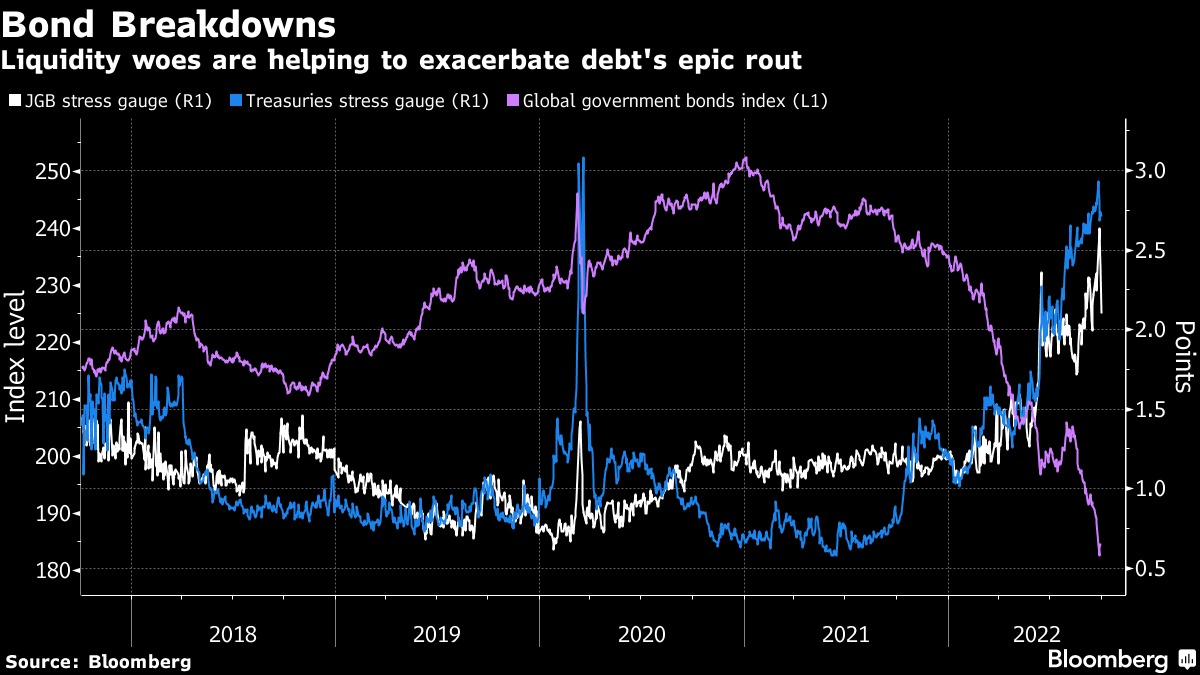
Additionally, some participants speculate the US may run into similar issues as the UK. A single (unconfirmed) participant explained pensions may be “selling equities and other asset classes to meet their swap obligations.”

Graphic: Retrieved via Bloomberg.

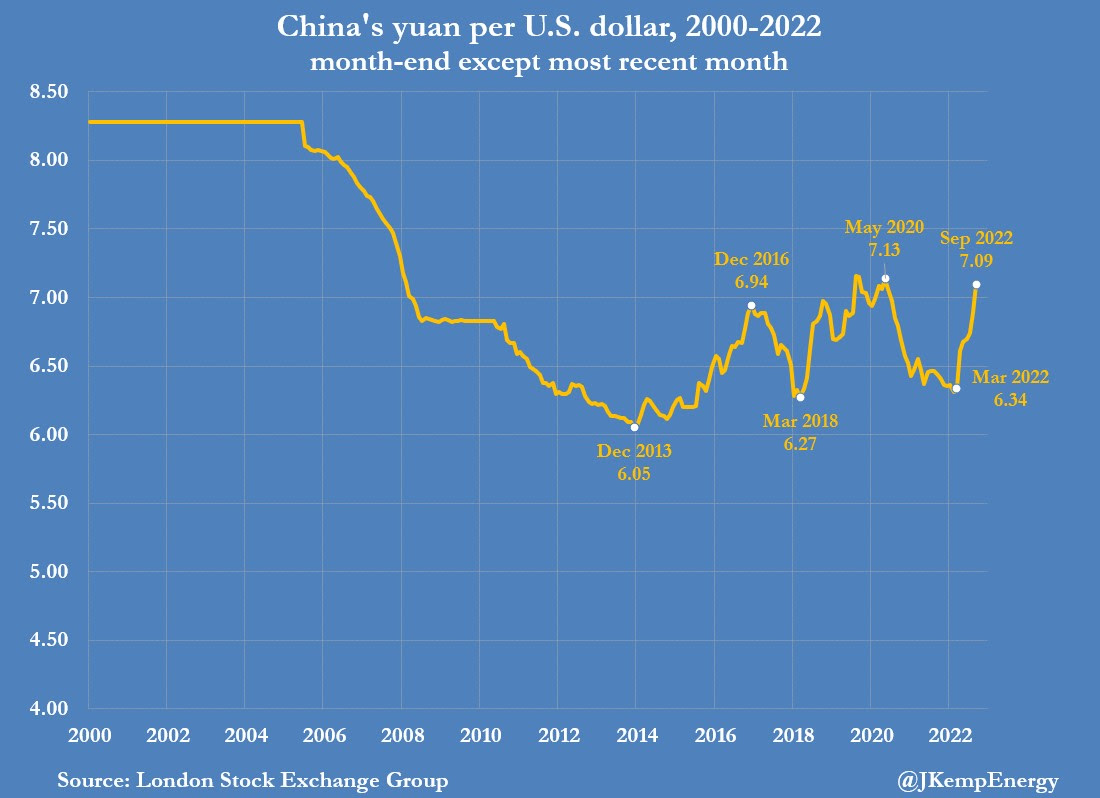
Separately, another topic of discussion was the People’s Bank of China (PBOC) telling state-run banks to prepare for the shedding of dollar holdings to buy and assist in propping up the yuan.

Graphic: Retrieved from Reuters’ John Kemp.

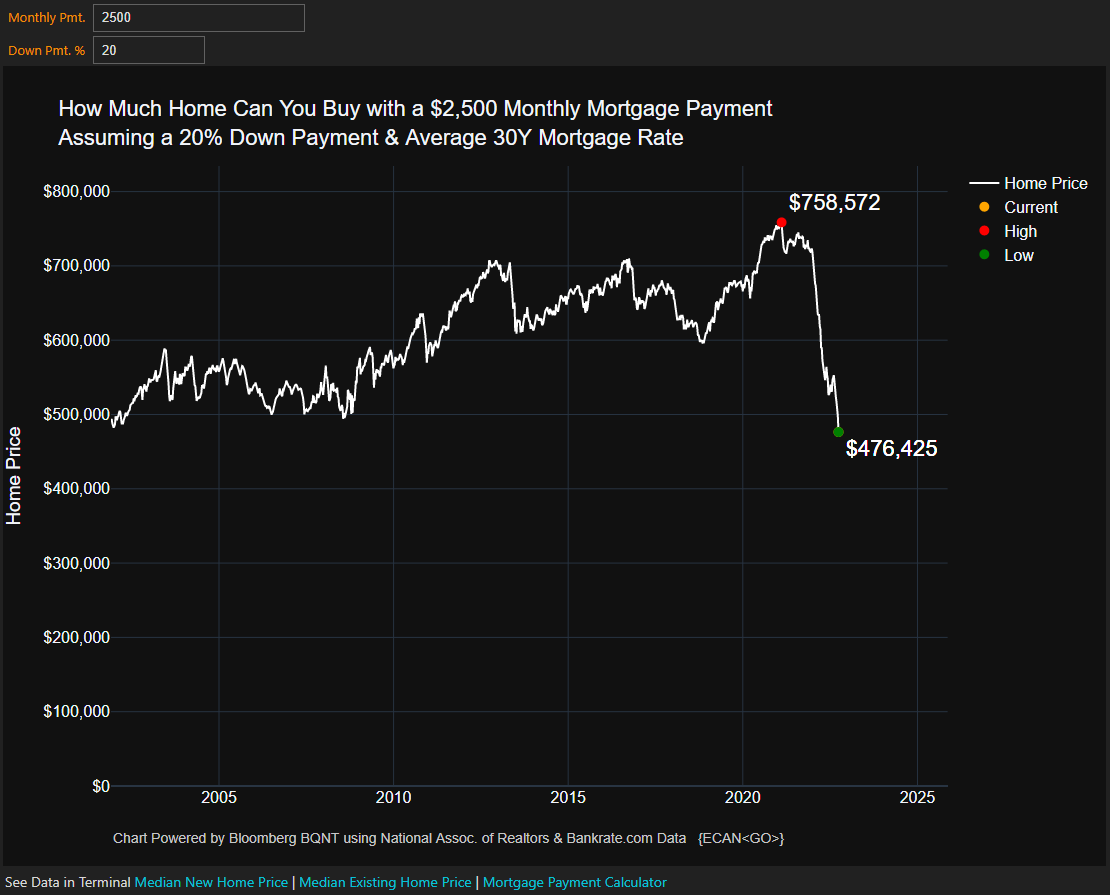
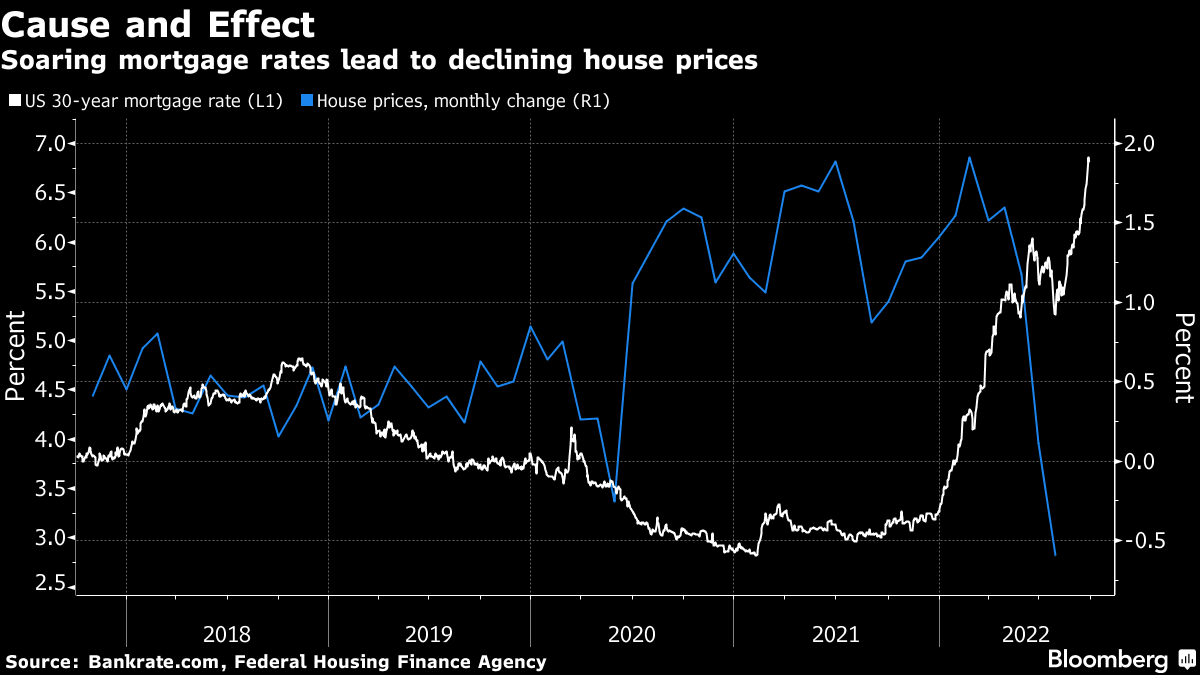
This is all the while the Federal Reserve (Fed), to address problems of its own (e.g., real estate affordability) is implementing aggressive monetary tightening (prompting a rise in the dollar and triggering a “reverse currency war”). 

Graphic: Retrieved from Bloomberg. “So if you want to spend $2,500 a month, you can now buy a house that costs $476,425. For that same monthly payment, you could have purchased a $758,572 house in early 2021.”

As an aside, US mortgage rates hit a 15-year high and home prices are falling.

Graphic: Retrieved via Bloomberg. To note, housing wealth regressions indicate “that every dollar of changes in housing wealth leads to a 38-cent change in consumption.”

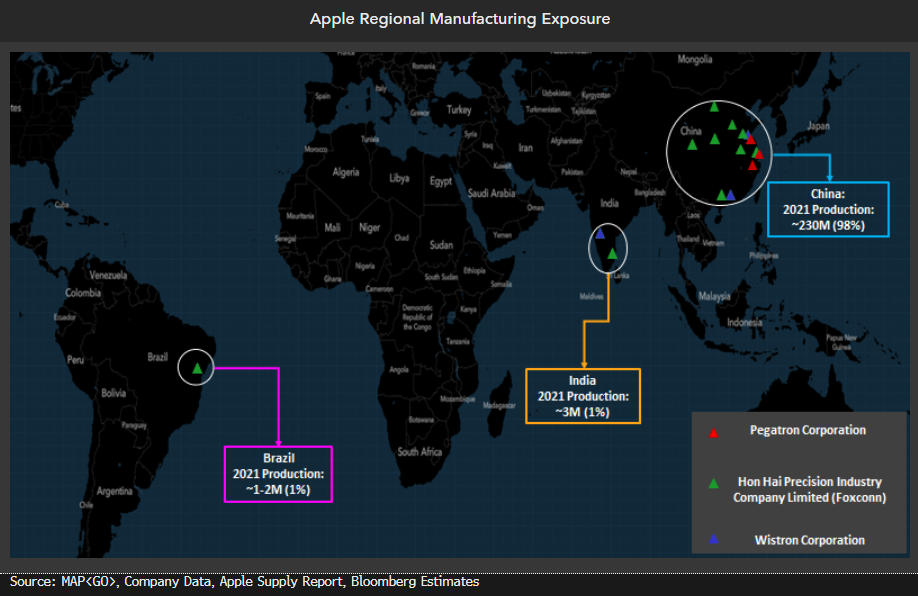
China is looking to do less of the same and “spark growth in an economy that’s been dragged down by COVID-19 lockdowns, a real estate crash, and supply chain snags,” which have hurt some US firms including Apple Inc (NASDAQ: AAPL).

Graphic: Retrieved from Bloomberg. Apple’s manufacturing exposure to China.

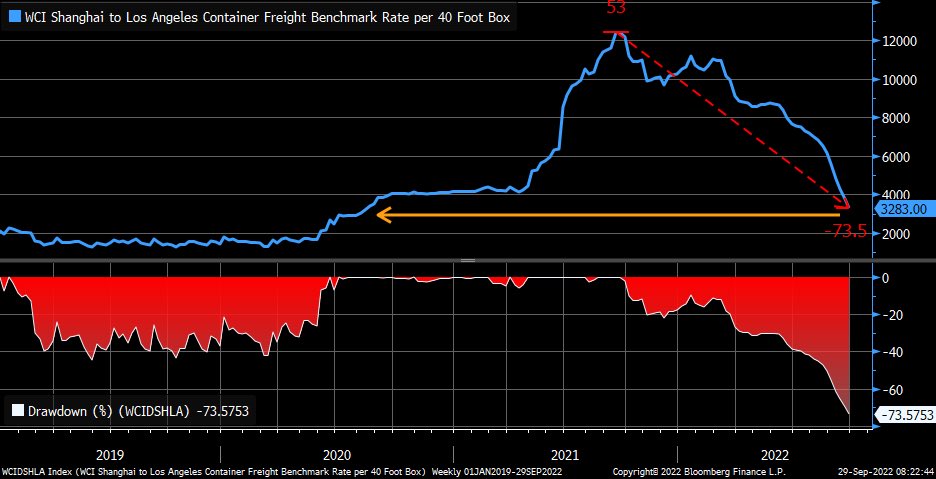
That’s the mismatch (i.e., China easy, US uneasy) that’s going on and, per some, the Fed may be acting on a set of lagging indicators; monetary policy action may do more harm than good.

Graphic: Retrieved from Bloomberg. Via Liz Ann Sonders. “Unbelievable decline in shipping rates … cost to send a 40-ft container from Shanghai to Los Angeles has fallen by 74% from peak and is back to August 2020 levels.”

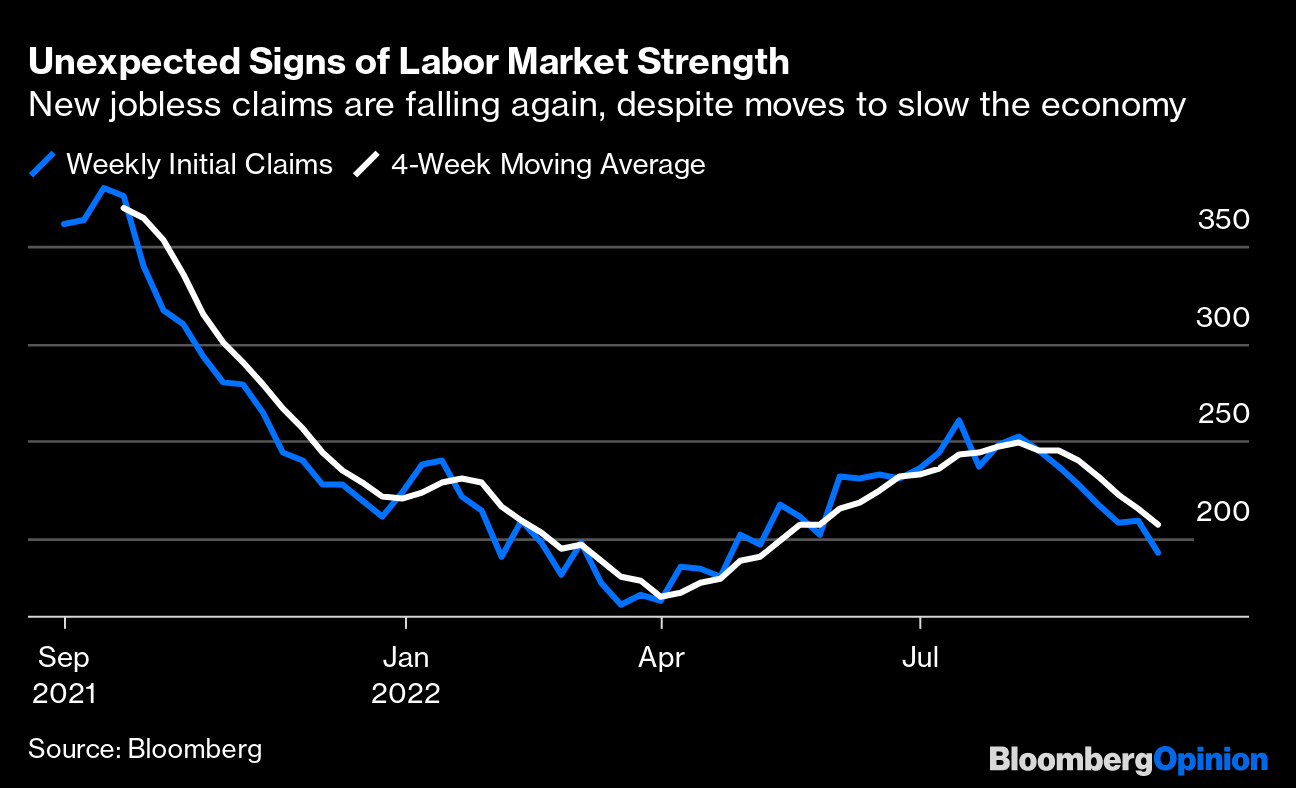
But, for now, a robust labor market and continued spending by American consumers have some feeling there’s far more room to go before US monetary policy does more harm than good.

Graphic: Retrieved from Bloomberg. An end of an era is approaching, however, as companies that grew largely over the past years, including Meta Platforms Inc (NASDAQ: META), seek to reduce headcount and reorganize.

Positioning

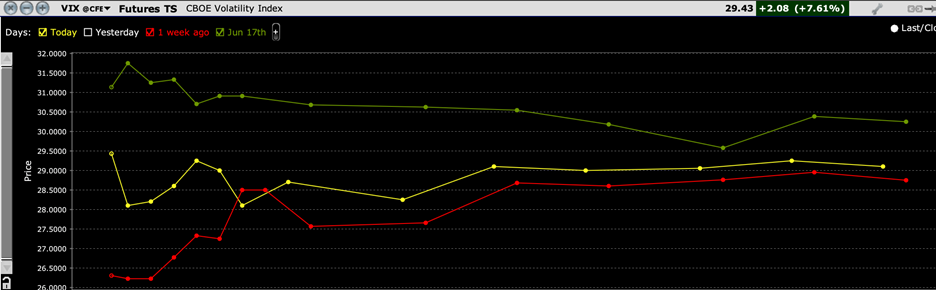
All that was said yesterday, and earlier this week, remains valid. In short, the decline prompted traders to demand downside protection, and this wound measures of implied volatility (IVOL).

Graphic: Retrieved from Interactive Brokers Group Inc (NASDAQ: IBKR). Read, here, to understand backwardation and contango in futures markets.

For IVOL measures to remain wound, something bad needs to happen, in short. Otherwise, as seen yesterday, slightly, the S&P 500 drifted lower while certain IVOL measures, such as the Cboe Volatility Index (INDEX: VIX) printed a lower high than that observed on Wednesday.

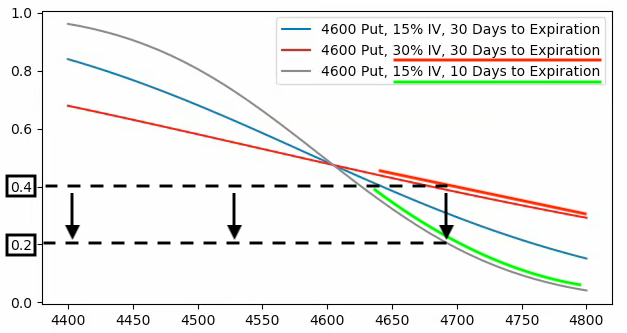
Per SpotGamma, “If the decline in IVOL is very pronounced, relative to the decline in the S&P, that too can aid in a push-and-pull that actually serves to … resist far-reaching weakness.”

Graphic: Retrieved from SpotGamma. SPX prices X-axis. Option delta Y-axis. When the factors of implied volatility (Vanna) and time change (Charm), hedging ratios change. The graphic is for illustrational purposes, only.

From hereon, the decay and/or removal of the protection that’s been demanded in the past days and weeks may place a like on IVOL and boost markets over a very short term. In the long term, however, weakness is here to stay, says Kai Volatility’s Cem Karsan. 

That’s amid impacts of quantitative tightening (QT) which is manifesting itself as “$4.5 billion less in demand for assets per day,” as well as the blackout period for buybacks (which were consistently “supporting the market”) and options repositioning bolstering the weakness.

Graphic: Via Physik Invest. Data compiled by @jkonopas623. Fed Balance Sheet data, here. Treasury General Account Data, here. Reverse Repo data, here. NL = BS – TGA – RRP.

A lot more on this positioning, and the rollover of some large fund exposures, which have grasped the attention of many online, in some coming letters.

Technical

As of 9:50 AM ET, Friday’s regular session (9:30 AM – 4:00 PM ET), in the S&P 500, is likely to open in the middle part of a balanced overnight inventory, inside of prior-range and -value, suggesting a limited potential for immediate directional opportunity.

In the best case, the S&P 500 trades higher.

Any activity above the $3,638.25 LVNode puts into play the $3,688.75 HVNode. Initiative trade beyond the HVNode could reach as high as the $3,722.50 LVNode and $3,771.25 HVNode, or higher.

In the worst case, the S&P 500 trades lower.

Any activity below the $3,638.25 LVNode puts into play the $3,610.75 HVNode. Initiative trade beyond the latter could reach as low as the $3,554.75 and $3,506.25 HVNode, or lower.

Click here to load today’s key levels into the web-based TradingView charting platform. Note that all levels are derived using the 65-minute timeframe. New links are produced, daily.
Graphic: 65-minute profile chart of the Micro E-mini S&P 500 Futures.

Definitions

Volume Areas: A structurally sound market will build on areas of high volume (HVNodes). Should the market trend for long periods of time, it will lack sound structure, identified as low volume areas (LVNodes). LVNodes denote directional conviction and ought to offer support on any test. 

If participants were to auction and find acceptance into areas of prior low volume (LVNodes), then future discovery ought to be volatile and quick as participants look to HVNodes for favorable entry or exit.

About

After years of self-education, strategy development, mentorship, and trial-and-error, Renato Leonard Capelj began trading full-time and founded Physik Invest to detail his methods, research, and performance in the markets.

Capelj also develops insights around impactful options market dynamics at SpotGamma and is a Benzinga reporter.

Some of his works include conversations with ARK Invest’s Catherine Wood, investors Kevin O’Leary and John Chambers, FTX’s Sam Bankman-Fried, ex-Bridgewater Associate Andy Constan, Kai Volatility’s Cem Karsan, The Ambrus Group’s Kris Sidial, among many others.

Disclaimer

In no way should the materials herein be construed as advice. Derivatives carry a substantial risk of loss. All content is for informational purposes only.

Categories
Commentary

Daily Brief For September 29, 2022

The daily brief is a free glimpse into the prevailing fundamental and technical drivers of U.S. equity market products. Join the 980+ that read this report daily, below!

Graphic updated 8:40 AM ET. Sentiment Neutral if expected /ES open is inside of the prior day’s range. /ES levels are derived from the profile graphic at the bottom of the following section. Levels may have changed since initially quoted; click here for the latest levels. SqueezeMetrics Dark Pool Index (DIX) and Gamma (GEX) calculations are based on where the prior day’s reading falls with respect to the MAX and MIN of all occurrences available. A higher DIX is bullish. At the same time, the lower the GEX, the more (expected) volatility. Learn the implications of volatility, direction, and moneyness. Breadth reflects a reading of the prior day’s NYSE Advance/Decline indicator. VIX reflects a current reading of the CBOE Volatility Index (INDEX: VIX) from 0-100.

Fundamental

More clarity surfaces on the turmoil overseas. After announcements regarding new fiscal policy that would feature steep tax cuts, the prices of longer-dated British bonds fell, prior to the Bank of England (BoE) announcing the purchase of longer-dated bonds to restore stability.

Here’s why the BoE did what it did:

In short, market volatility prompted reflexive feedback responses.

British pensions are required to match assets to liabilities “to ensure that promises to pensioners could be honored,” Bloomberg explained. This prompted purchases of long-dated bonds in size. Essentially, pensions would “enter into swap contracts, using [long-dated bonds] as collateral.” 

That’s because “swaps give[] the pension scheme far more capital to assign to those more interesting asset classes with high potential returns rather than having it tied up in boring gilts.”

“If the bet turned out wrong, [pensions would] have to pay something to the counterparty. And, if the collateral suddenly and unprecedentedly took a massive fall, the counterparty would face a margin call.” 

In size, these “margin calls had turned into a cascade,” forcing pensions to sell into weakness.

Talk of fund insolvencies and the effects of that on the economy, executives running day-to-day operations, not the BoE’s Monetary Policy Committee (MPC), implemented quantitative easing (QE), essentially, buying bonds and pushing their yields lower to ease market volatility.

In stories that followed, a London-based banker discussed his worry that the situation came close to looking like “a Lehman moment.” Cardano Investment executive Kerrin Rosenberg also said “if there was no intervention [], yields could have gone up to 7-8% from 4.5% [] and, in that situation, around 90 per cent of UK pension funds would have run out of collateral.” 

In light of the “madness,” the UK’s Simon Hoare said that actions must be taken at the Treasury and government levels. 

Adding, though volatility eased everywhere (e.g., mortgage rates), including in the US markets, the damages are not contained, some explain.

Graphic: S&P 500 (INDEX: SPX), top. 10-year US Treasury yield (INDEX: TNX), bottom.

UK investors will often “buy overseas assets and hedge away the currency risk,” Jim Leaviss of Bond Vigilantes explained. Amid all the volatility, “if you had bought a dollar bond and hedged it, the dollars that you have effectively sold ‘short’ against sterling as the hedge have rallied, and the counterparty to the FX hedge will call for a collateral payment.”

“Whilst most funds will hold some cash and extremely liquid government bonds against such moves, the size of the recent turmoil probably means that many investors will be having to liquidate credit and other less liquid assets in order to meet these collateral calls.”

Therefore, the aforementioned technical factors have a bearing on the direction of bonds and yields “over coming months.”

Elsewhere, in China, in alignment with a request for state banks to stock up for FX intervention, the “PBOC hit CNH in illiquid hours to have maximum impact,” as “the trouble the PBOC faces is similar to that of Japan – when domestic conditions call for easy policy (vs. US).”

Bob Elliot of Unlimited Funds adds “the moves are likely to be paired with more announcements of macroprudential strategies to slow depreciation. While they will make headlines, most have proven to be reactive and modest in their impact.”

Therefore, “[g]iven weak domestic conditions, the PBOC is very unlikely to prioritize FX over domestic easing – the diff[erence] to the US will only get worse.”

Graphic: Retrieved from Bloomberg. “Overseas demand for goods from China is weakening as the global economy slows … [and] soaring inflation [among] other headwinds elsewhere suppress global demand.” Accordingly, the “cost of shipping goods from China has slumped to the lowest level in more than two years as the world economy stumbles,” just as the US seeks to build more “resilient supply chains” elsewhere.

Positioning

Measures of implied volatility (IVOL) recorded decreases, yesterday, as traders supplied to the market protection, largely, at the front-end where “options are far more sensitive to changes in IVOL and direction,” as SpotGamma put

“As IVOL declines and the S&P rises, the probability of those options paying out falls. This is reflected by their exposure to direction (or Delta) dropping, also. To re-hedge decreased exposure to Delta, liquidity providers may provide the market with a boost.”

Graphic: Retrieved from SpotGamma. SPX prices X-axis. Option delta Y-axis. When the factors of implied volatility (Vanna) and time change (Charm), hedging ratios change. The graphic is for illustrational purposes, only.

As stated yesterday, in the very near term, the risks are skewed to the upside.

“For pumped-up options far from the money to retain their value, there essentially needs to be an adverse move (in price and volatility). Should nothing bad happen, the probability of these options paying out will fade, as will their exposure to direction (or Delta).”

Over a longer-term, however, weakness may persist into October amid impacts of quantitative tightening (QT) which is manifesting itself as “$4.5 billion less in demand for assets per day,” as well as the blackout period for buybacks (which were consistently “supporting the market”) and options repositioning bolstering the weakness.

Graphic: Via Physik Invest. Data compiled by @jkonopas623. Fed Balance Sheet data, here. Treasury General Account Data, here. Reverse Repo data, here. NL = BS – TGA – RRP.

Technical

As of 8:30 AM ET, Thursday’s regular session (9:30 AM – 4:00 PM ET), in the S&P 500, is likely to open in the lower part of a negatively skewed overnight inventory, inside of prior-range and -value, suggesting a limited potential for immediate directional opportunity.

In the best case, the S&P 500 trades higher.

Any activity above the $3,722.50 LVNode puts into play the $3,771.25 HVNode. Initiative trade beyond the $3,771.25 could reach as high as the $3,826.25 and $3,862.25 HVNode, or higher.

In the worst case, the S&P 500 trades lower.

Any activity below the $3,722.50 LVNode puts into play the $3,688.75 HVNode. Initiative trade beyond the HVNode could reach as low as the $3,638.25 LVNode and $3,610.75 HVnode, or lower.

Click here to load today’s key levels into the web-based TradingView charting platform. Note that all levels are derived using the 65-minute timeframe. New links are produced, daily.
Graphic: 65-minute profile chart of the Micro E-mini S&P 500 Futures.

Definitions

Volume Areas: A structurally sound market will build on areas of high volume (HVNodes). Should the market trend for long periods of time, it will lack sound structure, identified as low volume areas (LVNodes). LVNodes denote directional conviction and ought to offer support on any test. 

If participants were to auction and find acceptance into areas of prior low volume (LVNodes), then future discovery ought to be volatile and quick as participants look to HVNodes for favorable entry or exit.

About

After years of self-education, strategy development, mentorship, and trial-and-error, Renato Leonard Capelj began trading full-time and founded Physik Invest to detail his methods, research, and performance in the markets.
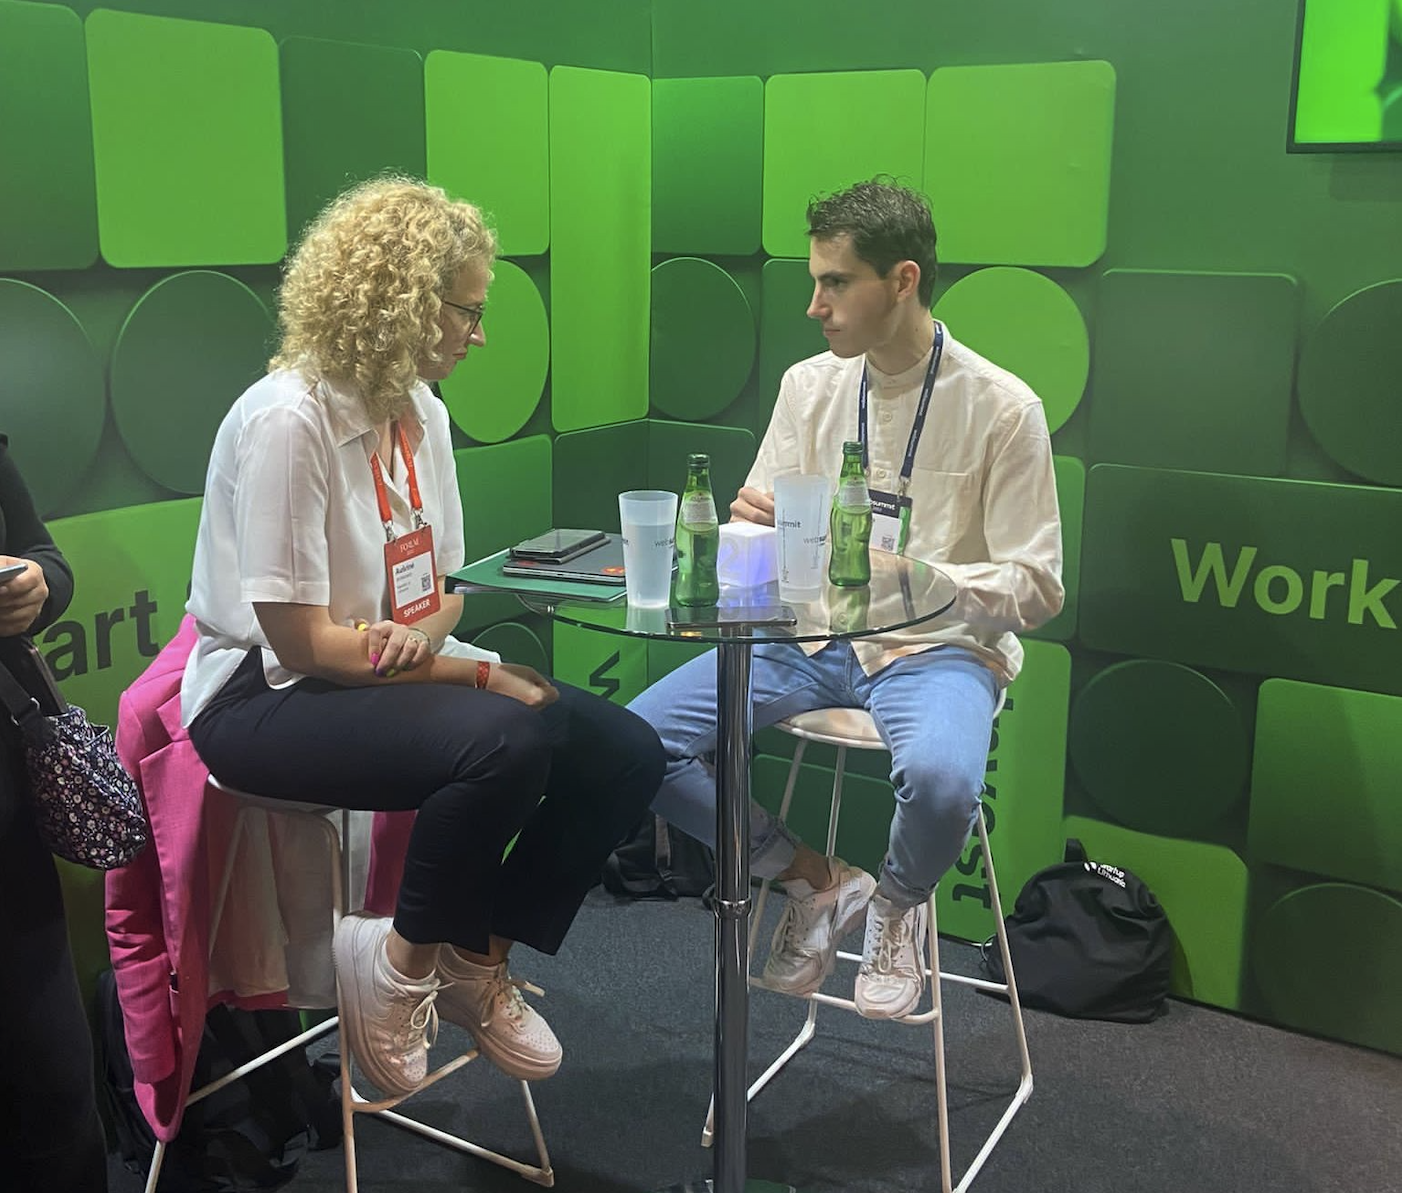
Capelj also develops insights around impactful options market dynamics at SpotGamma and is a Benzinga reporter.
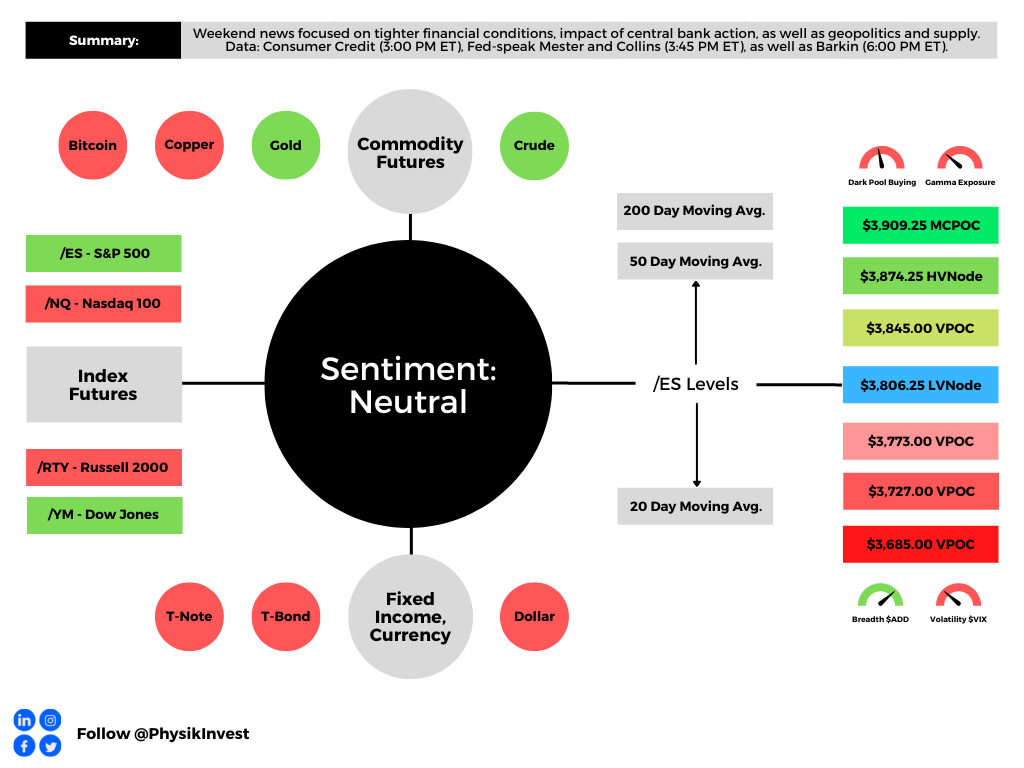
Some of his works include conversations with ARK Invest’s Catherine Wood, investors Kevin O’Leary and John Chambers, FTX’s Sam Bankman-Fried, ex-Bridgewater Associate Andy Constan, Kai Volatility’s Cem Karsan, The Ambrus Group’s Kris Sidial, among many others.

Disclaimer

In no way should the materials herein be construed as advice. Derivatives carry a substantial risk of loss. All content is for informational purposes only.

Categories
Commentary

Daily Brief For September 27, 2022

The daily brief is a free glimpse into the prevailing fundamental and technical drivers of U.S. equity market products. Join the 950+ that read this report daily, below!

Graphic updated 6:45 AM ET. Sentiment Neutral if expected /ES open is inside of the prior day’s range. /ES levels are derived from the profile graphic at the bottom of the following section. Levels may have changed since initially quoted; click here for the latest levels. SqueezeMetrics Dark Pool Index (DIX) and Gamma (GEX) calculations are based on where the prior day’s reading falls with respect to the MAX and MIN of all occurrences available. A higher DIX is bullish. At the same time, the lower the GEX, the more (expected) volatility. Learn the implications of volatility, direction, and moneyness. Breadth reflects a reading of the prior day’s NYSE Advance/Decline indicator. VIX reflects a current reading of the CBOE Volatility Index (INDEX: VIX) from 0-100.

Fundamental

Top of mind, yesterday, was the drop in Britain’s currency (GBP) and a surge in bond yields on the back of new fiscal plans and pledged tax cuts, alongside a more easy pace of interest rate hikes by the Bank of England (BoE). See the Daily Brief for September 26, 2022, for context.

Graphic: Retrieved from Bloomberg.

Knowing that the fiscal stimulus and an easy-moving BoE would add to inflation that is already high and sticky, traders began pricing emergency rate hikes, all the while conversation around the impacts of the UK’s rising rates on mortgage lending and the “dollar doom loop” surfaced.

In response, the BoE’s Governor Andrew Bailey said they were “monitoring developments in financial markets,” and at the “next scheduled meeting of the impact on demand and inflation from the Government’s announcement, and the fall in sterling, … [t]he MPC [won’t] hesitate to change interest rates by as much as needed to return inflation to the 2% target.”

Per Citigroup Inc (NYSE: C), however, “[m]onetary policy will struggle to save FX when fiscal policy is the culprit.”

Lawrence Henry Summers, a former US Secretary of the Treasury, also commented that he “would not be amazed if British short rates more than triple in the next two years and reach levels above 7 percent.”

That’s “because US rates are now projected to approach 5 percent and Britain, [which] has much more serious inflation, is pursuing more aggressive fiscal expansion and has larger financing challenges.”

Graphic: Retrieved from Bloomberg.

On the topic of rising yields and lenders’ disinterest to issue mortgages, among other things, it is the case that bond buying, via tools such as quantitative easing (QE), left room for confidence to eventually run out and the bond market to revolt.

Read our monetary policy explainers published on September 19 and 20.

Per statements authored by Bloomberg’s John Authers, the “UK appears to be the first case of a true disorderly bond selloff, where the moves are so swift that they affect the functioning of the financial system. It’s been triggered by a combination of inflation and rash fiscal policy.”

Accordingly, the actions by policymakers abroad serve to reinforce the earlier discussed “dollar doom loop”; the rising USD, though reducing the impact of inflation in the US, ultimately hurts most dollar-denominated debt servicing (see Latin America in the 1980s).

Graphic: Retrieved from Bloomberg.

Positioning

Seasonally speaking, the week after September options expiry (OPEX) is one of the worst on record. The weakness often persists into October.

To quote Kai Volatility’s Cem Karsan:

So, “less support from Vanna and Charm, less support through QT, and less buyback,” presents a “fragile moment” with the next week representing the most “dangerous period” on record.

Graphic: Retrieved from SpotGamma. “SPX prices X-axis. Option delta Y-axis. When the factors of implied volatility (Vanna) and time change (Charm), hedging ratios change. The graphic is for illustrational purposes, only.”

For context, it is the impacts of quantitative tightening (QT) which is manifesting itself as “$4.5 billion less in demand for assets per day,” as well as the blackout period for buybacks (which were consistently “supporting the market”) and options repositioning bolstering the weakness.

Graphic: Via Physik Invest. Data compiled by @jkonopas623. Fed Balance Sheet data, here. Treasury General Account Data, here. Reverse Repo data, here. NL = BS – TGA – RRP.

Separately, a hot topic concerns the money that is piling into money funds where “the vast bulk now earns upwards of 2%, with pockets paying 3%, 4% or more.”

Graphic: Retrieved from Bloomberg. “Money funds, banks, and others are so flush with cash these days that they’re shoveling record amounts into the Fed’s overnight reverse repurchase agreement facility, a short-term instrument that, following the central bank’s 75 basis point hike last week, now pays a rate of 3.05%.”

The theory is as follows: if “cash is yielding 4%, why not just sit in cash while the macro environment clarifies a little bit?”

With traditional 60/40 upended, and the gap “between what banks are paying on deposits and what money-market funds are offering” widening, “money funds are likely to attract more inflows going forward as a result, pushing [the] usage of the RRP facility even higher.” 

Graphic: Retrieved from Goldman Sachs Group Inc (NYSE: GS).

This is all, however, money that is waiting to be deployed, “should market sentiment improve, or asset prices tumble to levels too attractive to pass up.”

Should you, too, desire to pursue guaranteed rates of return, last week Box Spreads were put forth as a solution. These trades “allow market participants to create a loan structure similar to a Treasury bill.” Upon maturity, the Box Spread earns a competitive interest rate.

Price some trades at boxtrades.com.

Graphic: Retrieved from boxtrades.com.

Technical

As of 6:30 AM ET, Tuesday’s regular session (9:30 AM – 4:00 PM ET), in the S&P 500, is likely to open in the middle part of a positively skewed overnight inventory, inside of prior-range and -value, suggesting a limited potential for immediate directional opportunity.

In the best case, the S&P 500 trades higher.

Any activity above the $3,688.75 HVNode puts into play the $3,722.50 LVNode. Initiative trade beyond the LVNode could reach as high as the $3,771.25 and $3,826.25 HVNode, or higher.

In the worst case, the S&P 500 trades lower.

Any activity below the $3,688.75 HVNode puts into play the $3,638.25 LVNode. Initiative trade beyond the LVNode could reach as low as the $3,610.75 and $3,554.75 HVNode, or lower.

Click here to load today’s key levels into the web-based TradingView charting platform. Note that all levels are derived using the 65-minute timeframe. New links are produced, daily.
Graphic: 65-minute profile chart of the Micro E-mini S&P 500 Futures.
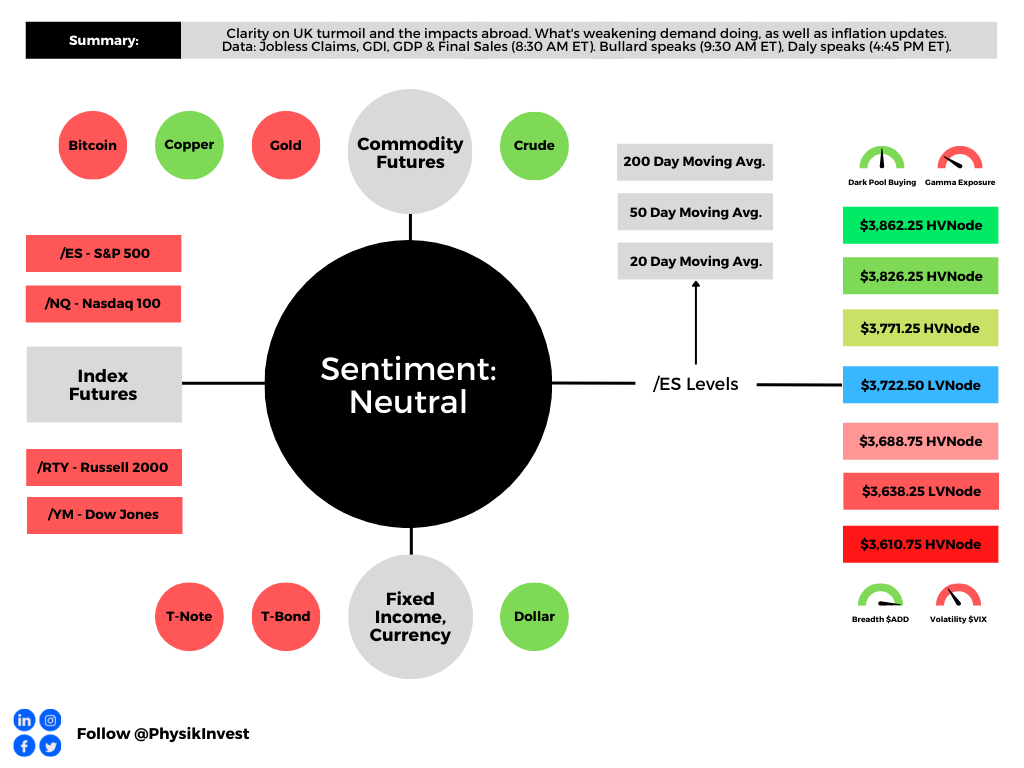
Definitions

Volume Areas: A structurally sound market will build on areas of high volume (HVNodes). Should the market trend for long periods of time, it will lack sound structure, identified as low volume areas (LVNodes). LVNodes denote directional conviction and ought to offer support on any test. 

If participants were to auction and find acceptance into areas of prior low volume (LVNodes), then future discovery ought to be volatile and quick as participants look to HVNodes for favorable entry or exit.

Vanna: The rate at which the delta of an option changes with respect to volatility.

Charm: The rate at which the delta of an option changes with respect to time.

About

After years of self-education, strategy development, mentorship, and trial-and-error, Renato Leonard Capelj began trading full-time and founded Physik Invest to detail his methods, research, and performance in the markets.
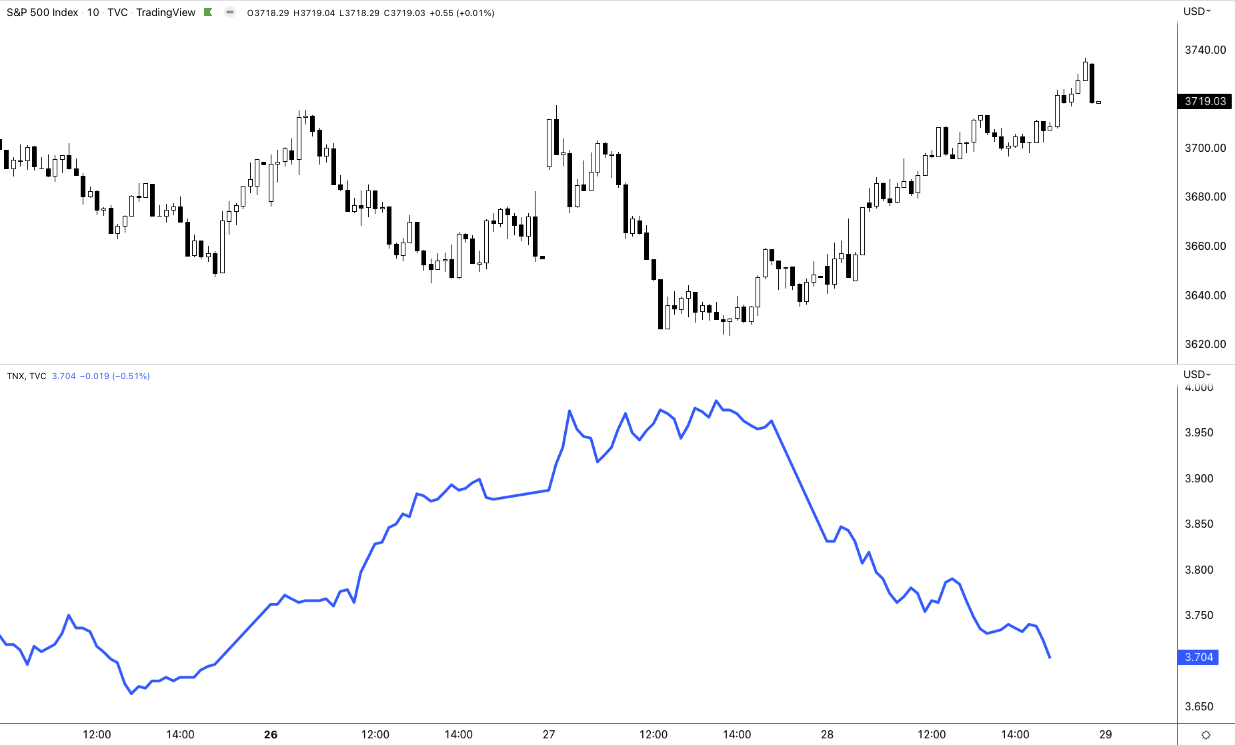
Capelj also develops insights around impactful options market dynamics at SpotGamma and is a Benzinga reporter.
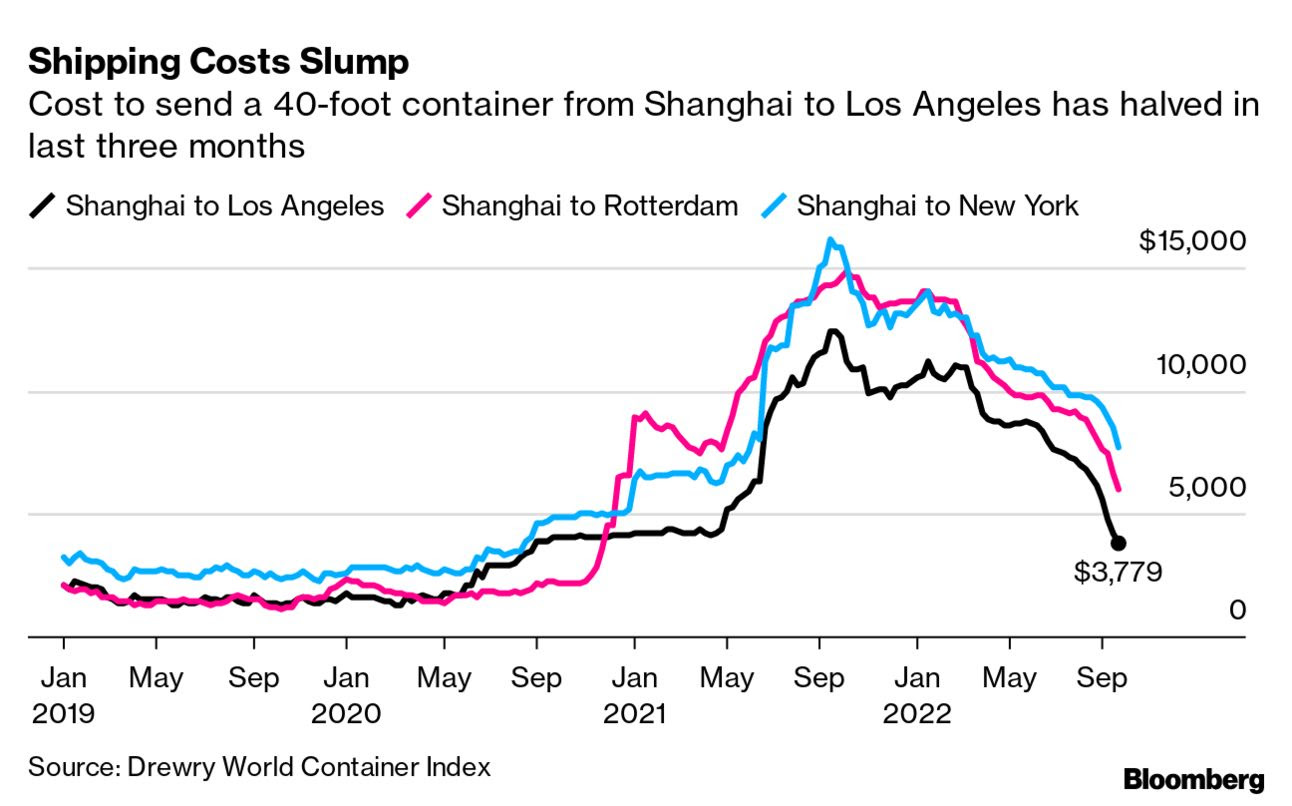
Some of his works include conversations with ARK Invest’s Catherine Wood, investors Kevin O’Leary and John Chambers, FTX’s Sam Bankman-Fried, ex-Bridgewater Associate Andy Constan, Kai Volatility’s Cem Karsan, The Ambrus Group’s Kris Sidial, among many others.

Disclaimer

In no way should the materials herein be construed as advice. Derivatives carry a substantial risk of loss. All content is for informational purposes only.