The daily brief is a free glimpse into the prevailing fundamental and technical drivers of U.S. equity market products. Join the 700+ that read this report daily, below!
Fundamental
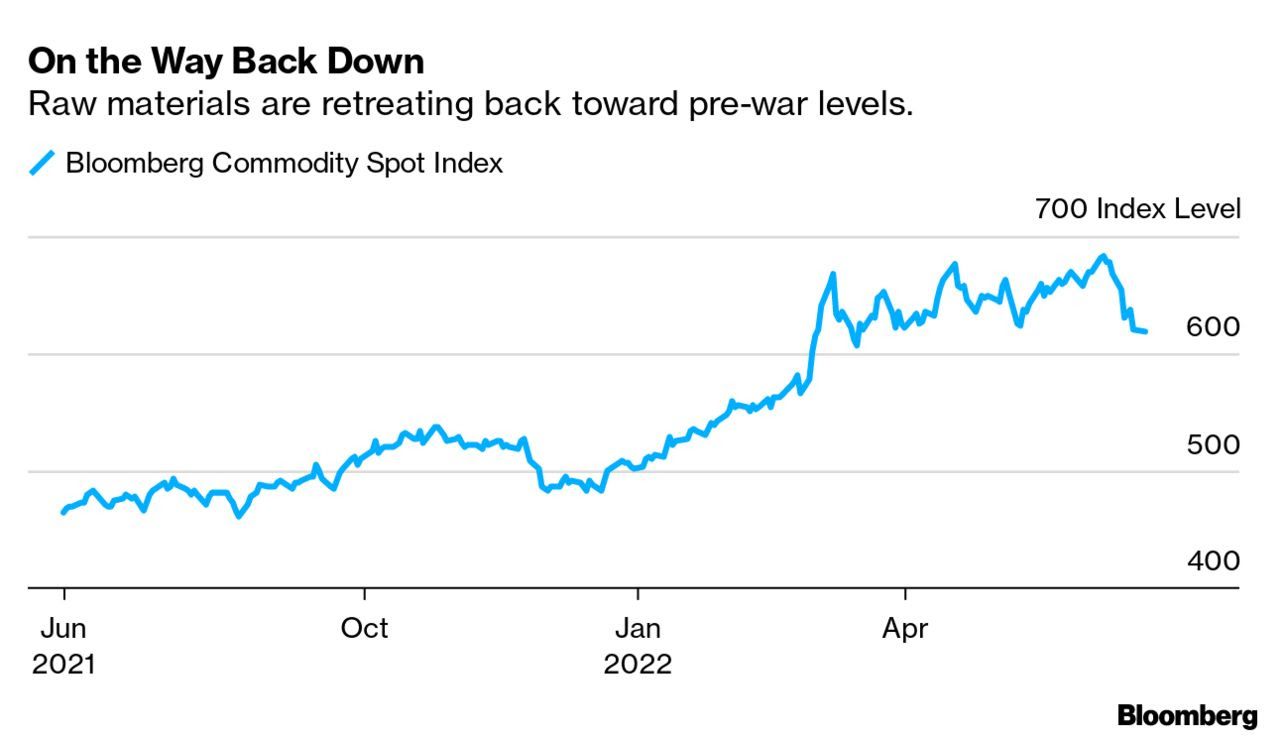
Our August 1 letter assessed, mainly, the impacts of a burgeoning economic war that is hot as well put by a recent note authored by Credit Suisse Group AG’s (NYSE: CS) Zoltan Pozsar.
Read: Dr. Pippa Malmgren’s “A Hot War In Cold Places,” which was quoted by Credit Suisse’s Pozsar. Additionally, check out our archives for more analysis of Malmgren’s perspectives.
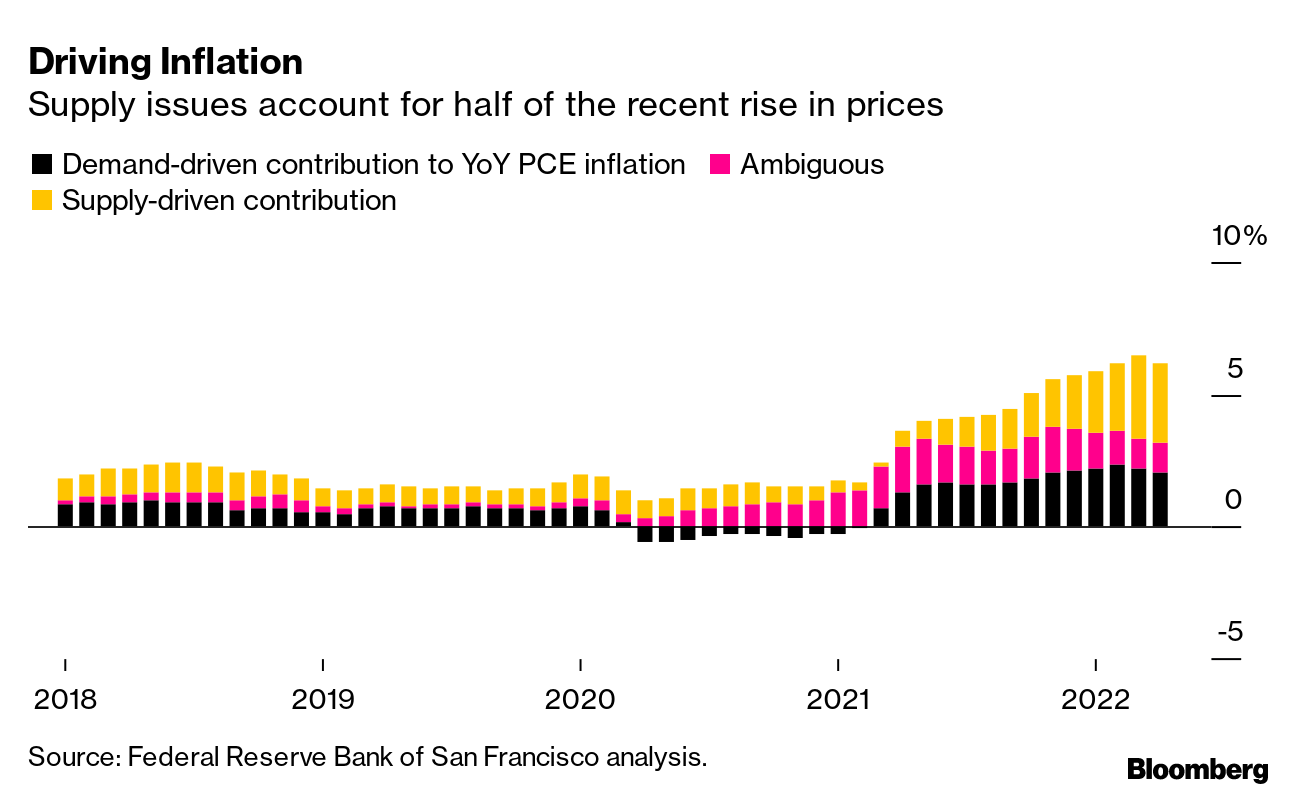
“Great powers are waging hot wars involving the flow of technologies, goods, and commodities,” the big “contributors to inflation,” a longer-lasting structural issue, Pozar puts forth.
Further, it is the case that “the pillars of the low inflation world are changing,” and geopolitics are the factors bolstering longer-lasting uncertainty and risk premia.
What was the case, before?
Previously, central bankers were waging wars “against deflationary impulses coming from the globalization of cheap resources (labor, goods, and commodities),” which we covered before.
Now, central bankers have a more difficult task stemming inflationary impulses coming from a complex and non-linear economic war between the U.S., China, and Russia that will do more, long-term, to “weaken the pillars of the globalized, low inflation world.”
So:
- Deflation, on globalization (and outward supply shifts), was fought with asset price inflation.
- Inflation, on de-globalization (and inward supply shifts), is fought with asset price deflation.
Exacerbating the de-globalization pulse on popular sovereignty, which I had the honor of talking on with Andy Constan, recently, are “wealth gains sapping labor force participation” and trends such as ESG, among other things.
“It’s a mess: it’s easier to deal with the politics of wage setting than it is to ‘grow’ people – even in The Matrix, that’s possible only over time. Until then, we are stuck with a labor shortage, and President Biden’s top labor lawyer is the anti-Reagan: she’s encouraging the unionization of workers from Amazon to Starbucks…as opposed to firing them,” Pozsar explains.
For context, among the factors that helped Chairman Volcker stem inflation were new energy investment and the weakening of unions.
Accordingly, in a move from “generating demand structurally to soak up an excess supply of cheap stuff, to curbing demand structurally to adjust to shortages,” the prevailing tightening effort is not cyclical, as in corresponding to a business cycle. It’s structural.
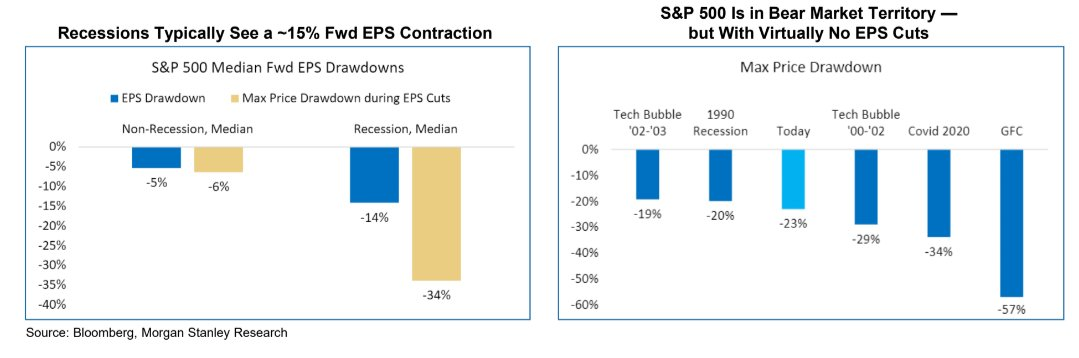
It requires the sharp, “inward shift of supply curves across multiple fronts (labor, goods, and commodities),” putting the economy on an “L”-shaped path (i.e., a vertical drop in activity via recession, and flatline for a period of time as rates remain higher for longer to prevent a sharp rise in inflation, again).
Market participants, because of this, should be thinking about how deep (i.e., long-lasting) a recession is needed to curb inflation (rather than if a recession will happen at all); necessary is the purge of the “Super Size Me” mentality, Pozsar explains, and slow “interest-rate sensitive parts of the economy (housing and durables),” as well as reduce “demand for labor in services, … a function of the level of wealth across a range of assets (housing, stocks, as well as crypto).
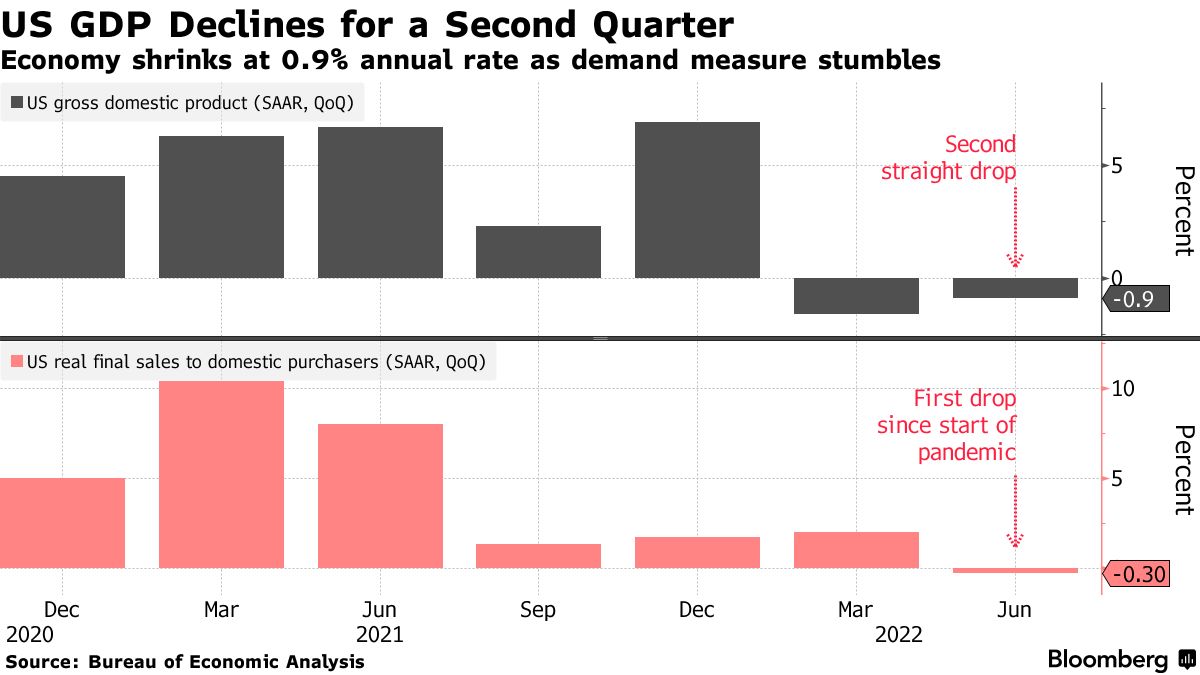
“[W]hat the Fed is telling us when it flat-out dismisses two-quarters of negative GDP growth is that it isn’t focusing as much on the rate-sensitive parts of the economy as it did in the past,” Pozsar well summarizes, adding that 5-6% rates are not out of the realm of possibilities.
“Instead, it is focusing much more on the services economy and the labor market, which still remain strong. And therein lies the cautionary tale for the market.”
Looking out further in time, after inflation has been stemmed, the question is how the economy accelerates, again, and achieves stable growth. That depends on the West developing its own supply of things so “that ‘L’ becomes ‘L/’ and … that recovery [will be driven by] fiscally funded industrial policy.”
Positioning
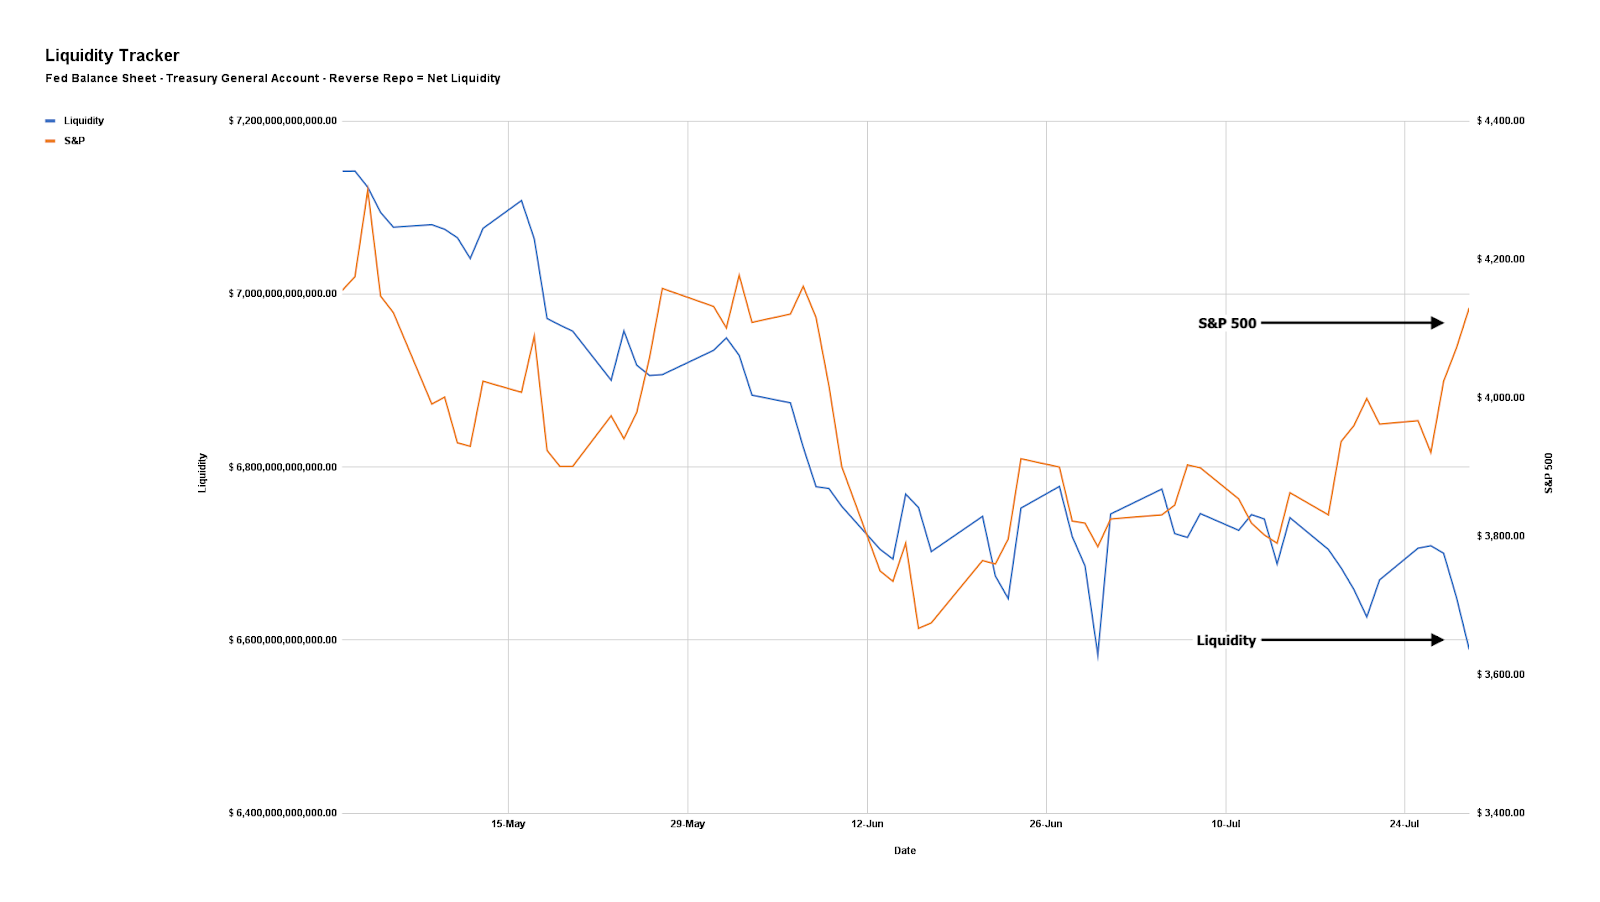
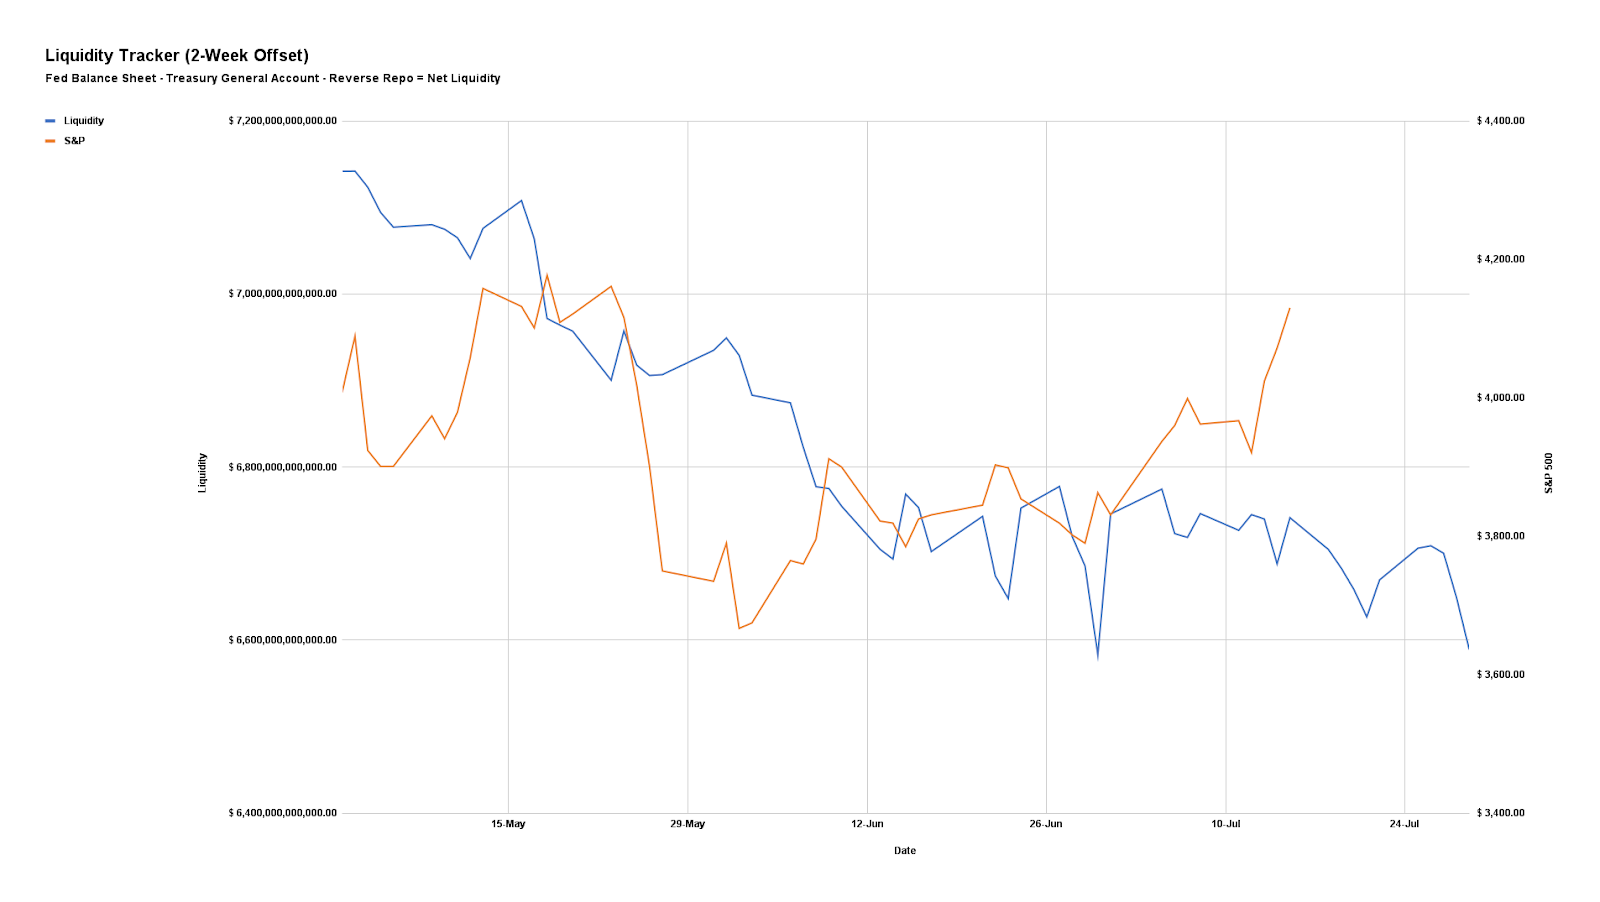
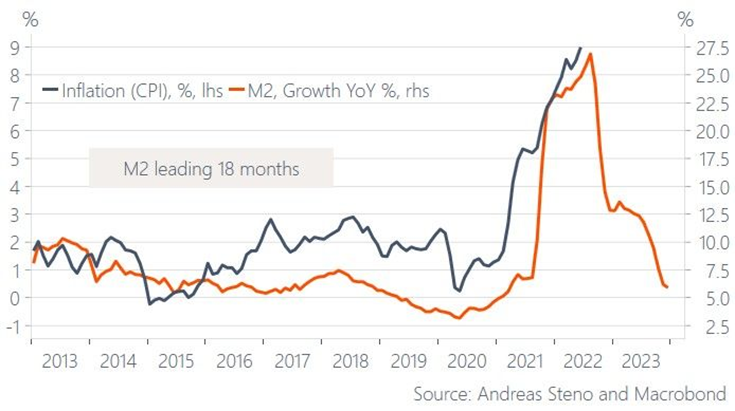
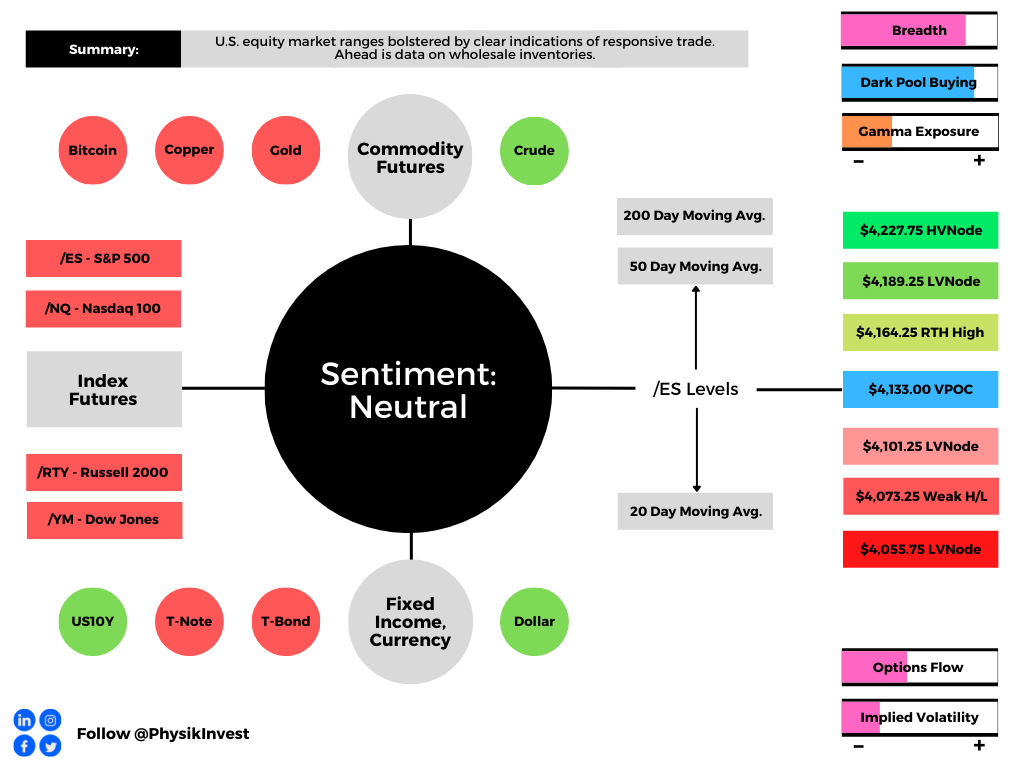
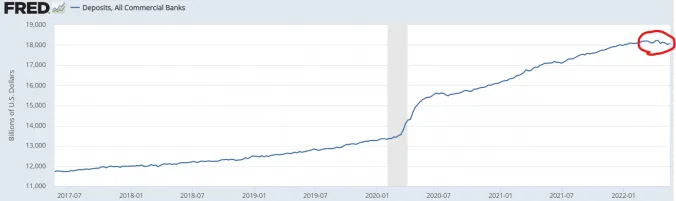
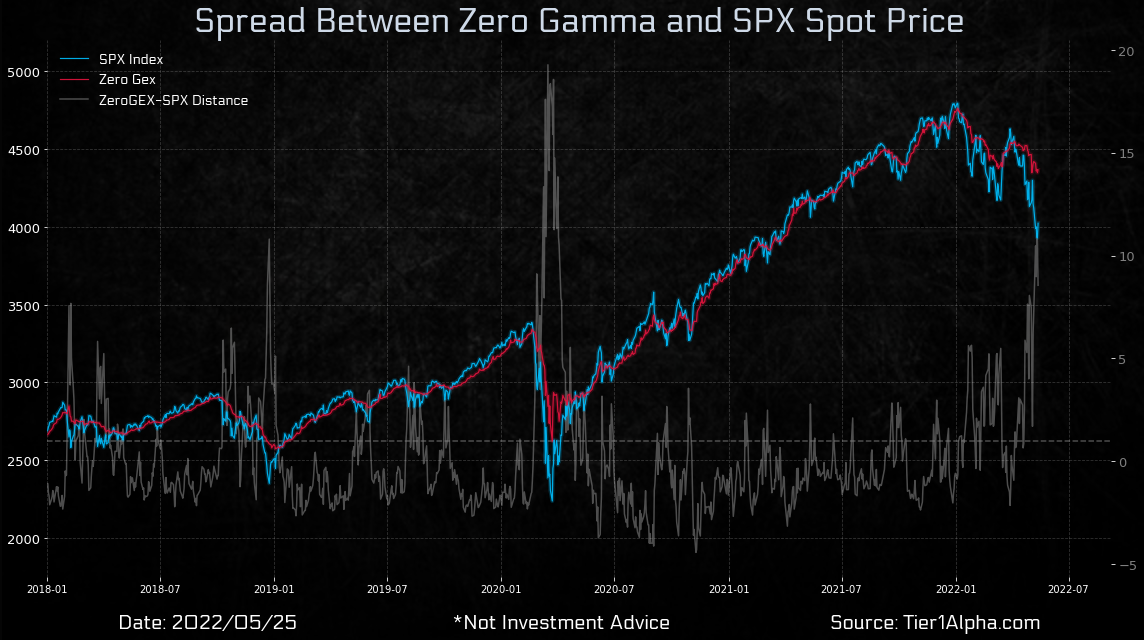
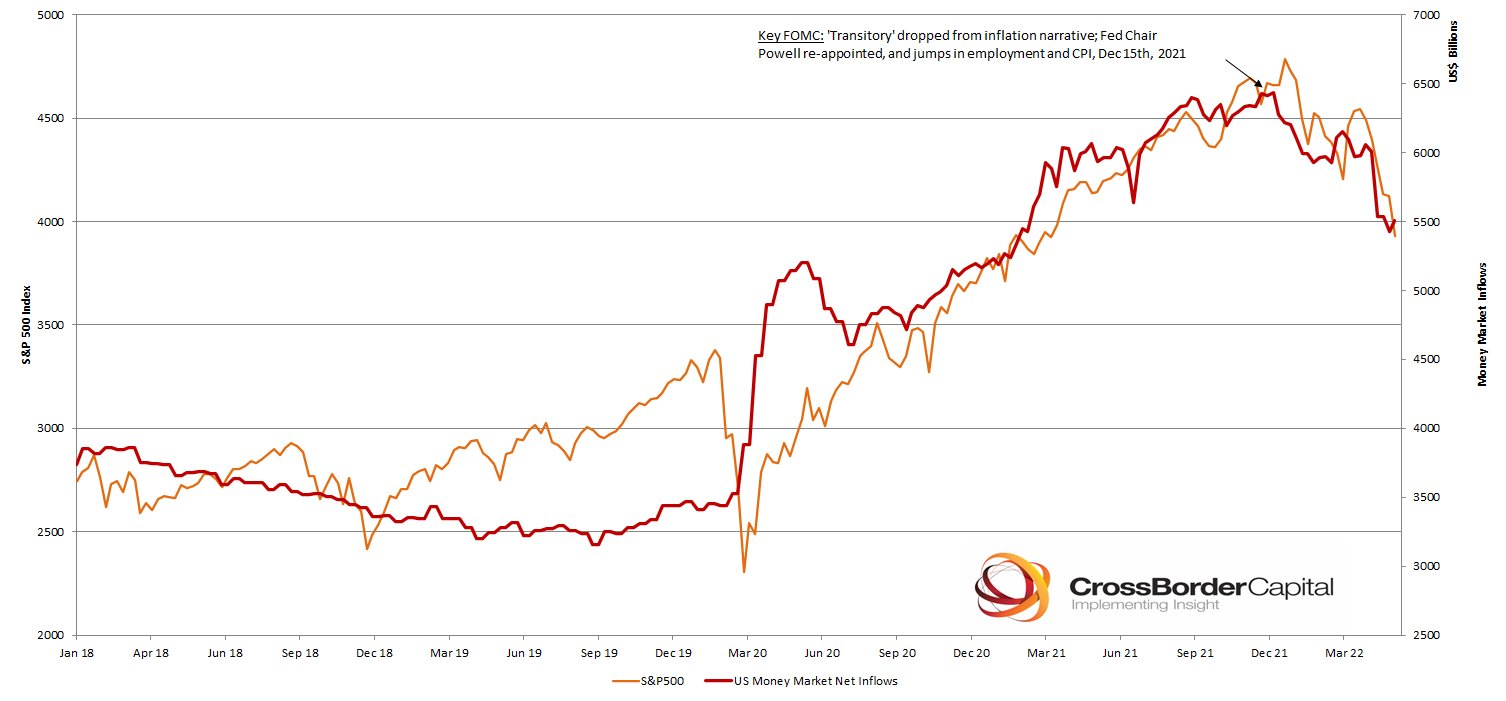
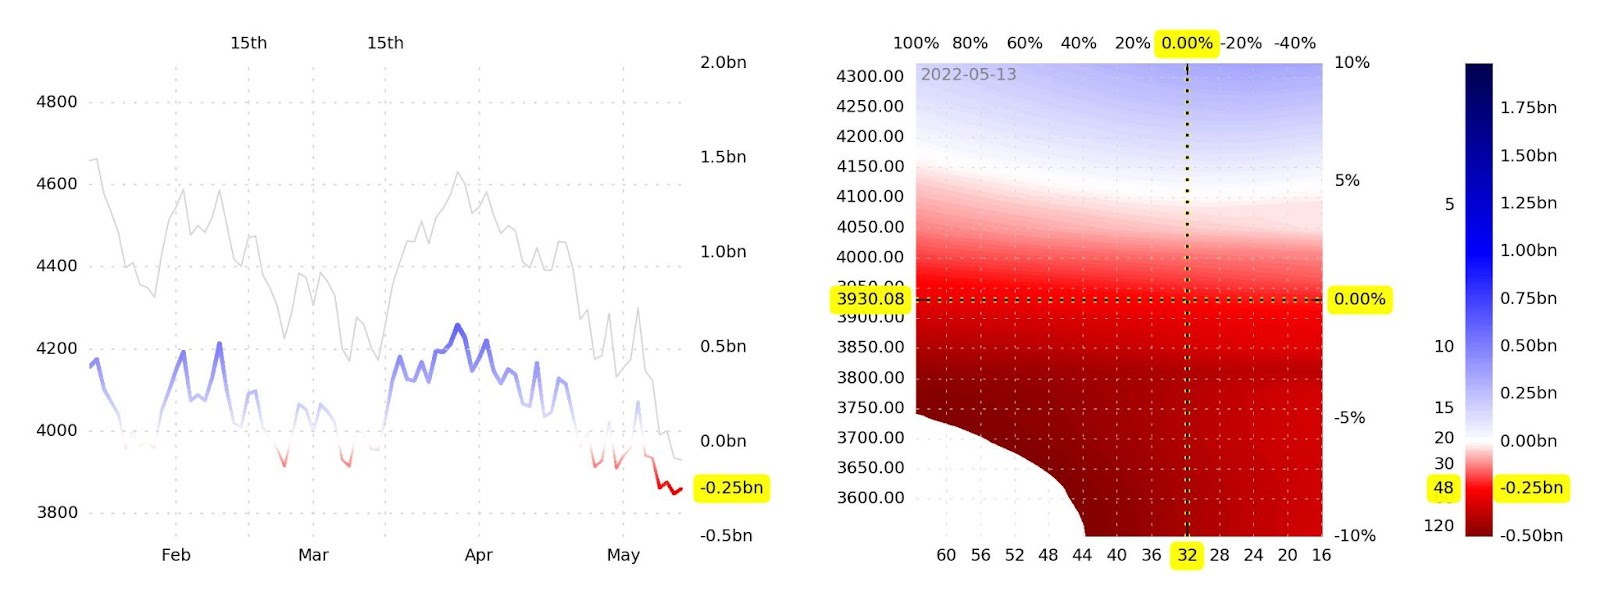
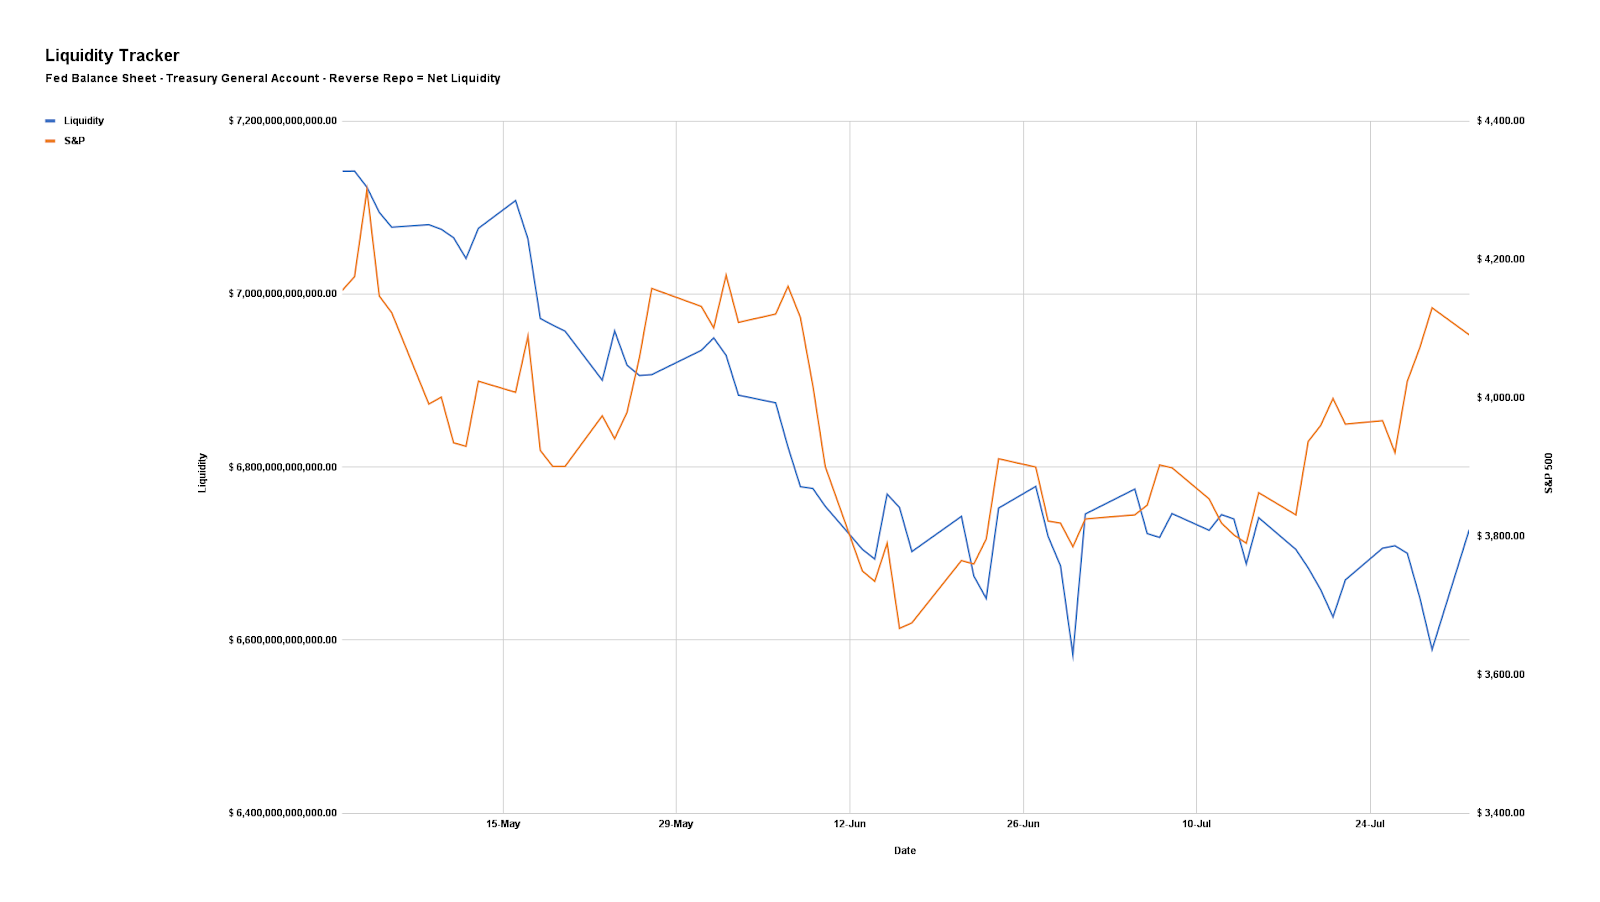
Regarding the topic of liquidity – money available for circulation – which was discussed in-depth Tuesday, August 2, below is an updated chart of our Liquidity Tracker. Conditions are mostly unchanged.
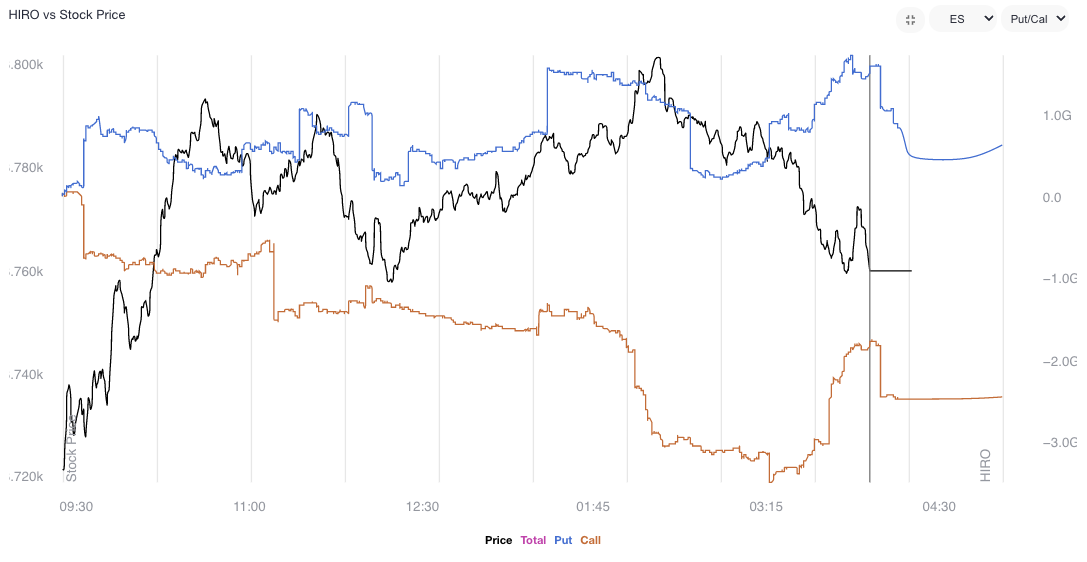
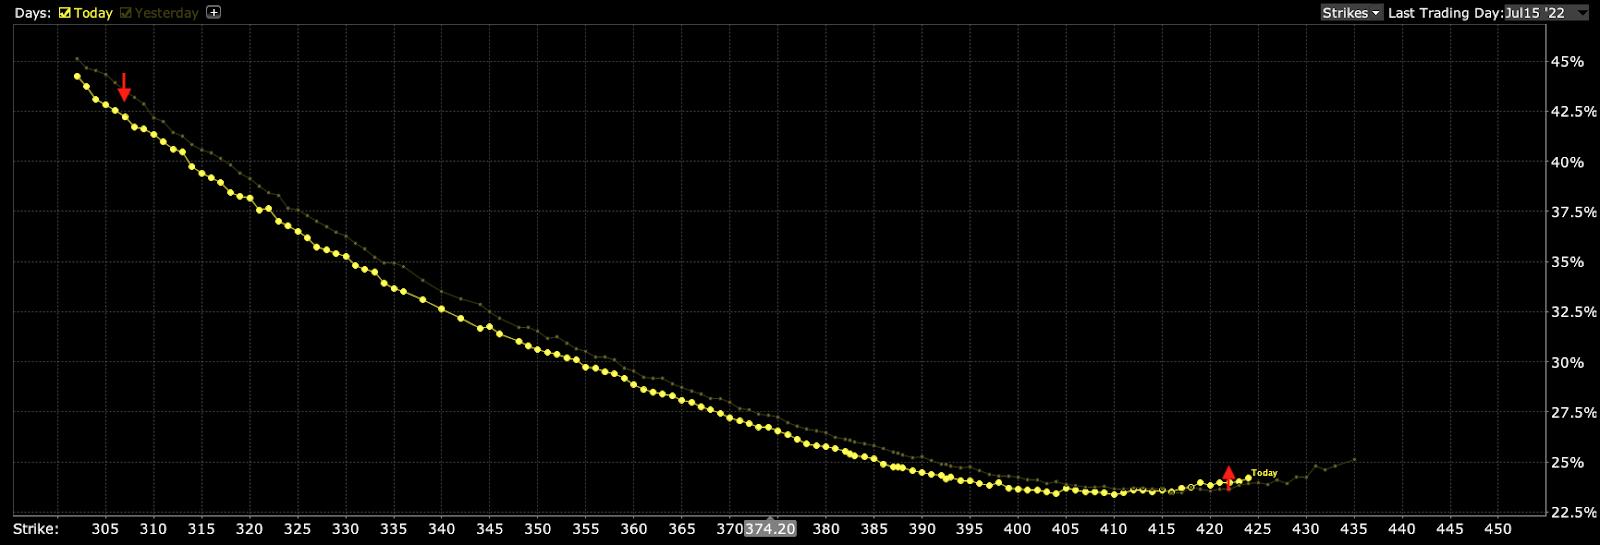
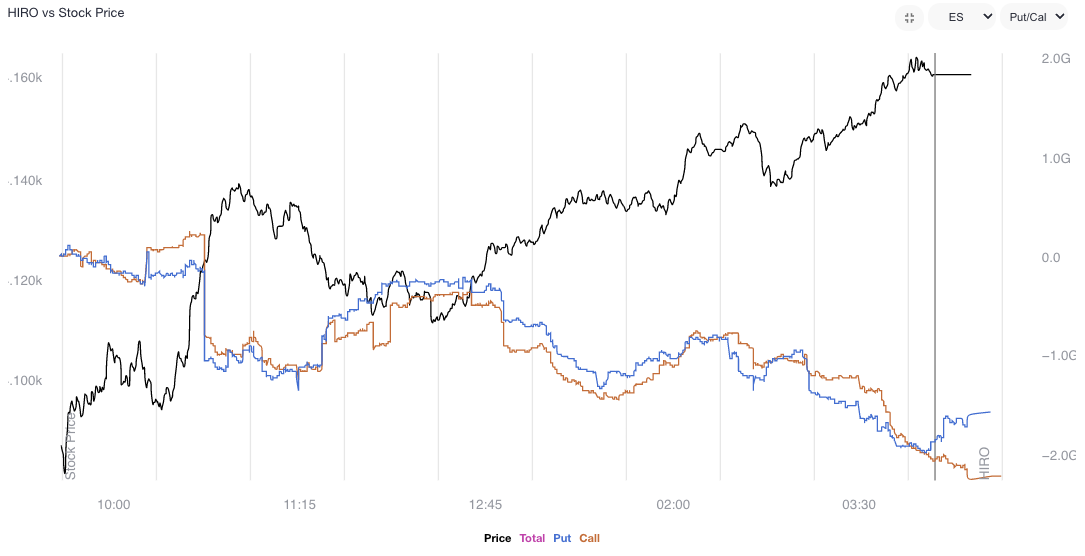
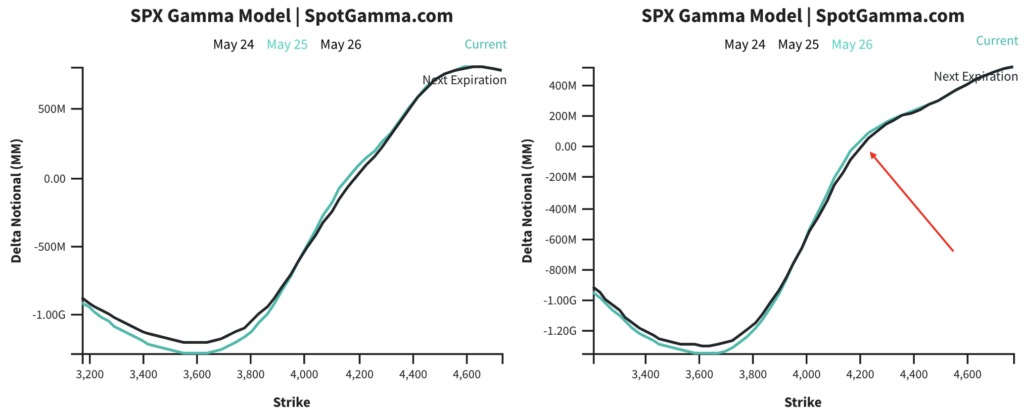
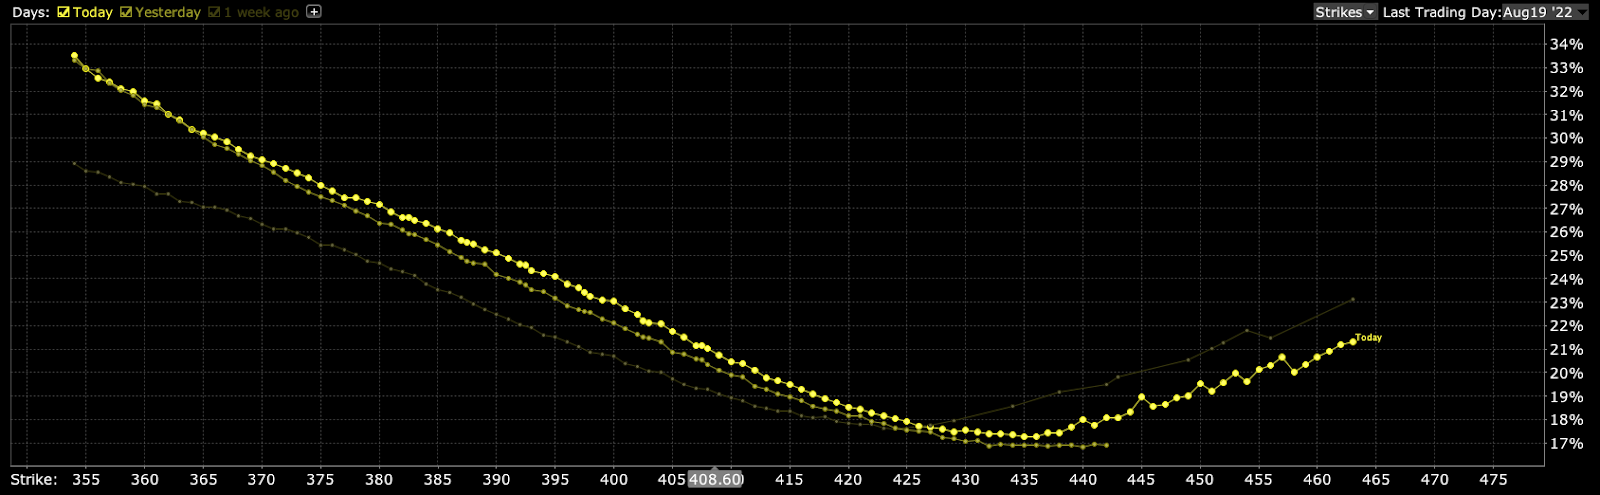
Moreover, in terms of options-related positioning, as of 8:50 AM ET, Wednesday’s expected volatility, via the Cboe Volatility Index (INDEX: VIX), sits at ~1.21%. Net gamma exposures increasing may promote tighter ranges.
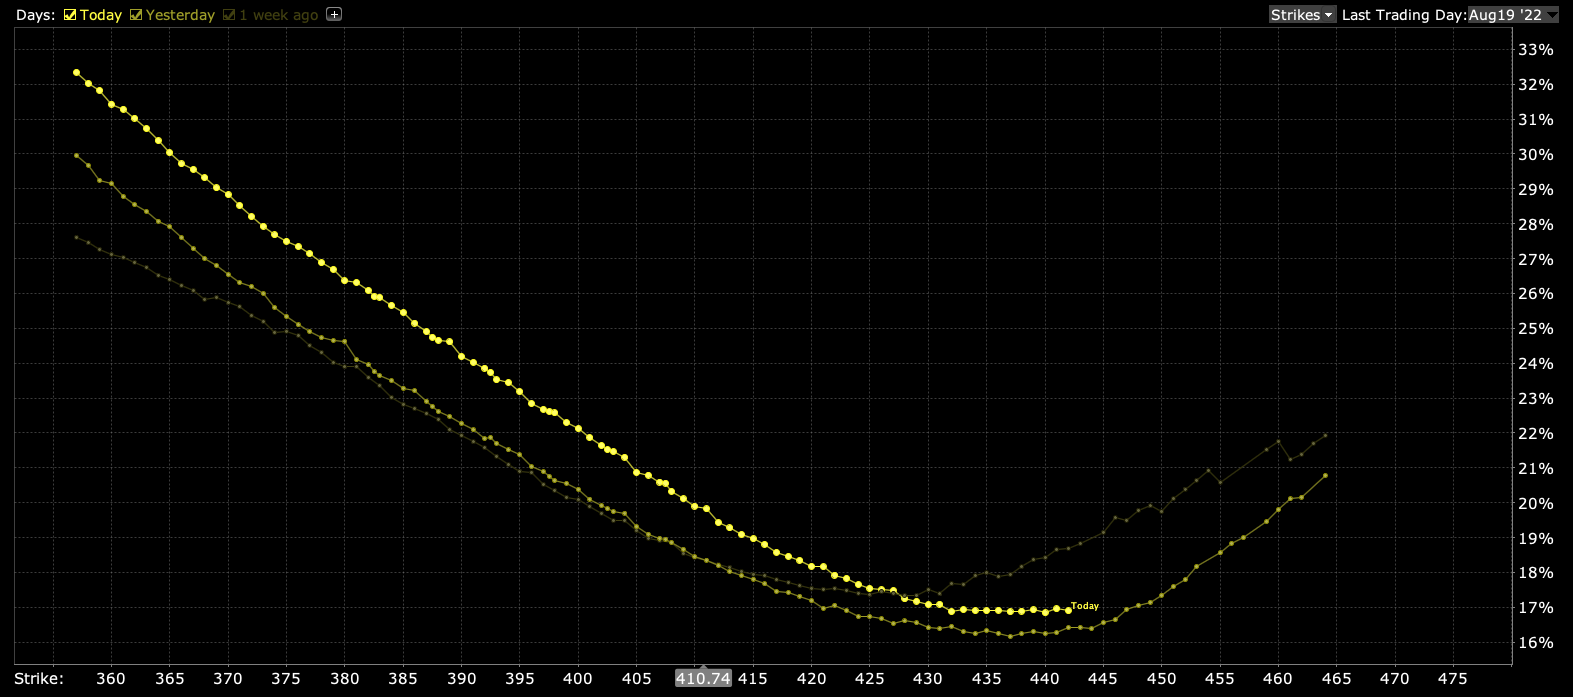
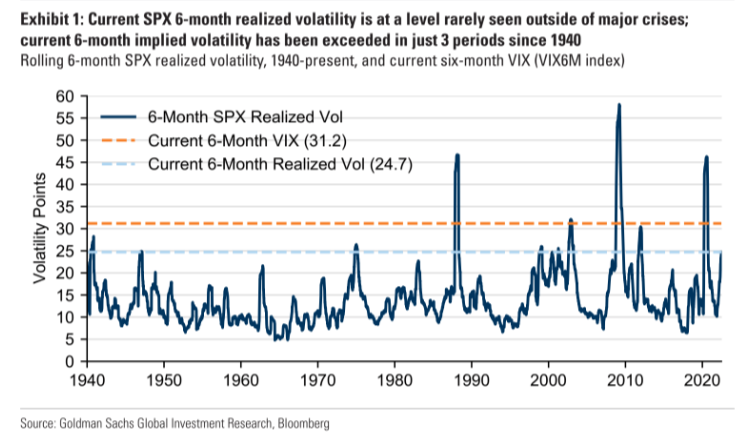
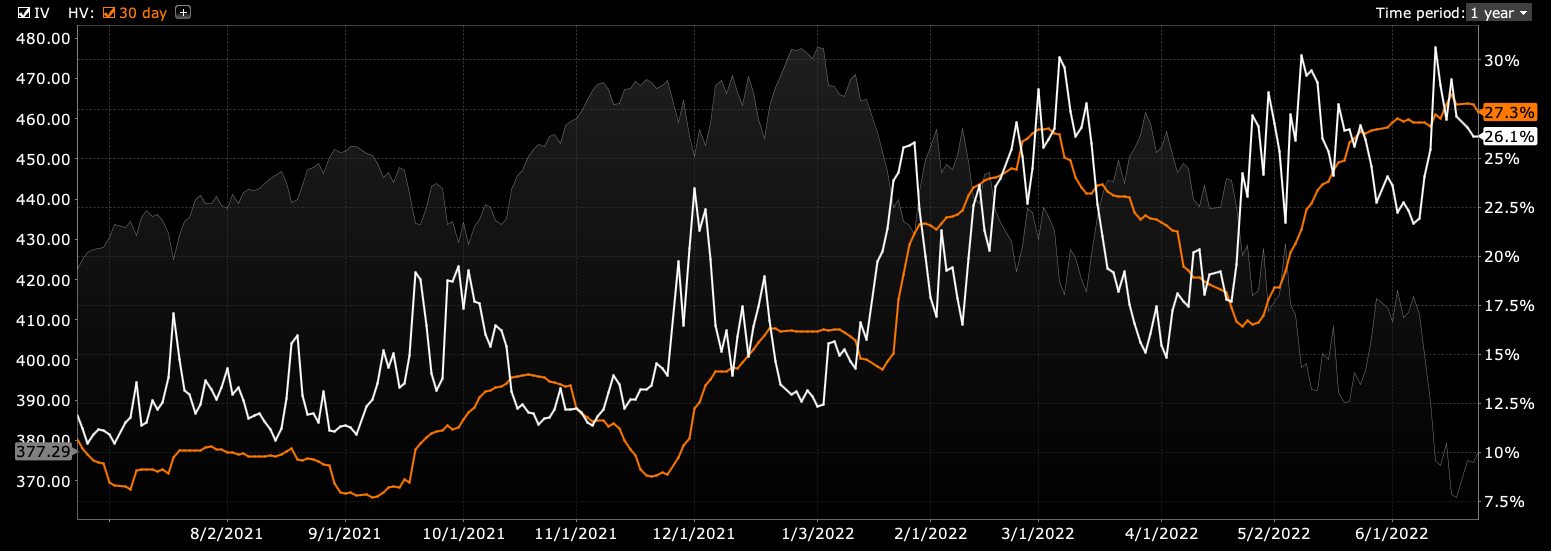
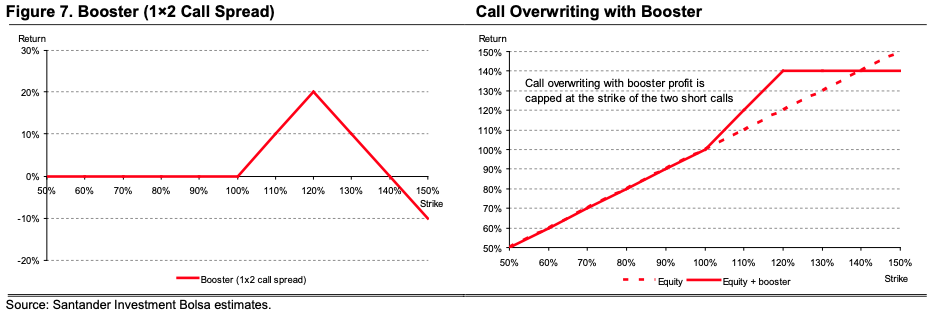
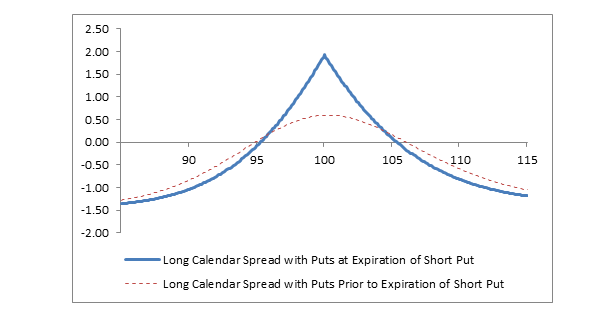
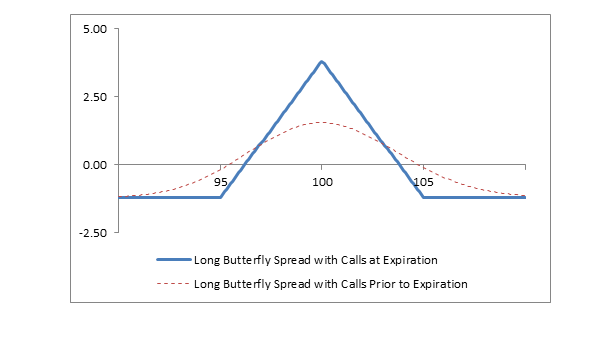
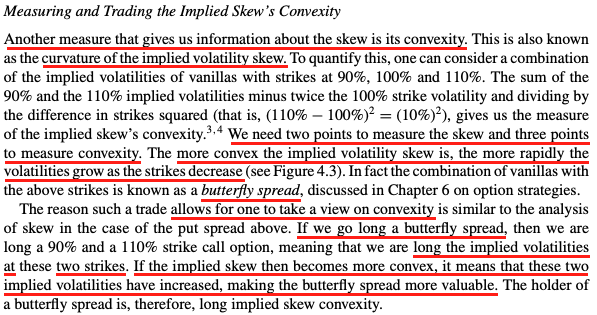
Given where realized (RVOL) and implied (IVOL) volatility measures are, as well as skew, it is beneficial to be a buyer of complex options structures (e.g., put back spread).
The reason why?
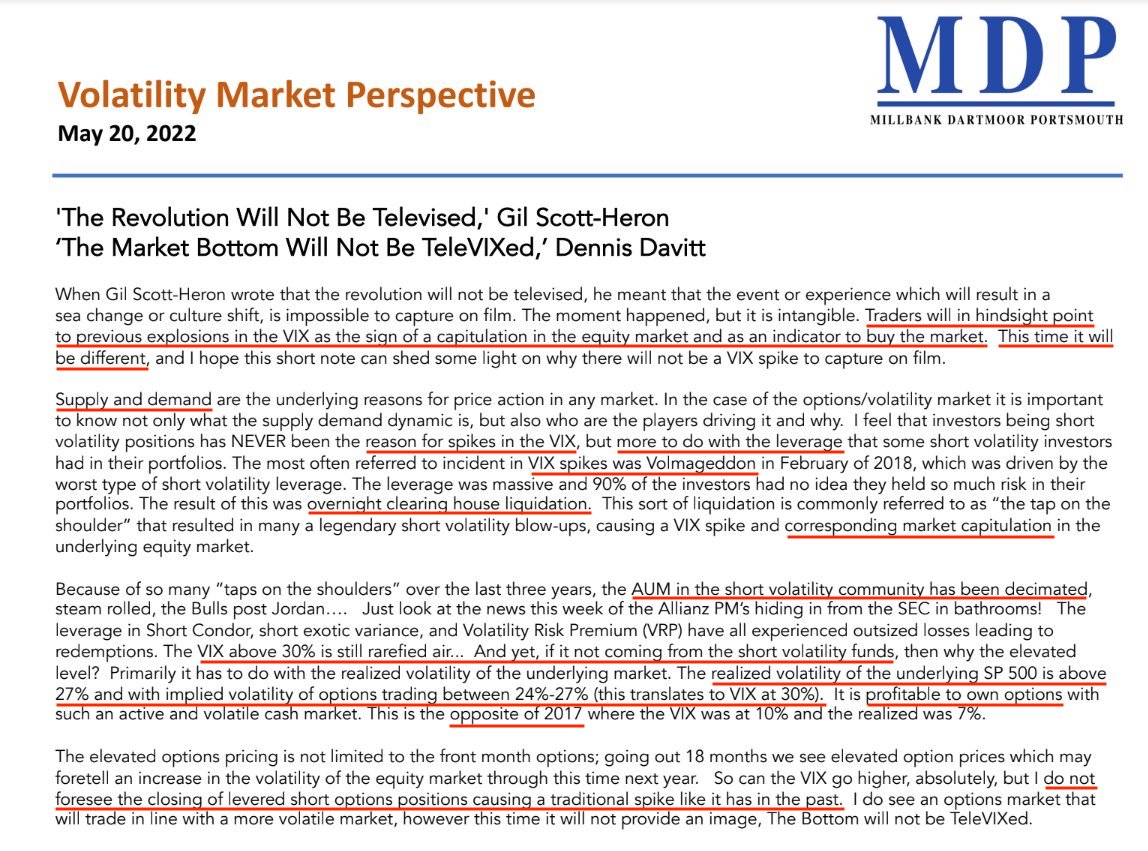
Well, as discussed in-depth Tuesday, prevailing policy narratives are likely to bolster risk premia “everywhere else,” and that does more to support our recent positioning analyses and the case for an “untethering” in equity implied volatility (IVOL), “one of the most supportive things into the decline,” per statements by Kai Volatility’s Cem Karsan.
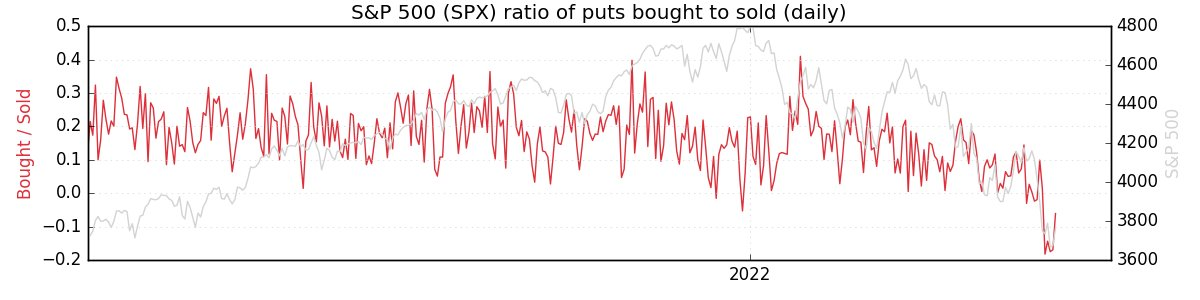
Basically, given the macro risk, IVOL is likely at a lower bound (as validated by the S&P 500 trading higher and downside skew holding a bid) and, per The Ambrus Group’s Kris Sidial, “if you wanted to go out and hedge, the opportunity is still there in the equity space.”
Through downside protection (e.g., butterfly and back spreads) you can position yourself to monetize on the sort-of non-linear repricing in volatility we’re alluding there is potential for. The bid in skew is helping those structures maintain their value better, essentially.
Technical
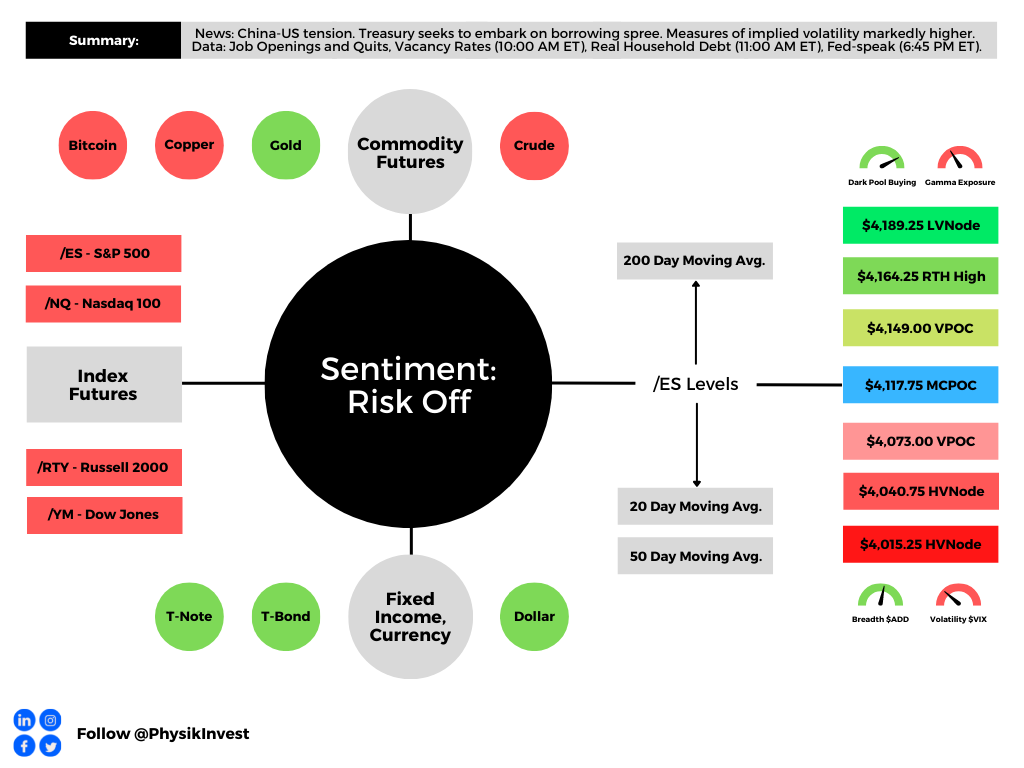
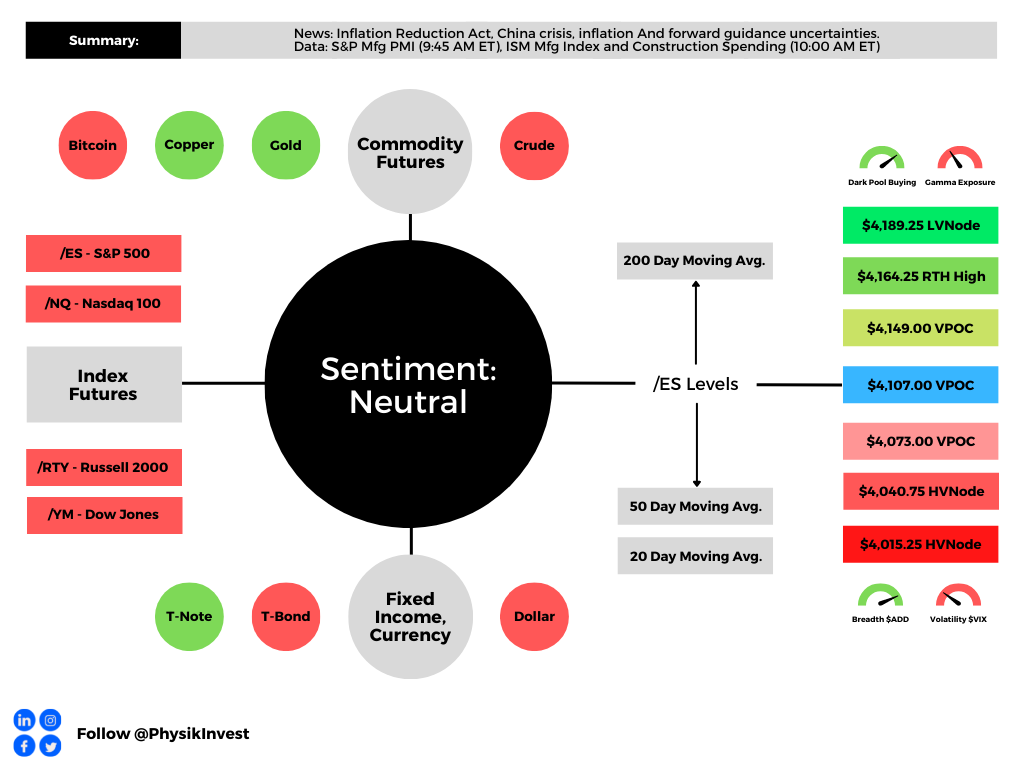
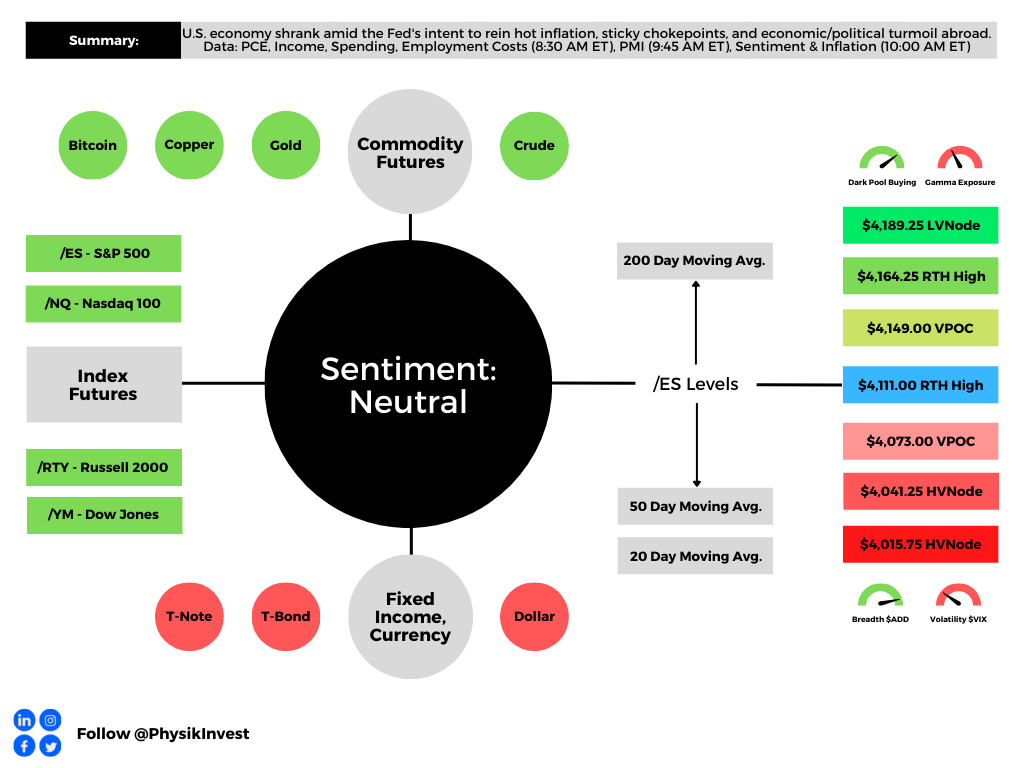
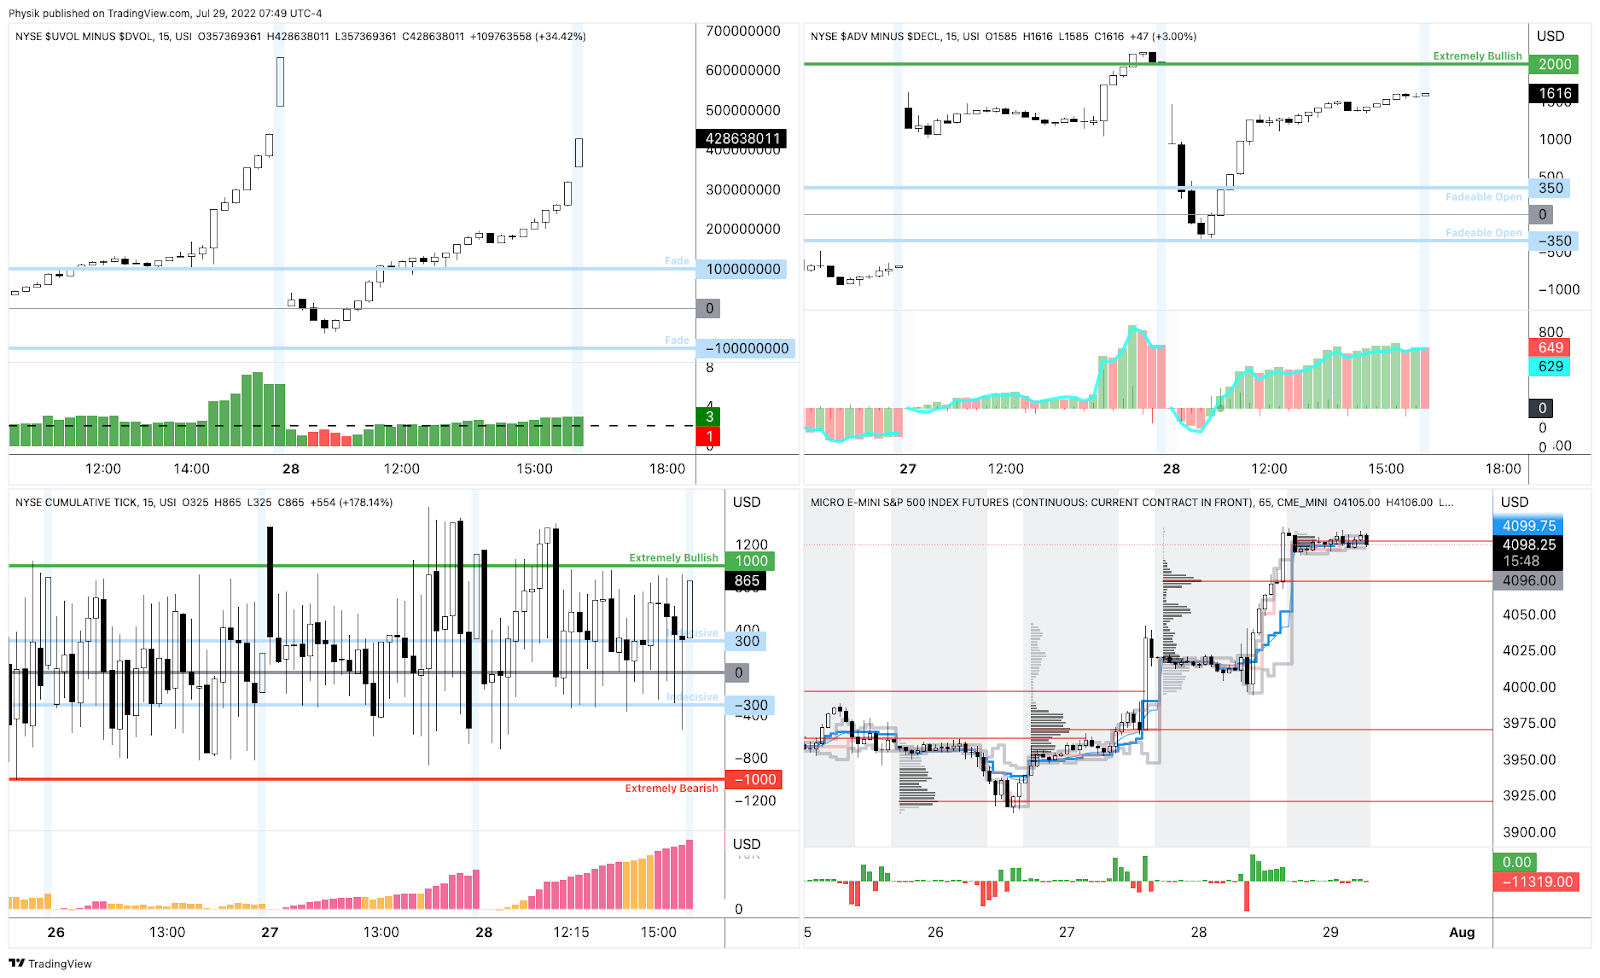
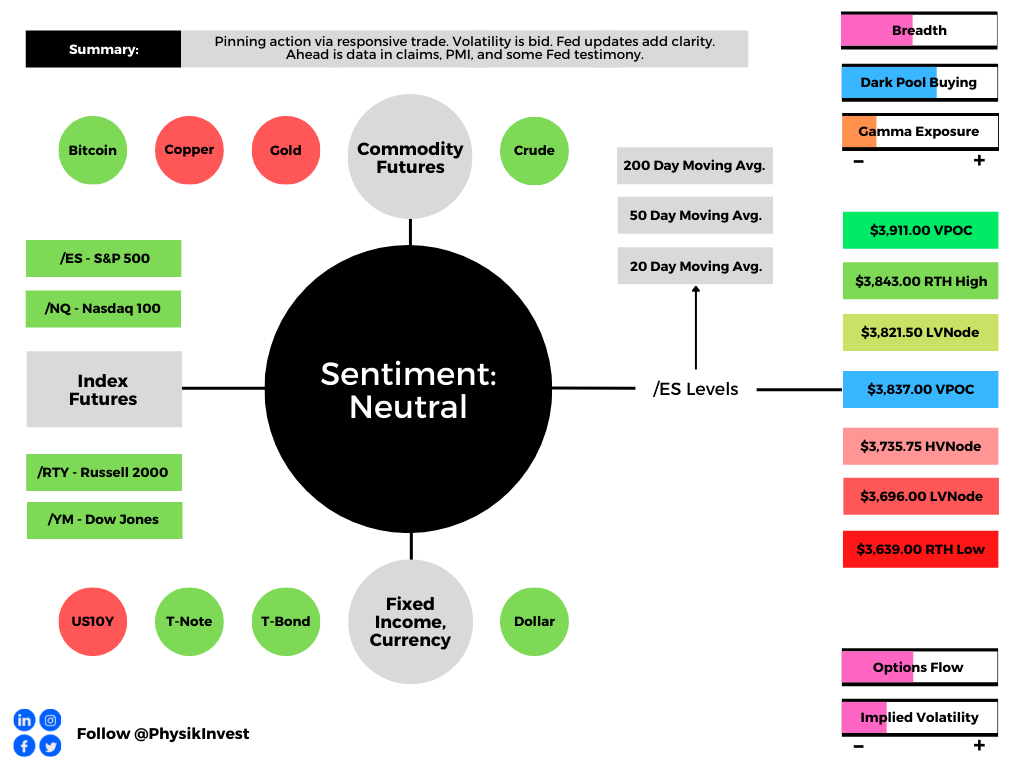
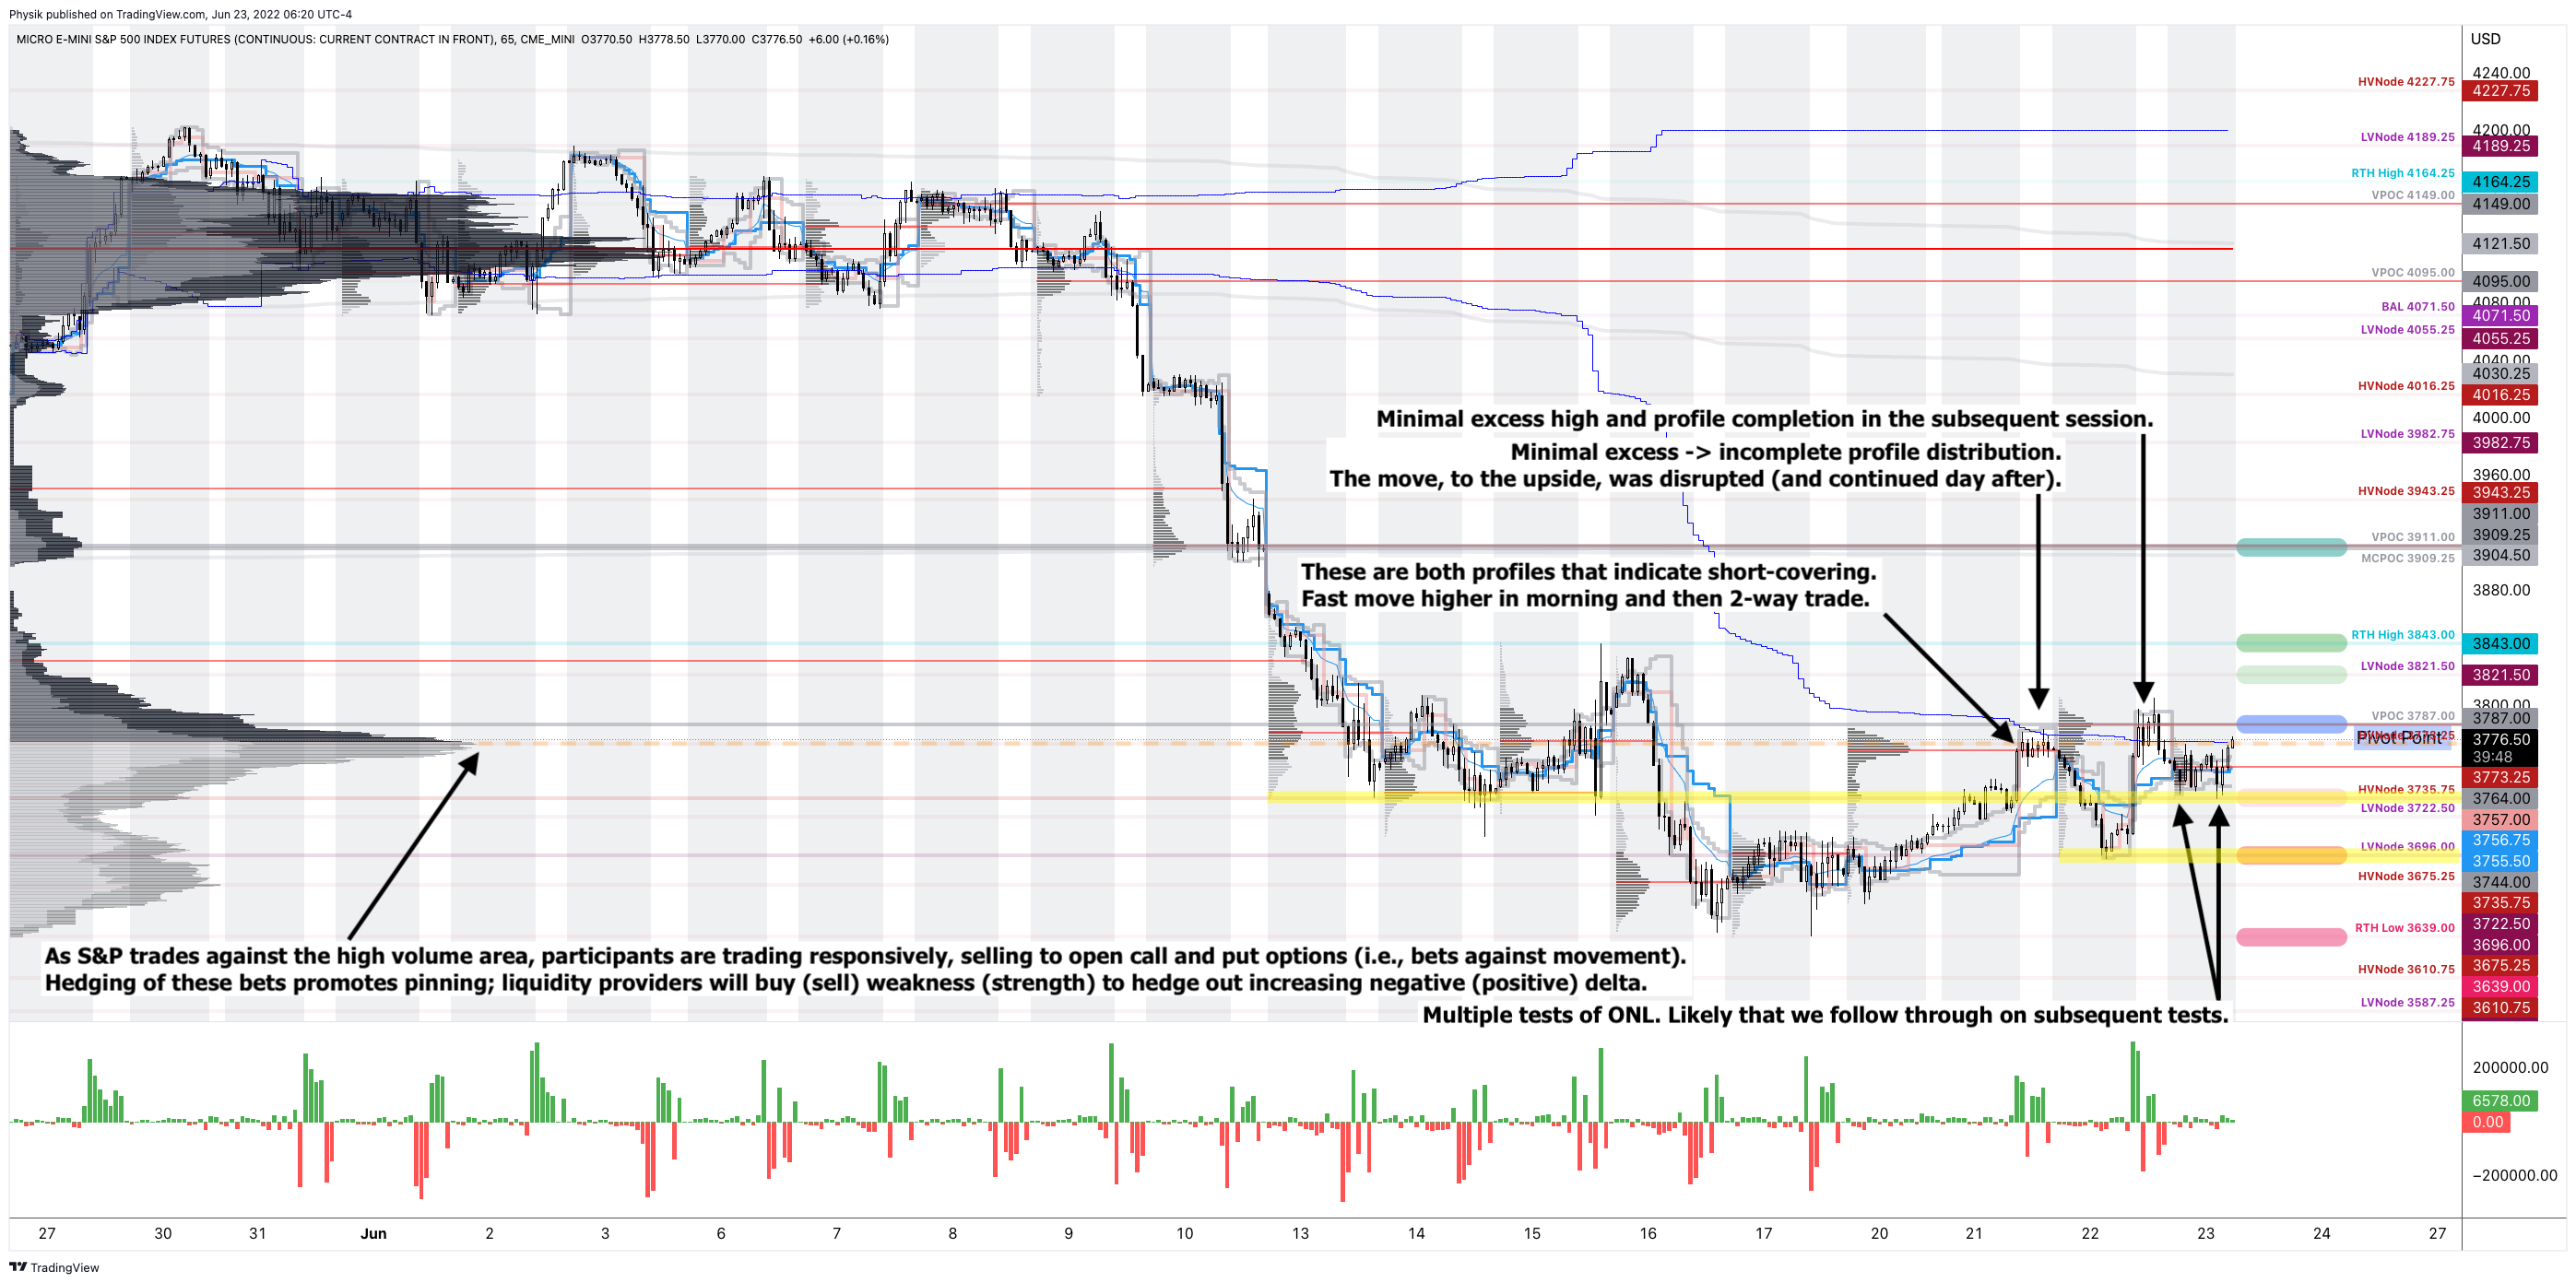
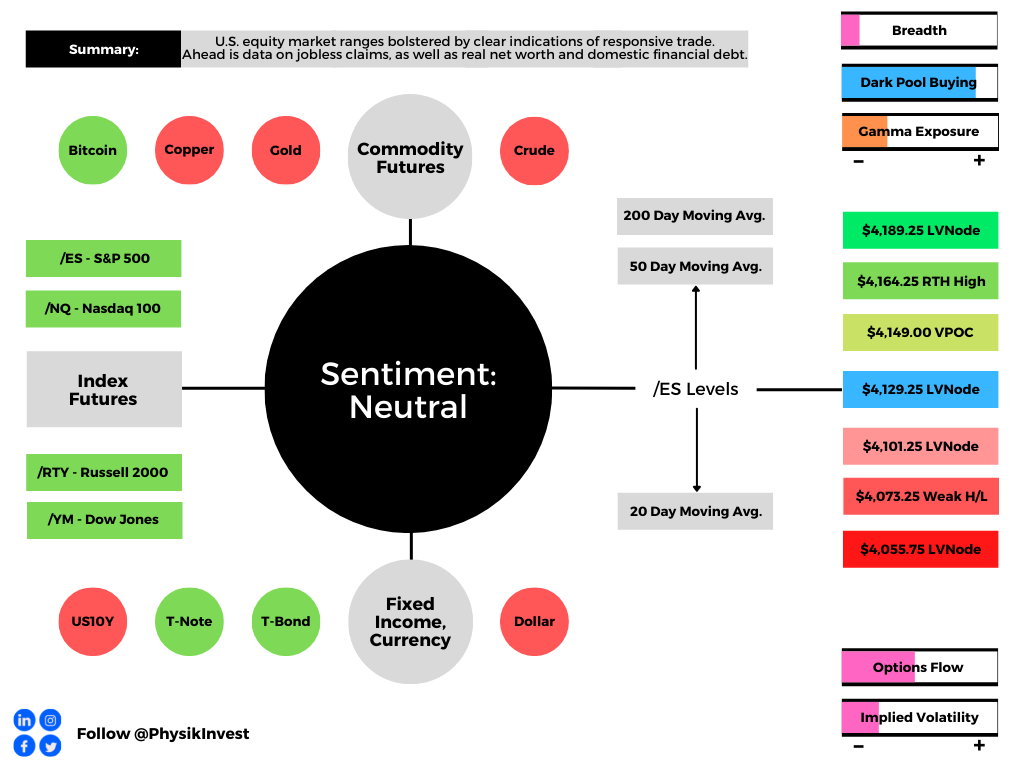
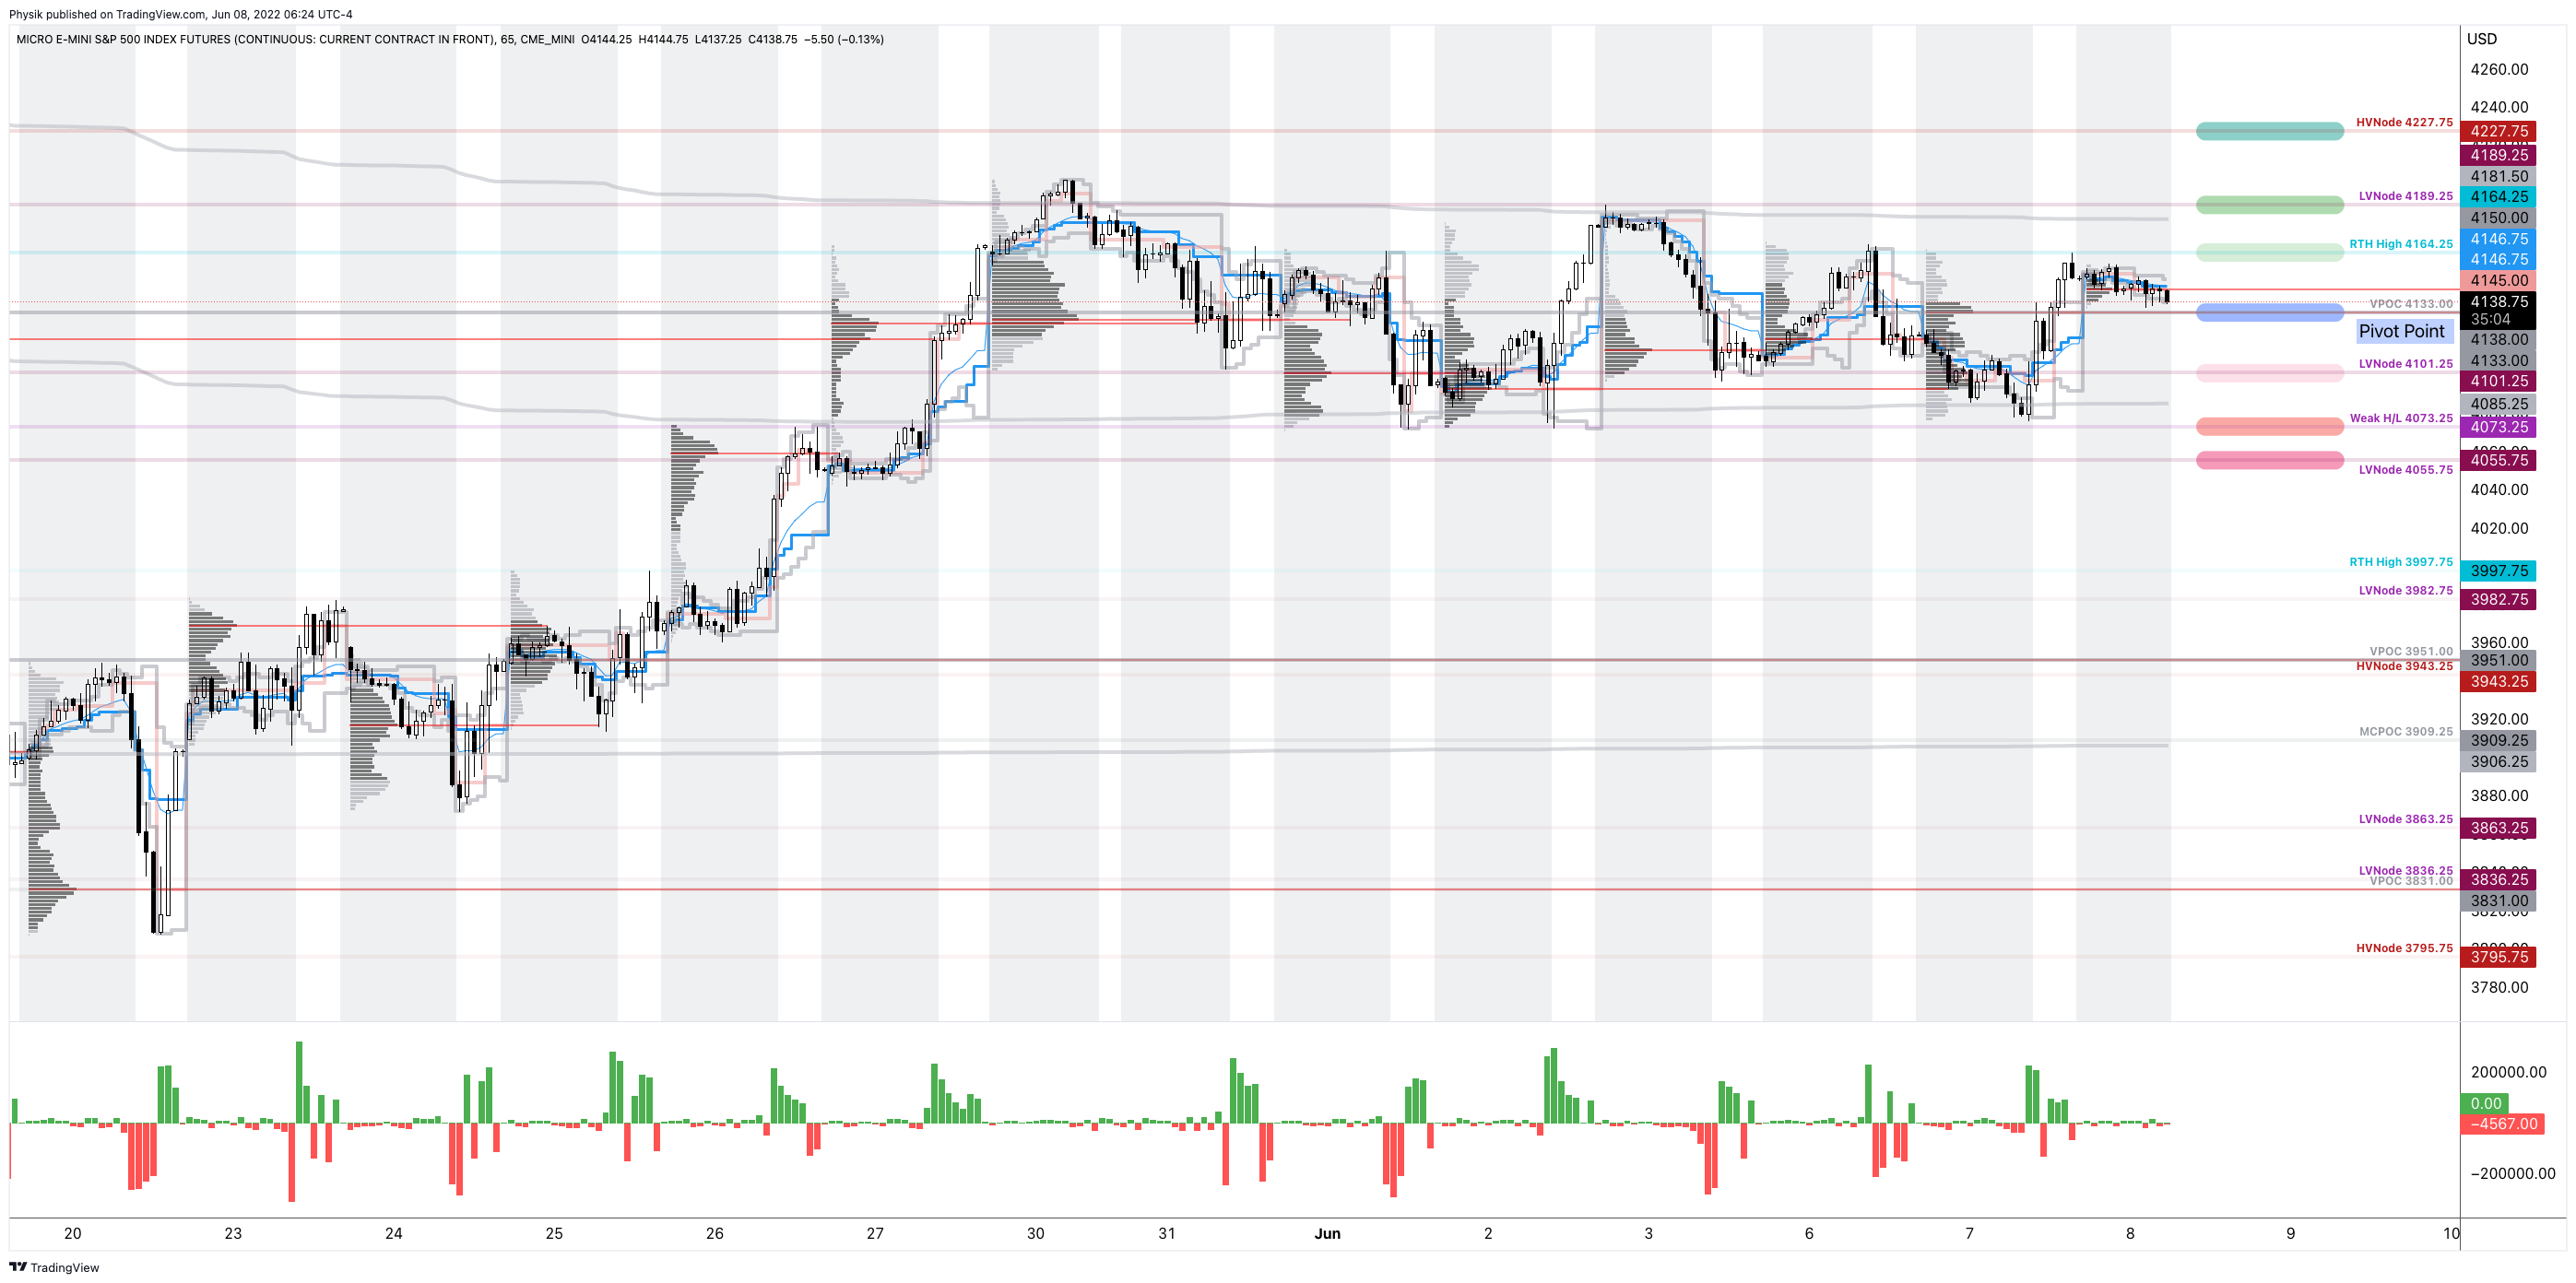
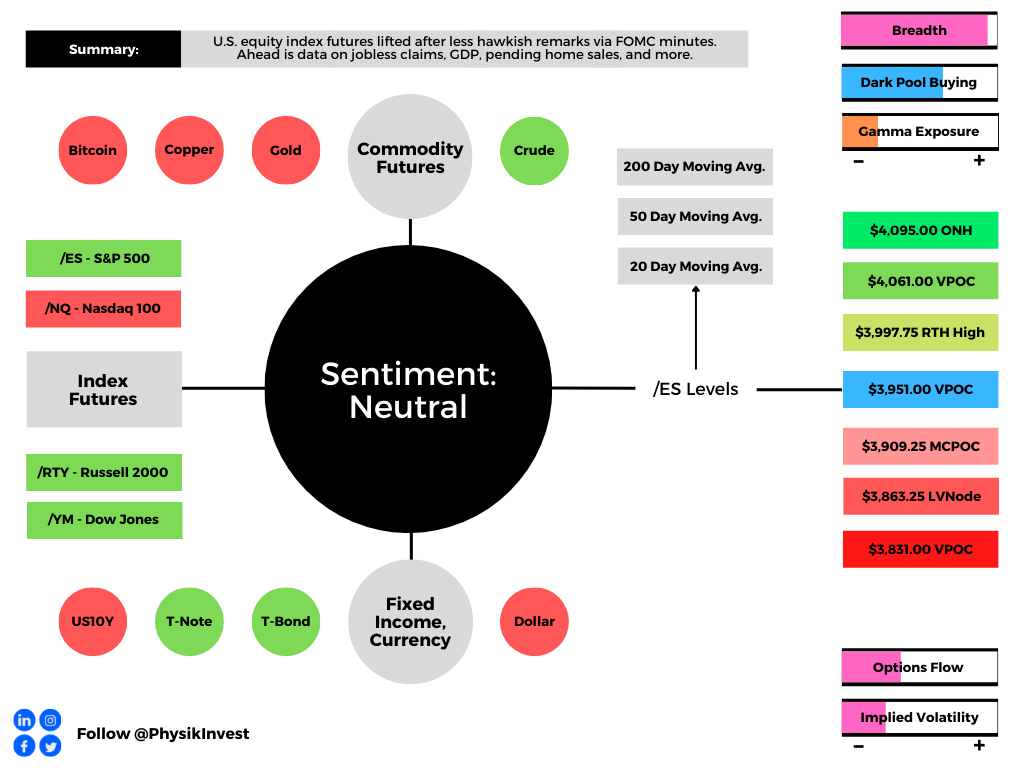
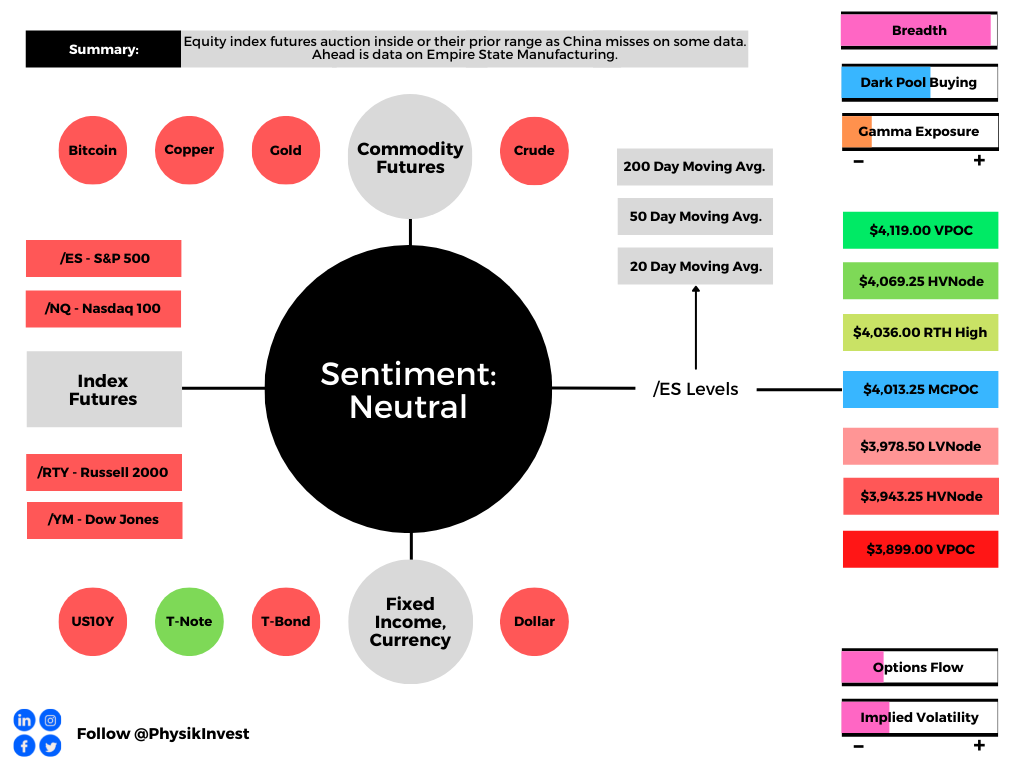
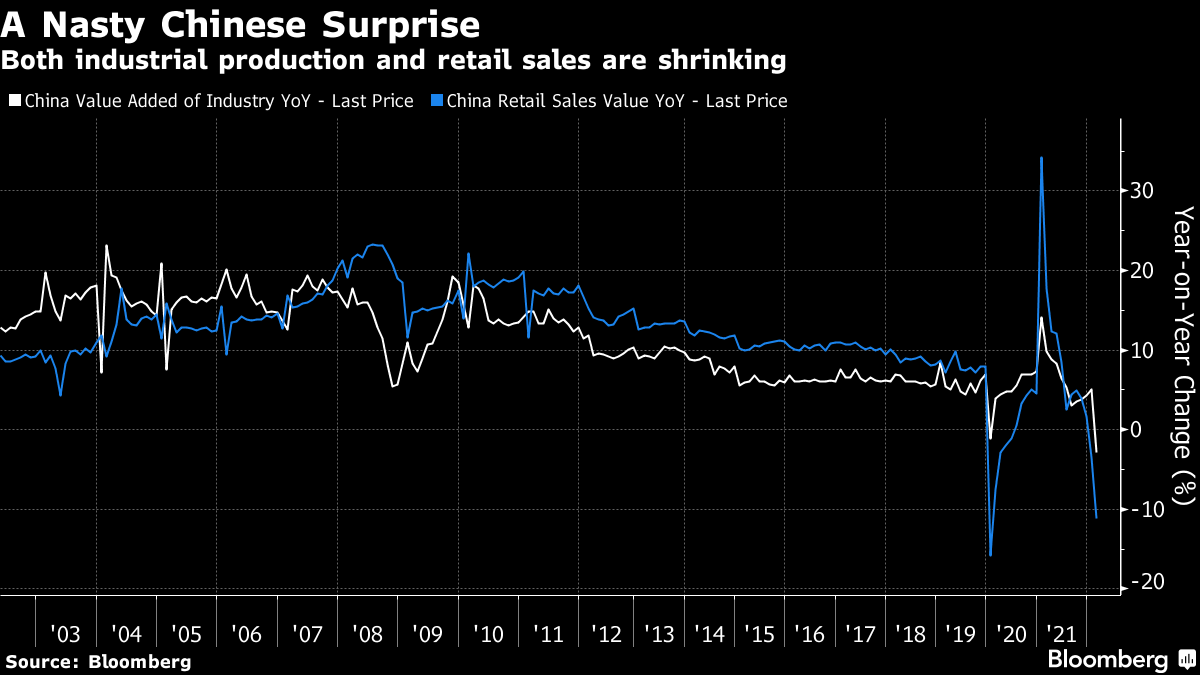
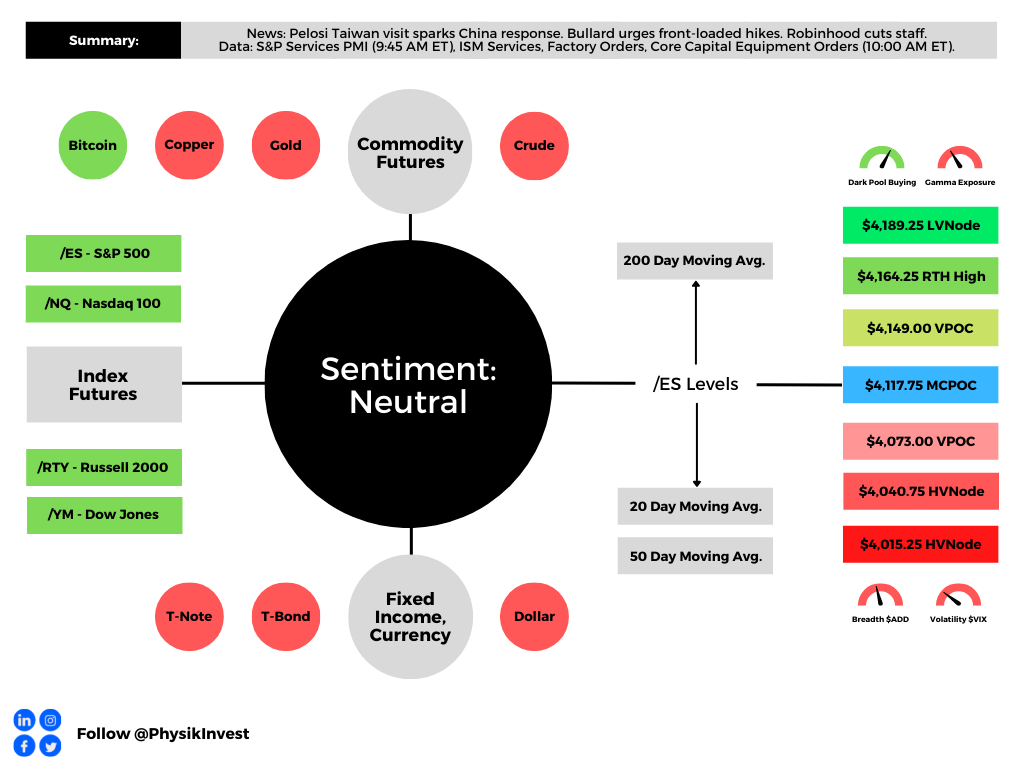
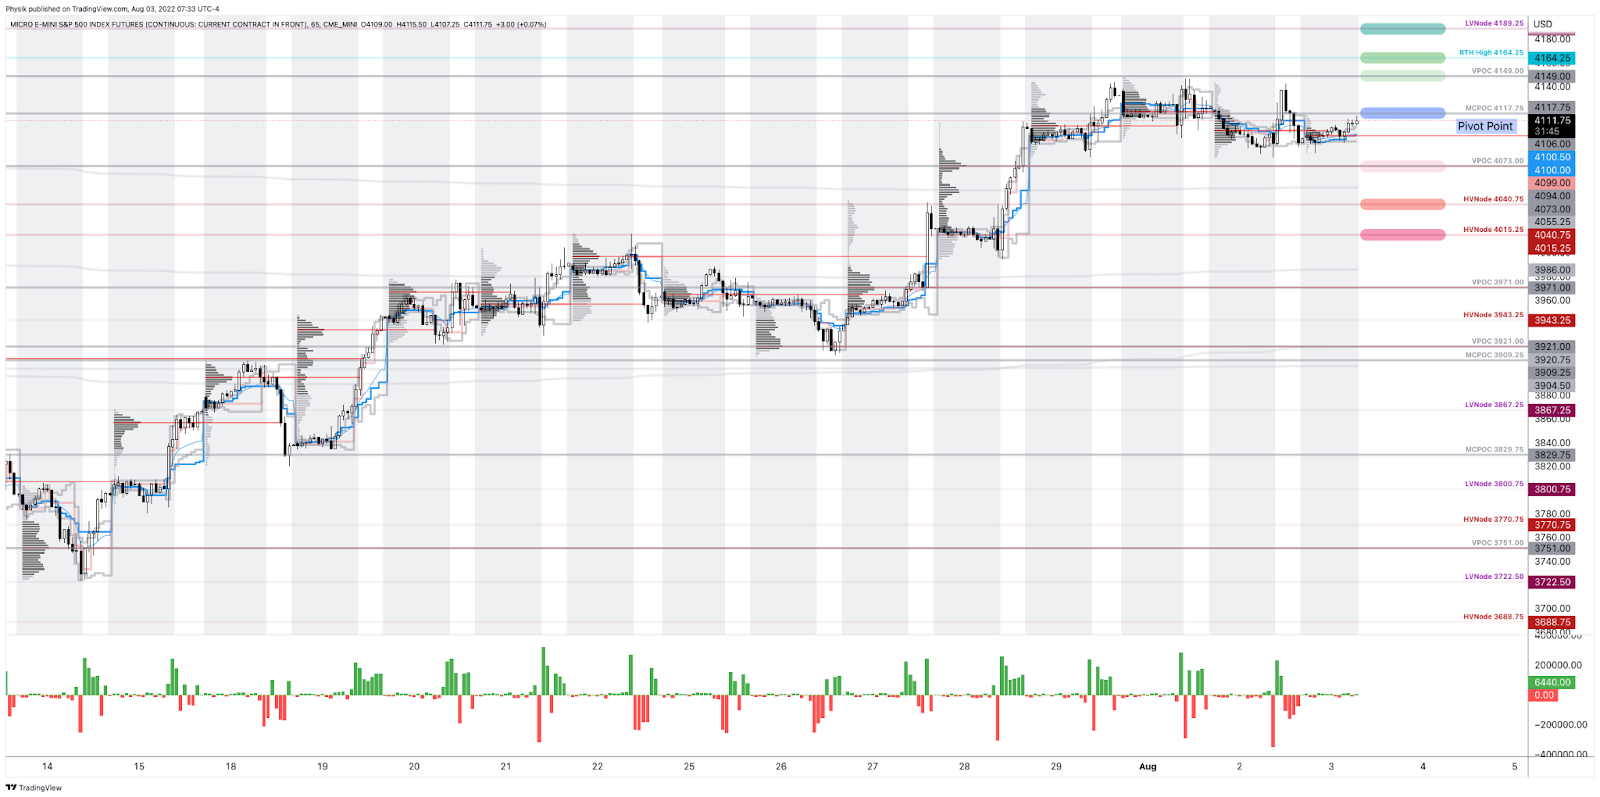
As of 6:30 AM ET, Tuesday’s regular session (9:30 AM – 4:00 PM ET), in the S&P 500, is likely to open in the upper part of a positively skewed overnight inventory, inside of prior-range and -value, suggesting a limited potential for immediate directional opportunity.
In the best case, the S&P 500 trades higher.
Any activity above the $4,117.75 MCPOC puts into play the $4,149.00 VPOC. Initiative trade beyond the VPOC could reach as high as the $4,164.25 RTH High and $4,189.25 LVNode, or higher.
In the worst case, the S&P 500 trades lower.
Any activity below the $4,117.75 MCPOC puts into play the $4,073.00 VPOC. Initiative trade beyond the VPOC could reach as low as the $4,040.75 and $4,015.25 HVNodes, or lower.
Click here to load today’s key levels into the web-based TradingView charting platform. Note that all levels are derived using the 65-minute timeframe. New links are produced, daily.
Definitions
Volume Areas: A structurally sound market will build on areas of high volume (HVNodes). Should the market trend for long periods of time, it will lack sound structure, identified as low volume areas (LVNodes). LVNodes denote directional conviction and ought to offer support on any test.
If participants were to auction and find acceptance into areas of prior low volume (LVNodes), then future discovery ought to be volatile and quick as participants look to HVNodes for favorable entry or exit.
POCs: POCs are valuable as they denote areas where two-sided trade was most prevalent in a prior day session. Participants will respond to future tests of value as they offer favorable entry and exit.
MCPOCs: POCs are valuable as they denote areas where two-sided trade was most prevalent over numerous day sessions. Participants will respond to future tests of value as they offer favorable entry and exit.
Volume-Weighted Average Prices (VWAPs): A metric highly regarded by chief investment officers, among other participants, for quality of trade. Additionally, liquidity algorithms are benchmarked and programmed to buy and sell around VWAPs.
About
After years of self-education, strategy development, mentorship, and trial-and-error, Renato Leonard Capelj began trading full-time and founded Physik Invest to detail his methods, research, and performance in the markets.
Capelj also develops insights around impactful options market dynamics at SpotGamma and is a Benzinga reporter.
Some of his works include conversations with ARK Invest’s Catherine Wood, investors Kevin O’Leary and John Chambers, FTX’s Sam Bankman-Fried, ex-Bridgewater Associate Andy Constan, Kai Volatility’s Cem Karsan, The Ambrus Group’s Kris Sidial, among many others.
Disclaimer
In no way should the materials herein be construed as advice. Derivatives carry a substantial risk of loss. All content is for informational purposes only.