The daily brief is a free glimpse into the prevailing fundamental and technical drivers of U.S. equity market products. Join the 750+ that read this report daily, below!
Fundamental
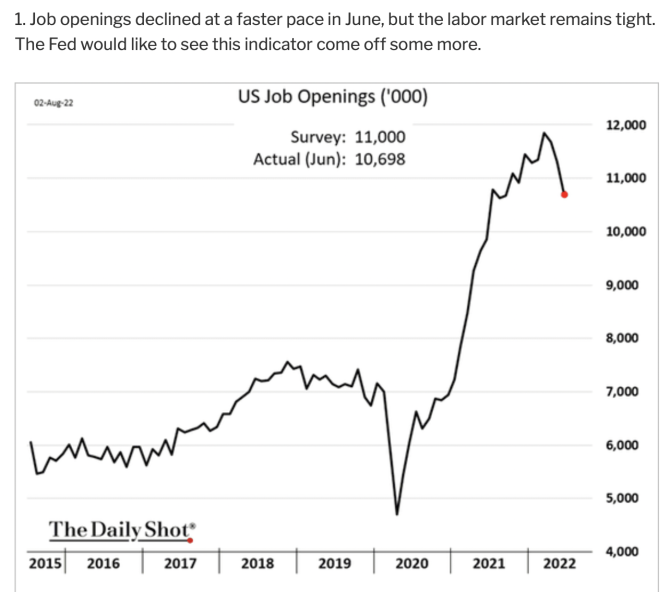
In a non-farm payroll update, it was shown that the US added more than two times the jobs many economists thought it would.
“Some of this is driven by a reduced participation rate – a smaller portion of the population seeking work and showing up in unemployment data,” Bloomberg’s John Authers explained.
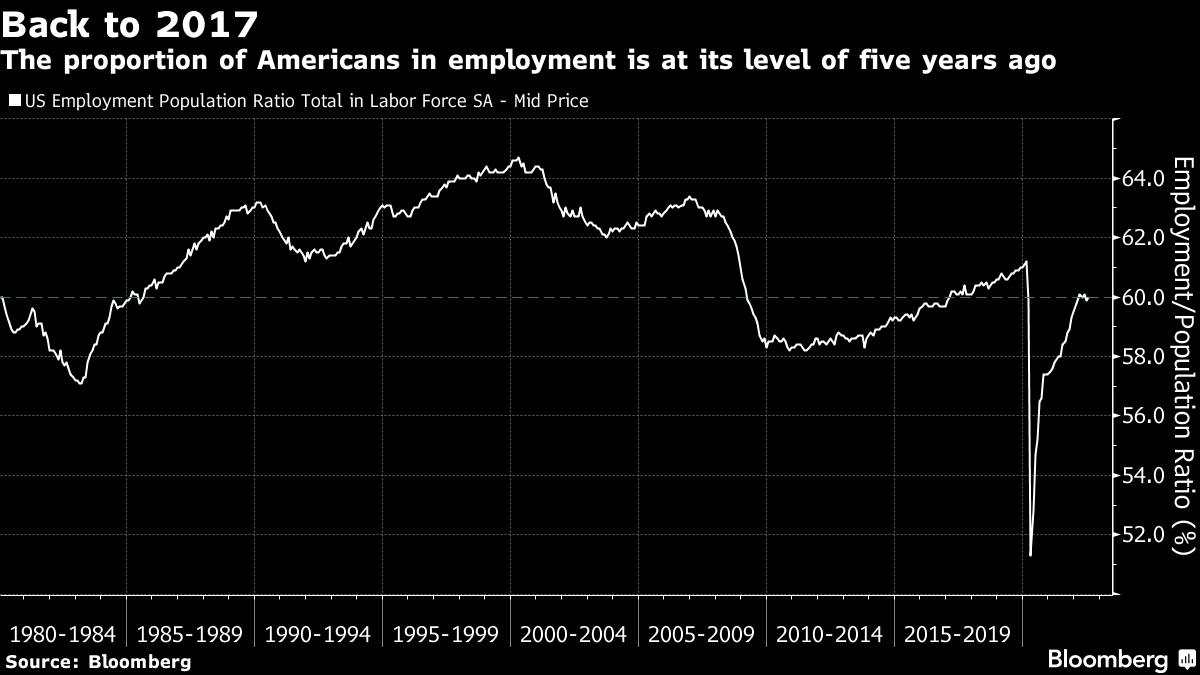
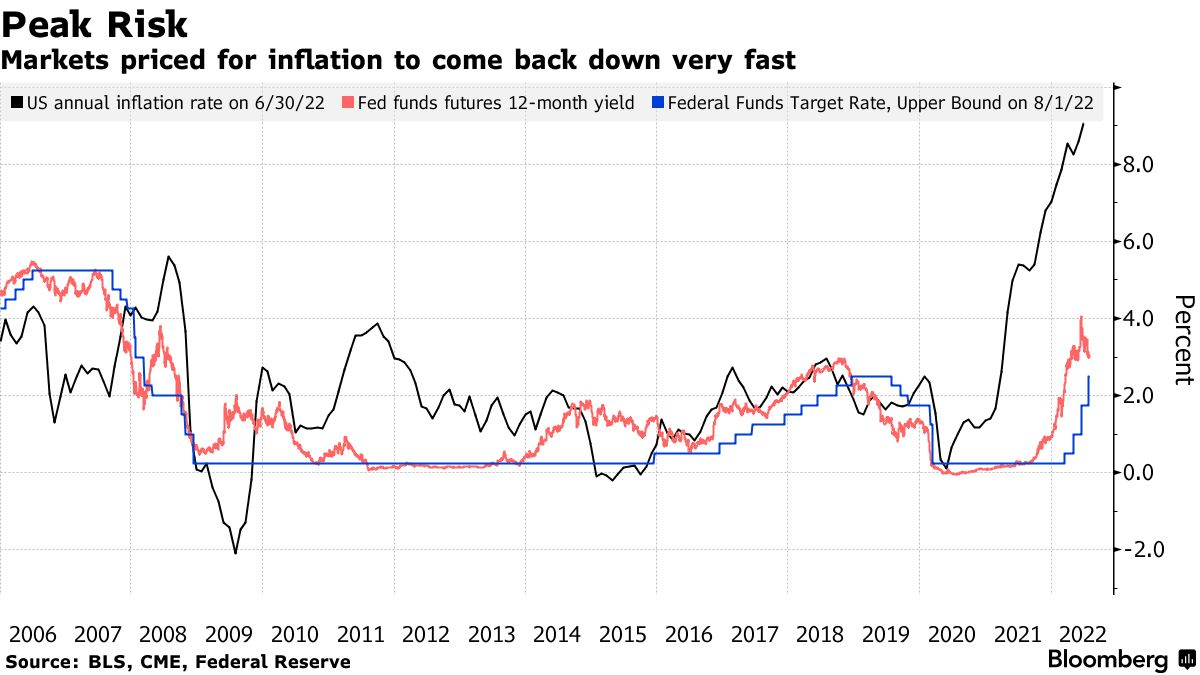
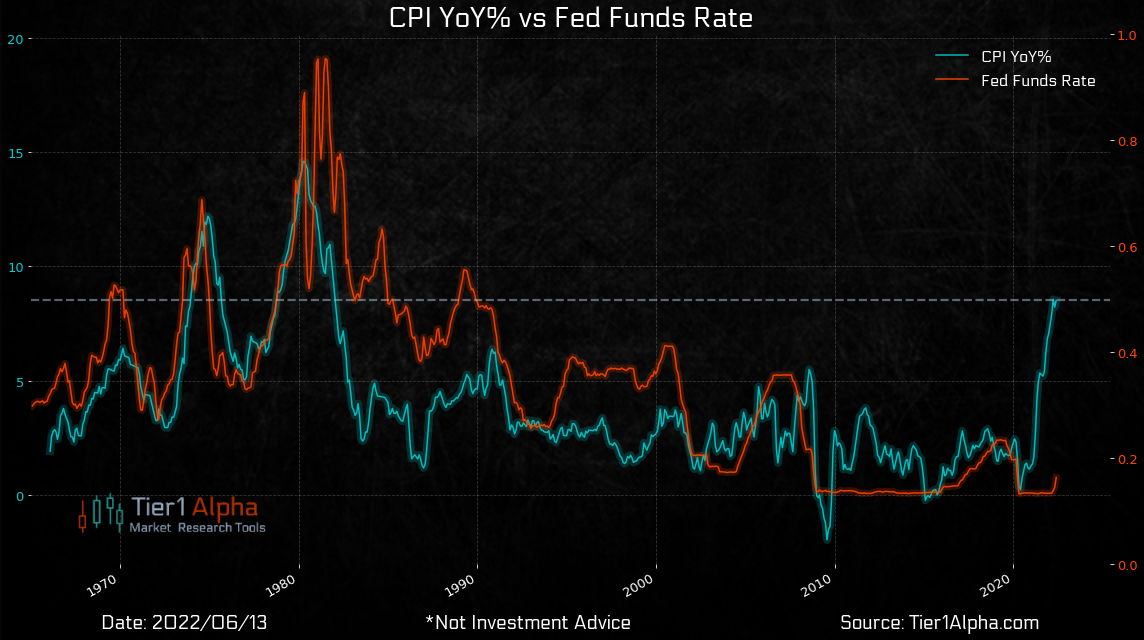
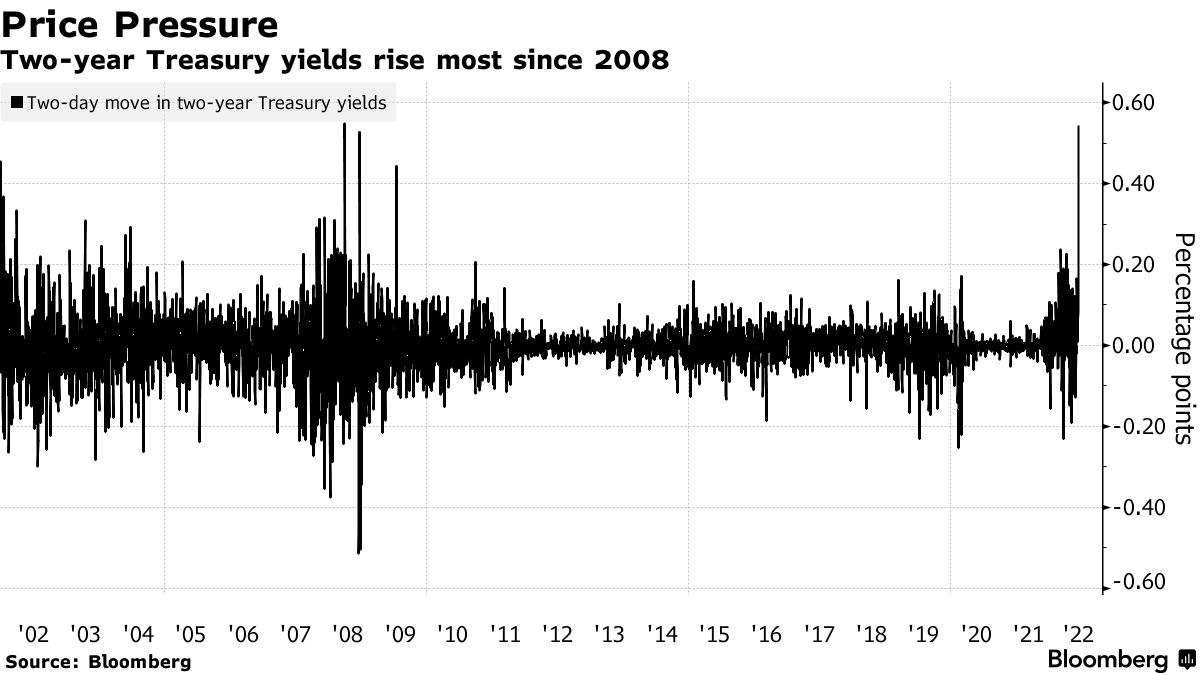
“It now becomes much easier for the Federal Reserve (Fed) to [continue] rais[ing] rates. If the employment market is still strengthening, while inflation remains its highest in decades, it’s hard to see why it shouldn’t.”
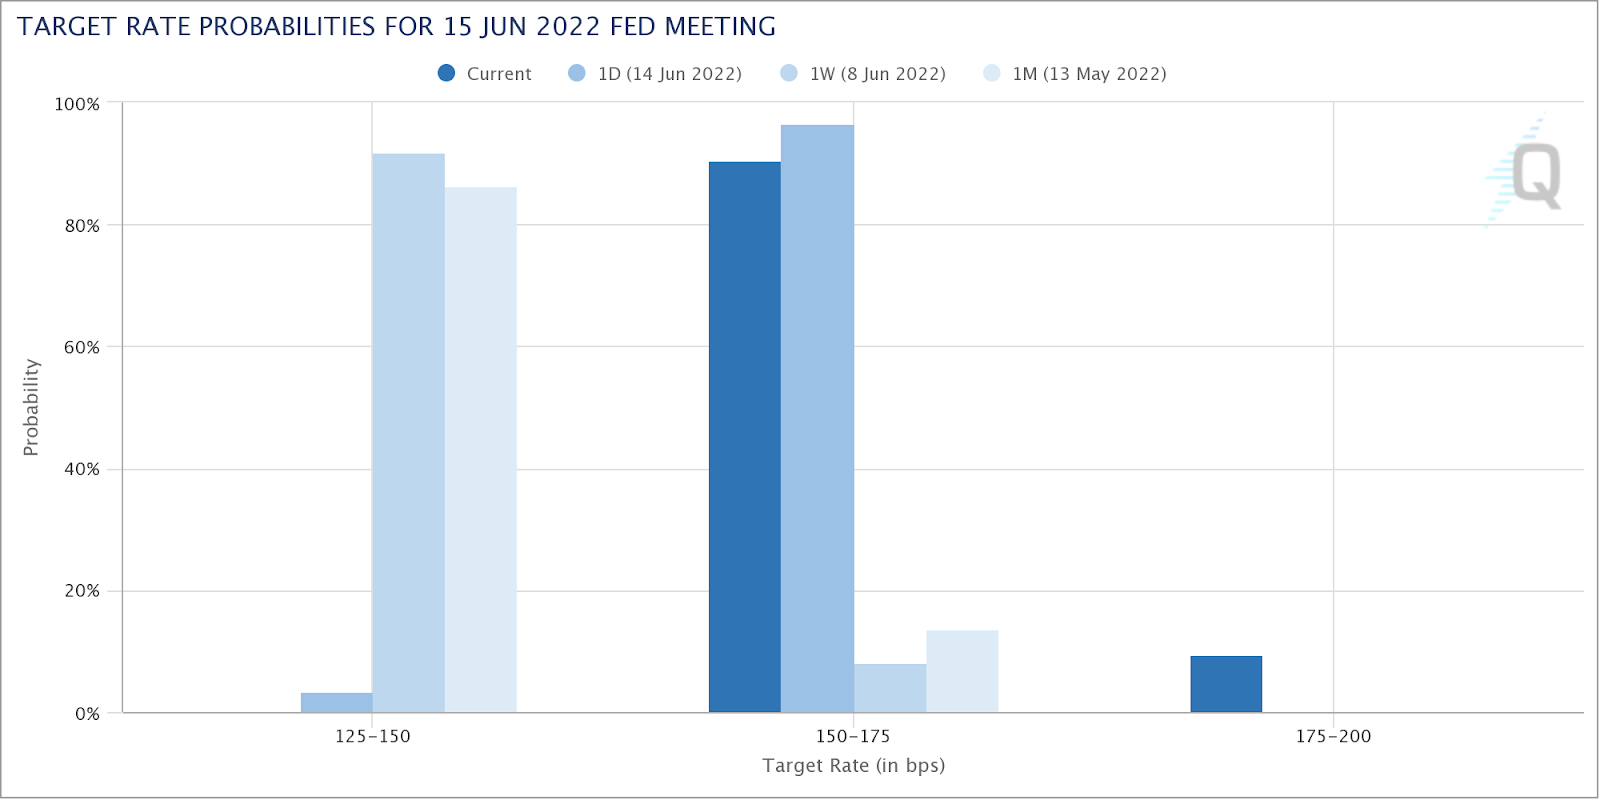
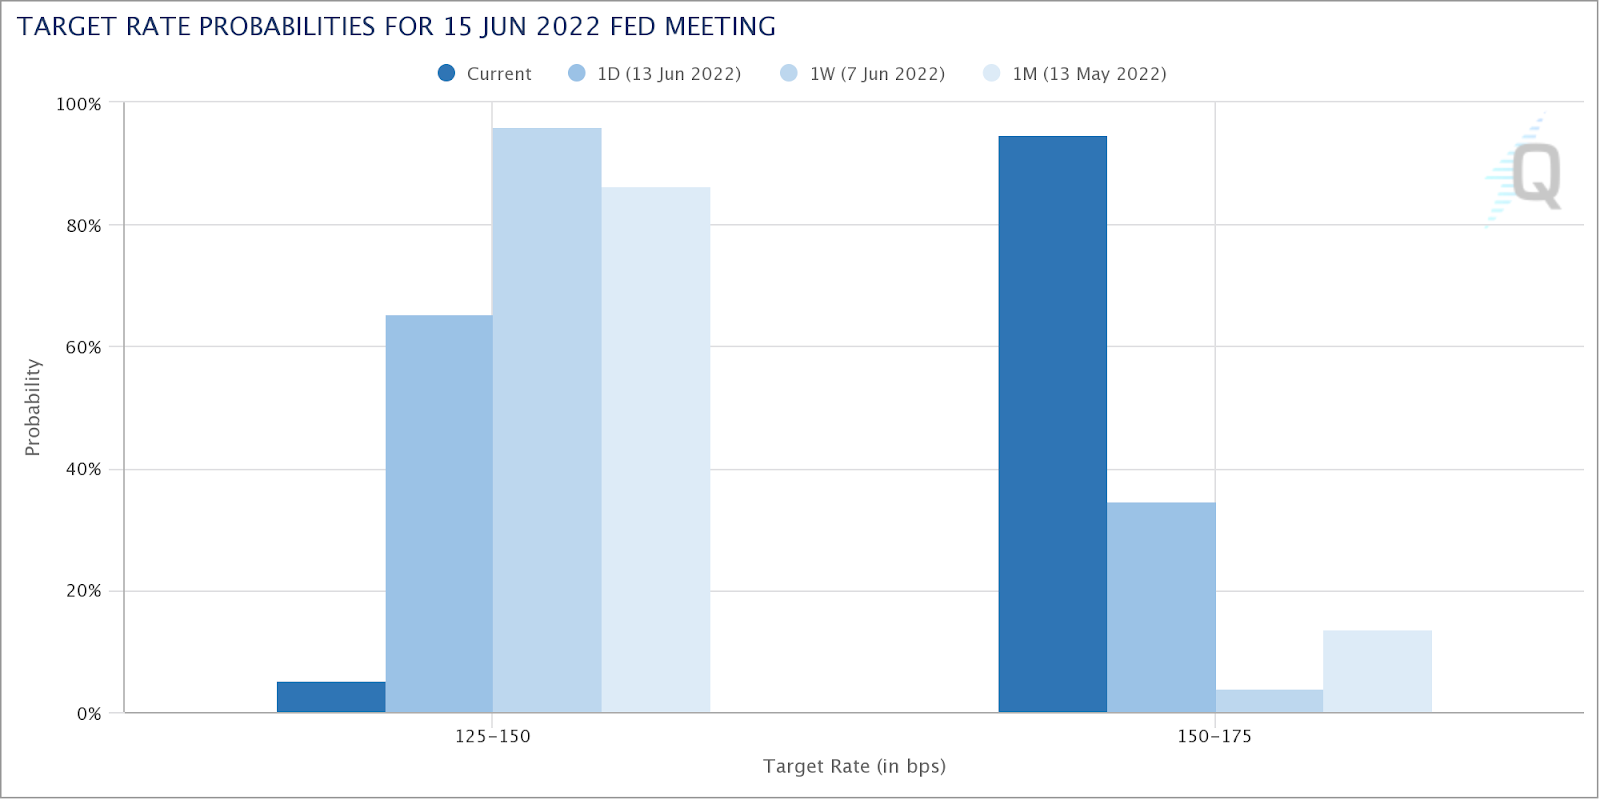
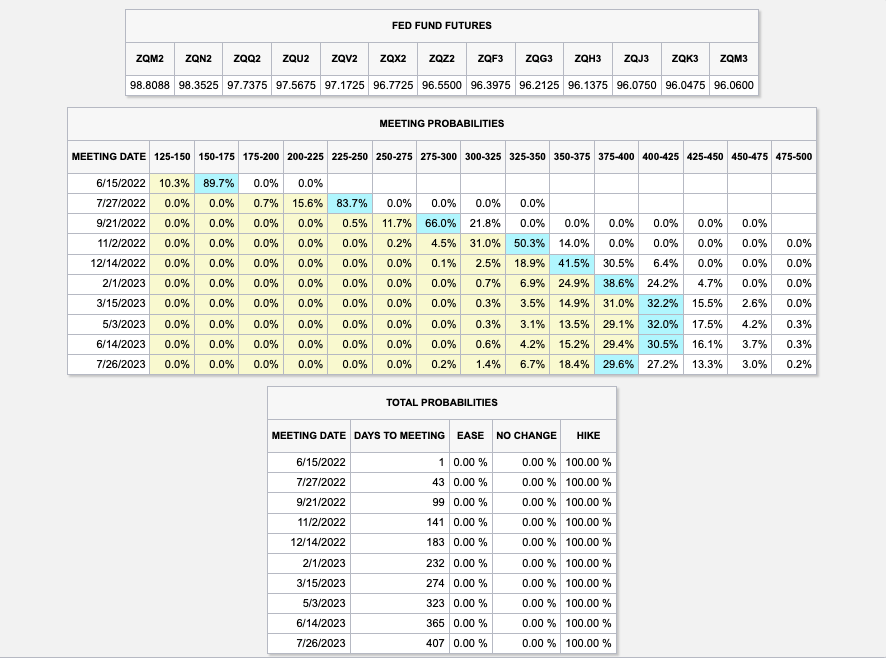
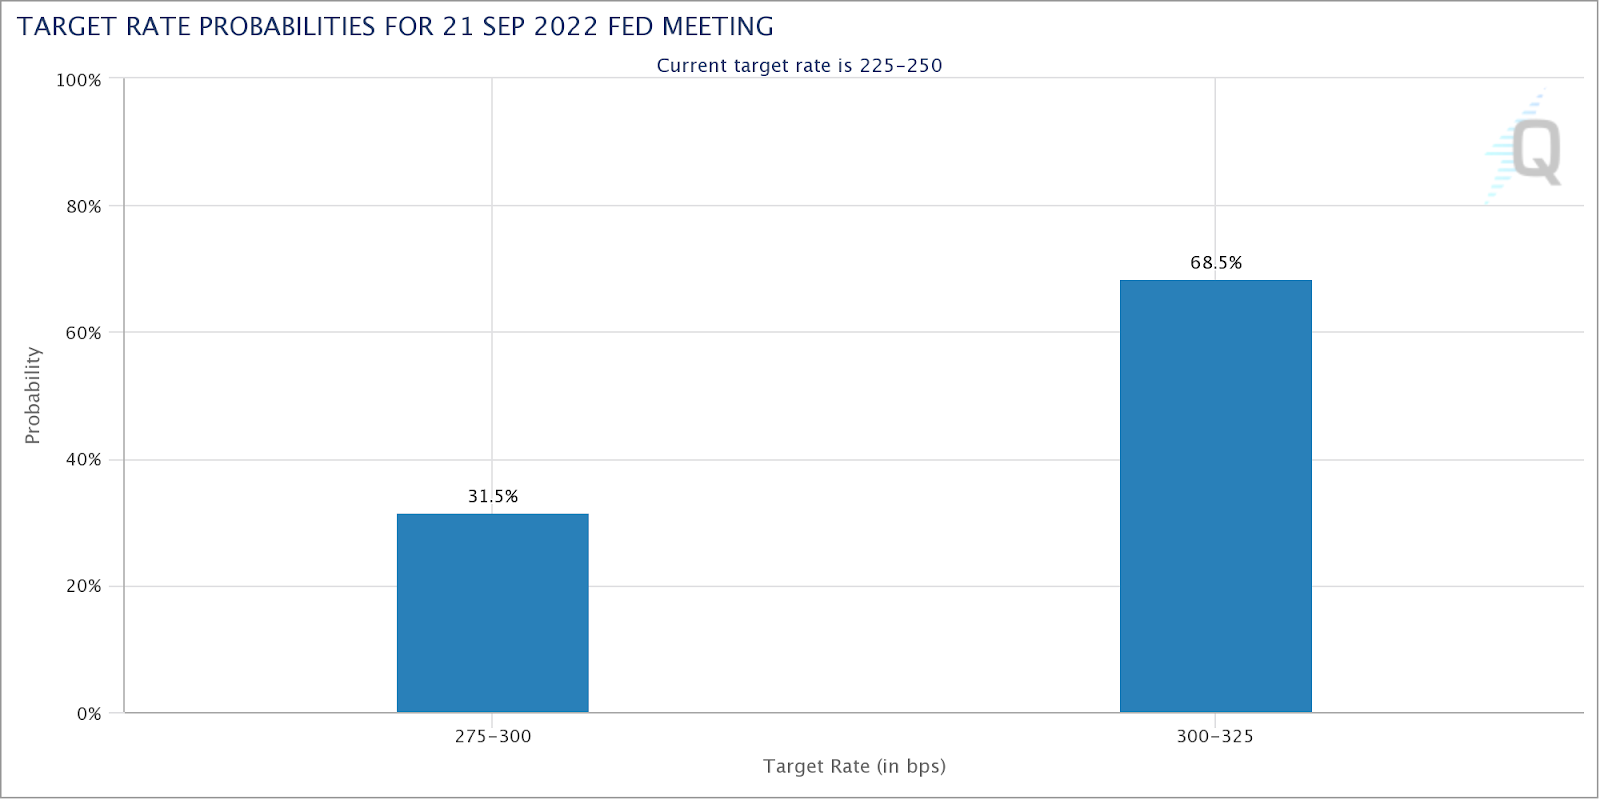
Accordingly, market participants are pricing a greater than 50% chance of the target Fed Funds rate increasing by 75 to 100 basis points to a target range of 300 and 325 basis points, up from 225 and 250 right now.
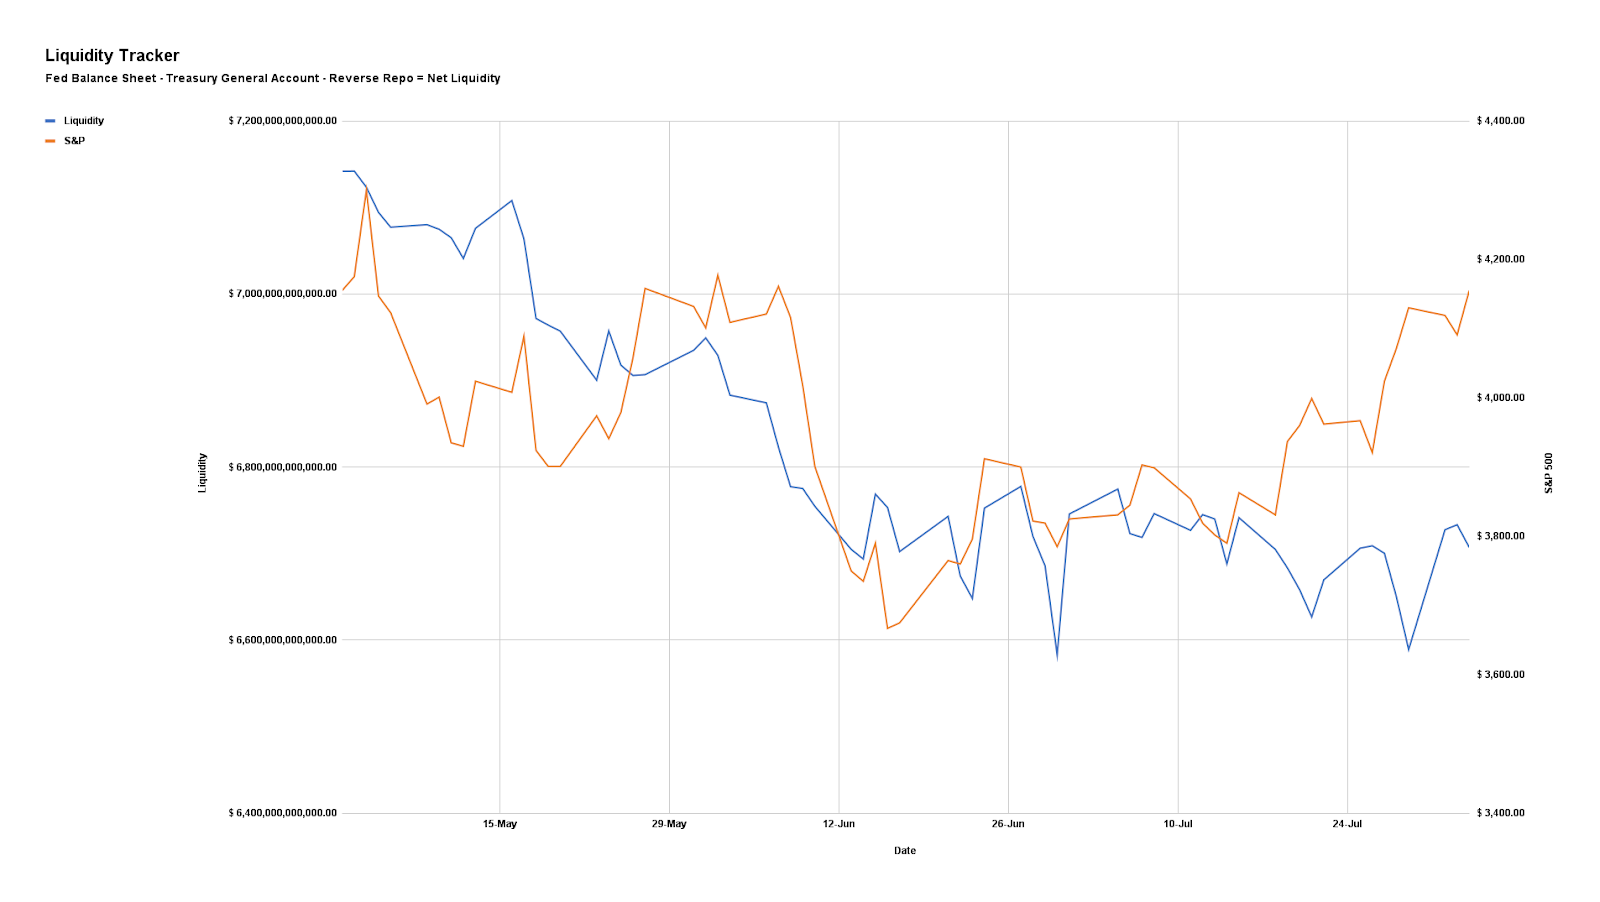
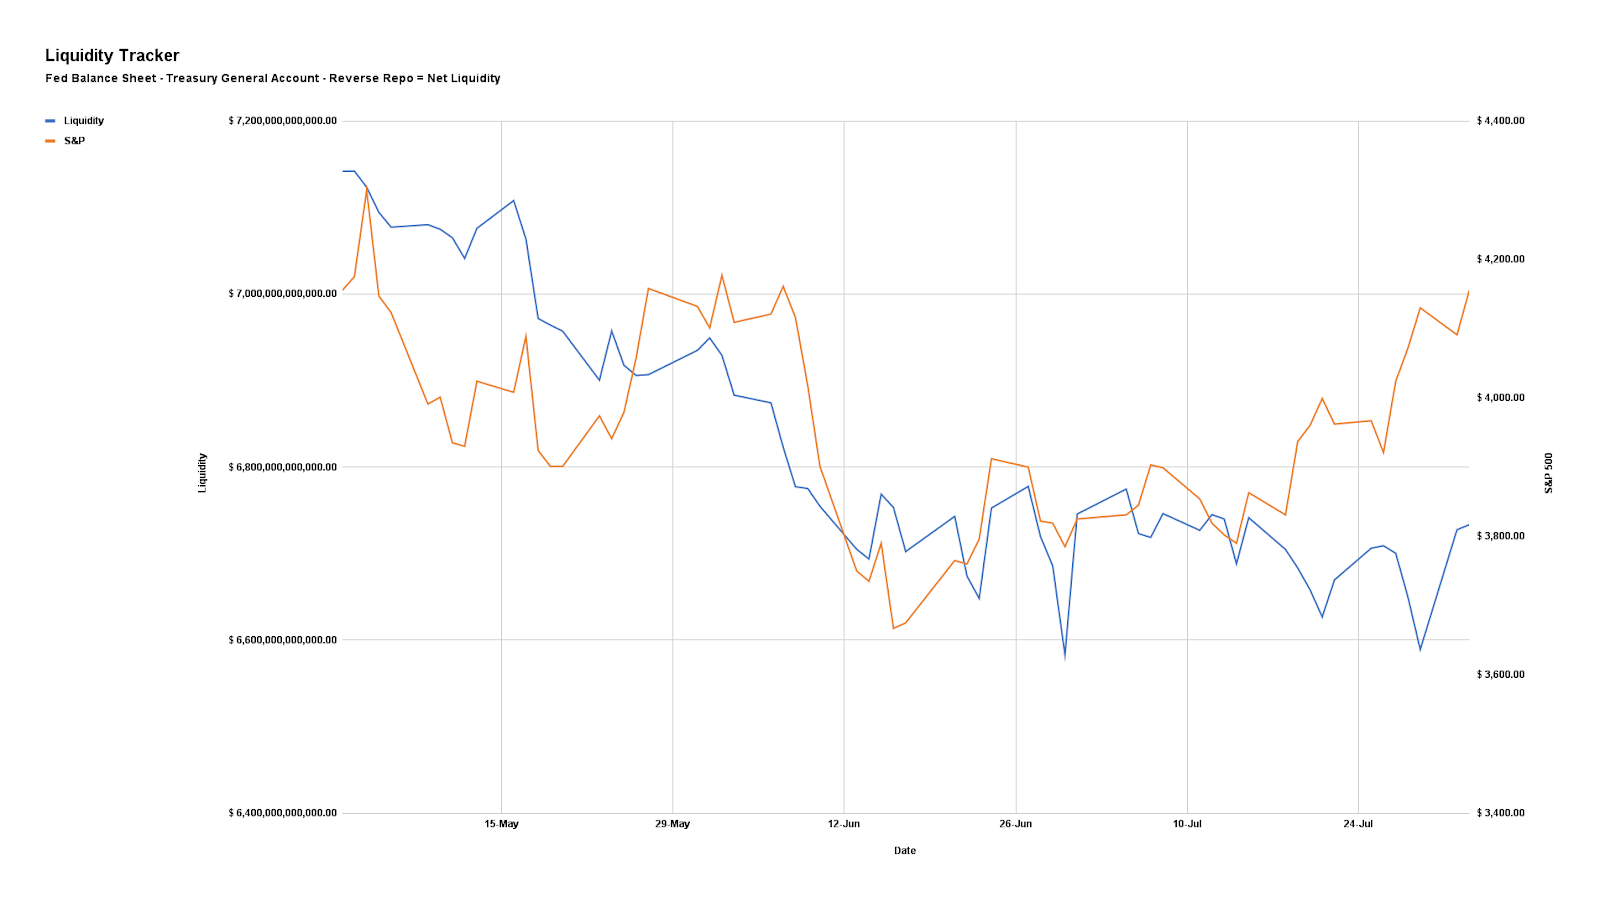
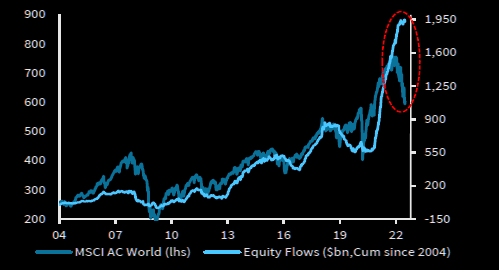
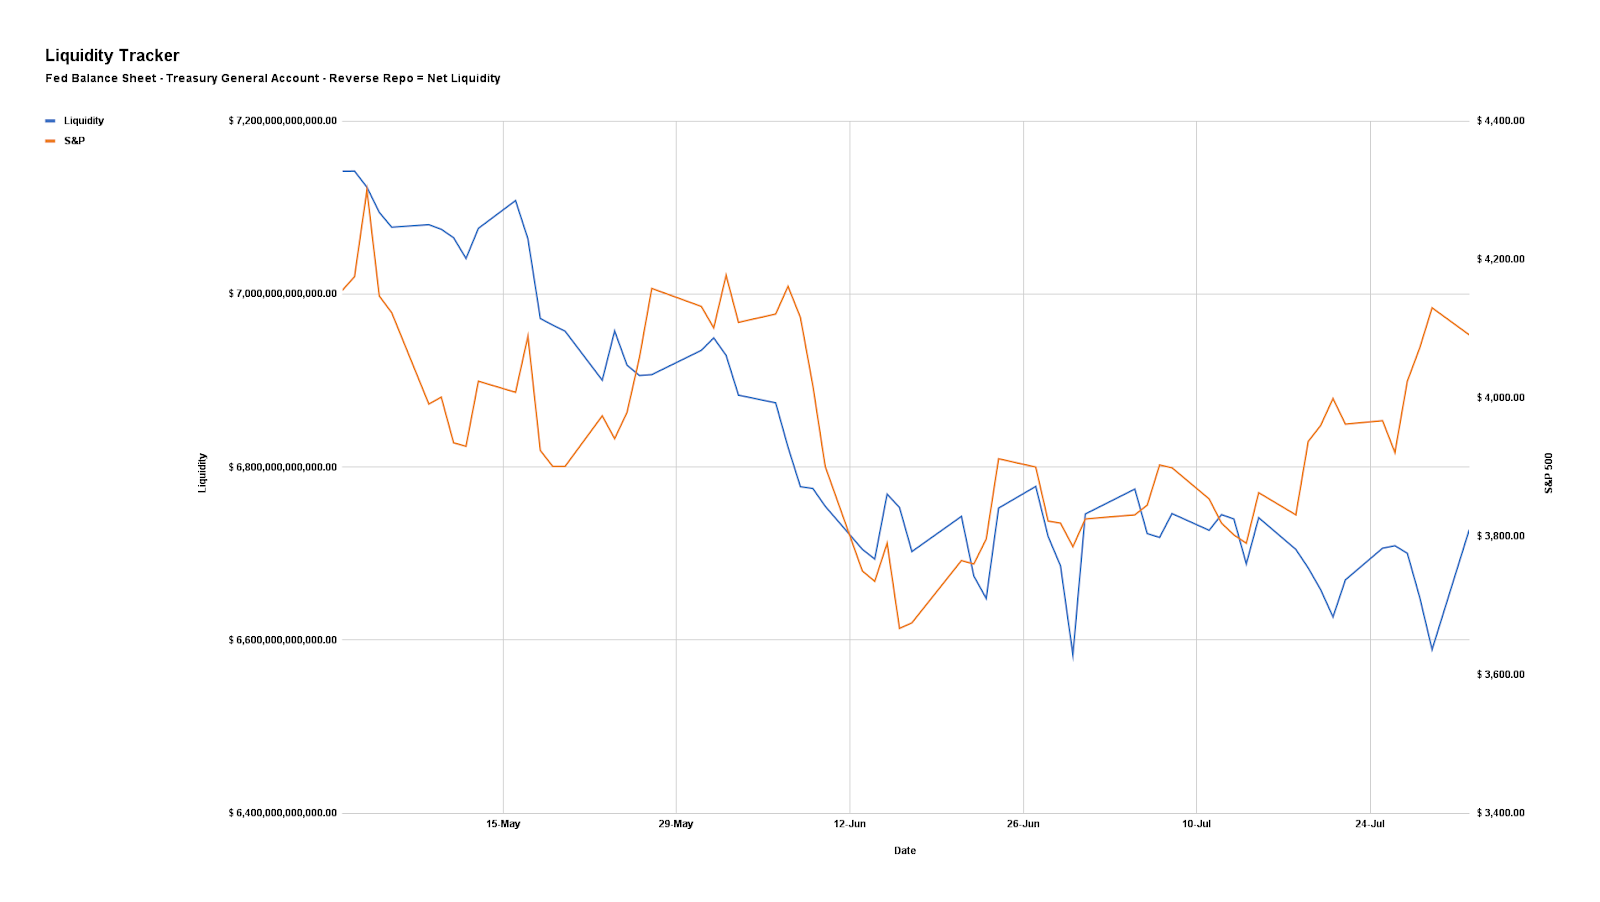
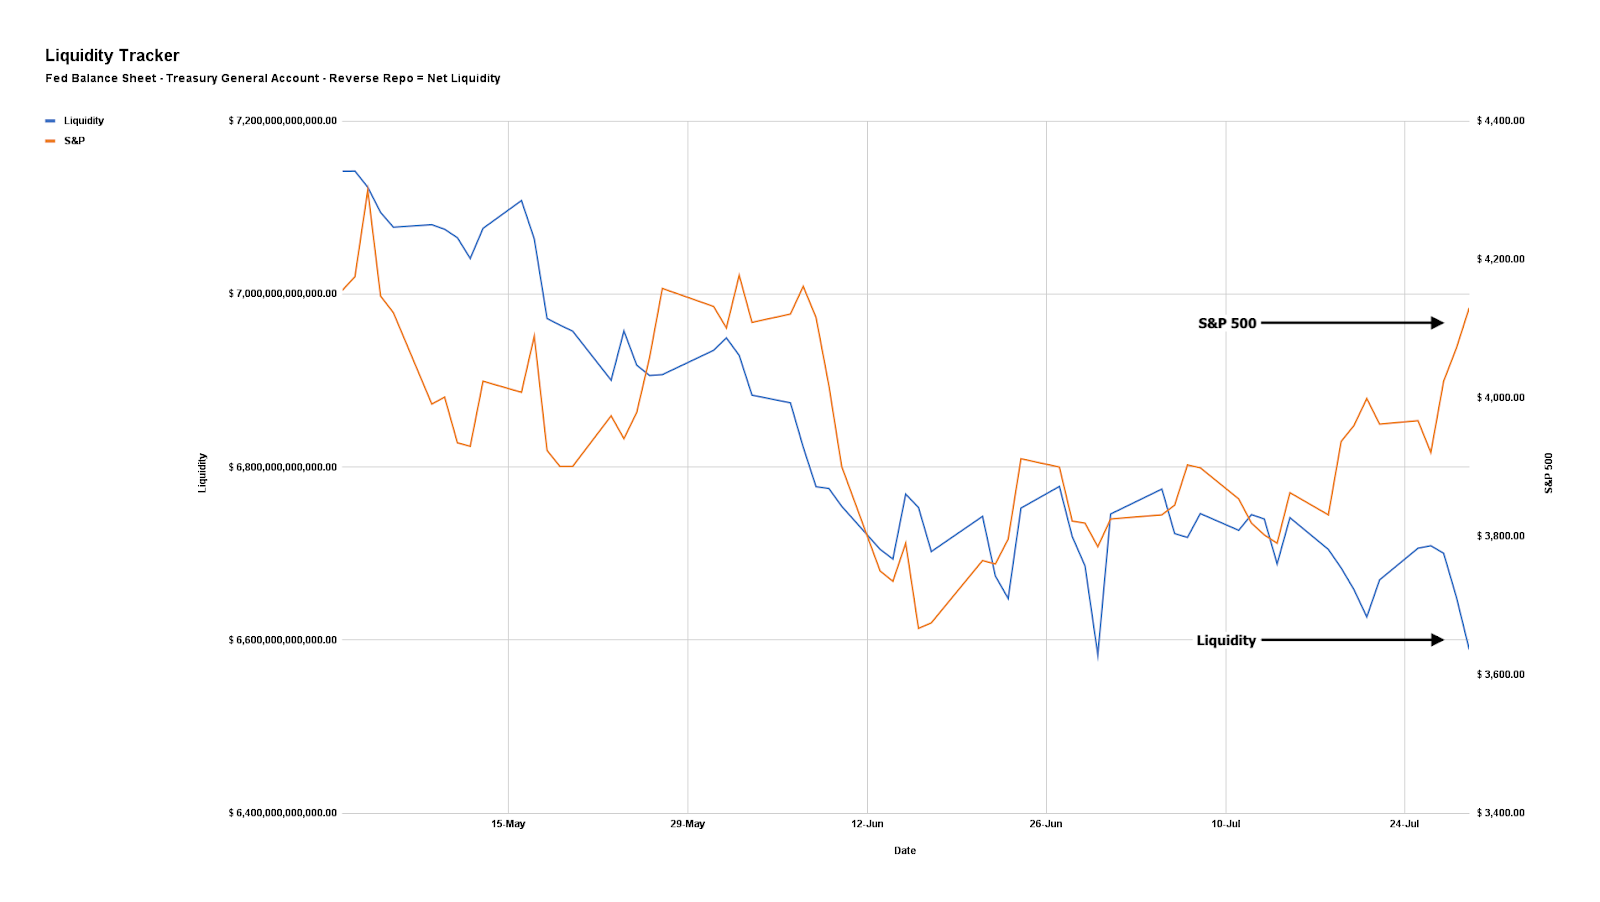
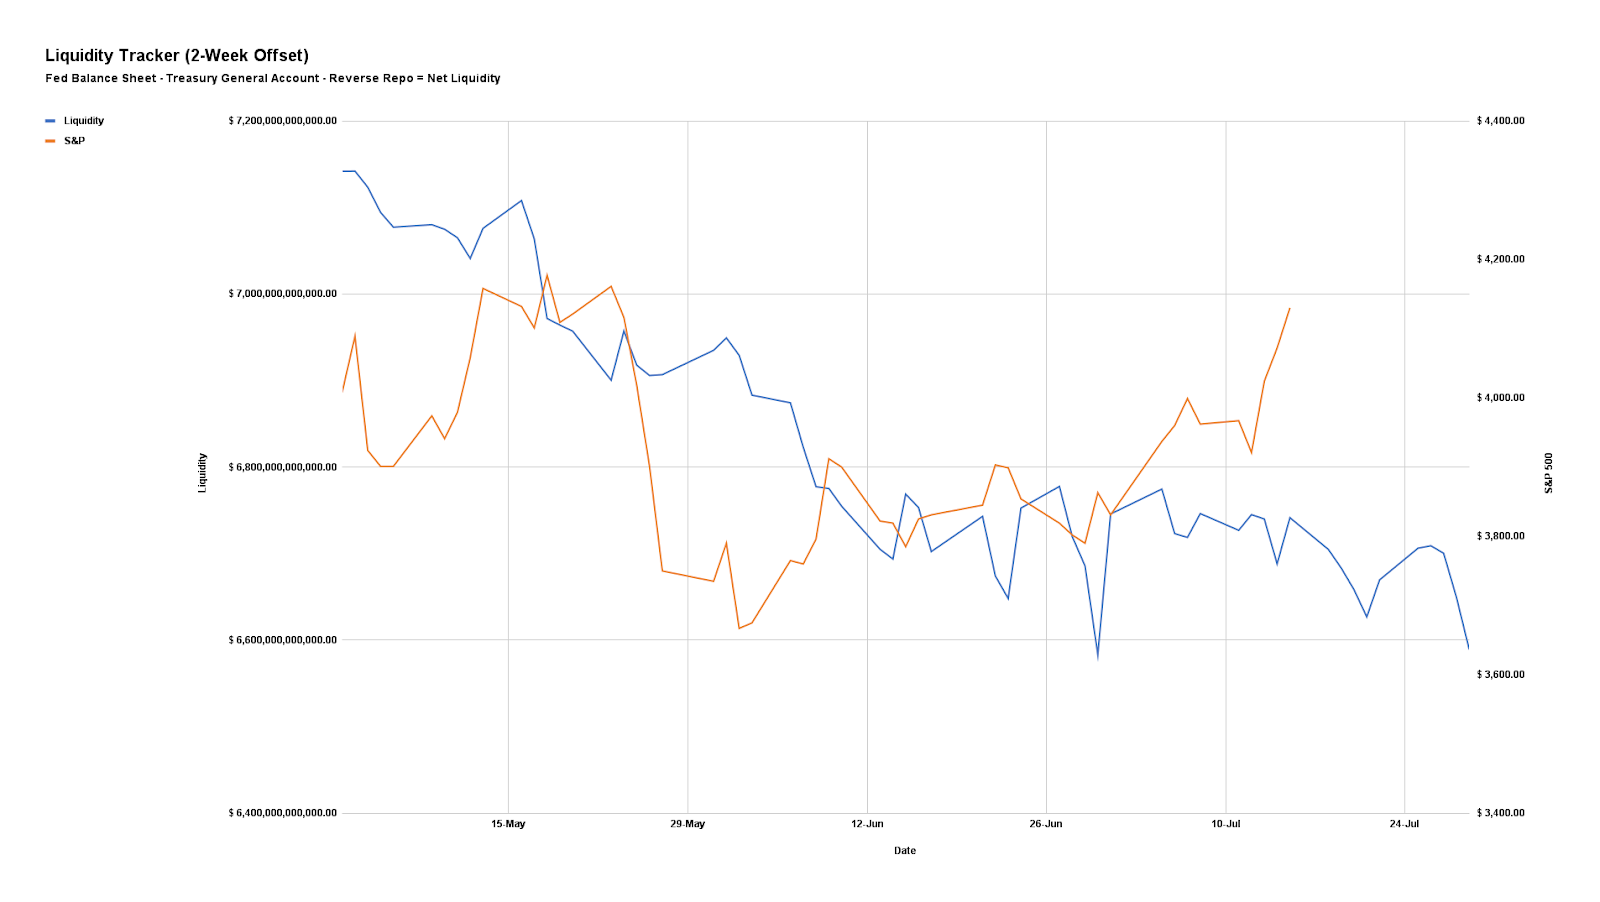
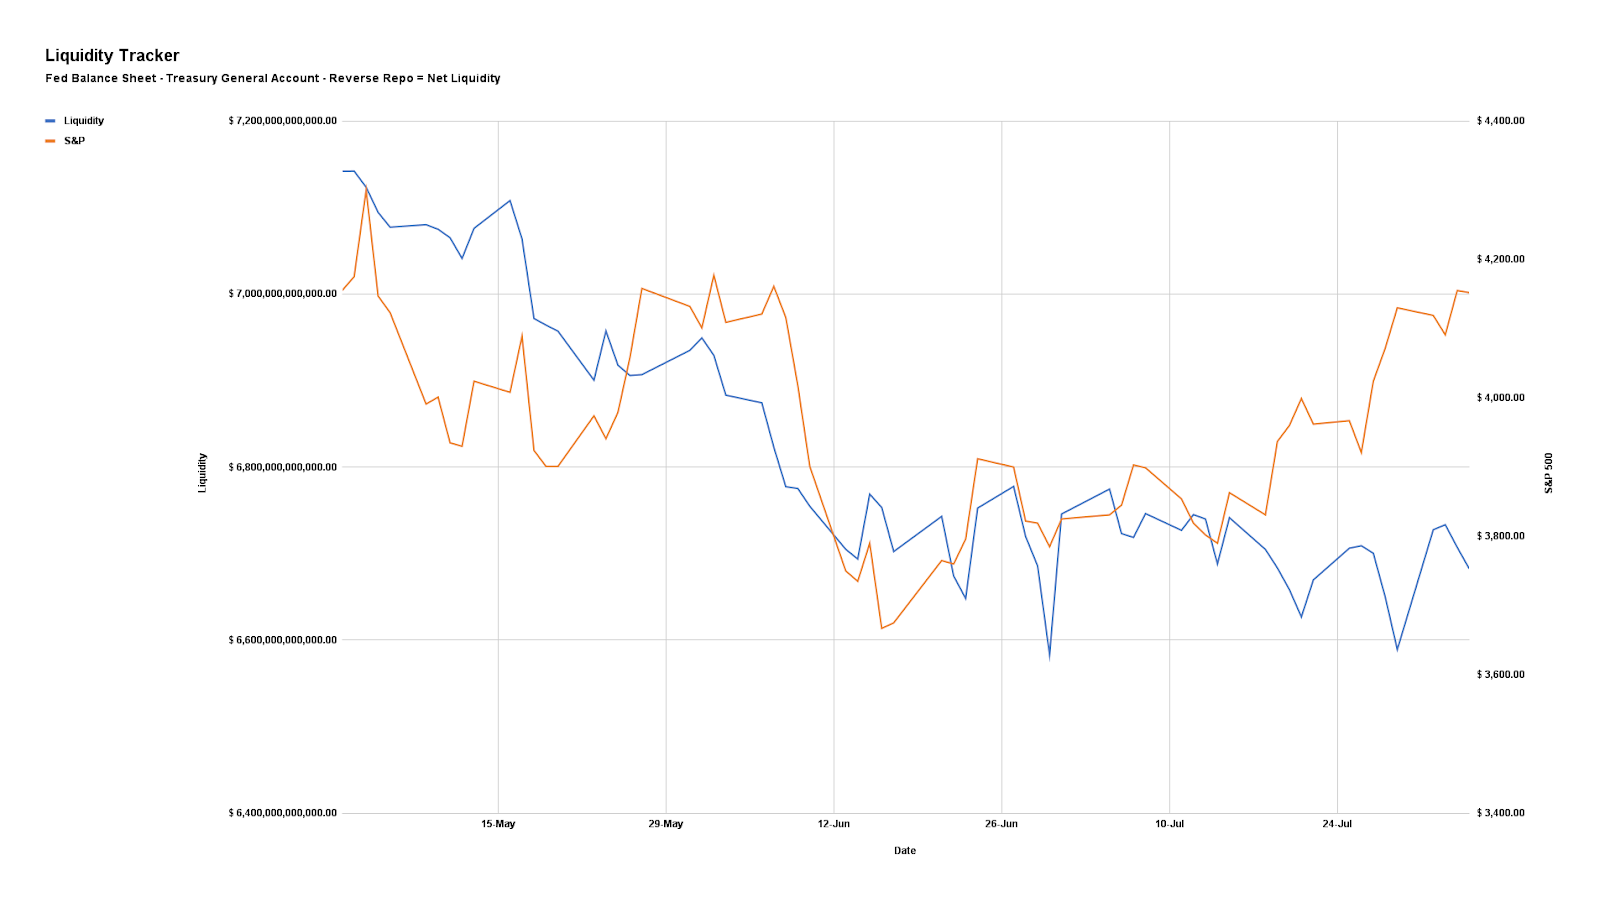
Therefore, in addition to this (projected tax increases, the expected high coupon issuance/QT doubling in September and Q4, and the like), the “knee jerk re-leveraging flow [is likely to] not survive,” per Damped Spring’s Andy Constan.
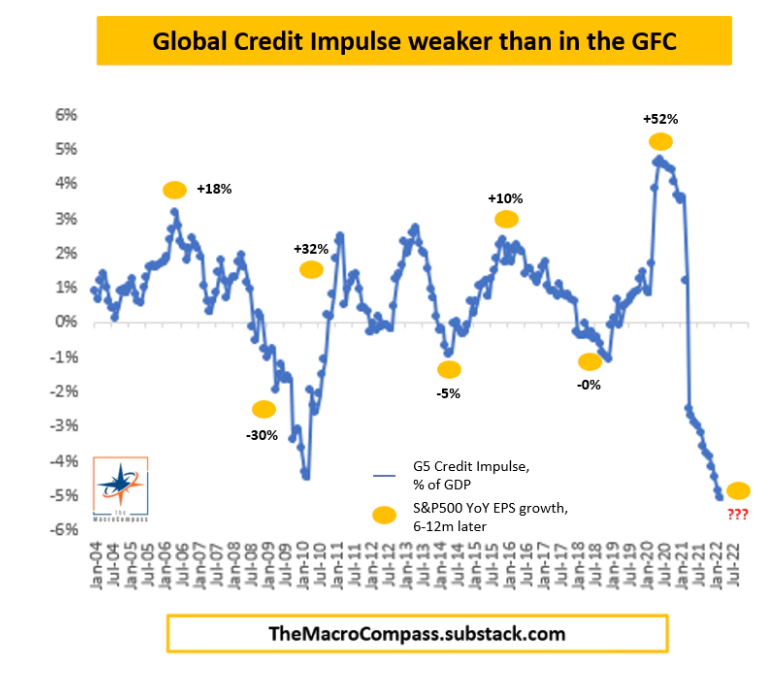
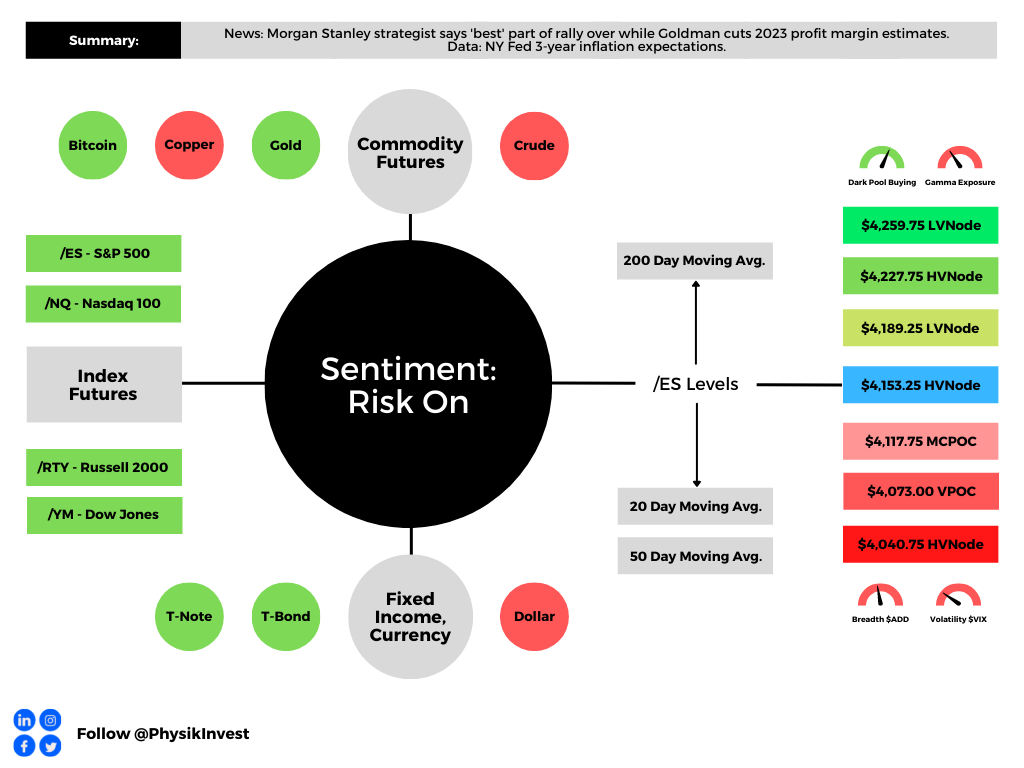
Additionally, Morgan Stanley (NYSE: MS) and Goldman Sachs Group Inc’s (NYSE: GS) strategists, both express an outlook at odds with the recent market rally on the back of “better-than-feared second-quarter earnings.”
Per MS’s Michael Wilson, the expectation profit margins will continue to expand into 2023 is “unrealistic due to sticky cost pressures and receding demand.”
“While prices to the end consumer are still rising at a rapid clip, prices for producers are rising at double the pace.”
GS’s David Kostin concurs and expects net margins to drop ~25 basis points in every sector led by energy, health care, and materials, Bloomberg summarizes.
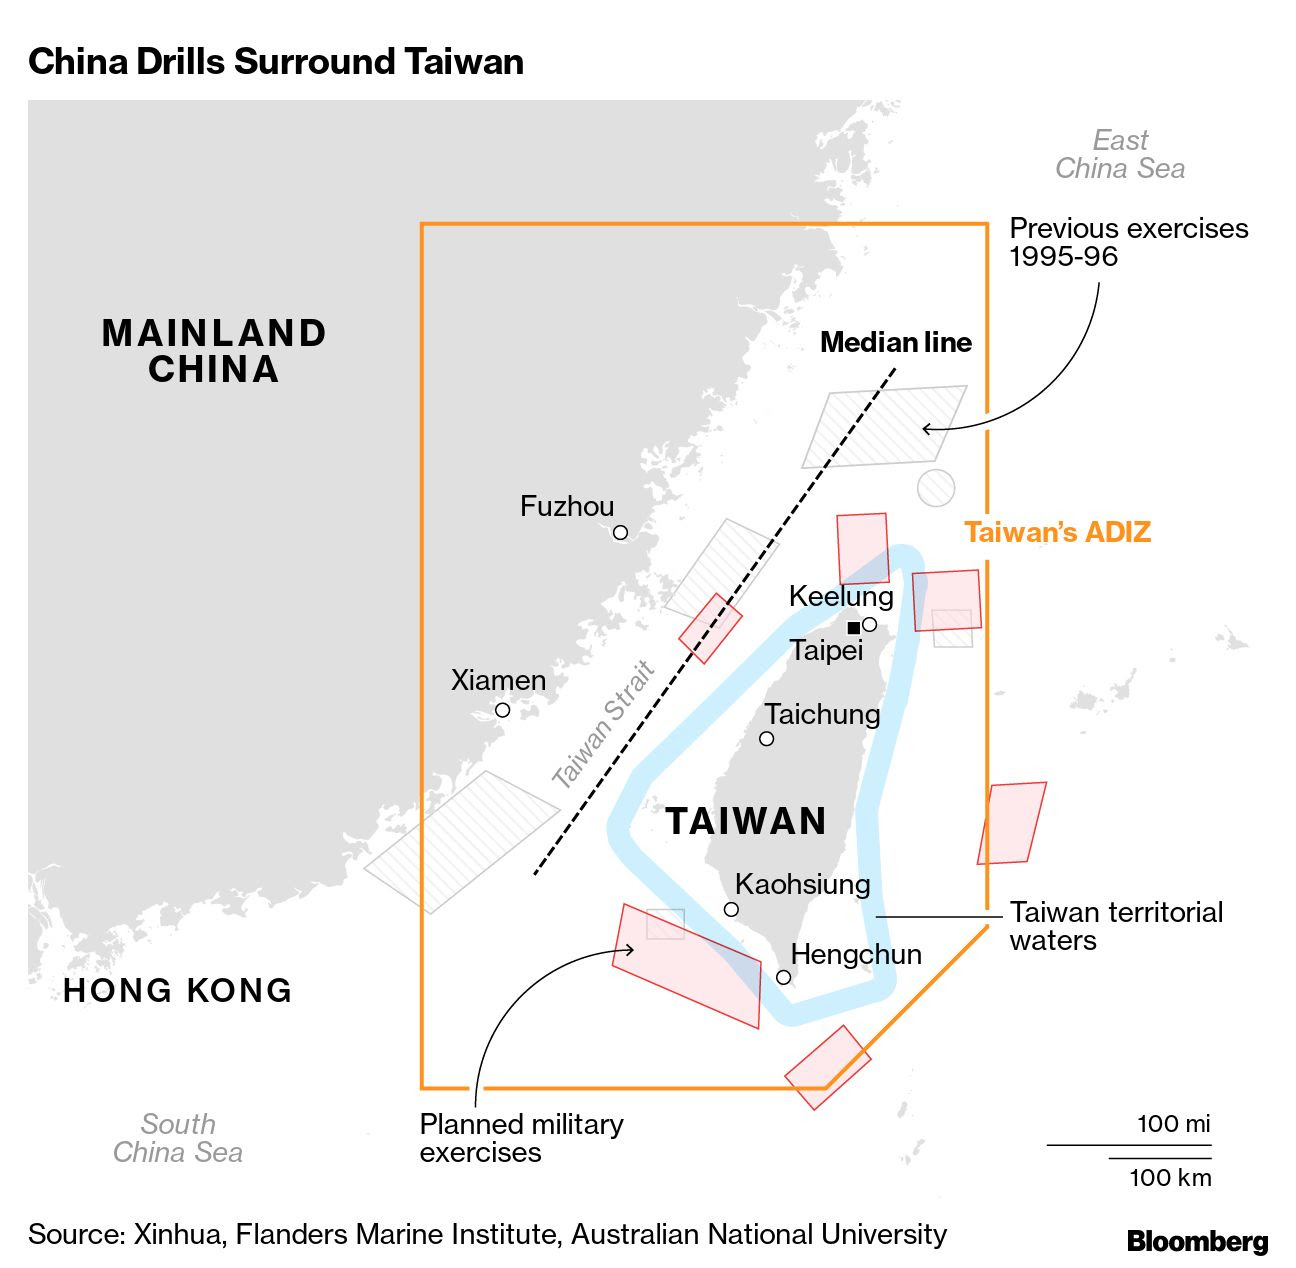
On the topic of geopolitical conflict, which we talked a lot about in the August 3 letter, the US’s Nancy Pelosi visited Taiwan last week prompting Chinese military exercises in the region.
Overall, it is likely not in China’s best interest to press the conflict much further,” Authers puts forth. “Taiwan’s role in the world’s electronics industry means that the global economic impact of any conflict could dwarf the disruptions of the last two years sparked by the pandemic.”
These disruptions would pain the world, including China.
Positioning
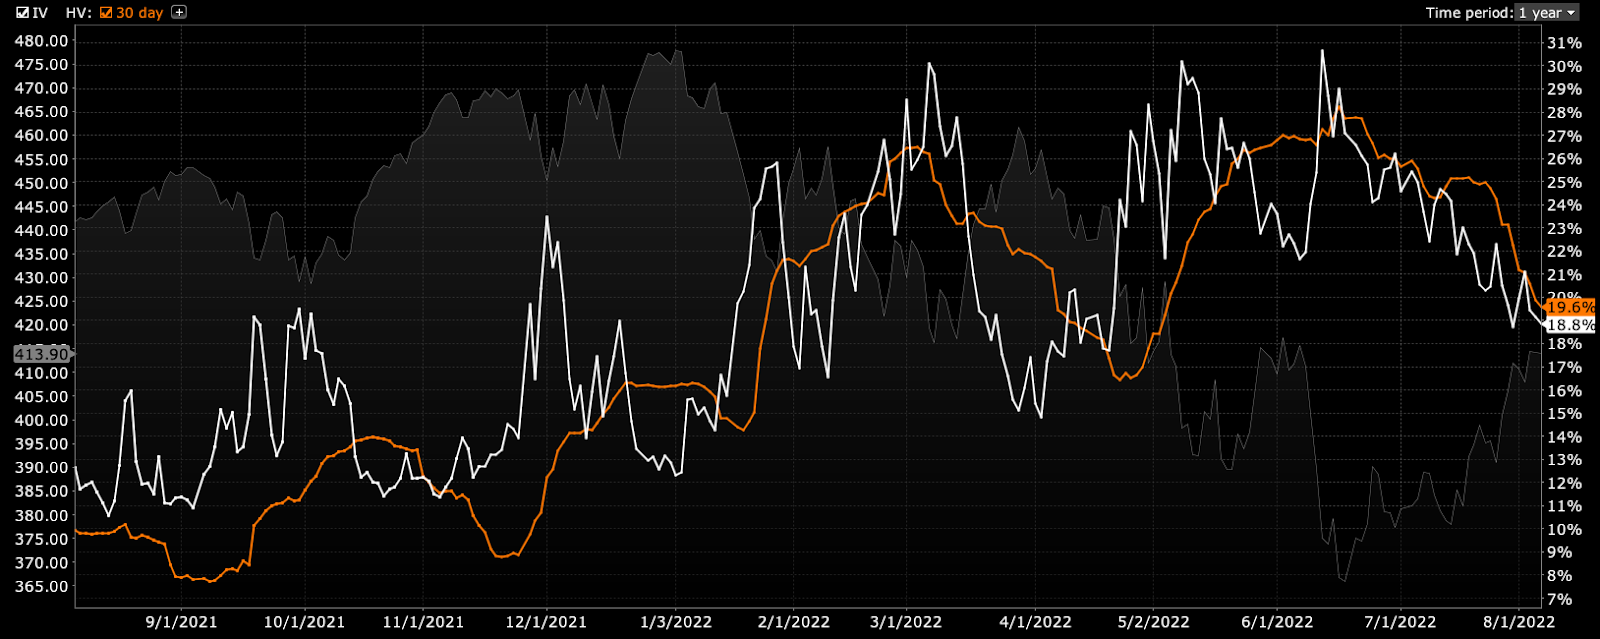
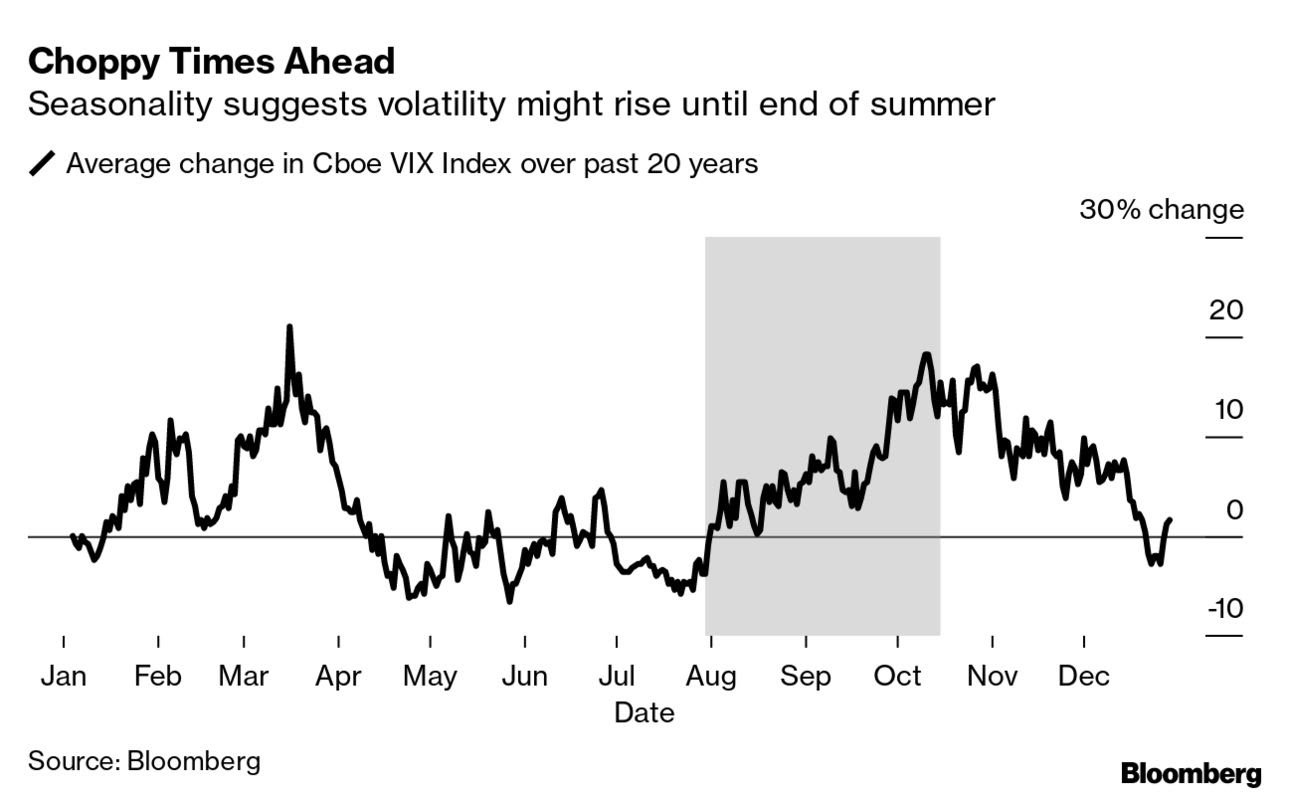
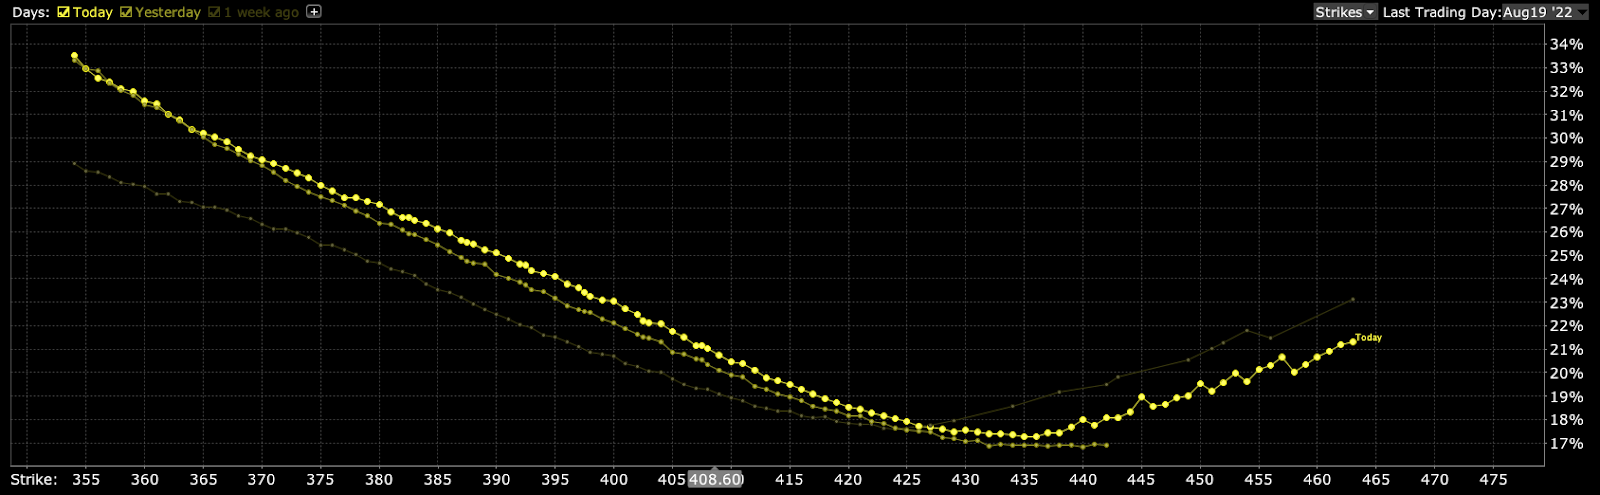
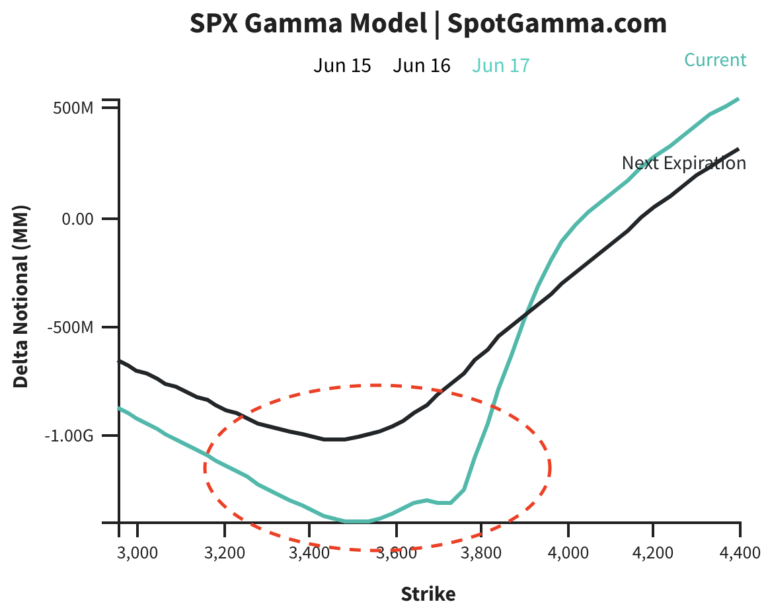
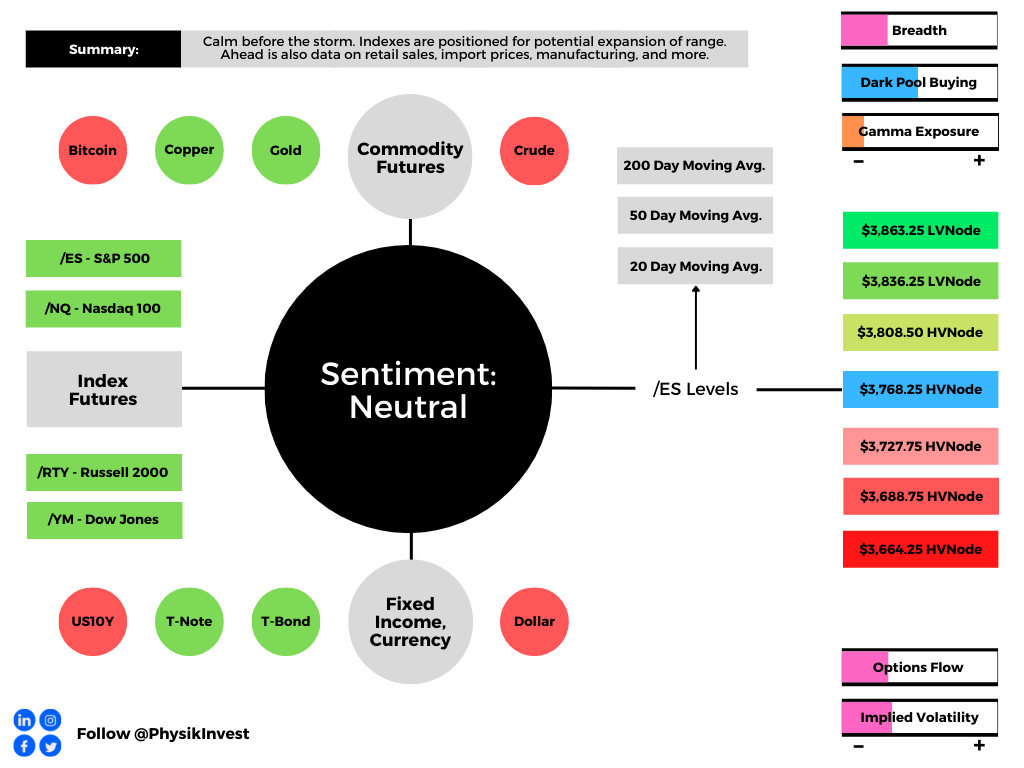
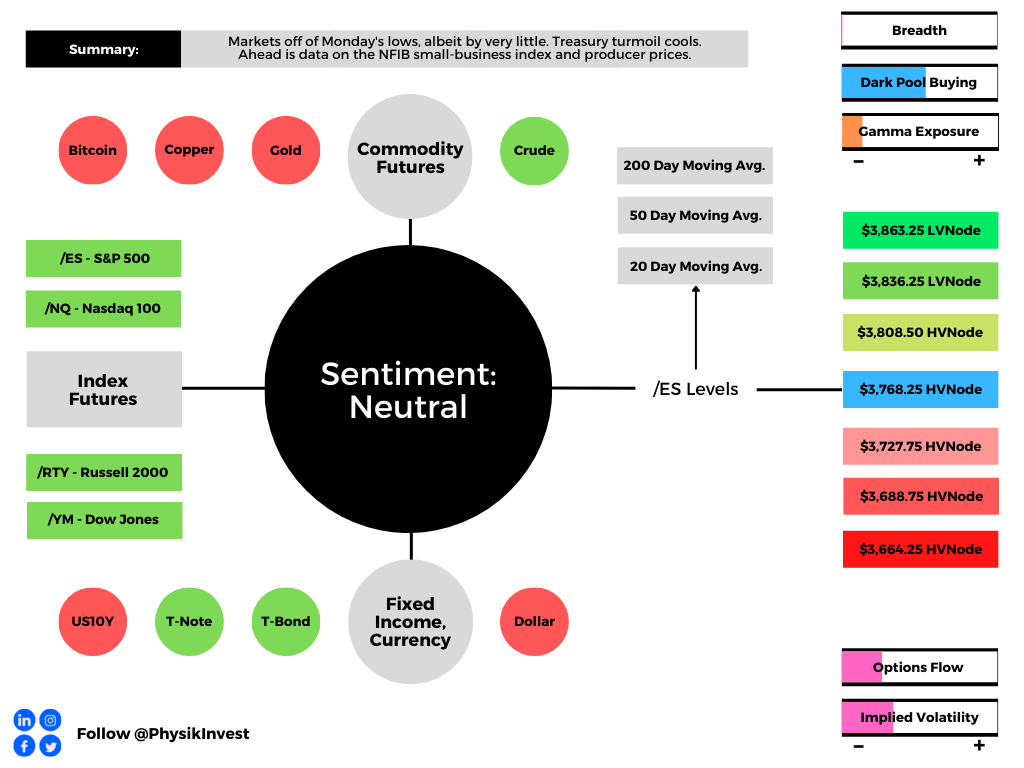
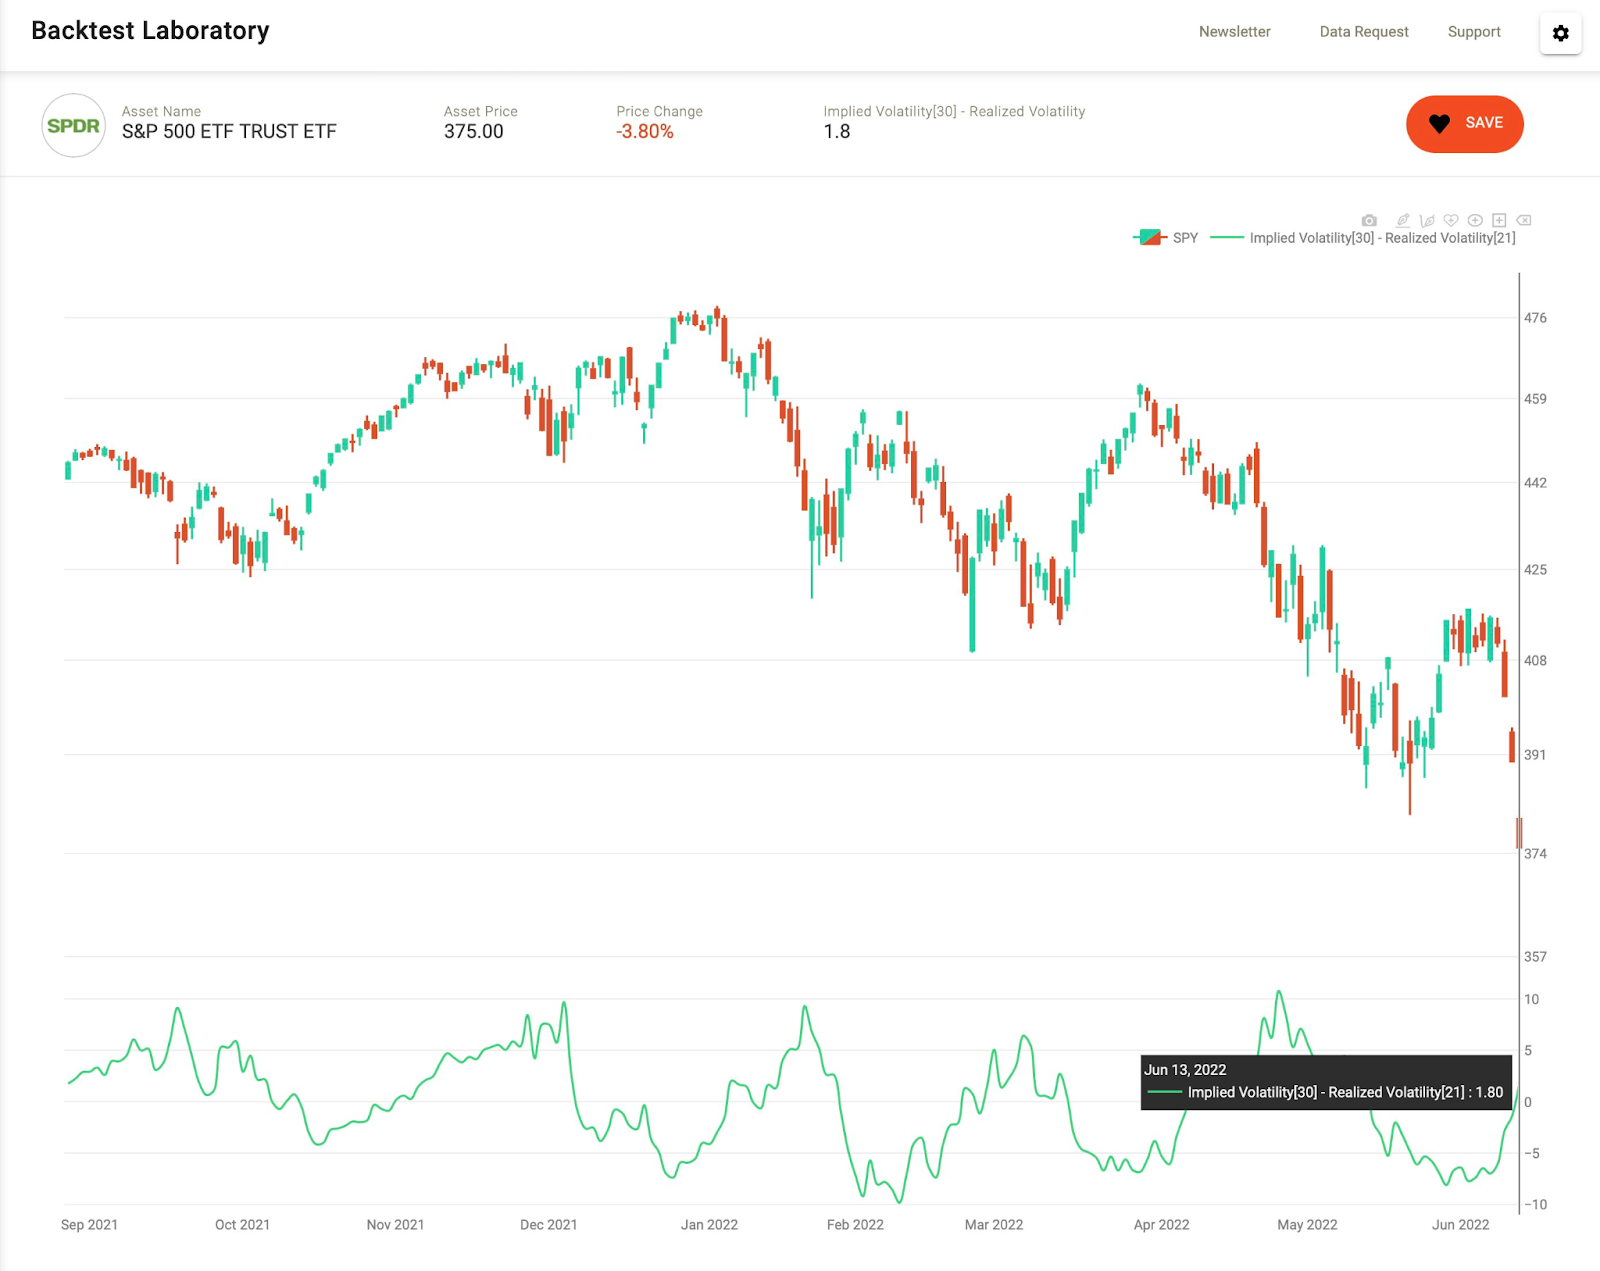
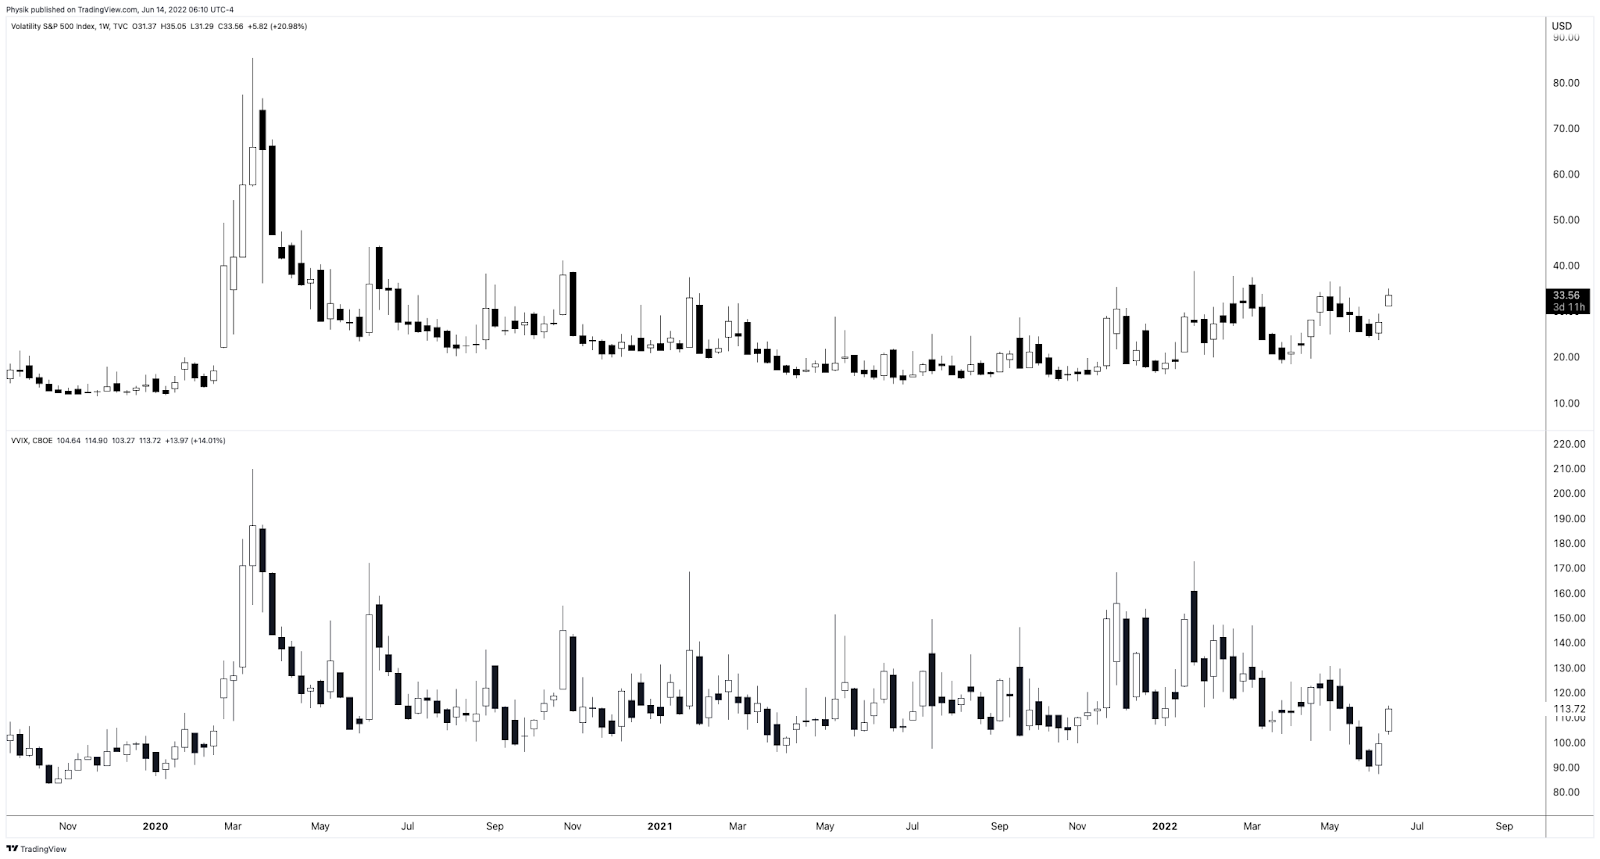
As of 6:40 AM ET, Monday’s expected volatility, via the Cboe Volatility Index (INDEX: VIX), sits at ~1.13%. Net gamma exposures decreasing may help with an expansion of range.
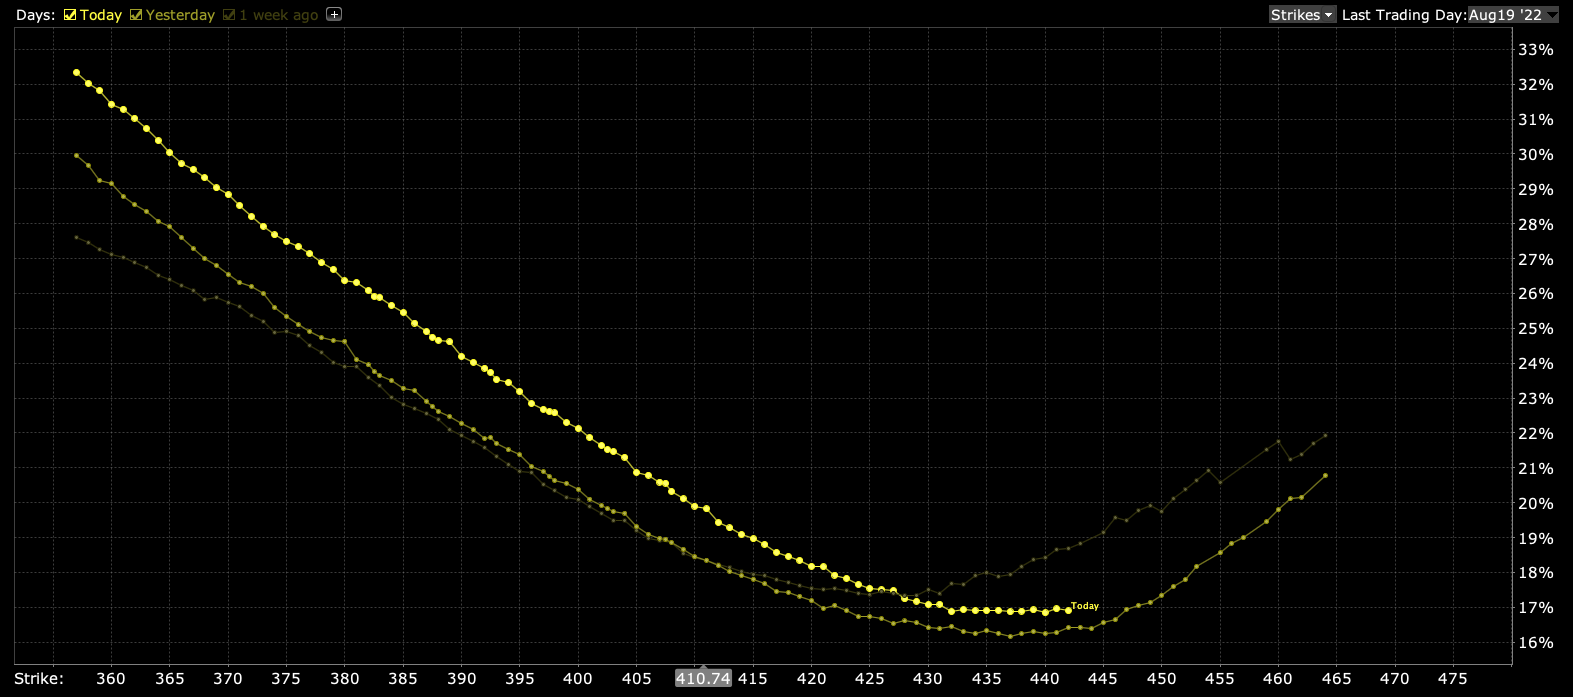
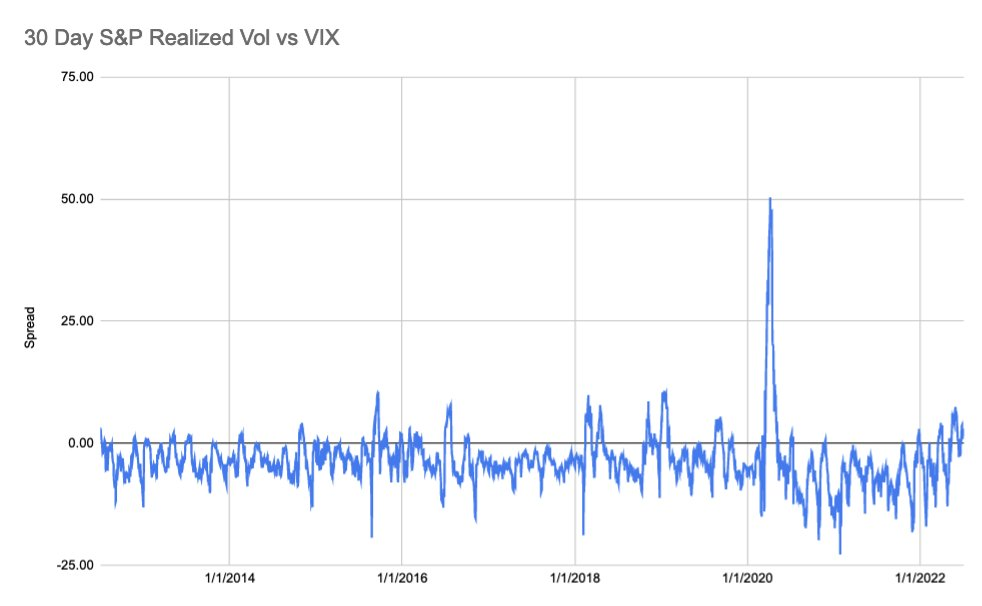
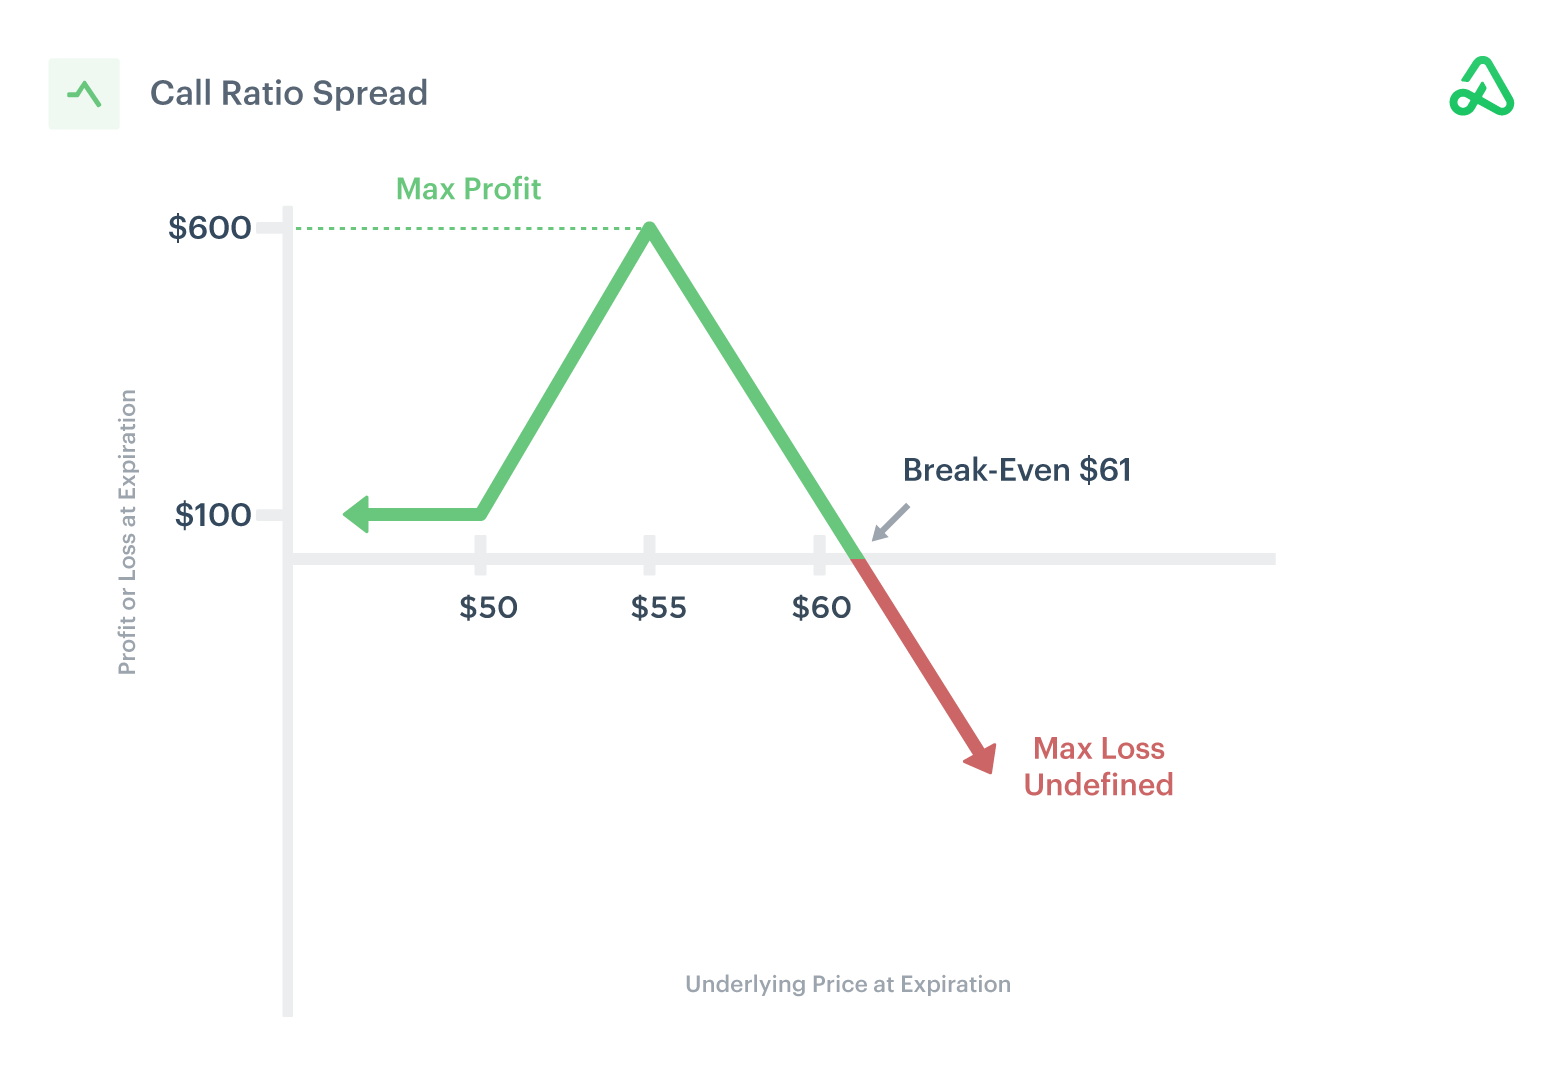
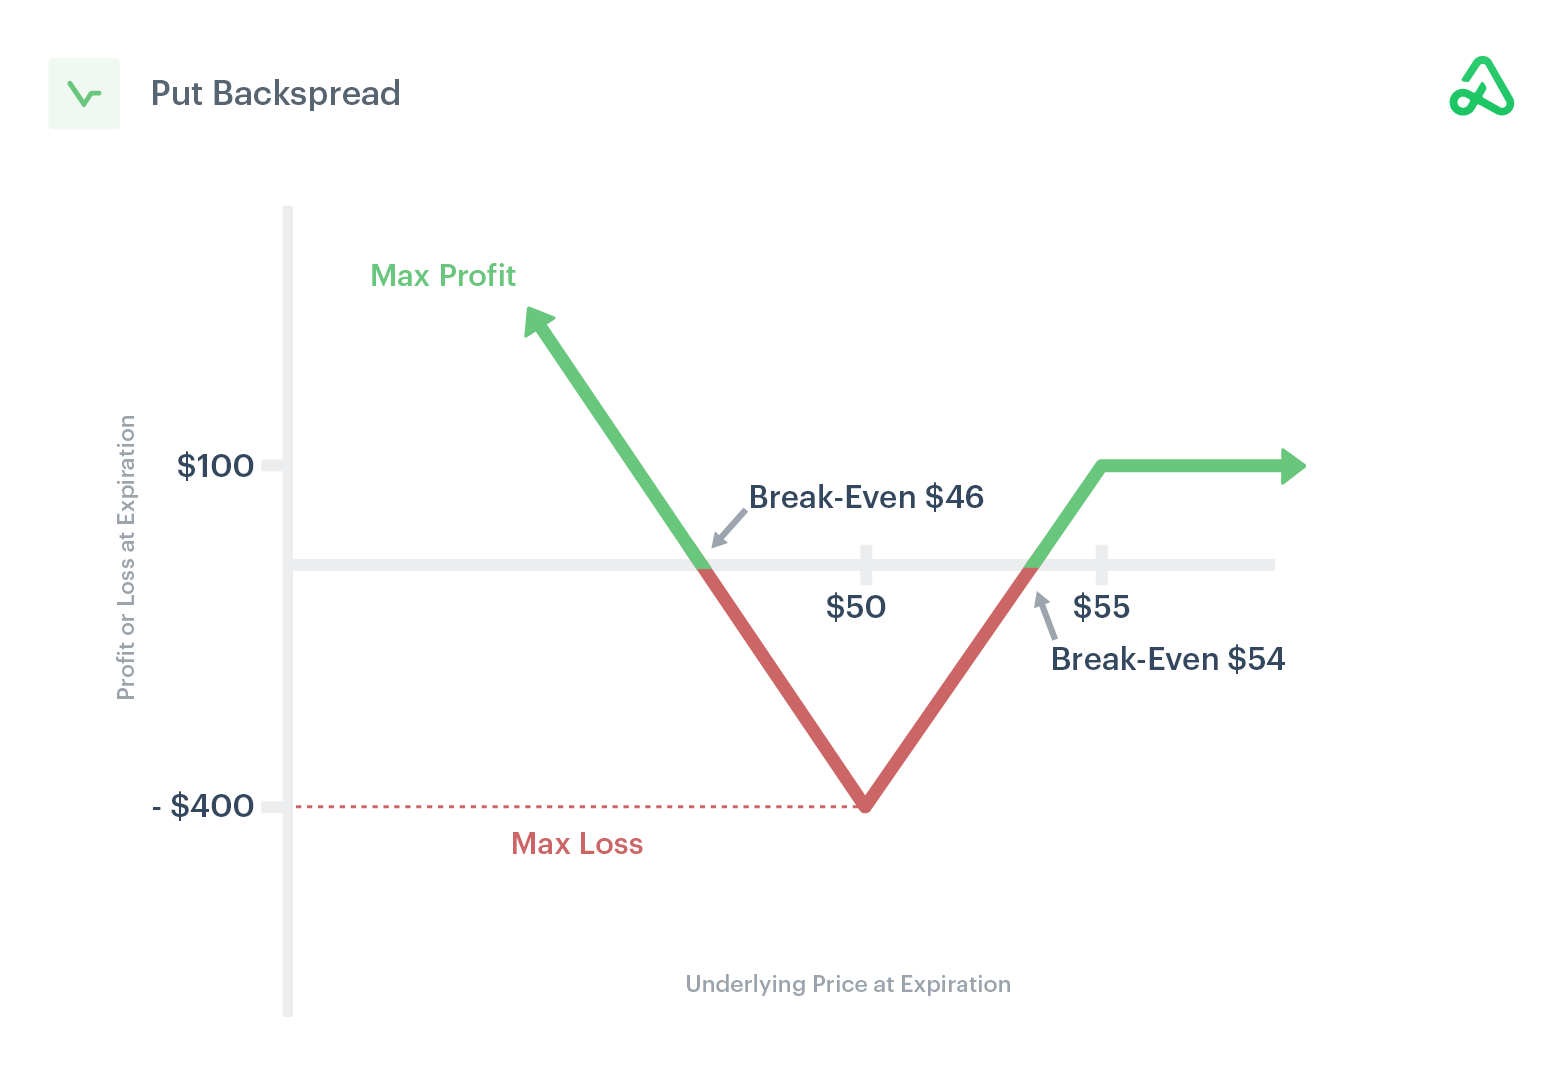
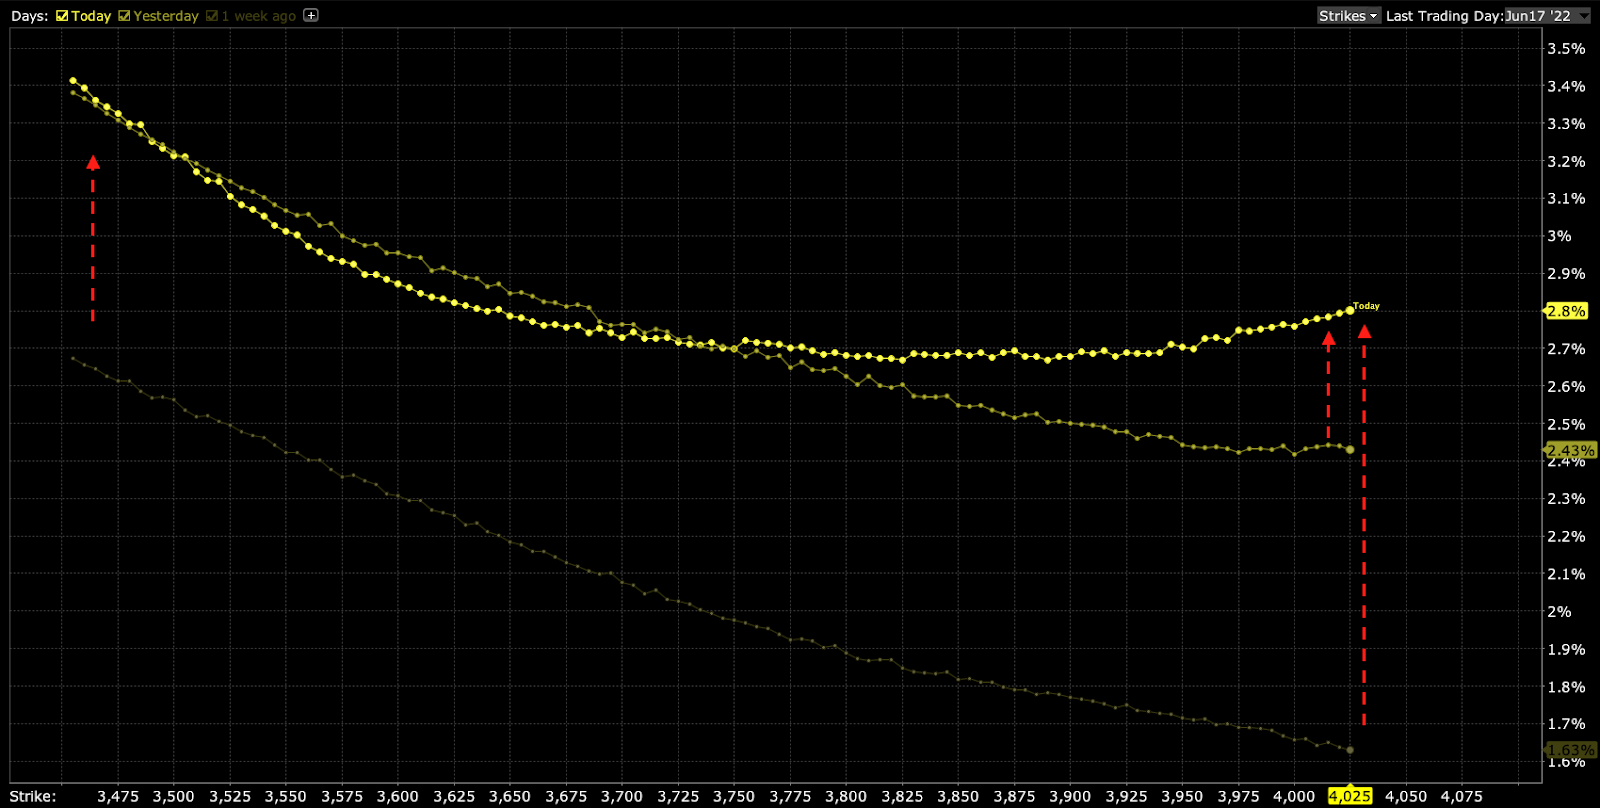
Given where realized (RVOL) and implied (IVOL) volatility measures are, as well as skew, it is beneficial to be a buyer of complex options structures (e.g., back spread).
Here’s our August 5 letter for more context.
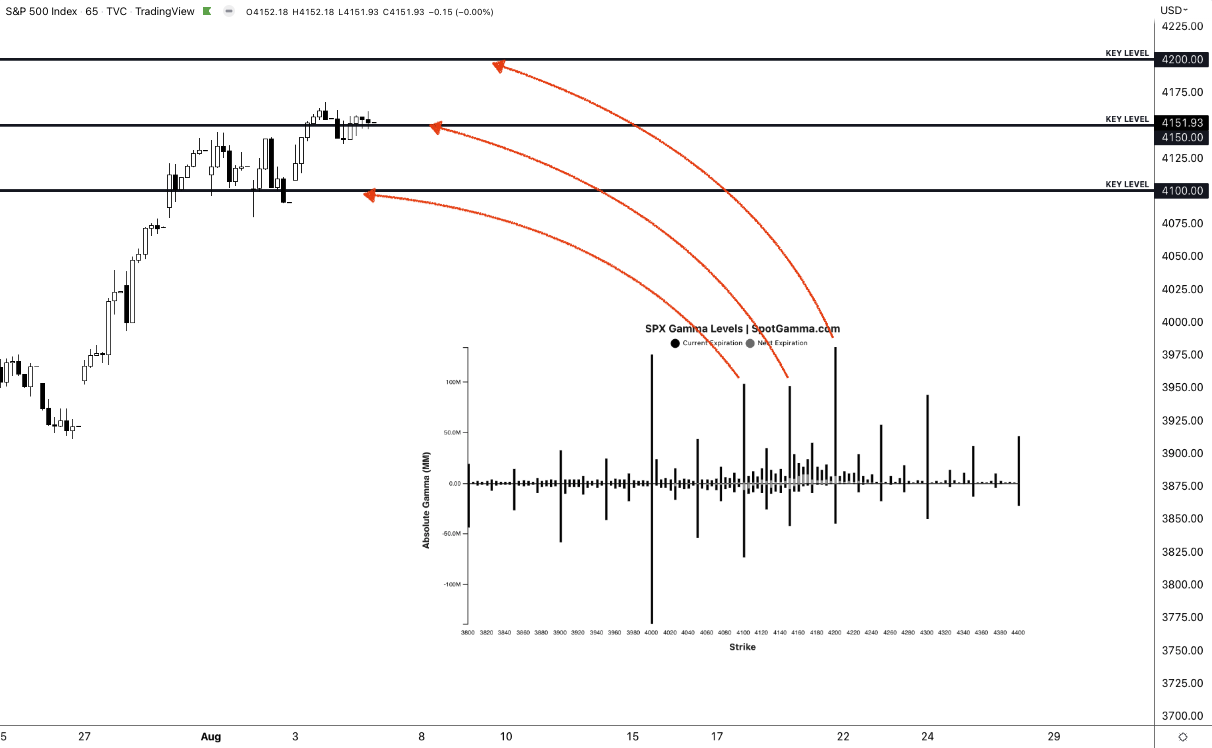
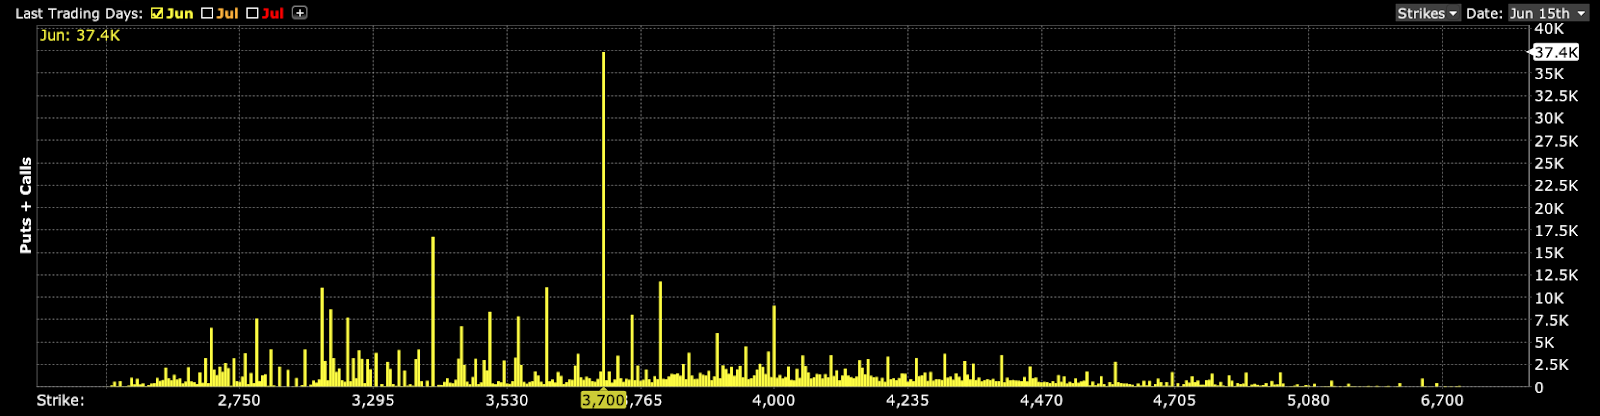
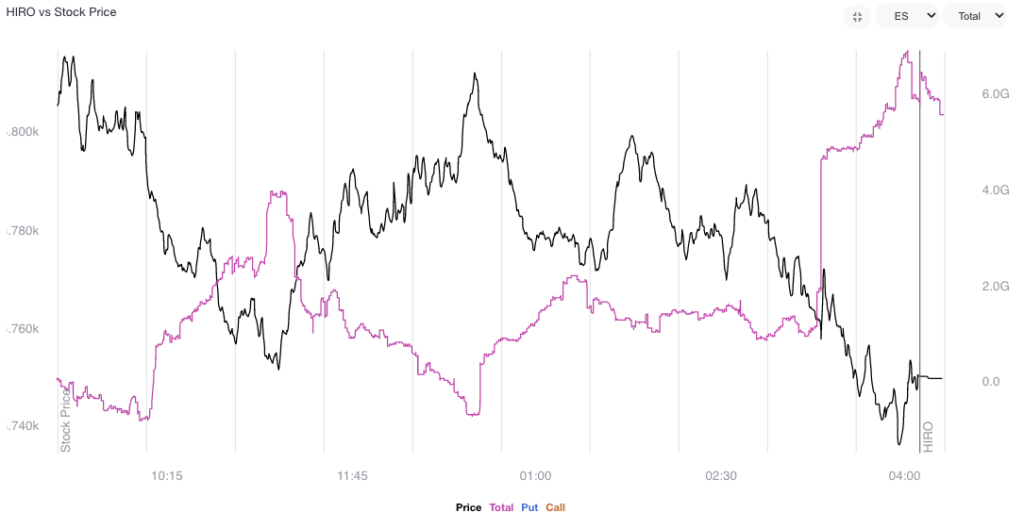
For concision, we quote SpotGamma: “It’s the case when the fuel from a drop in option implied volatility is spent, as well as the sticky open interest at current prices rolls off, that options-related hedging does less to keep markets pinned.”
Technical
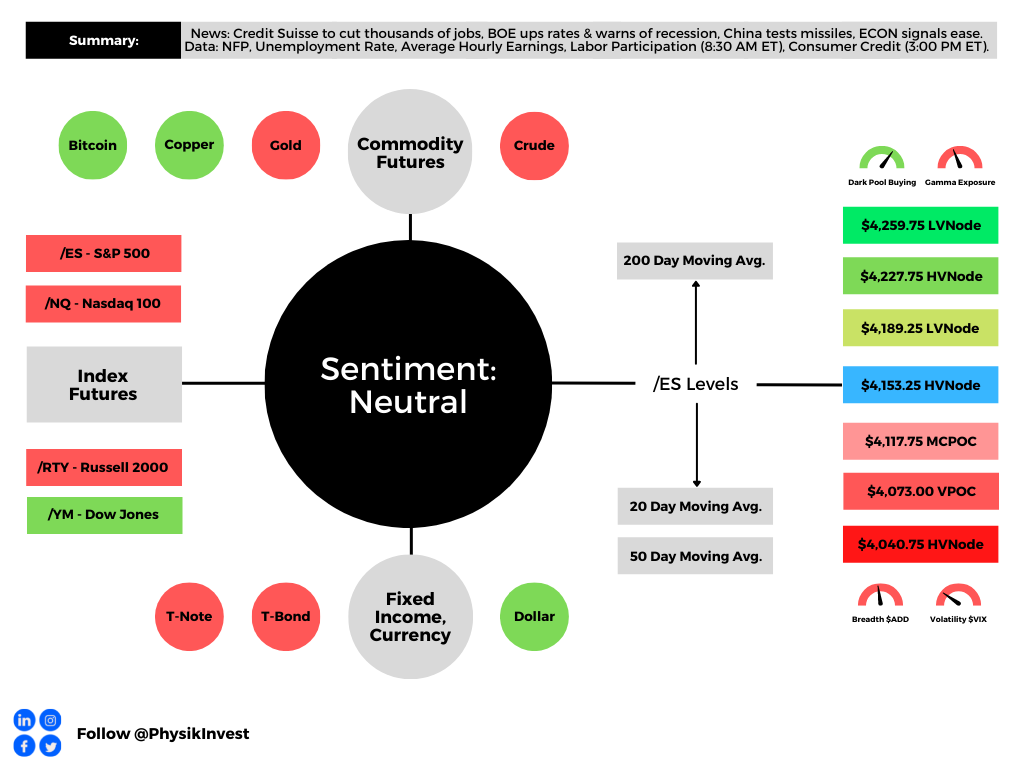
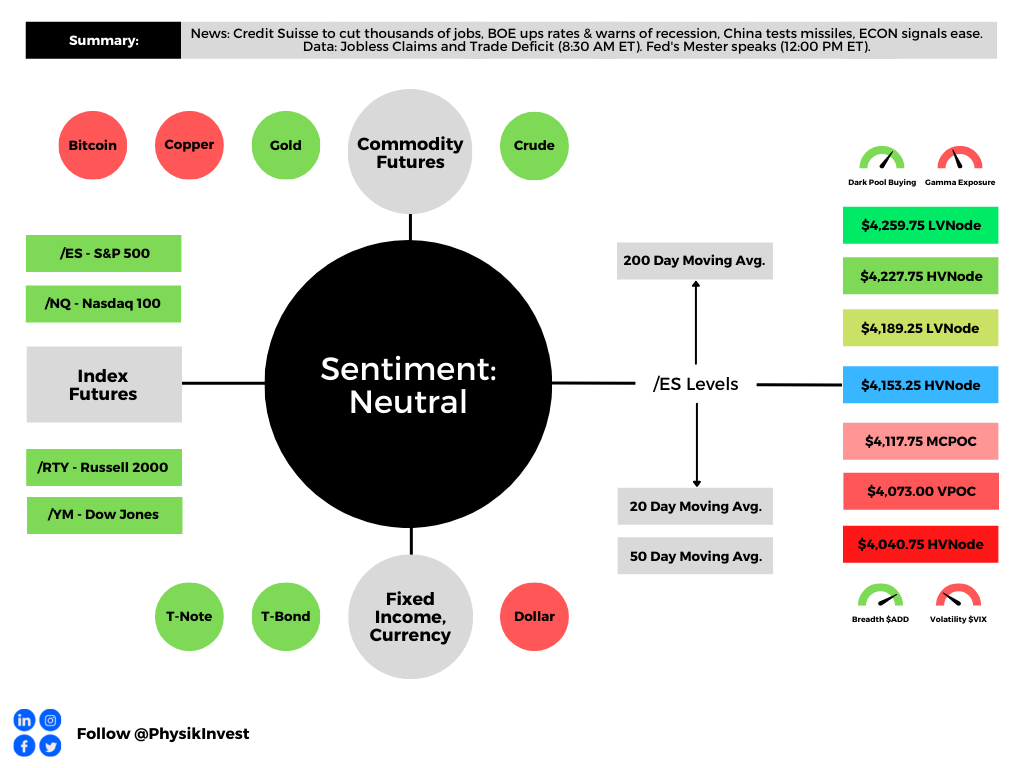
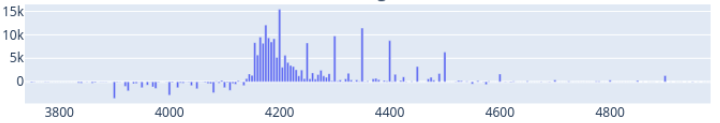
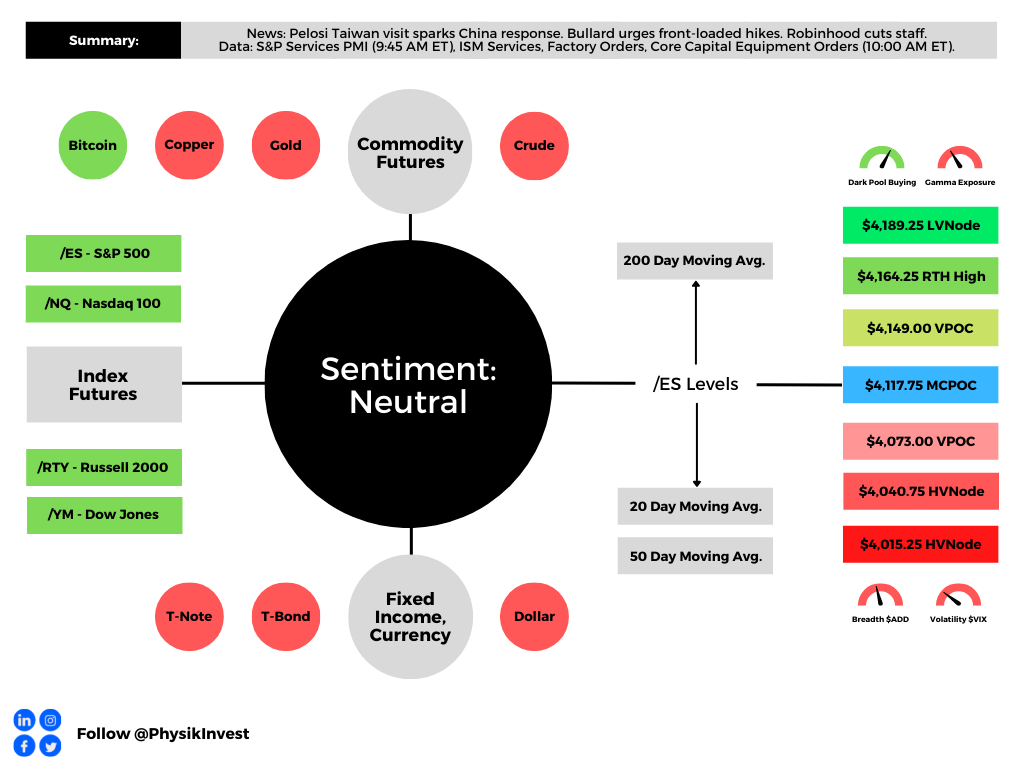
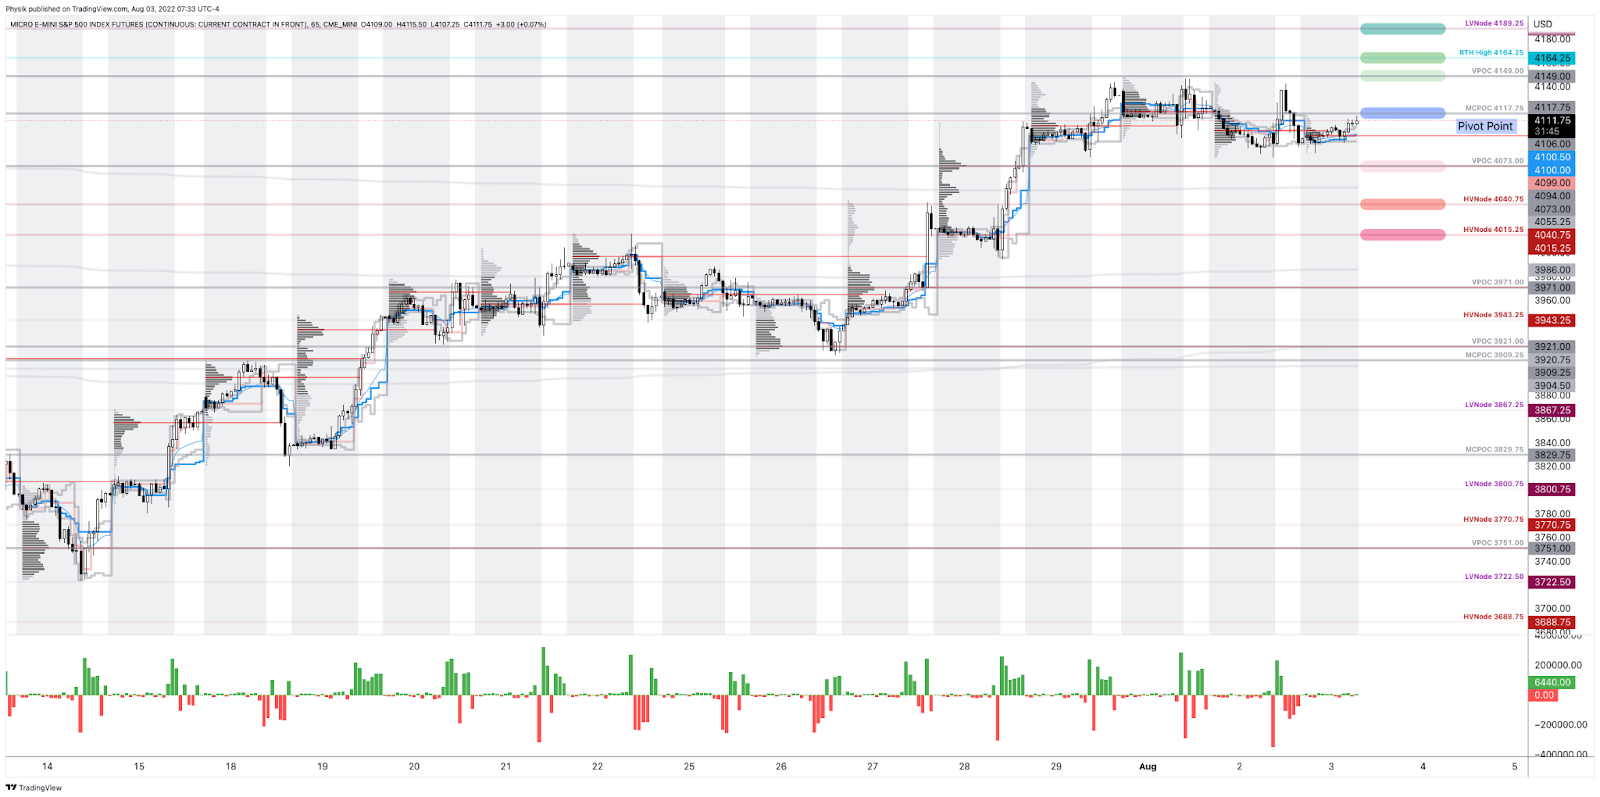
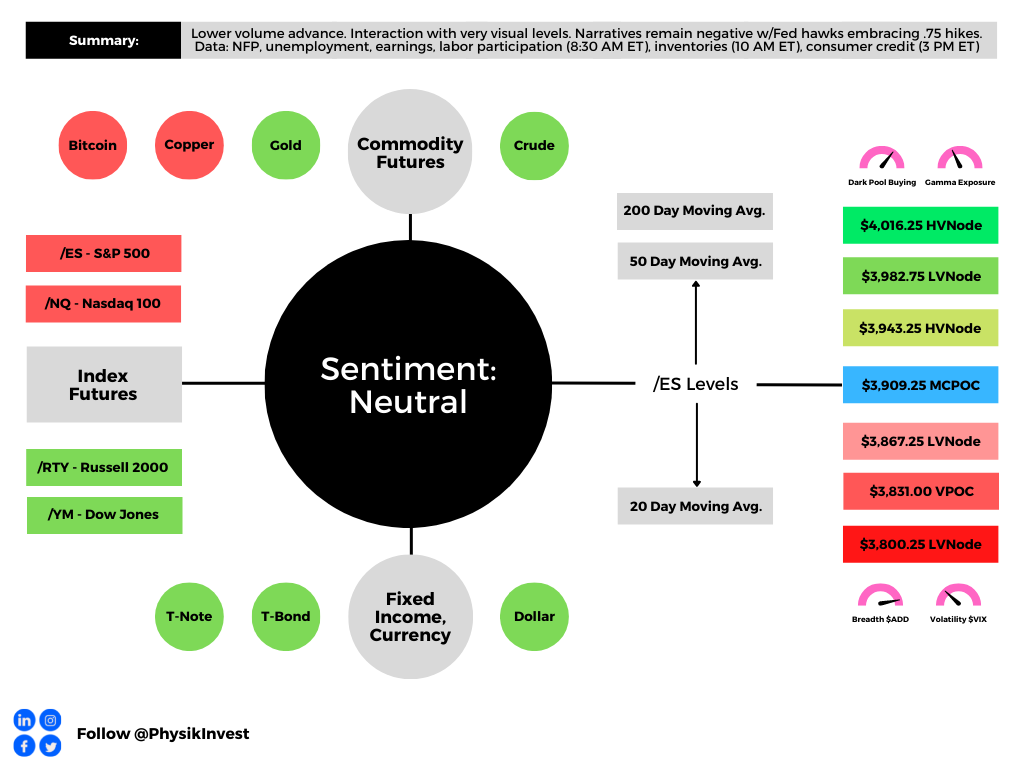
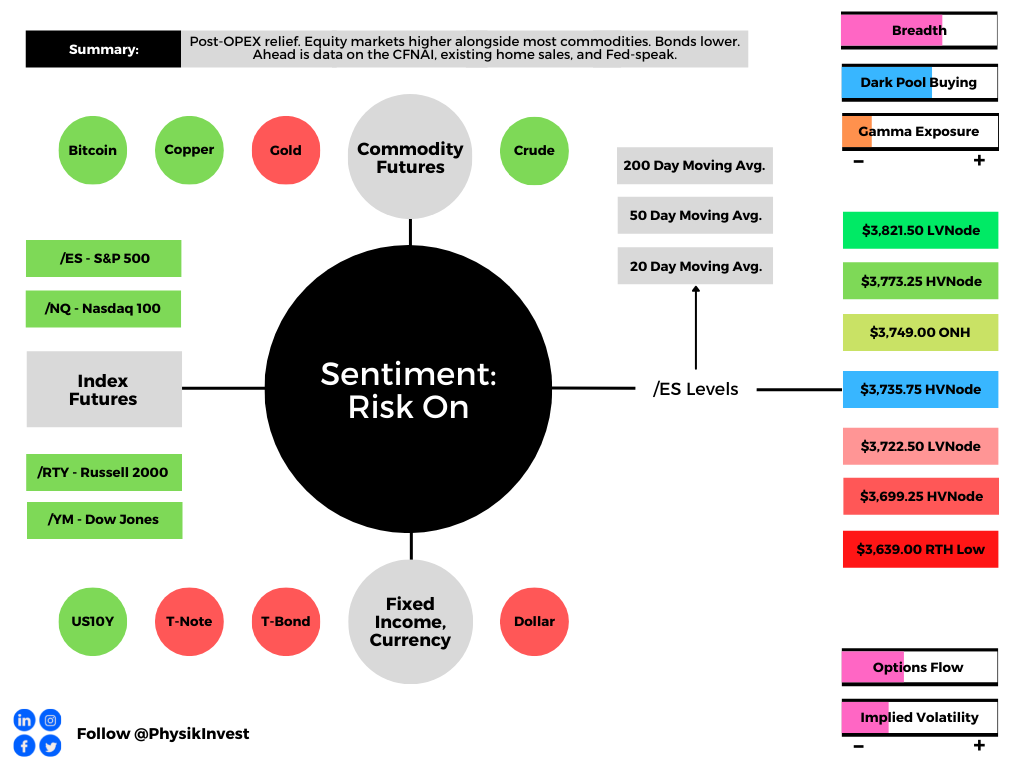
As of 6:40 AM ET, Monday’s regular session (9:30 AM – 4:00 PM ET), in the S&P 500, is likely to open in the upper part of a positively skewed overnight inventory, outside of prior-range and -value, suggesting a potential for immediate directional opportunity.
In the best case, the S&P 500 trades higher.
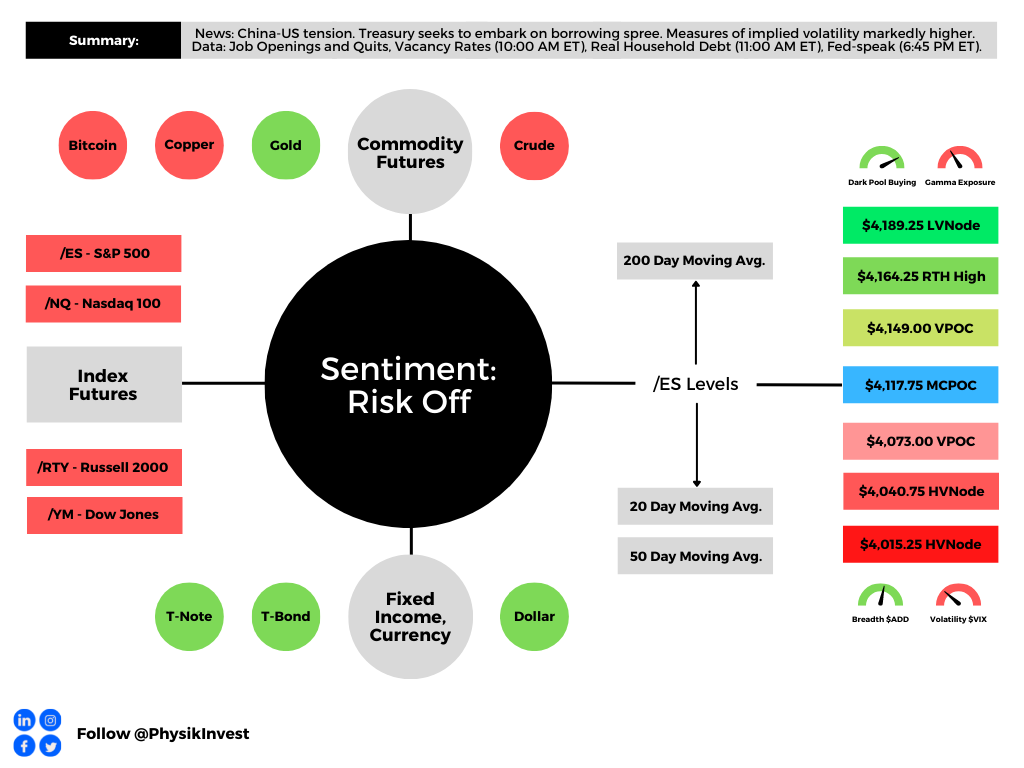
Any activity above the $4,153.25 HVNode puts into play the $4,189.25 LVNode. Initiative trade beyond the LVNode could reach as high as the $4,227.75 HVNode and $4,259.75 LVNode, or higher.
In the worst case, the S&P 500 trades lower.
Any activity below the $4,153.25 HVNode puts into play the $4,117.75 MCPOC. Initiative trade beyond the MCPOC could reach as low as the $4,073.00 VPOC and $4,040.75 HVNode, or lower.
Click here to load today’s key levels into the web-based TradingView charting platform. Note that all levels are derived using the 65-minute timeframe. New links are produced, daily.

Considerations: Responsiveness near key-technical areas (that are discernable visually on a chart), suggests technically-driven traders with short time horizons are very active.
Such traders often lack the wherewithal to defend retests and, additionally, the type of trade may be indicative of the other time frame participants waiting for more information to initiate trades.
Definitions
Volume Areas: A structurally sound market will build on areas of high volume (HVNodes). Should the market trend for long periods of time, it will lack sound structure, identified as low volume areas (LVNodes). LVNodes denote directional conviction and ought to offer support on any test.
If participants were to auction and find acceptance into areas of prior low volume (LVNodes), then future discovery ought to be volatile and quick as participants look to HVNodes for favorable entry or exit.
POCs: POCs are valuable as they denote areas where two-sided trade was most prevalent in a prior day session. Participants will respond to future tests of value as they offer favorable entry and exit.
MCPOCs: POCs are valuable as they denote areas where two-sided trade was most prevalent over numerous day sessions. Participants will respond to future tests of value as they offer favorable entry and exit.
Volume-Weighted Average Prices (VWAPs): A metric highly regarded by chief investment officers, among other participants, for quality of trade. Additionally, liquidity algorithms are benchmarked and programmed to buy and sell around VWAPs.
About
After years of self-education, strategy development, mentorship, and trial-and-error, Renato Leonard Capelj began trading full-time and founded Physik Invest to detail his methods, research, and performance in the markets.
Capelj also develops insights around impactful options market dynamics at SpotGamma and is a Benzinga reporter.
Some of his works include conversations with ARK Invest’s Catherine Wood, investors Kevin O’Leary and John Chambers, FTX’s Sam Bankman-Fried, ex-Bridgewater Associate Andy Constan, Kai Volatility’s Cem Karsan, The Ambrus Group’s Kris Sidial, among many others.
Disclaimer
In no way should the materials herein be construed as advice. Derivatives carry a substantial risk of loss. All content is for informational purposes only.