The daily brief is a free glimpse into the prevailing fundamental and technical drivers of U.S. equity market products. Join the 300+ that read this report daily, below!
What Happened
Overnight, equity index futures took back some of Tuesday’s sharp advance which happened against the trend of prevailing options activity (discussed further below).
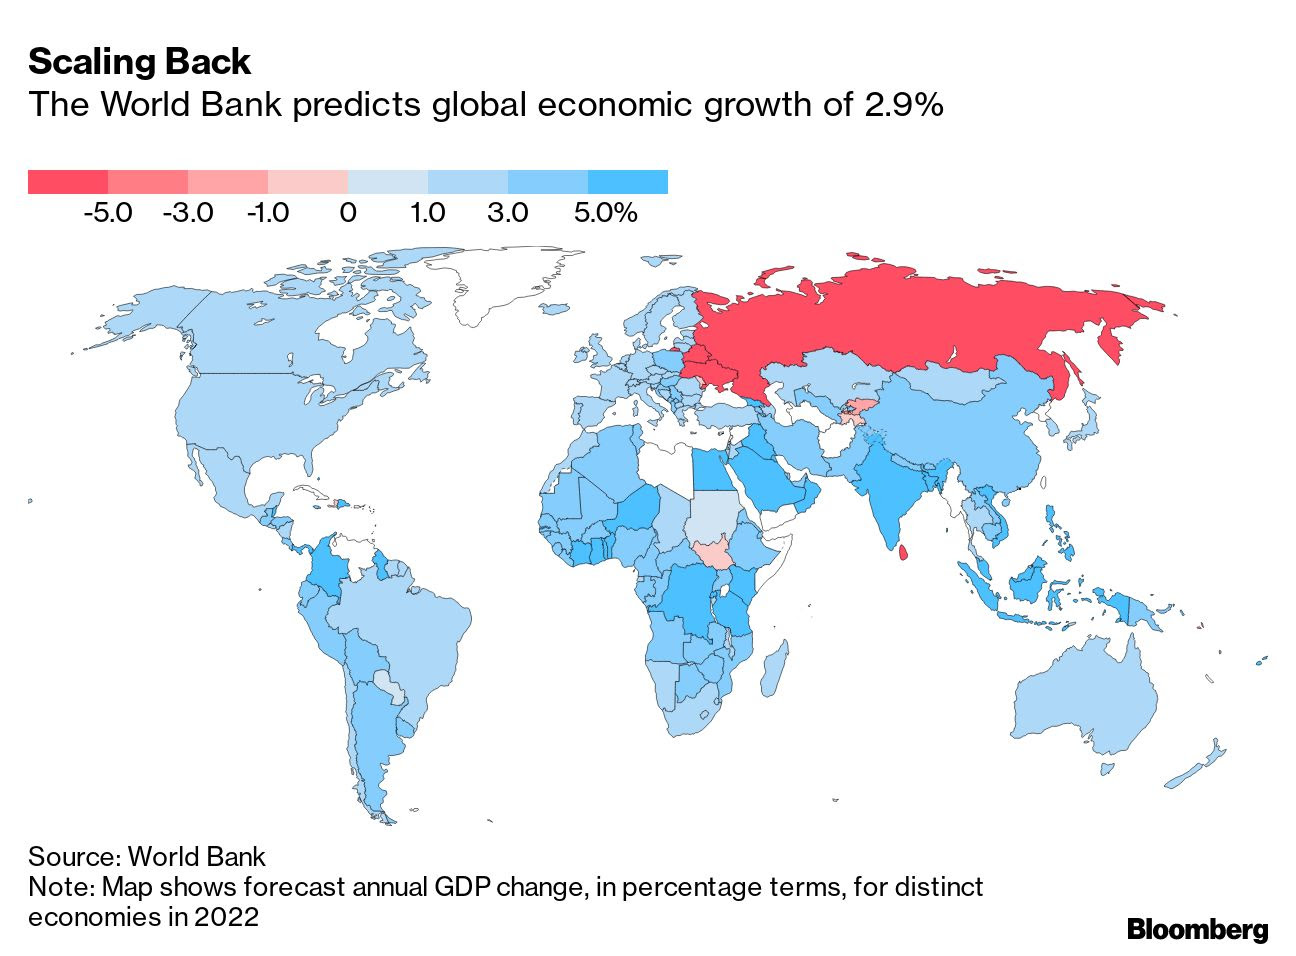
This is as narratives remain unchanged. Investors are pricing the implications of the actions to address heightened inflation, as well as how that may play into (further) economic slowing.
Ahead is data on wholesale inventories (10:00 AM ET). Below is a light commentary to rebuild our narrative after the week-long pause.
What To Expect
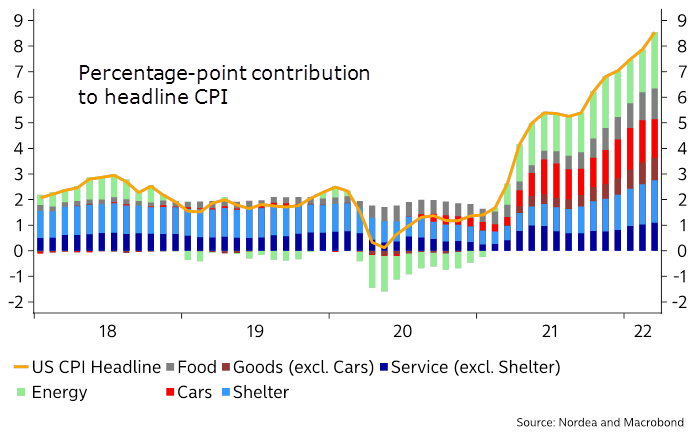
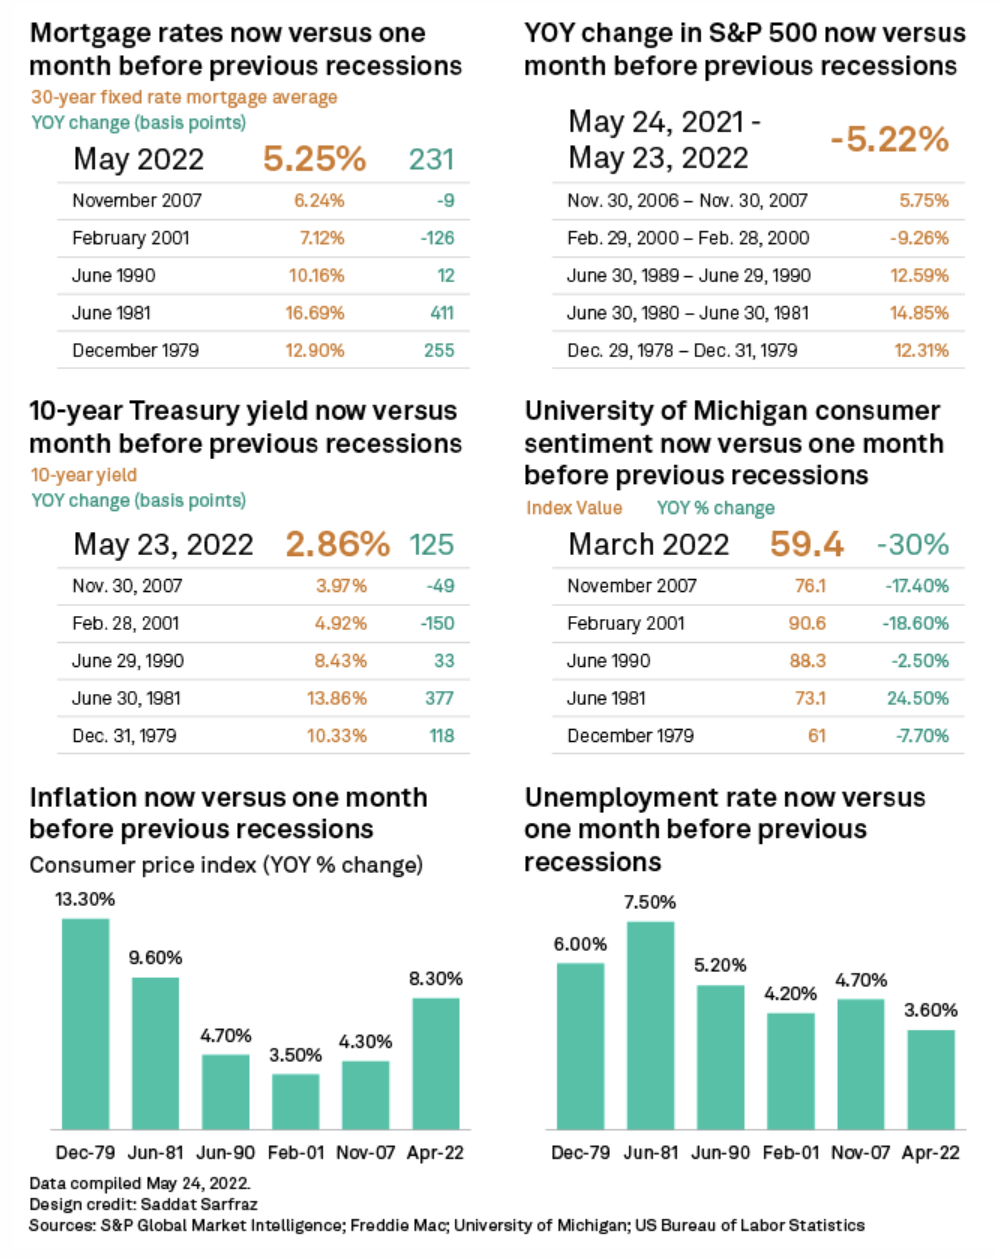
Fundamental: On Friday, participants will receive an update on inflation when consumer price data is released.
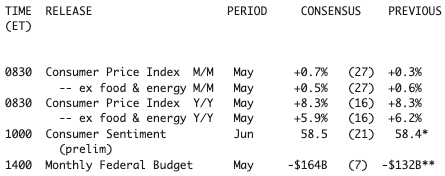
It is one of the Federal Reserve’s commitments to promote stable prices; the institution is aiming for a soft landing just as supply chains, higher prices, and borrowing costs, among other things, are cutting into growth.
“The Fed is in a major jam,” said Oren Klachkin of Oxford Economics. “They don’t want to let inflation spiral but they also don’t want to kill the expansion. Finding the middle ground between those is hard, and their tools are blunt, so the task before them is monumental.”
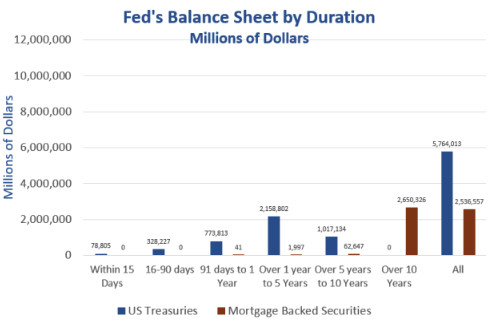
Last Wednesday marked the start of quantitative tightening (QT), a practice used to shrink the Fed’s balance sheet and amplify the effect of rate hikes, further cutting into financial conditions, “the mechanism through which the Fed [impacts] the real economy,” explains Dennis DeBusschere of 22V Research.
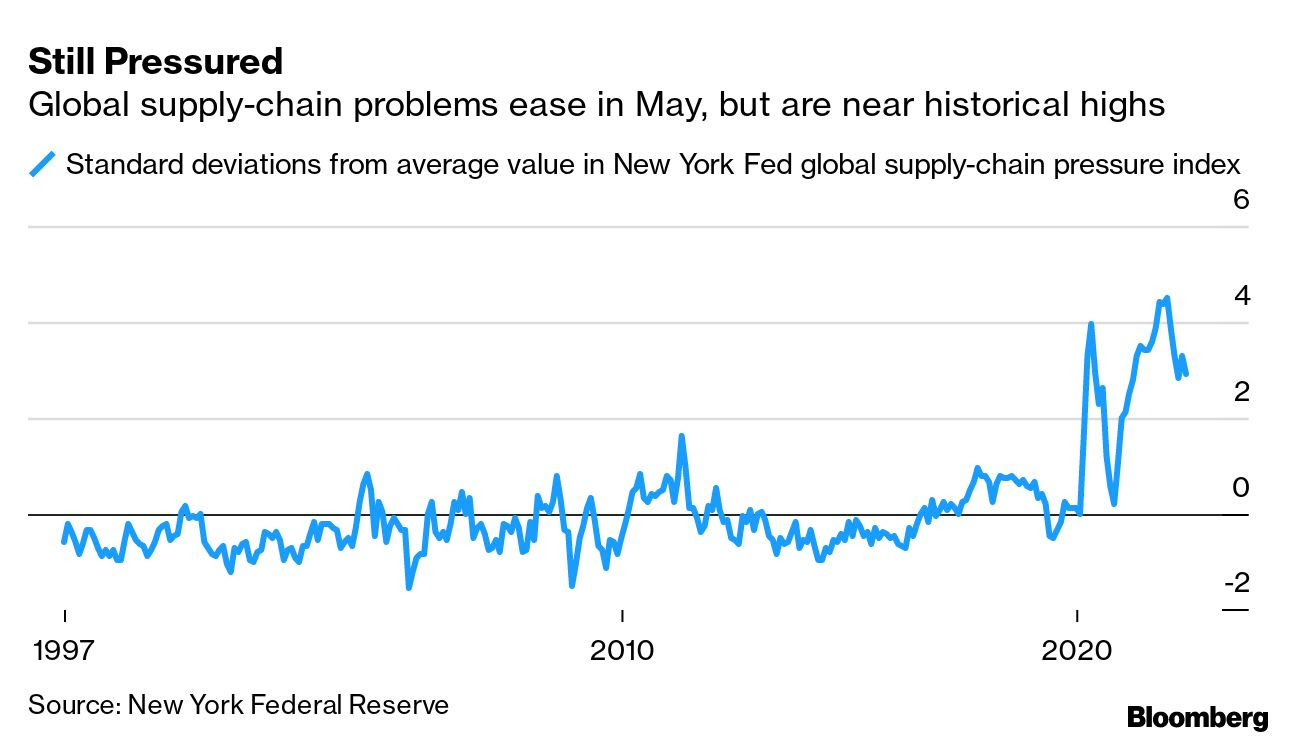
“If the data doesn’t slow, financial conditions will need to tighten more,” and this will play into less demand for goods and services, many of which (are continuing to) remain in short supply.
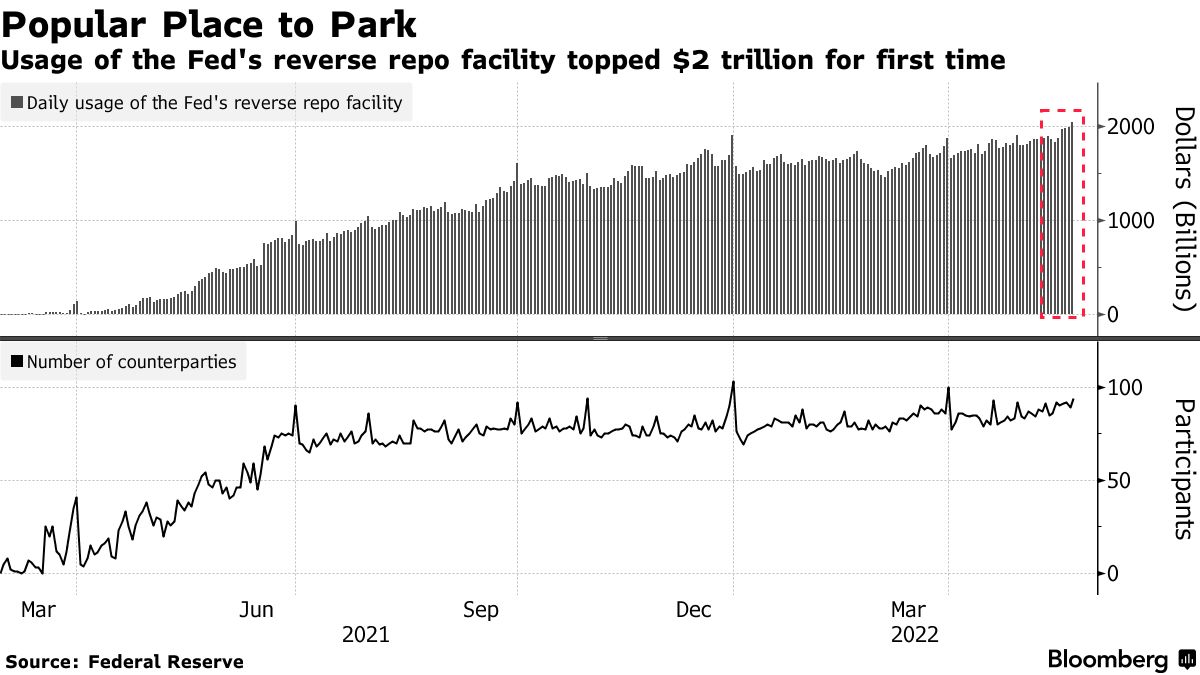
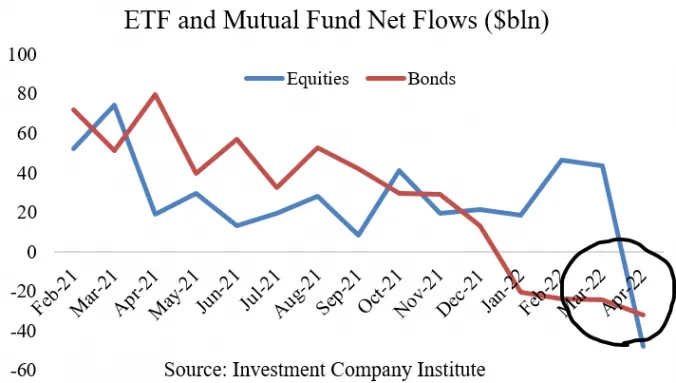
Accordingly, Joseph Wang, who was a trader at the Fed, explains well that cash, which has been spared from the market rout, is set to become scarcer.
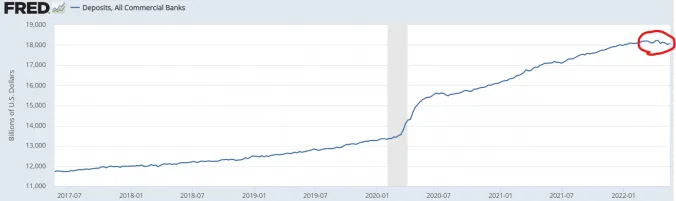
“Bonds are not acting as a hedge and appear to be becoming less ‘money’ like due persistent declines in price and elevated rate vol,” he said. “Investors in both bonds and stocks are reaching for cash by selling their assets, driving further asset price declines. For non-bank investors, ‘cash’ means bank deposits.”
Ultimately, an increase in the RRP (reverse repo) and QT (which is a direct flow of capital to capital markets) “would drain the pool of bank deposits by ~$1t by year-end,” and this may prompt investors to “continue to lower their selling prices to compete for the cash they want.”
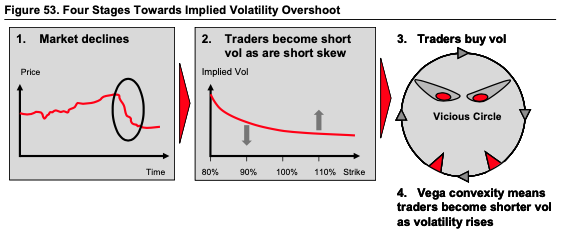
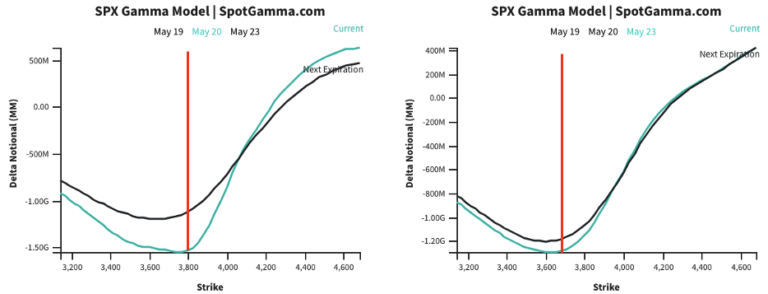
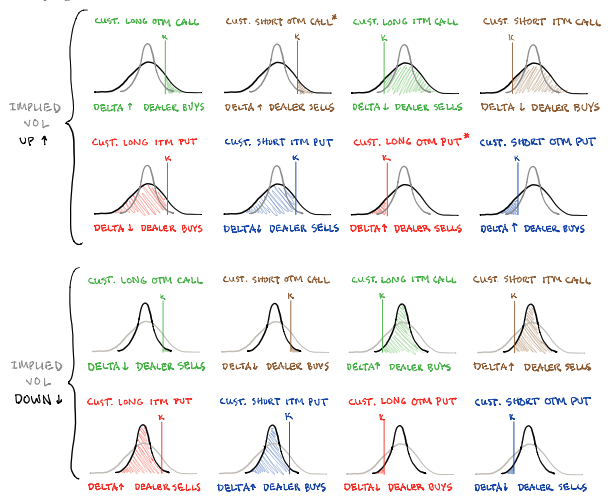
Positioning: Responsive trade is the status quo, as validated by SpotGamma’s Hedging Impact of Real-Time Options (HIRO) indicator.
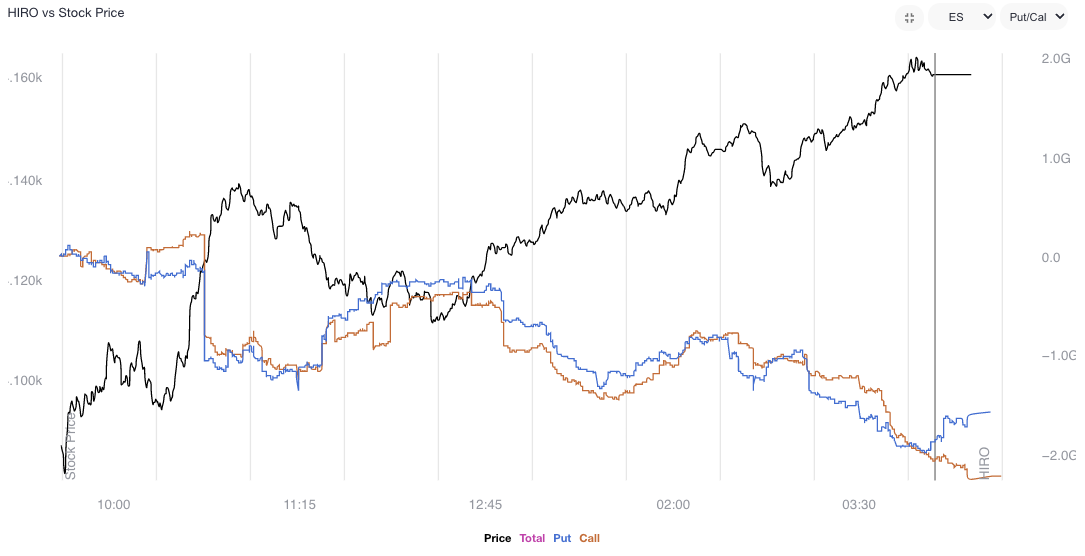
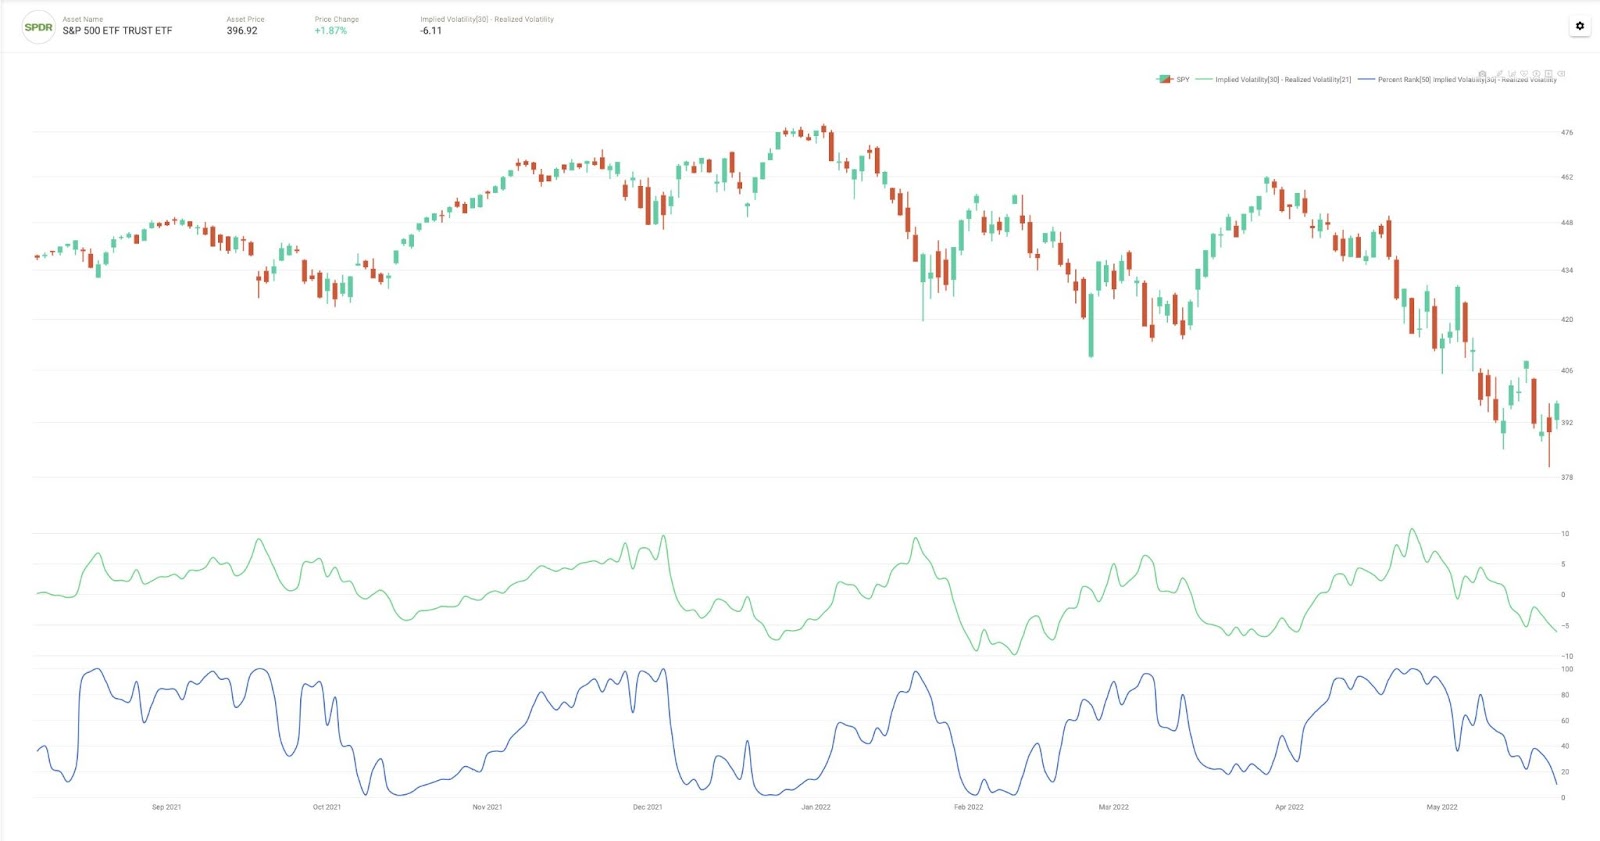
Accordingly, measures of implied volatility, based on supply and demand dynamics talked about in the past, are falling from already low levels, and thus, the marginal impact of further volatility compression does less to bolster equity market upside.
To note the Cboe VVIX Index (INDEX: VVIX), the expected volatility of the 30-day forward price of the VIX or the volatility of volatility (a naive but useful measure of skew), dropped off largely, too, in comparison to the VIX, itself.

Given this all, SpotGamma suggests ultra-short-dated volatility, before the Federal Open Market Committee (FOMC) meeting, is likely to be sold, further depressing the front-end of the term structure while the “proceeds of that trade are funneled into farther-dated post-FOMC volatility.”
In other words, participants could sell short-dated volatility for exposure to that which is farther dated and, even, non-linear with respect to changes in delta (gamma) and vega (volga).
Ultimately, such a structure would assist participants in lowering the cost of directional exposure.
More to come in future commentaries.
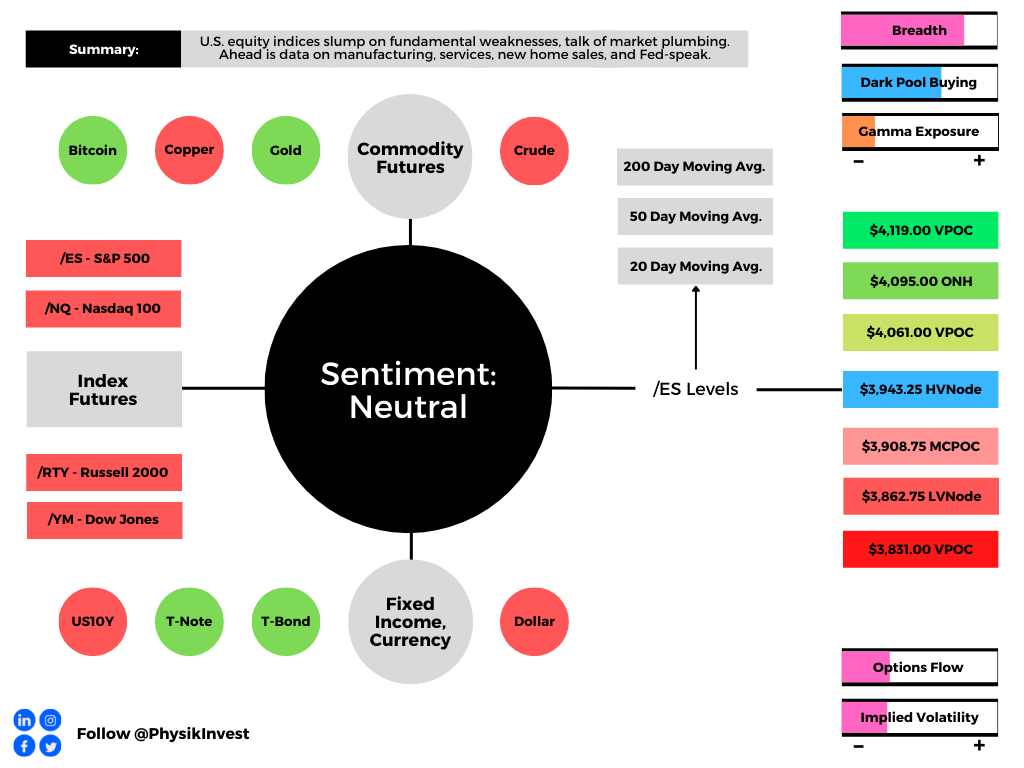
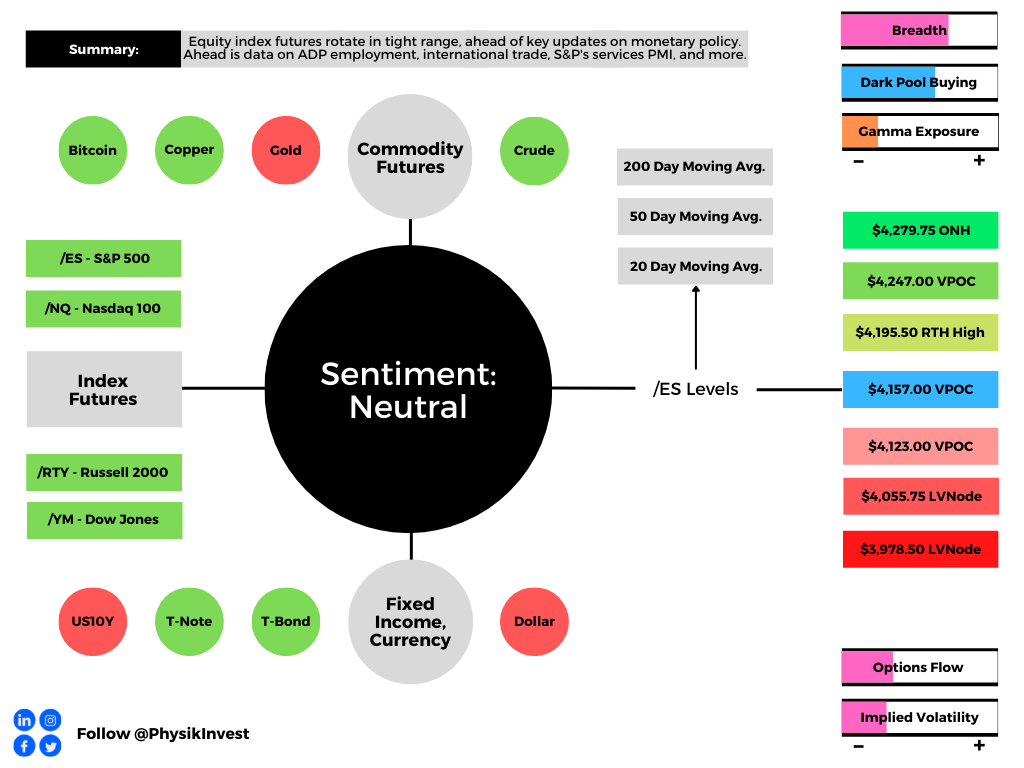
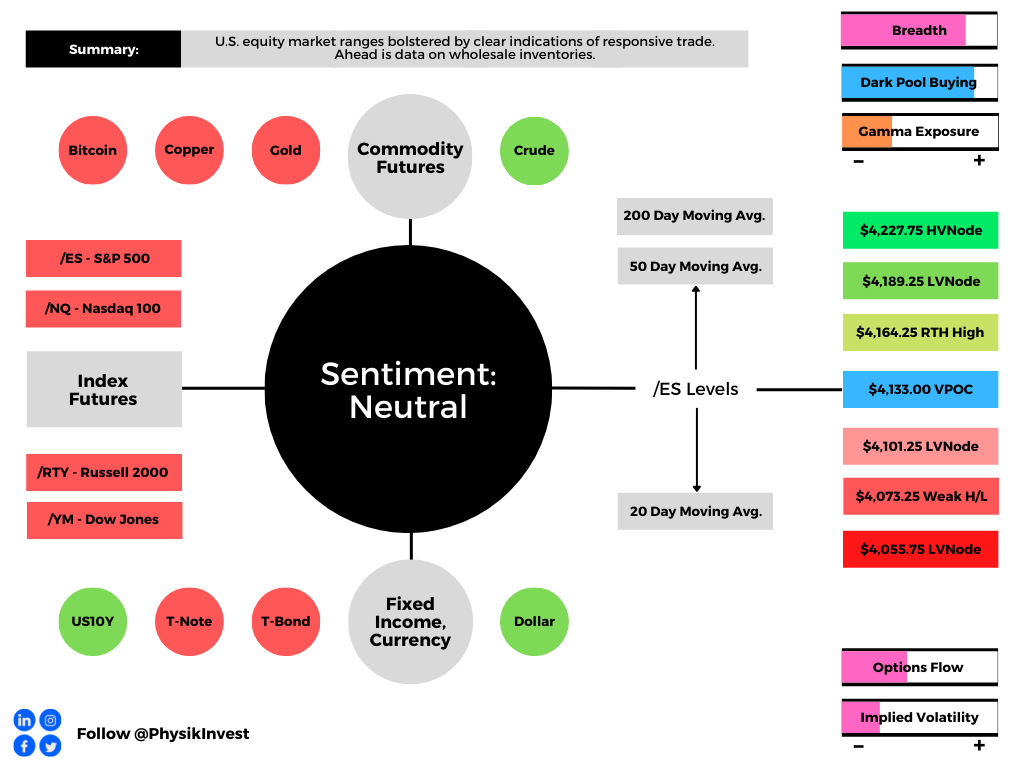
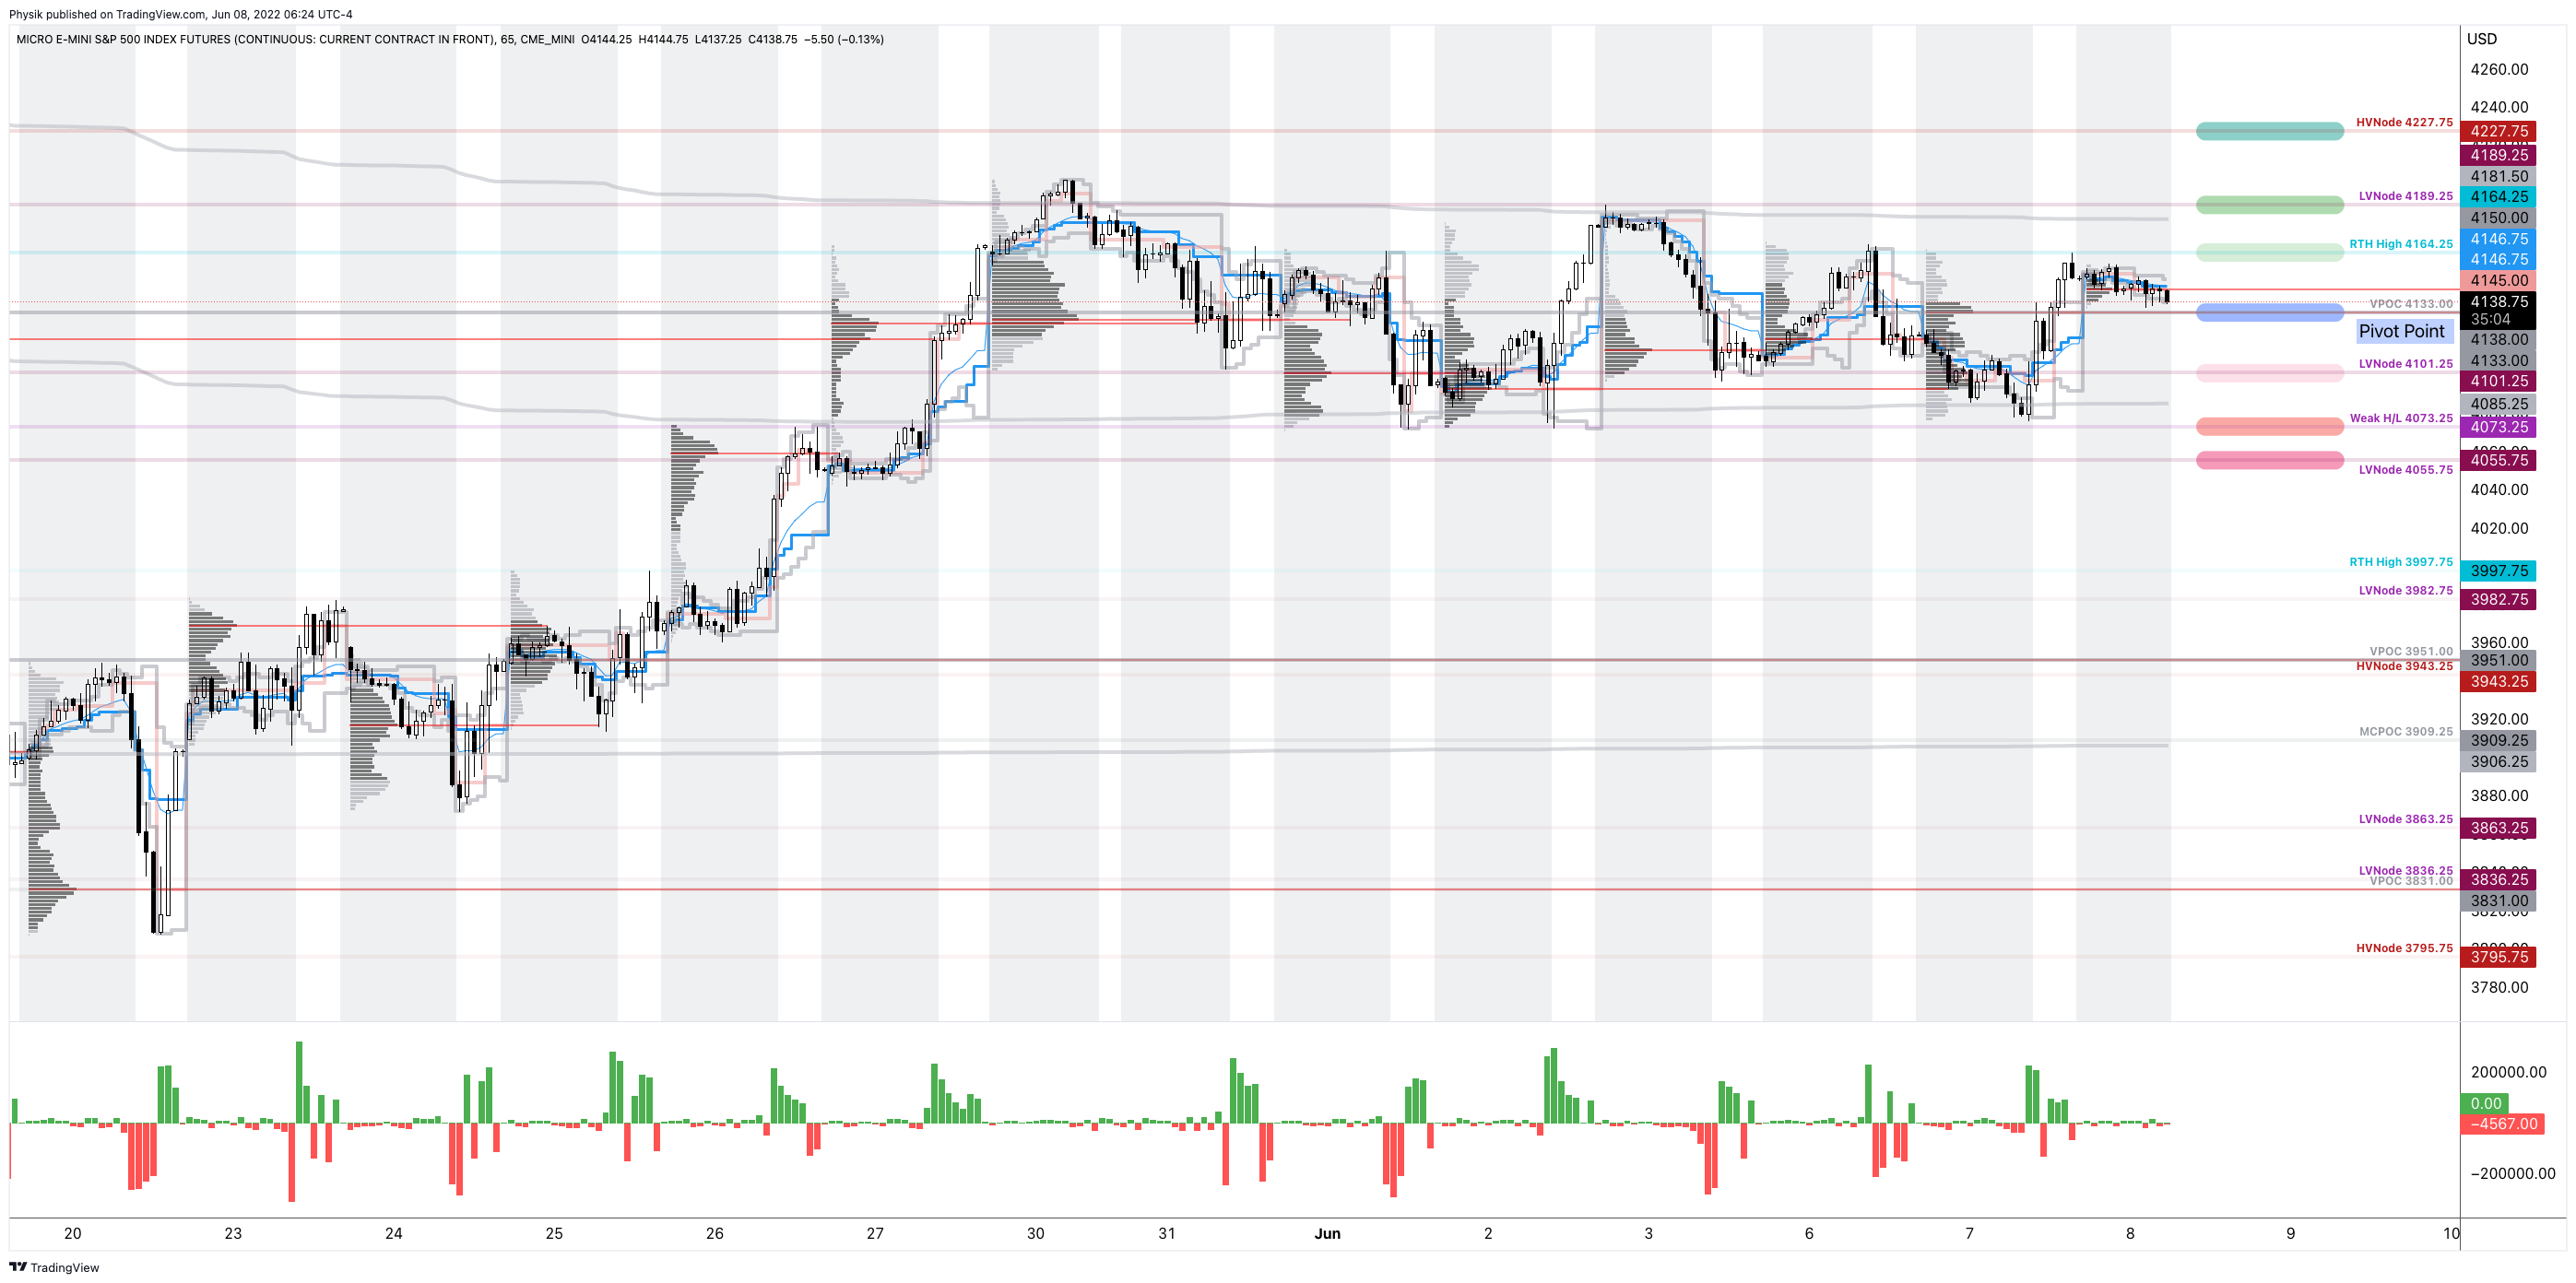
Technical: As of 6:30 AM ET, Wednesday’s regular session (9:30 AM – 4:00 PM ET), in the S&P 500, will likely open in the lower part of a negatively skewed overnight inventory, inside of prior-range and -value, suggesting a limited potential for immediate directional opportunity.
In the best case, the S&P 500 trades higher; activity above the $4,133.00 VPOC puts in play the $4,164.25 RTH High. Initiative trade beyond the RTH High could reach as high as the $4,189.25 LVNode and $4,227.75 HVNode, or higher.
In the worst case, the S&P 500 trades lower; activity below the $4,133.00 VPOC puts in play the $4,101.25 LVNode. Initiative trade beyond the LVNode could reach as low as the $4,073.25 Weak H/L and $4,055.75 LVNode, or lower.
Click here to load today’s key levels into the web-based TradingView charting platform. Note that all levels are derived using the 65-minute timeframe. New links are produced, daily.
Definitions
Volume Areas: A structurally sound market will build on areas of high volume (HVNodes). Should the market trend for long periods of time, it will lack sound structure, identified as low volume areas (LVNodes). LVNodes denote directional conviction and ought to offer support on any test.
If participants were to auction and find acceptance into areas of prior low volume (LVNodes), then future discovery ought to be volatile and quick as participants look to HVNodes for favorable entry or exit.
POCs: POCs are valuable as they denote areas where two-sided trade was most prevalent in a prior day session. Participants will respond to future tests of value as they offer favorable entry and exit.
About
After years of self-education, strategy development, mentorship, and trial-and-error, Renato Leonard Capelj began trading full-time and founded Physik Invest to detail his methods, research, and performance in the markets.
Capelj also develops insights around impactful options market dynamics at SpotGamma and is a Benzinga reporter.
Some of his works include conversations with ARK Invest’s Catherine Wood, investors Kevin O’Leary and John Chambers, FTX’s Sam Bankman-Fried, Kai Volatility’s Cem Karsan, The Ambrus Group’s Kris Sidial, among many others.
Disclaimer
In no way should the materials herein be construed as advice. Derivatives carry a substantial risk of loss. All content is for informational purposes only.