The daily brief is a free glimpse into the prevailing fundamental and technical drivers of U.S. equity market products. Join the 850+ that read this report daily, below!
Fundamental
In the past weeks and days, China and Taiwan tensions have seemingly worsened. Headlines this morning include China “simulating attacks on U.S. Navy ships,” and “Taiwan shoots down drone showing risk of escalation with China.”
This is all the while the conflict between Russia and Ukraine continues to rage, bolstering the structural issues contributing to the longer-lasting inflation we discussed on August 3 (HERE).
In that August 3 letter, we cited Credit Suisse Group AG’s (NYSE: CS) Zoltan Pozsar on his perspectives regarding the weakening of “the pillars of the globalized, low inflation world.”
Since then, Pozsar wrote another note titled “War and Industrial Policy,” published on August 24 (HERE), alleging a “messy divorce” ongoing between large powers like the US and China.
For instance, the note said: “Pentagon chief’s calls to China go unanswered amid Taiwan crisis.”
Yikes! Let’s unpack what’s going on a bit, further.
Basically, it’s the case that powers like Russia became “rich selling cheap gas” to countries like Germany who became “rich selling expensive stuff produced with cheap gas,” the note says.
Per Andreas Steno Larsen, now, countries like Germany are in a precarious position.
It’s possible that the country “will likely make it through winter unless Russia 1) halts the gas flow completely and 2) the winter is extremely severe.”
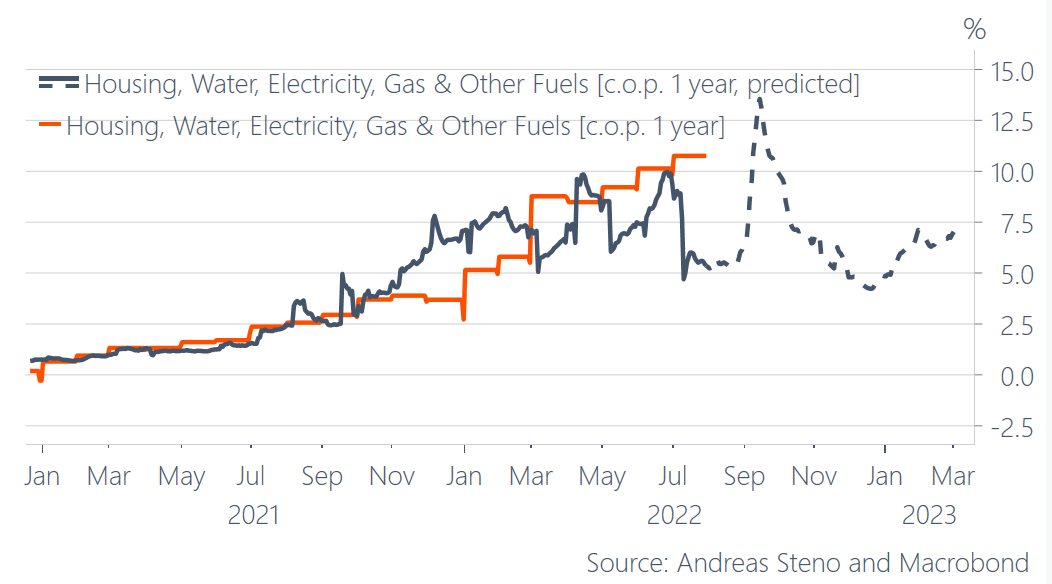
No matter what, the “Germany economy will take a hit, … [and], given current forward prices, we are looking at CPI numbers well above 10% y/y. In France and Spain, that picture is even worse with numbers above 15% y/y.”
To dampen the impact of this inflation, countries like Denmark have resorted to “handing checks out almost randomly,” which does less to take from “inflationary pressures down the road.”
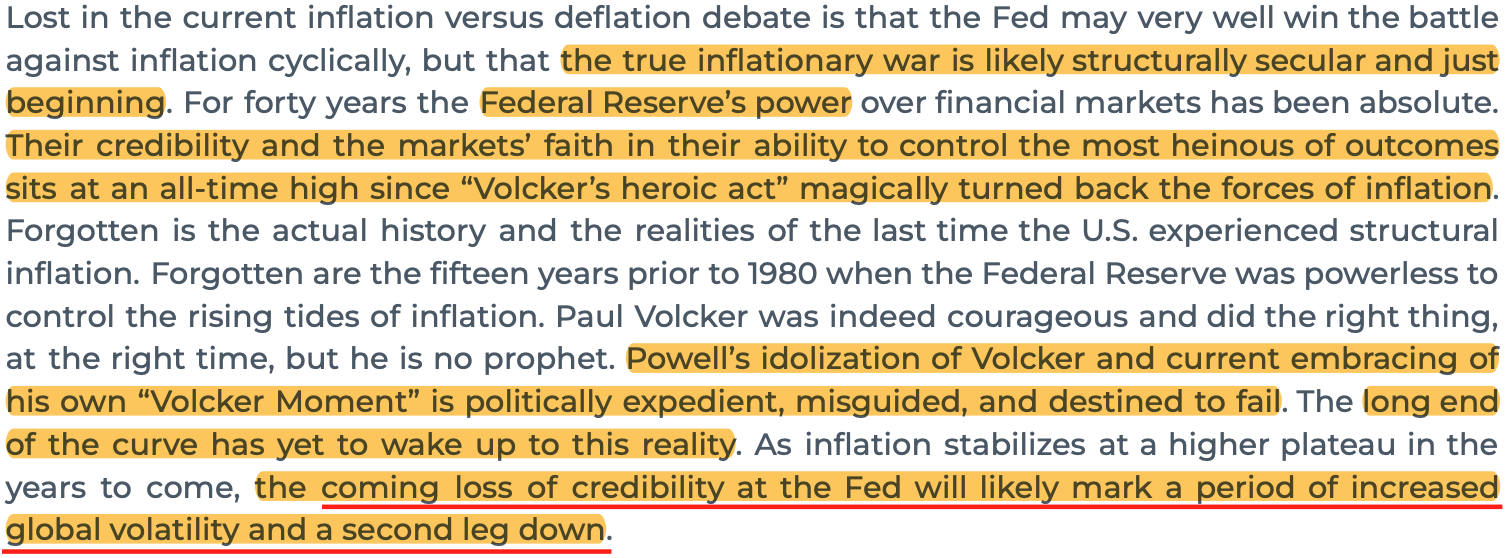
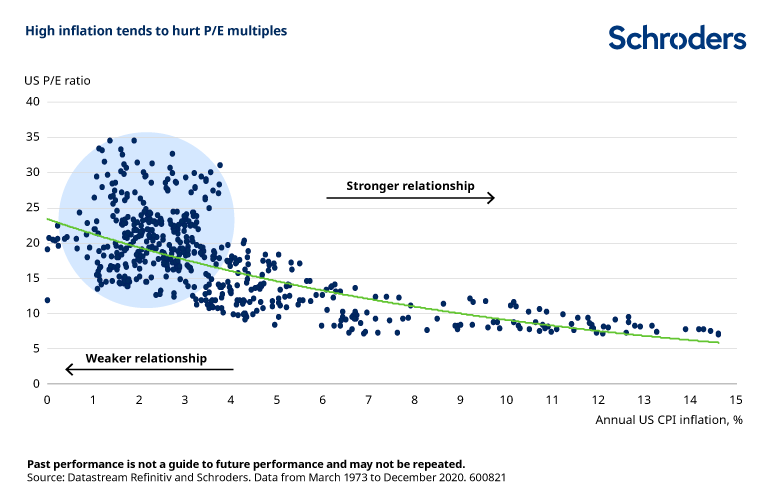
In short, via de-globalization and populism, “the pillars of the low inflation world are changing,” per Pozsar and, the recourse, now, is a fight via asset price deflation, put forth on August 3.
In other words, de-globalization and populism have prompted an “inward shift of supply curves across multiple fronts (labor, goods, and commodities).” Accordingly, the economy is on a path that is “L”-shaped (i.e., vertical drop in activity via recession, and flatline for a period of time as rates remain higher for longer to prevent a sharp rise in inflation, again).
As Pozsar summarises: “we [have] to generate a big, “L”-shaped recession to slow inflation down; we [have] to generate a round of negative wealth effects to lower demand such that it becomes more in line with the new realities of supply.”
Separately, a Minsky Moment looms, Pozsar said.
“Minsky moments are triggered by excessive financial leverage, and in the context of supply chains, leverage means excessive operating leverage: in Germany, $2 trillion of value added depends on $20 billion of gas from Russia…that’s 100-times leverage – more than Lehman’s.”
Moreover, it is the case that, ultimately, after inflation is reduced, a “recovery [will be driven by] fiscally funded industrial policy” that:
(1) Re-arms (to defend the world order); (2) re-shores (to get around blockades); (3) re-stocks and invests (commodities); (4) re-wires the grid (energy transition).
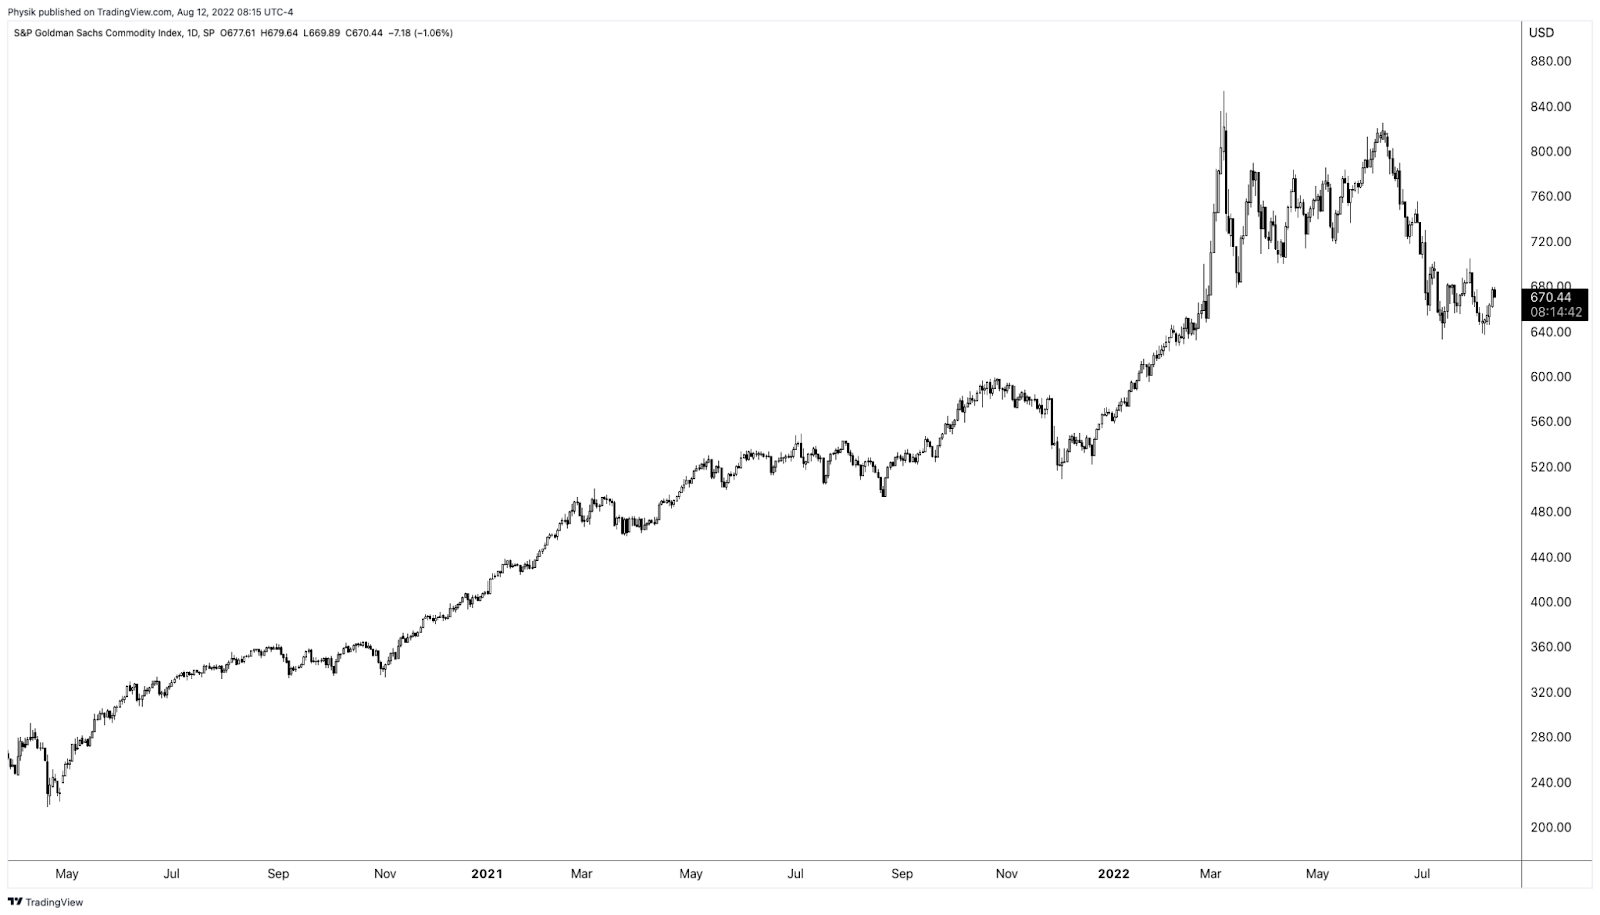
With that in mind, Pozsar ends that there will likely be a commodity supercycle that is part of a new regime, Bretton Woods III. Read the full note, here, and/or listen to the below podcast.
Positioning
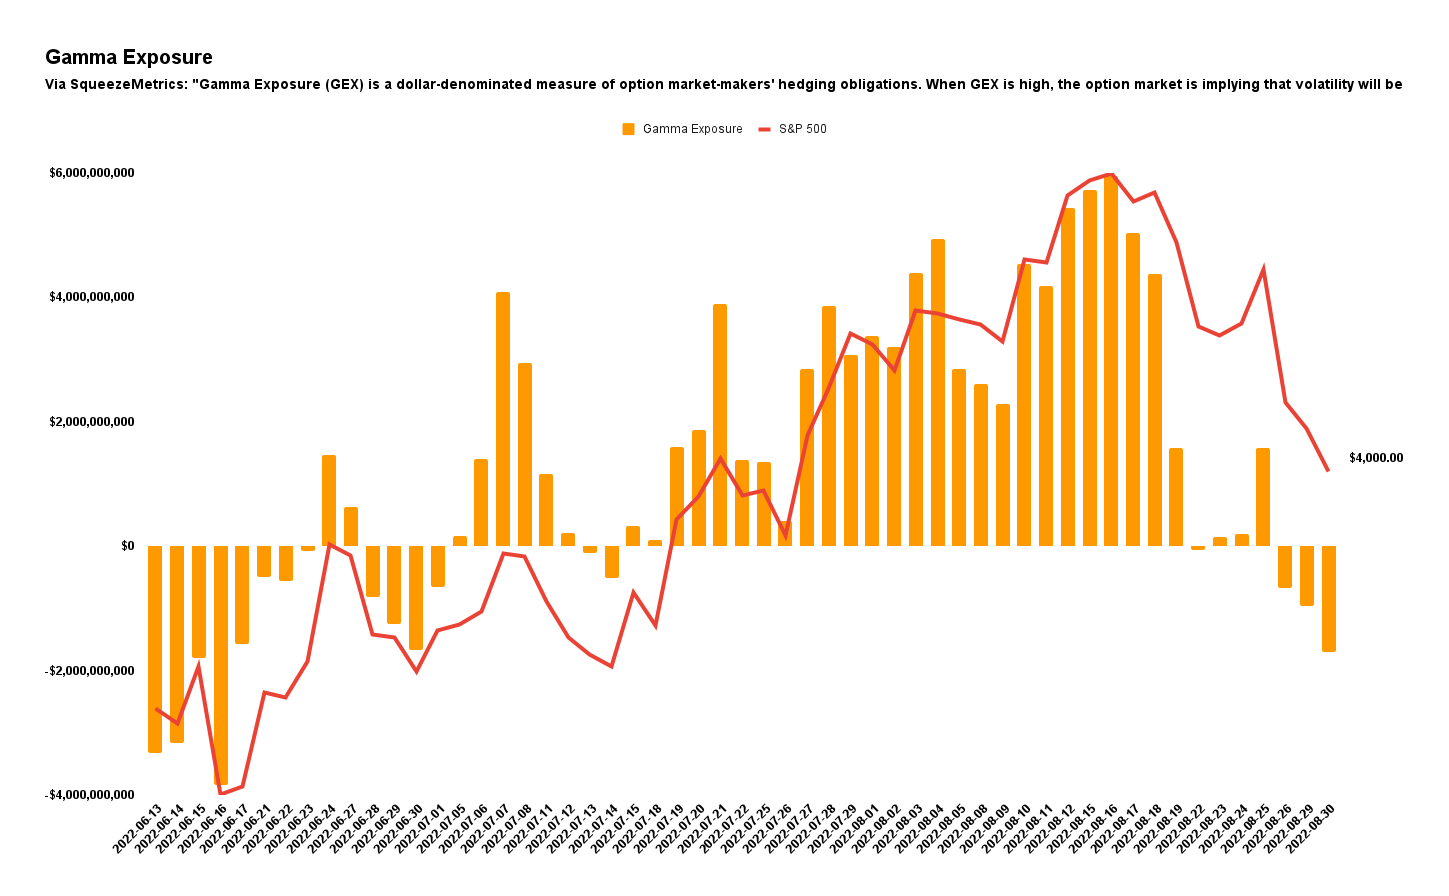
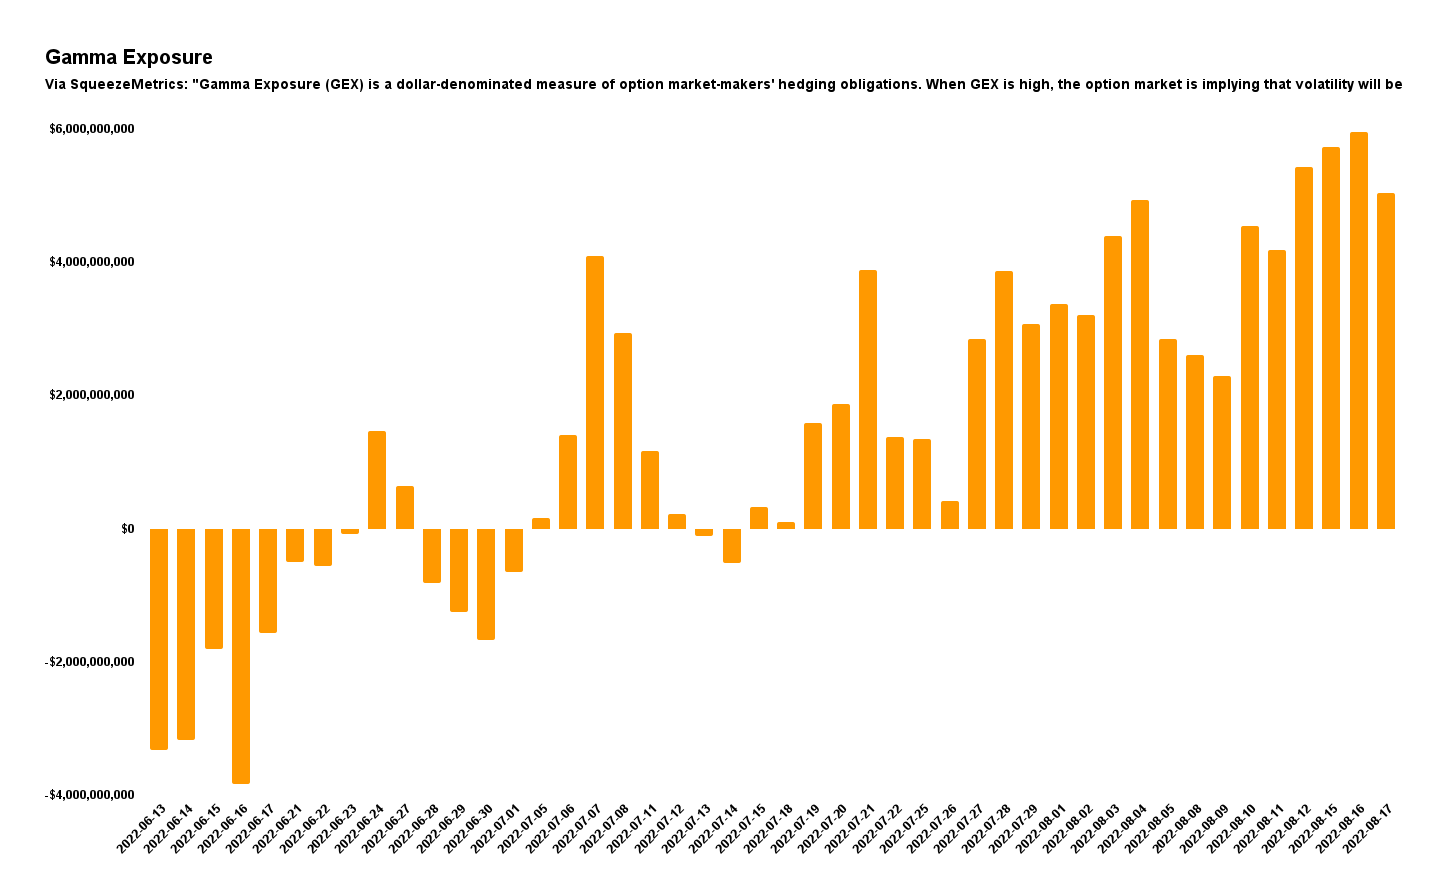
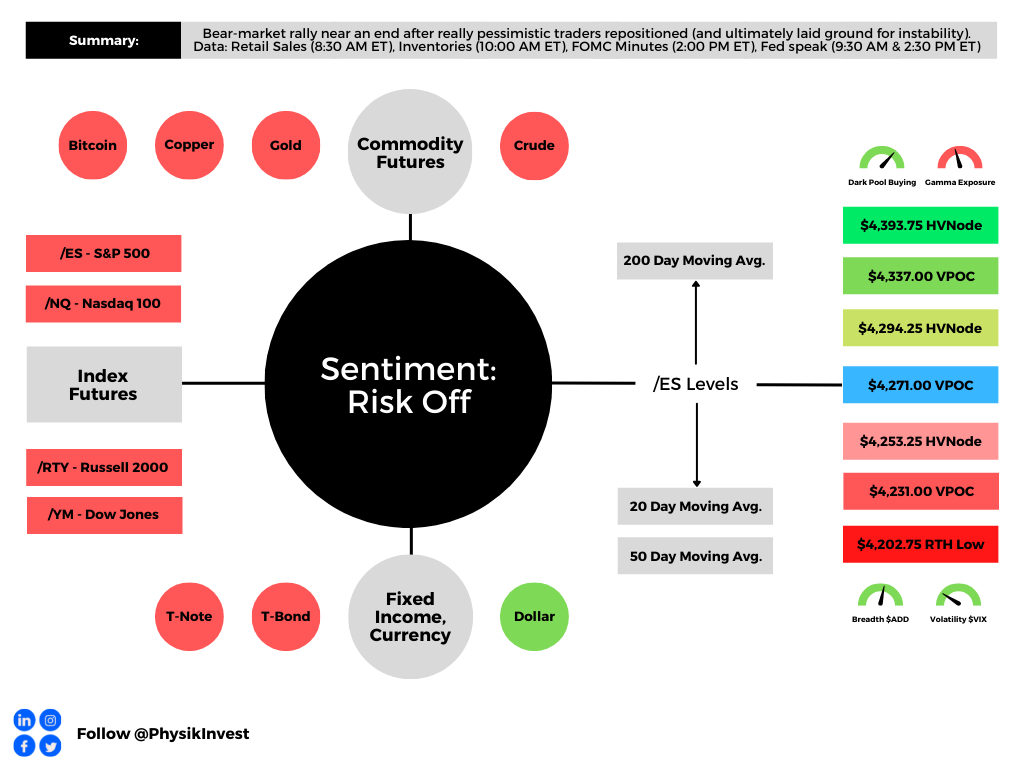
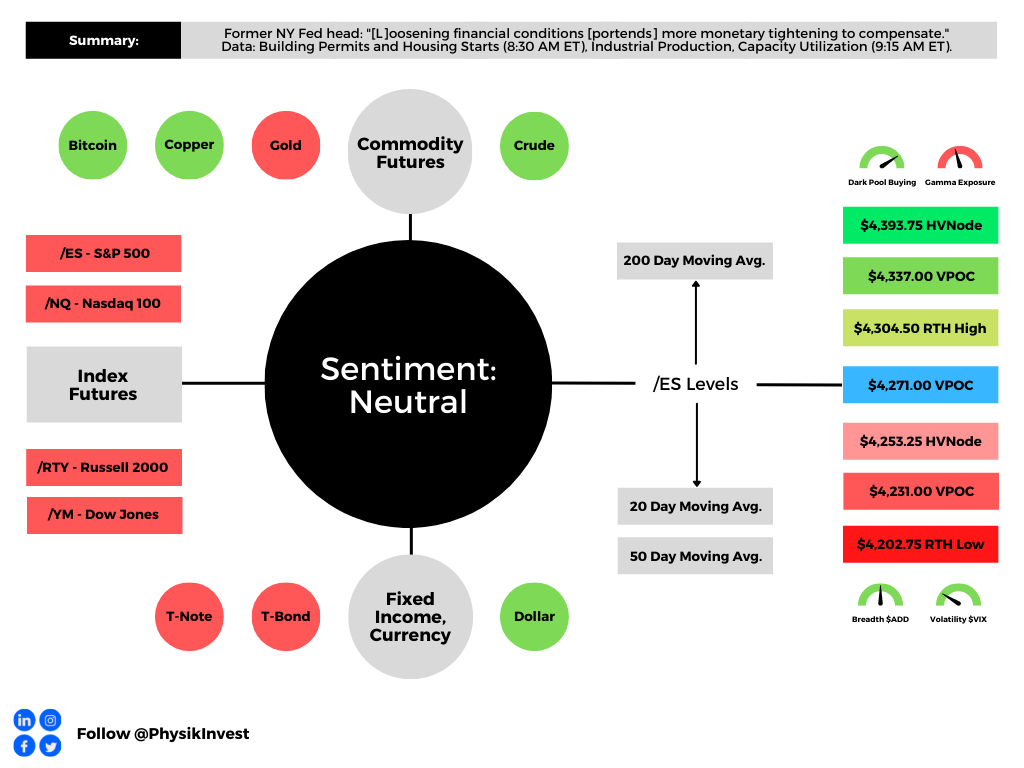
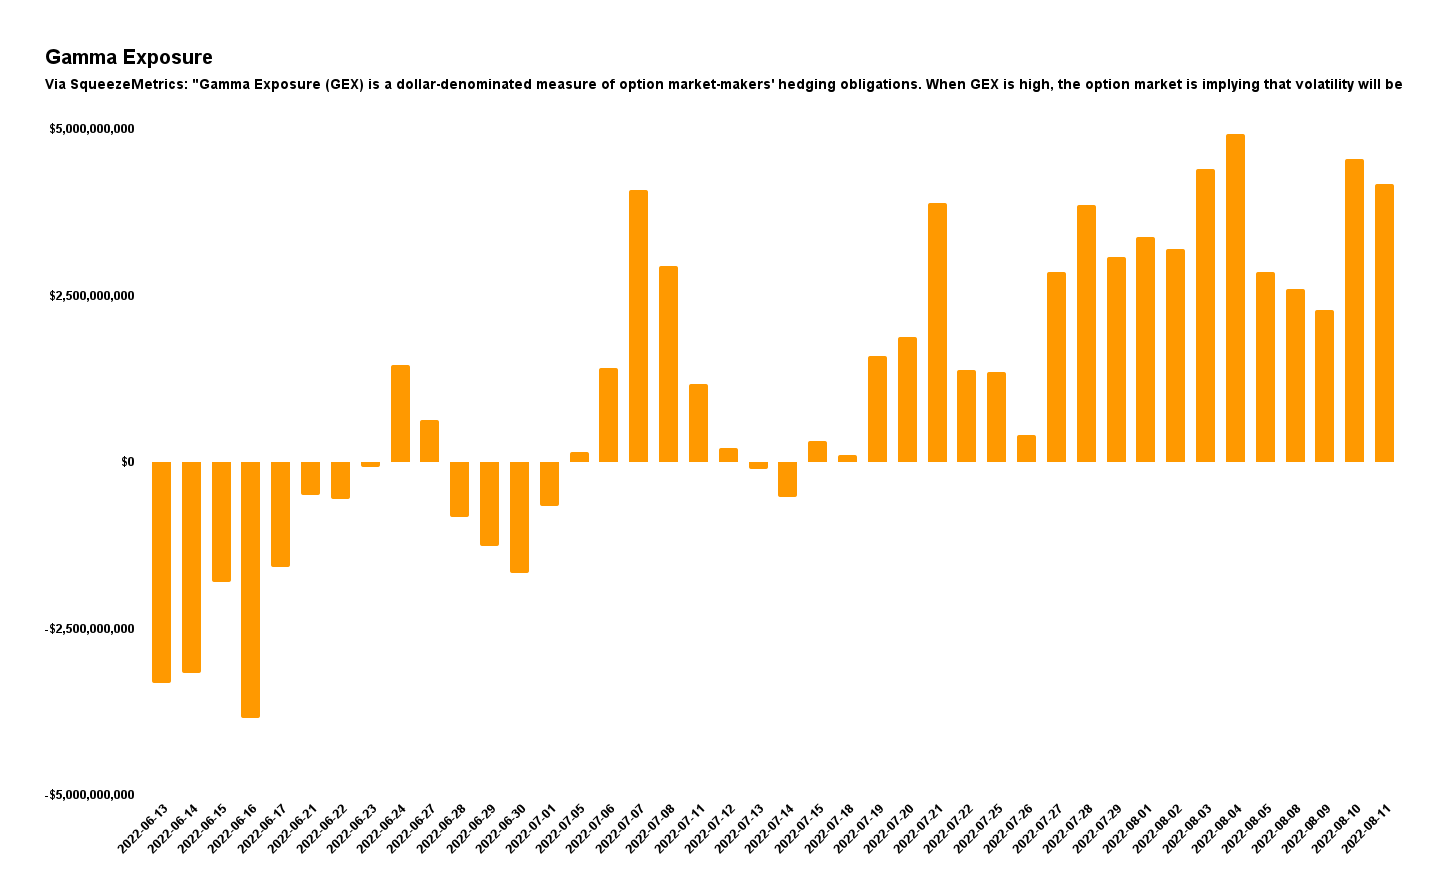
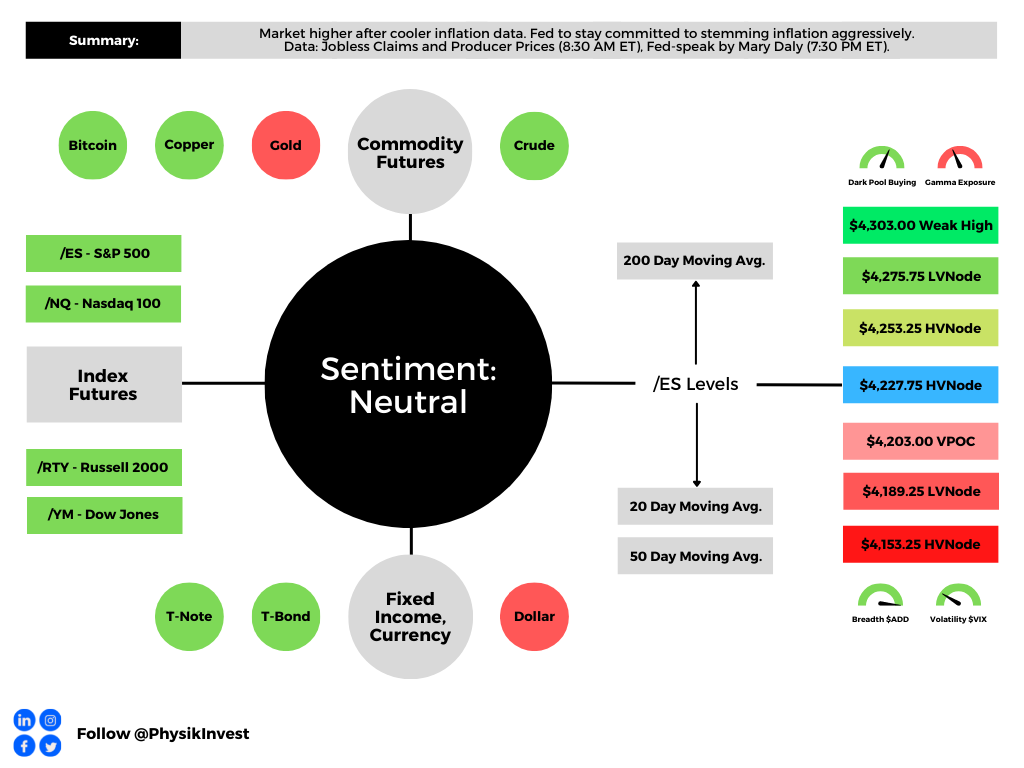
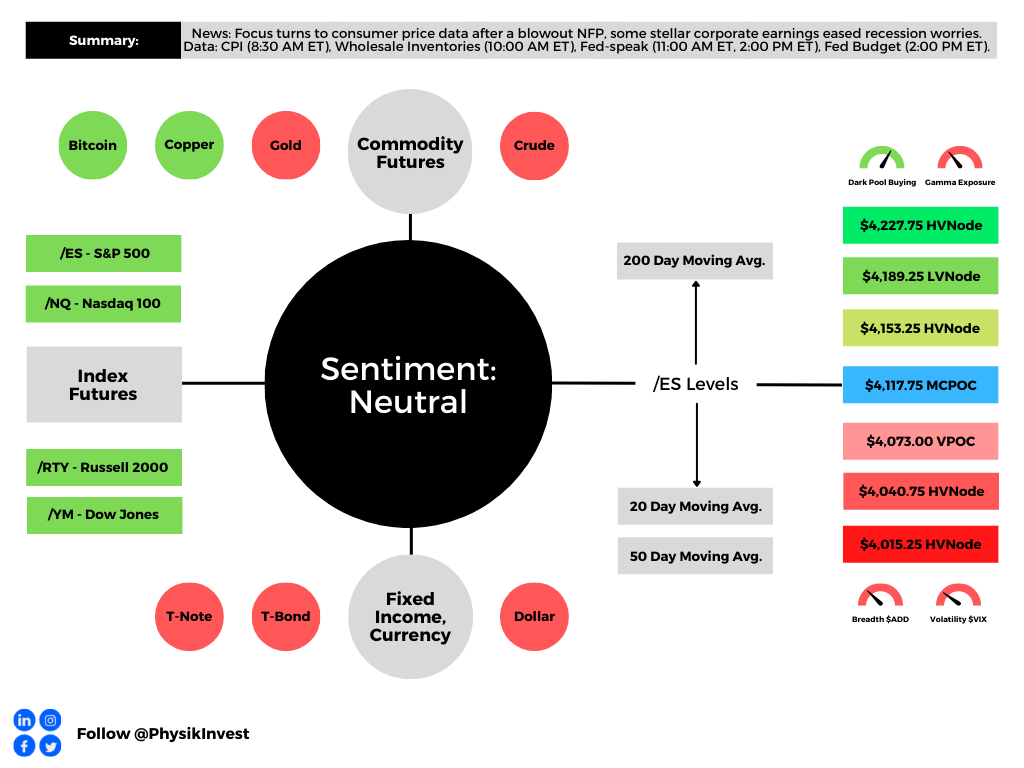
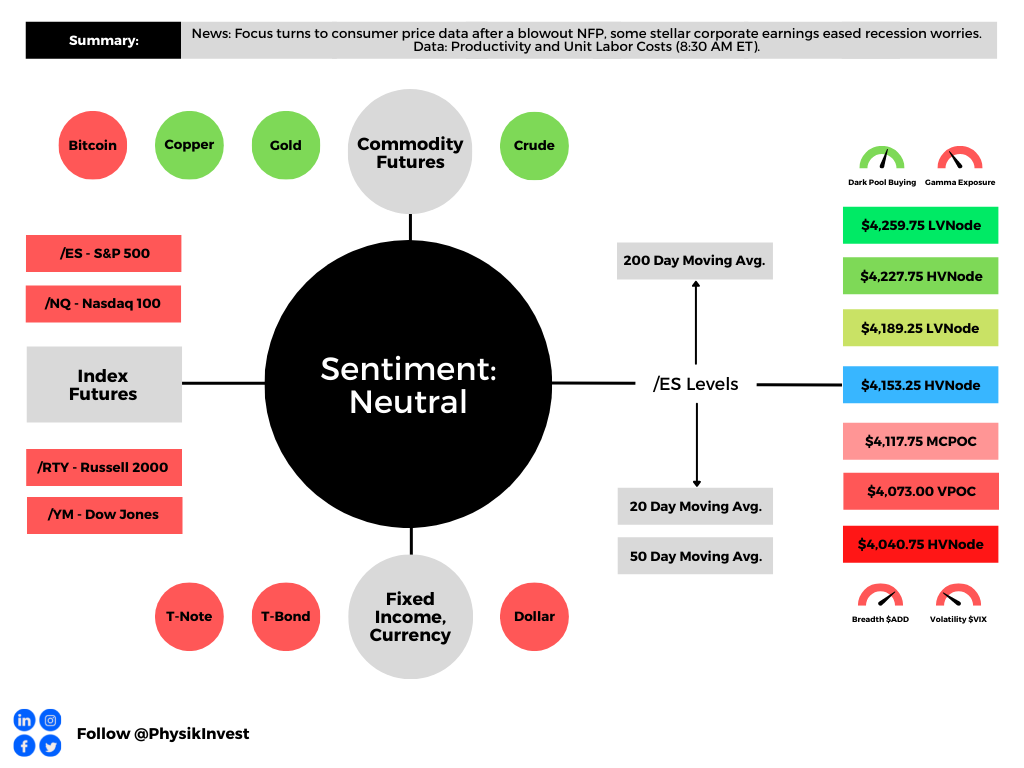
As of 6:35 AM ET, Thursday’s expected volatility, via the Cboe Volatility Index (INDEX: VIX), sits at ~1.42%. Gamma exposures falling, at an increasing pace, may add to ranges and pressure.
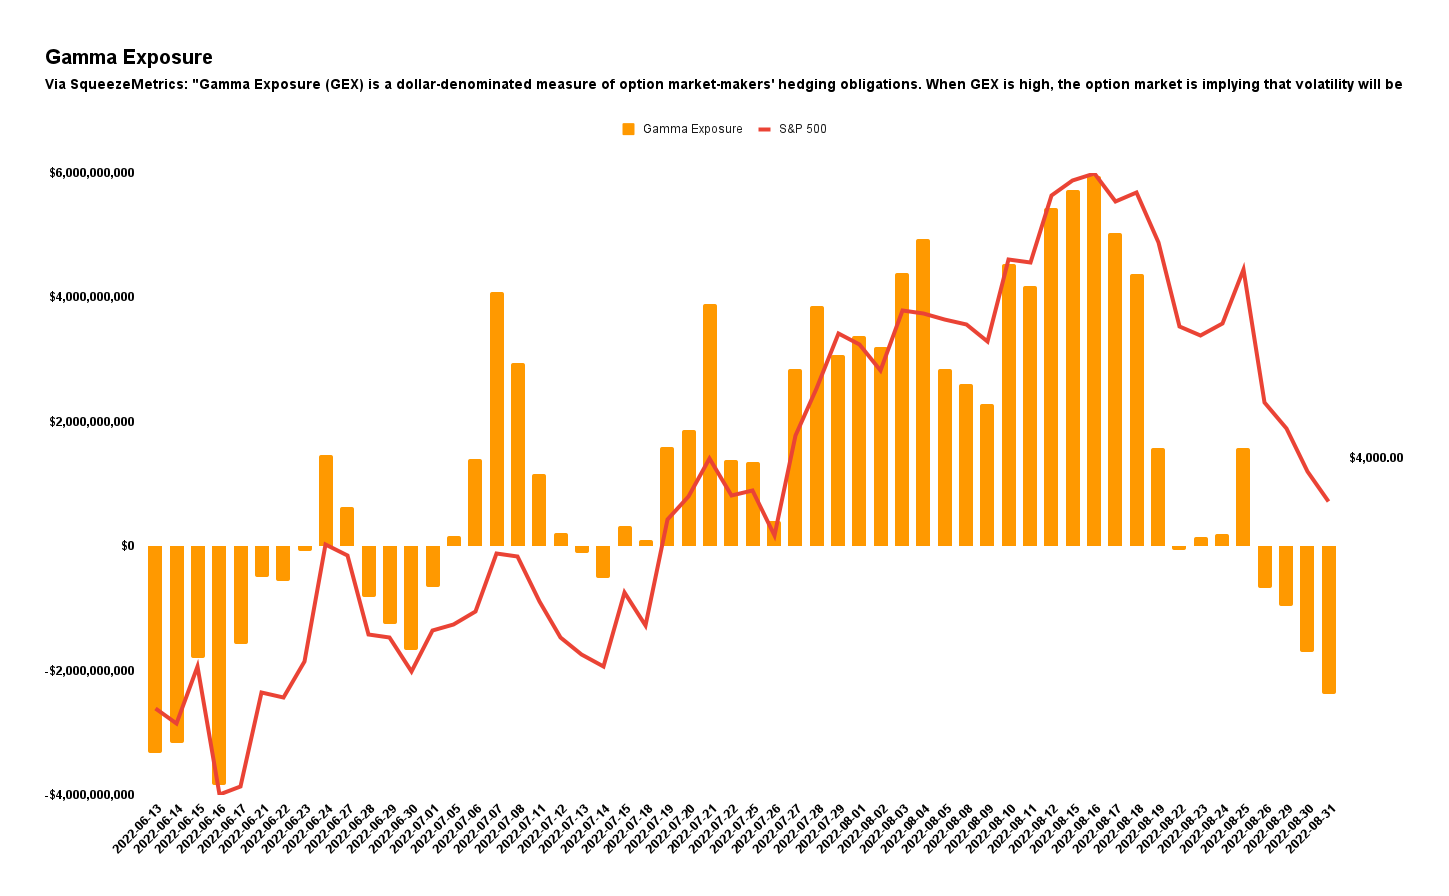
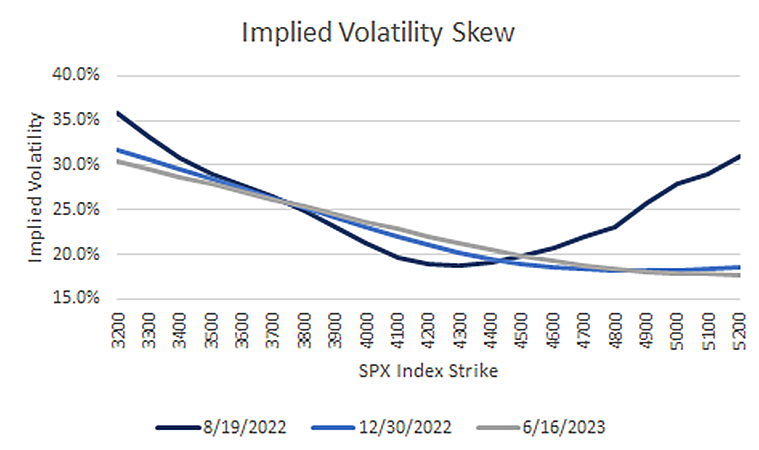
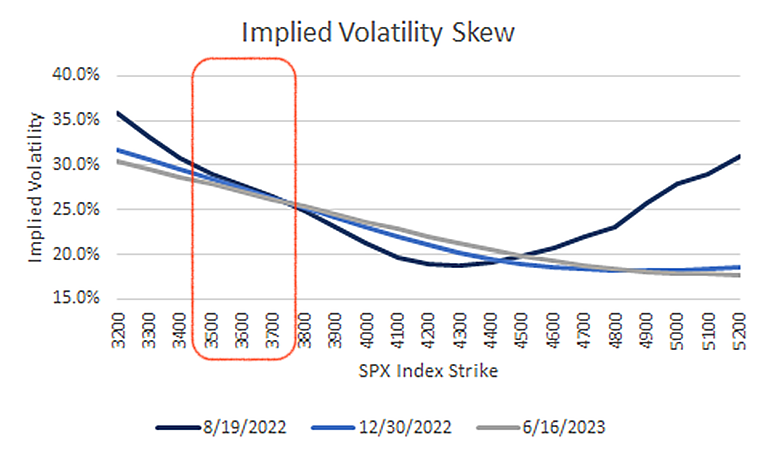
As discussed thoroughly in our August 31 (HERE) and August 18 (HERE) letters, our analyses had us structuring spreads against the $3,700.00-$3,500.00 area in the S&P 500 (INDEX: SPX).
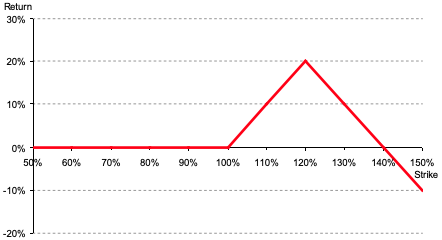
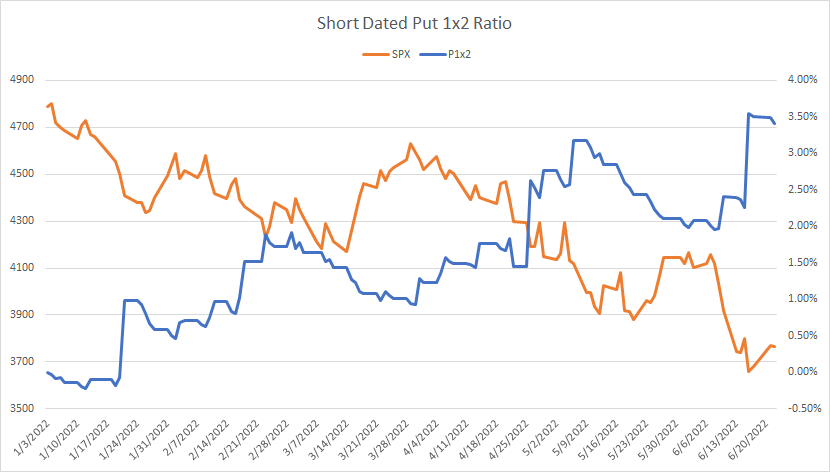
To quote the August 18 letter, it was “beneficial to be a buyer of options structures to protect against (potential) downside (e.g., S&P 500 [INDEX: SPX] +1 x -2 Short Ratio Put Spread | 200+ Points Wide | 15-30 DTE | @ $0.00 or better).”
This trade is near-finished and it is time to monetize (i.e., closing and converting a position to cash) as there is a risk of losing the Deltas built up this decline on a fast move higher, should one probably occur here, soon, with the S&P 500 trading into a key support zone we outlined.
In short, it is beneficial to be a seller of those options structures (e.g., S&P 500 [INDEX: SPX] -1 x +2 Ratio Put Spread | 200+ Points Wide | 15-30 DTE).
Note: Trades Renato has personally taken remain to be unpacked in subsequent commentaries. Both the mistakes and successes, as well as what to do better.
Technical
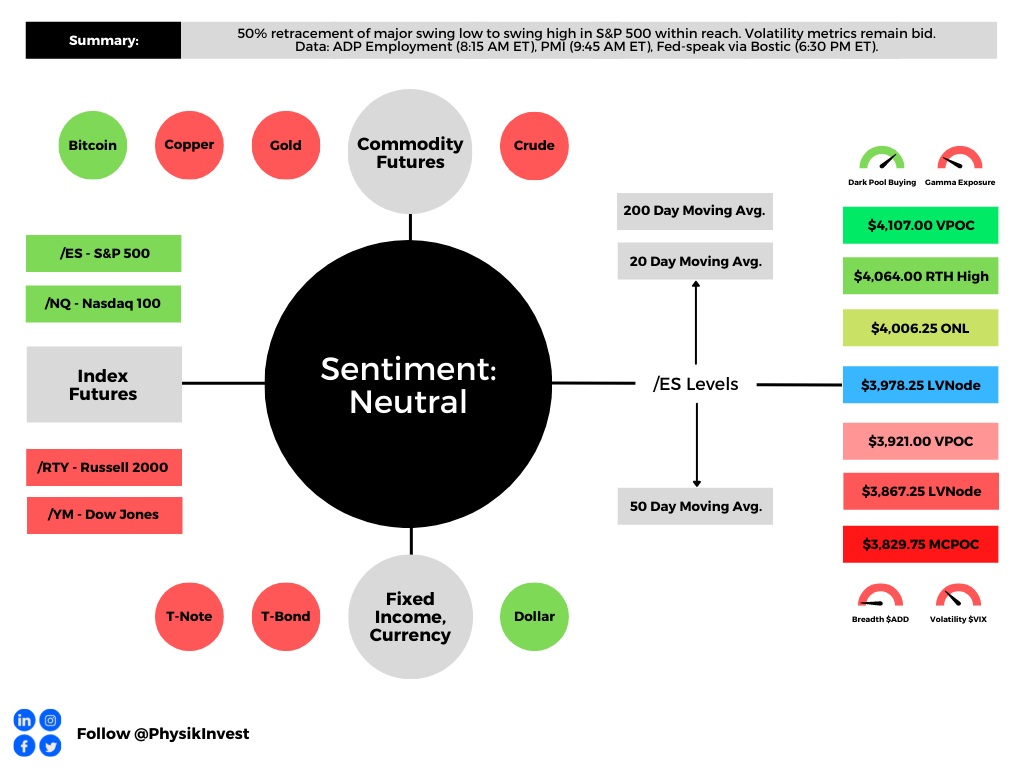
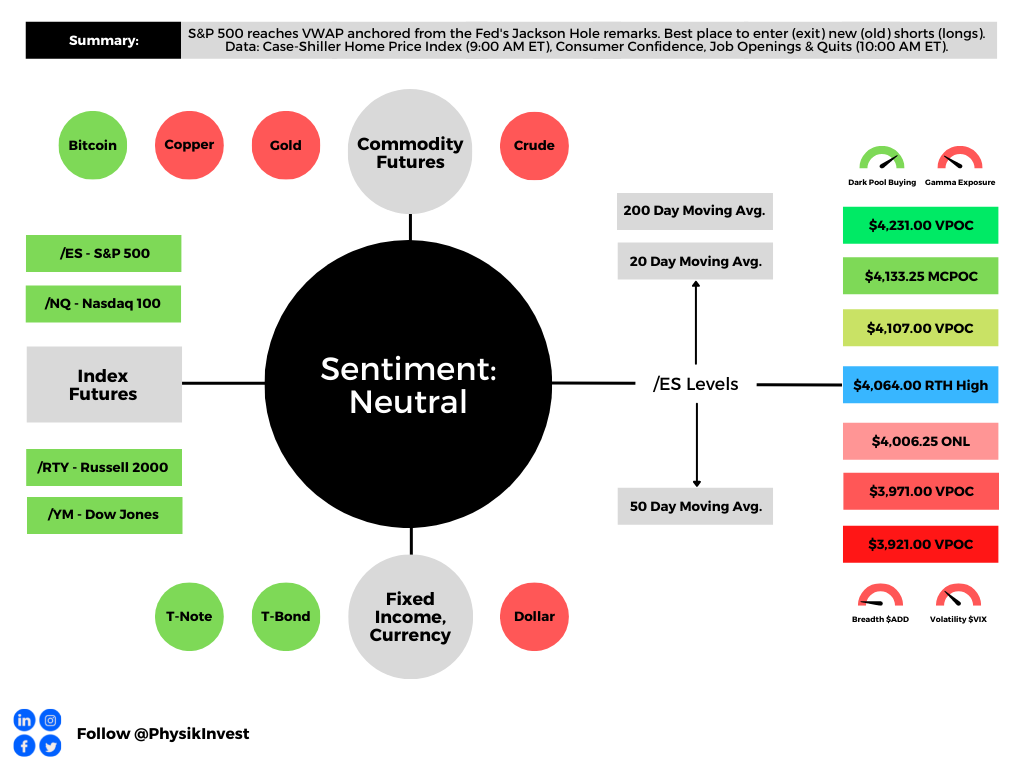
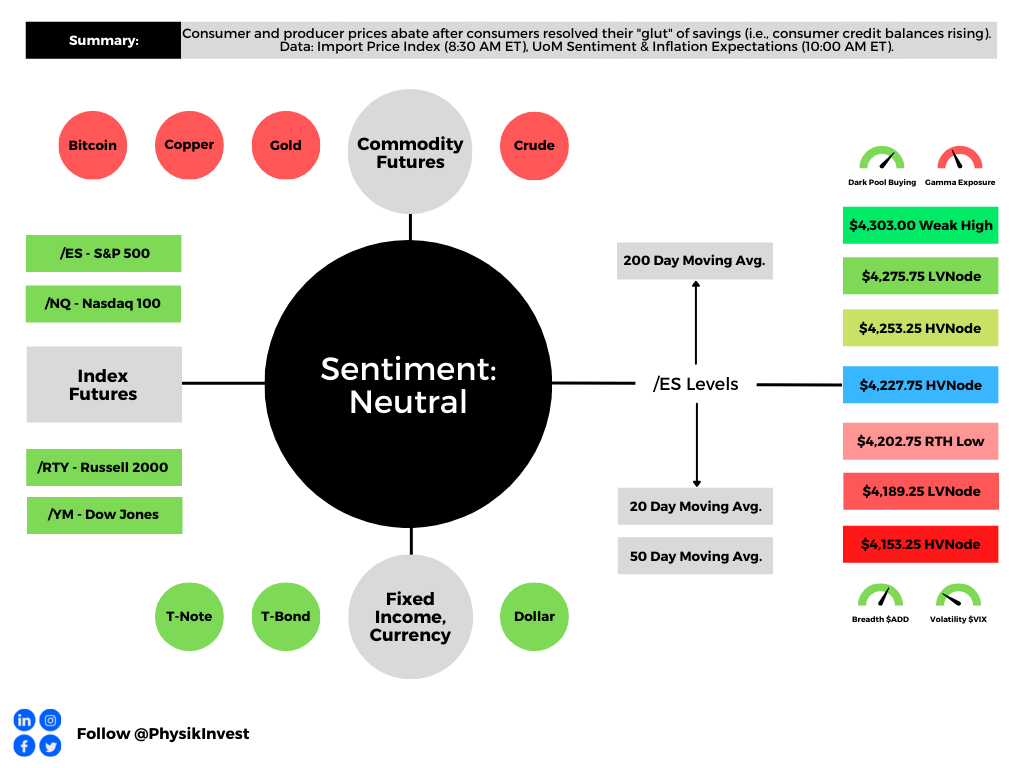
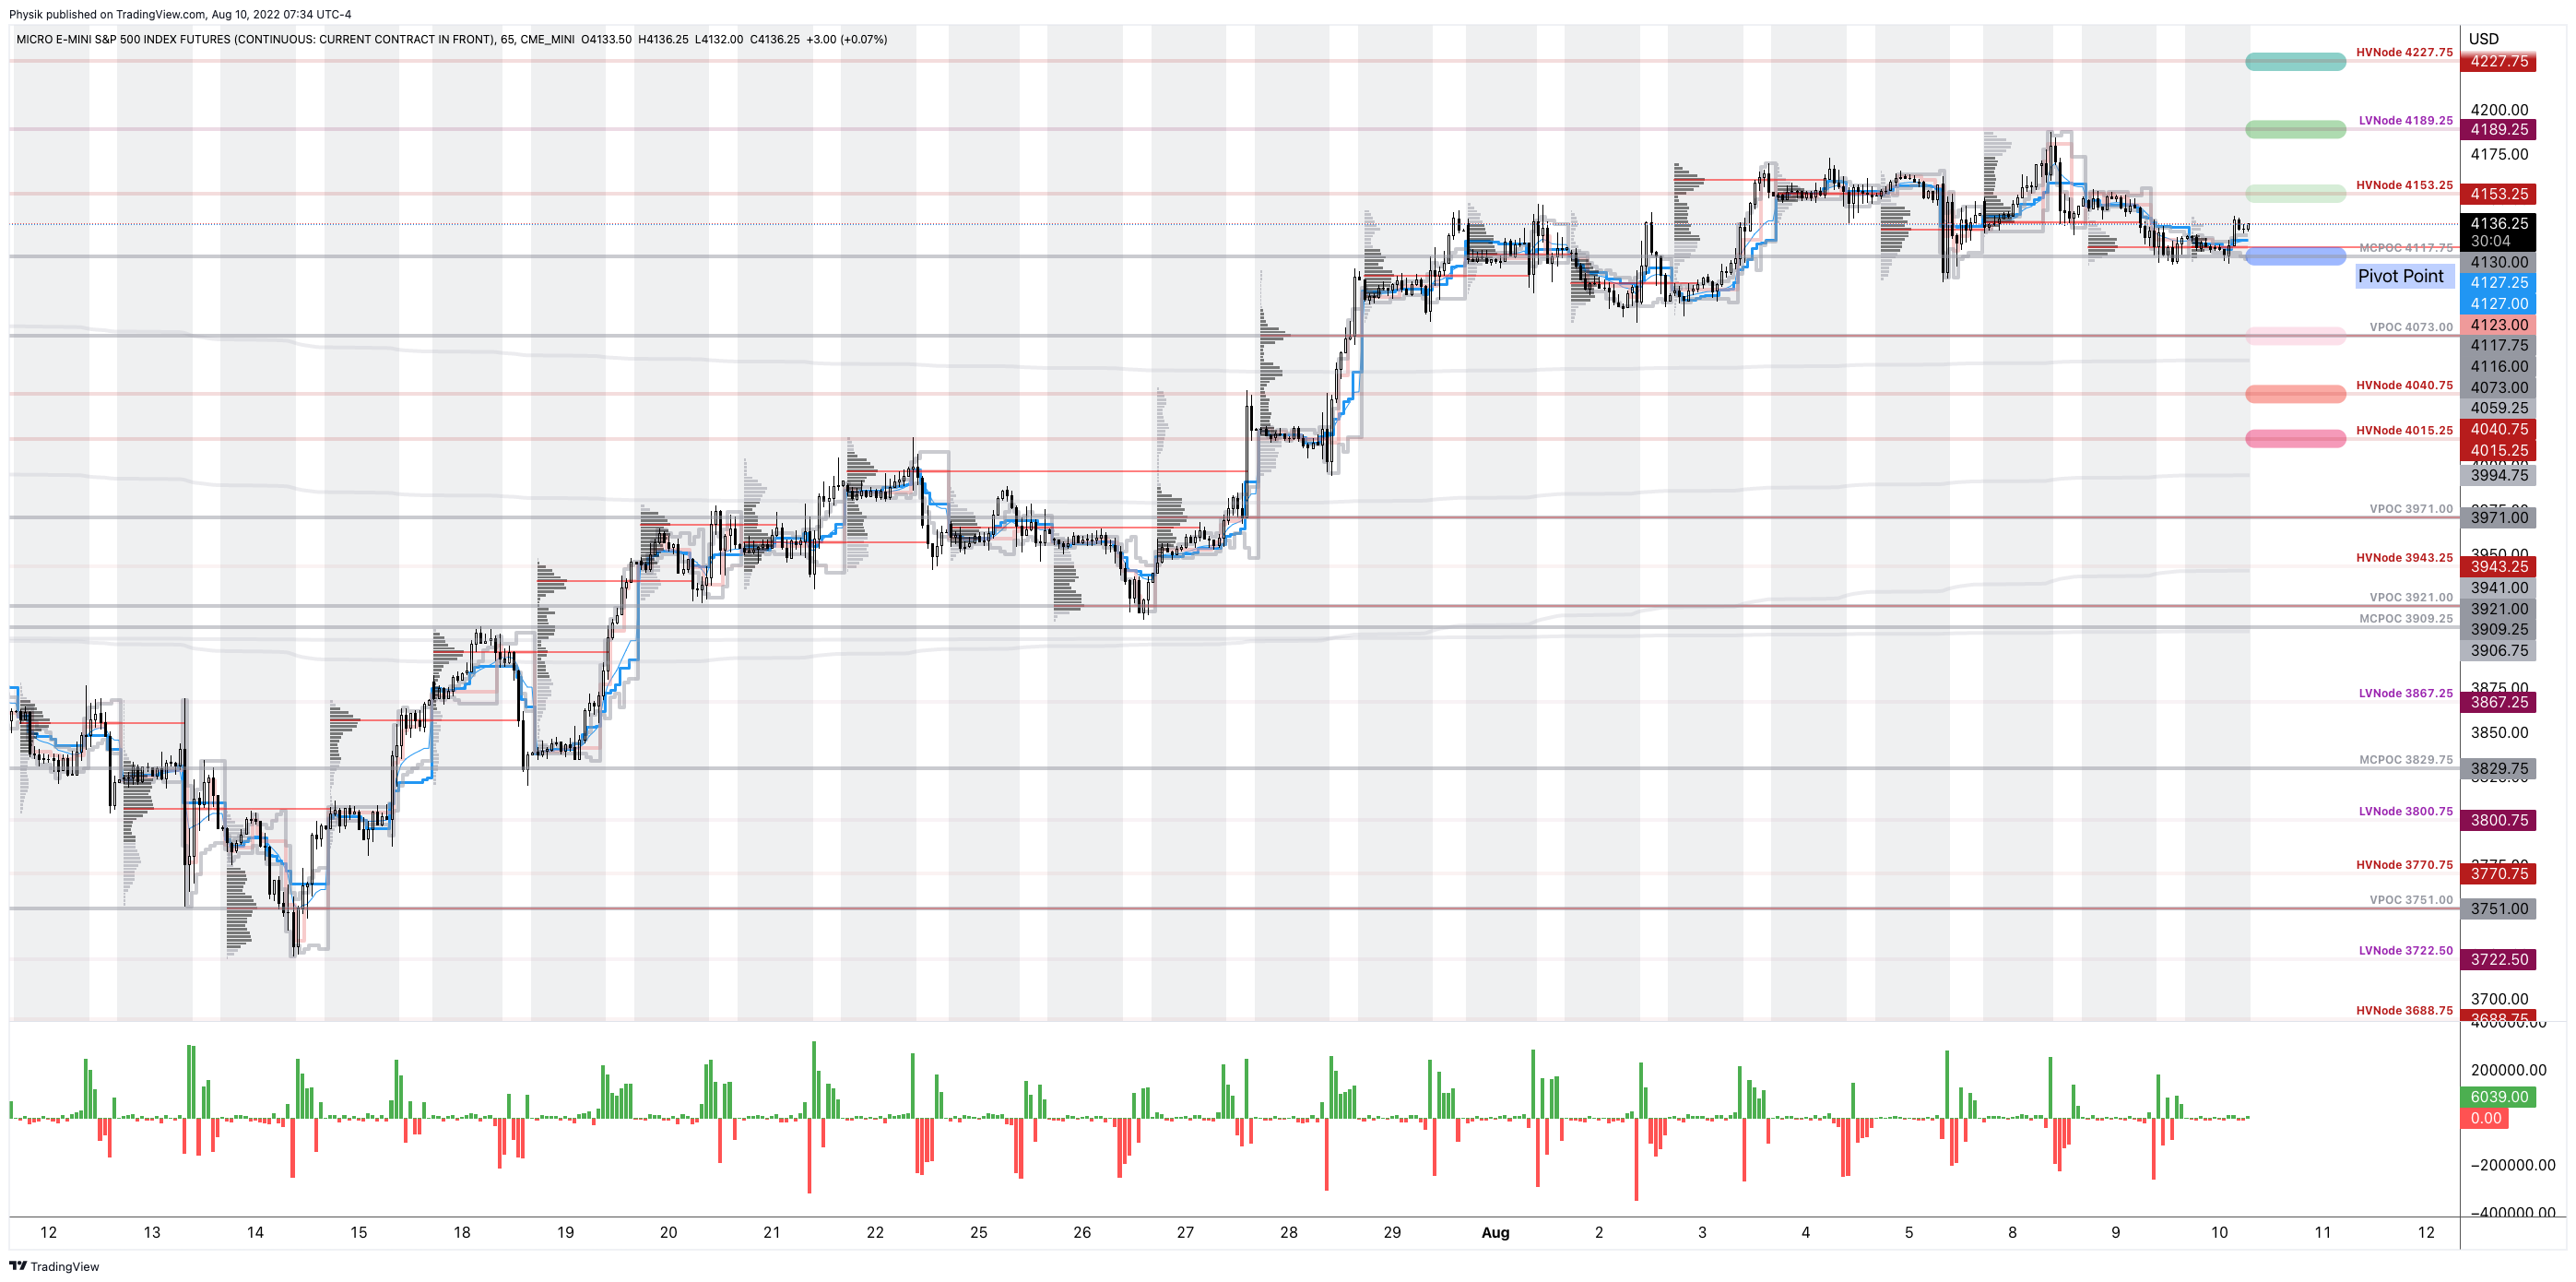
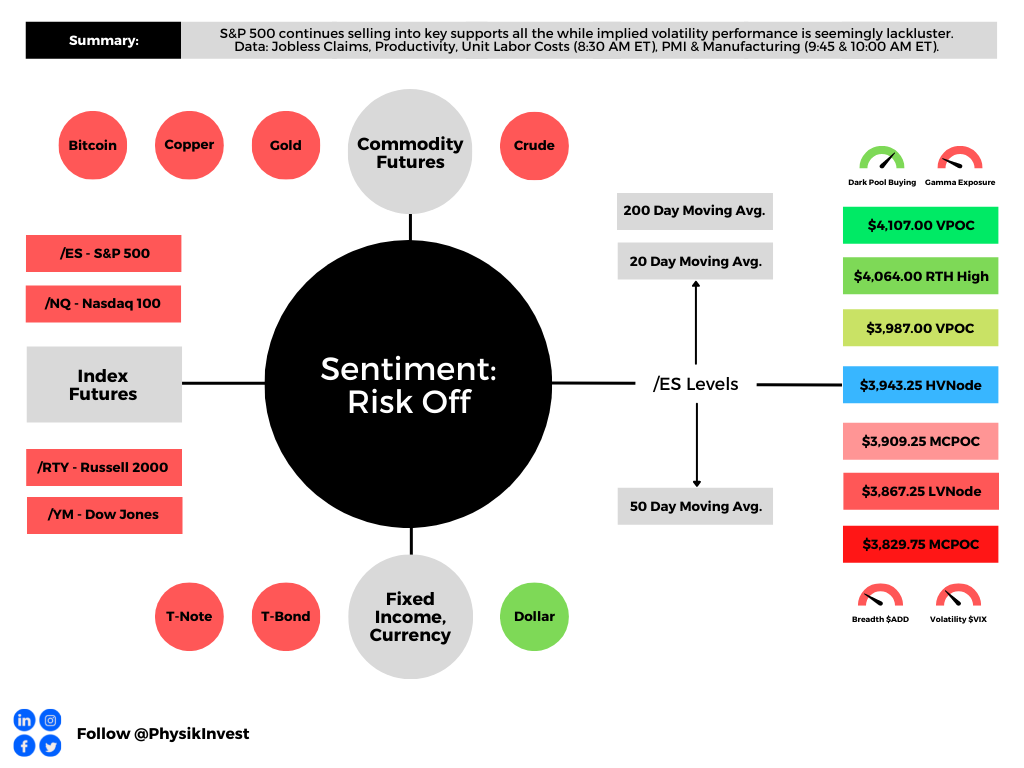
As of 8:10 AM ET, Thursday’s regular session (9:30 AM – 4:00 PM ET), in the S&P 500, is likely to open in the middle part of a negatively skewed overnight inventory, outside of prior-range and -value, suggesting a potential for immediate directional opportunity.
In the best case, the S&P 500 trades higher.
Any activity above the $3,943.25 HVNode puts into play the $3,987.00 VPOC. Initiative trade beyond the VPOC could reach as high as the $4,064.00 RTH High and $4,107.00 VPOC, or higher.
In the worst case, the S&P 500 trades lower.
Any activity below the $3,943.25 HVNode puts into play the $3,909.25 MCPOC. Initiative trade beyond the MCPOC could reach as low as the $3,867.25 LVNode and $3,829.75 MCPOC, or lower.
Click here to load today’s key levels into the web-based TradingView charting platform. Note that all levels are derived using the 65-minute timeframe. New links are produced, daily.

Definitions
Overnight Rally Highs (Lows): Typically, there is a low historical probability associated with overnight rally-highs (lows) ending the upside (downside) discovery process.
Volume Areas: A structurally sound market will build on areas of high volume (HVNodes). Should the market trend for long periods of time, it will lack sound structure, identified as low volume areas (LVNodes). LVNodes denote directional conviction and ought to offer support on any test.
If participants were to auction and find acceptance into areas of prior low volume (LVNodes), then future discovery ought to be volatile and quick as participants look to HVNodes for favorable entry or exit.
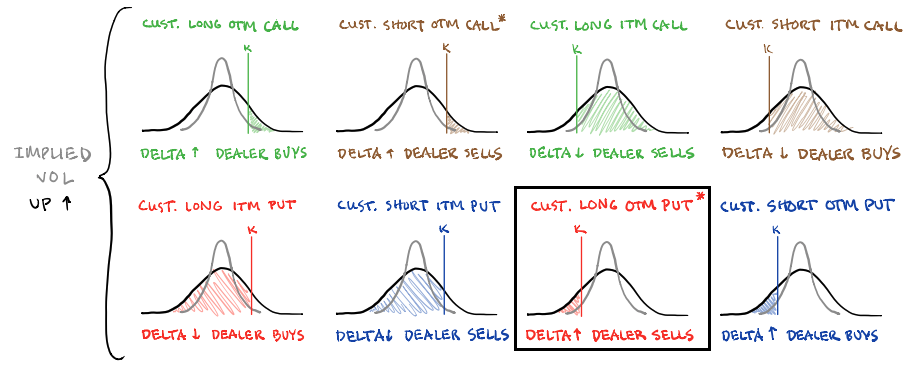
Gamma: Gamma is the sensitivity of an option to changes in the underlying price. Dealers that take the other side of options trades hedge their exposure to risk by buying and selling the underlying. When dealers are short-gamma, they hedge by buying into strength and selling into weakness. When dealers are long-gamma, they hedge by selling into strength and buying into weakness. The former exacerbates volatility. The latter calms volatility.
POCs: POCs are valuable as they denote areas where two-sided trade was most prevalent in a prior day session. Participants will respond to future tests of value as they offer favorable entry and exit.
MCPOCs: POCs are valuable as they denote areas where two-sided trade was most prevalent over numerous day sessions. Participants will respond to future tests of value as they offer favorable entry and exit.
About
After years of self-education, strategy development, mentorship, and trial-and-error, Renato Leonard Capelj began trading full-time and founded Physik Invest to detail his methods, research, and performance in the markets.
Capelj also develops insights around impactful options market dynamics at SpotGamma and is a Benzinga reporter.
Some of his works include conversations with ARK Invest’s Catherine Wood, investors Kevin O’Leary and John Chambers, FTX’s Sam Bankman-Fried, ex-Bridgewater Associate Andy Constan, Kai Volatility’s Cem Karsan, The Ambrus Group’s Kris Sidial, among many others.
Disclaimer
In no way should the materials herein be construed as advice. Derivatives carry a substantial risk of loss. All content is for informational purposes only.