Editor’s Note: Our newsletter service provider is not working, today. Our apologies if you were not able to receive the note via email, as usual.
What Happened
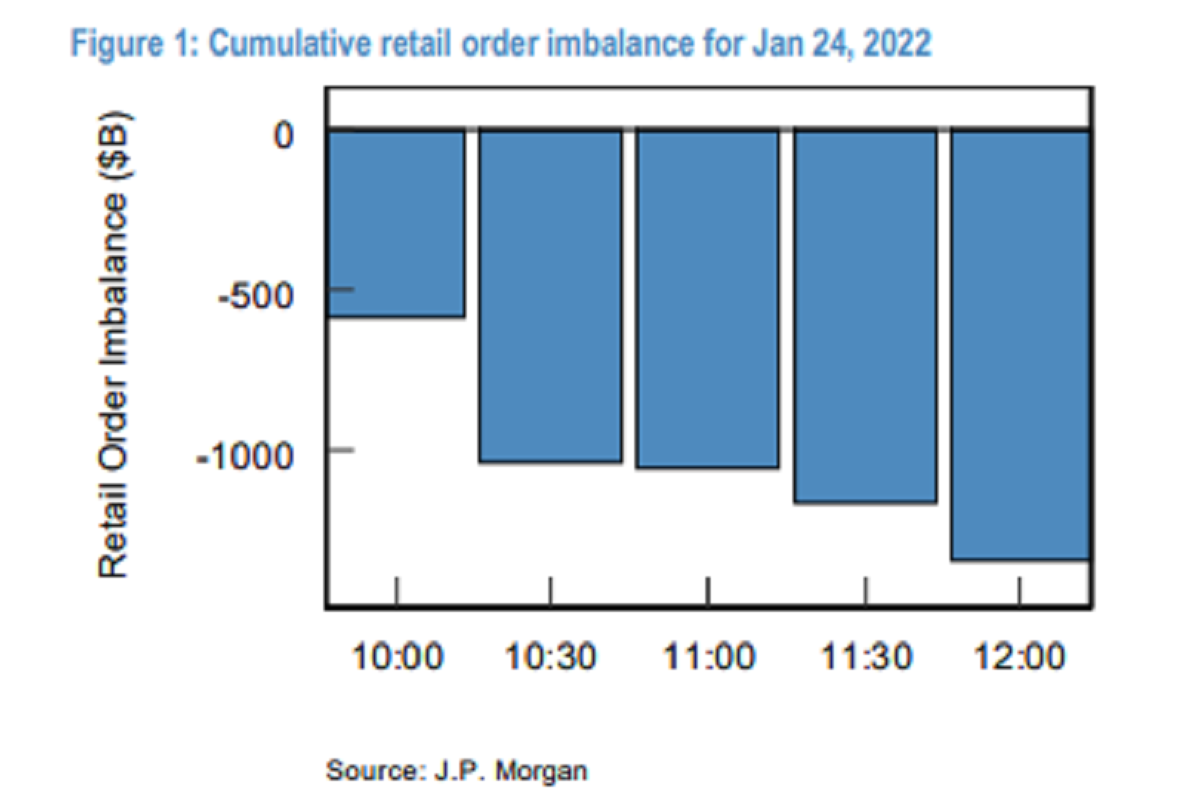
Overnight, equity index futures auctioned sideways to higher as some metrics show investors bought the dip, aggressively, after Monday’s liquidation.
At the same time measures of implied volatility compressed and the flows associated with that, too, are supporting the recovery.
Still “a rising interest rate environment [which] is leading to a revaluation,” is a key concern, and investors will be looking for clarity on monetary policy from the Federal Open Market Committee, today, after 2:00 PM ET.
Other data to be released today include trade in goods (8:30 AM ET) and new home sales (10:00 AM ET).
What To Expect
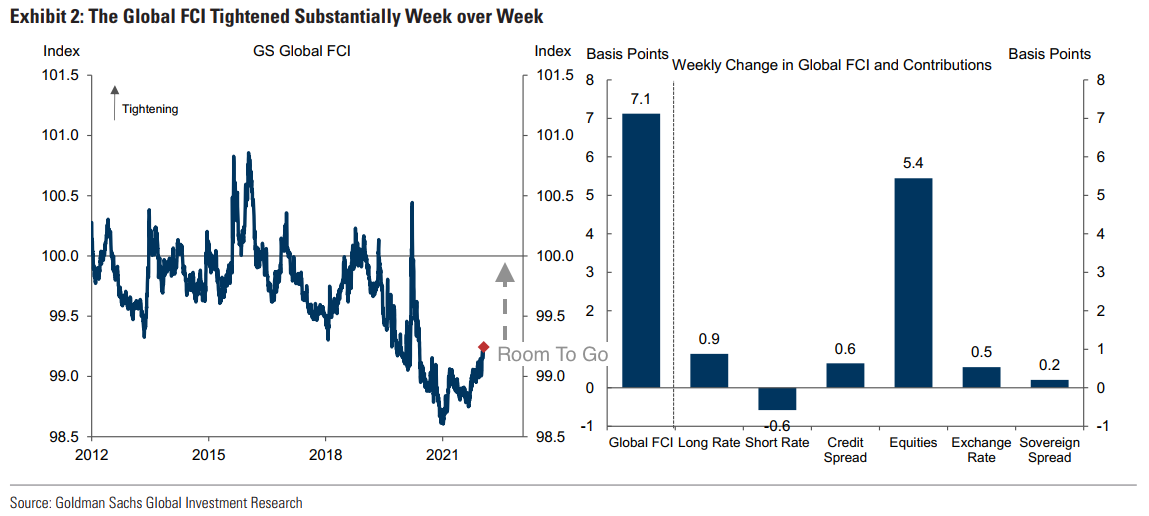
Fundamental: As Bloomberg’s John Authers puts it well, drops in the market may make it more difficult to raise capital and this can tighten financial conditions.
“This leads to the hope that the stock market has already done some of the Fed’s job, so there will be less need for higher fed funds rates — and also that the Fed might have to act at some point if the stock market fall tightens conditions too much.”

Though this most recent liquidation tightened financial conditions, it is not likely that the Federal Reserve (Fed) will change its tone amidst heightened inflation, among other things.
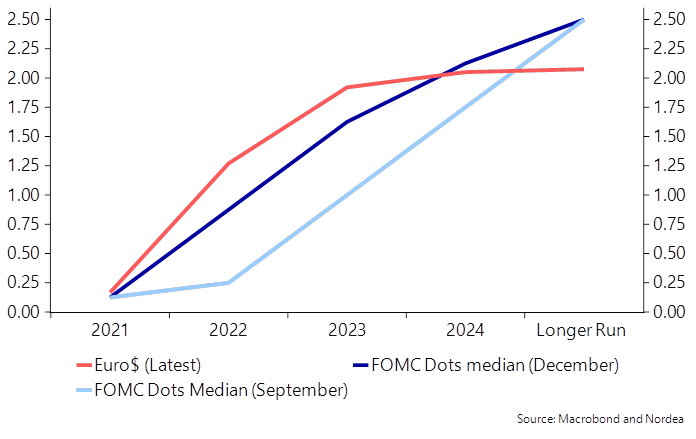
In fact, according to Nordea Bank’s (OTC: NRDBY) research arm, though there are lower odds of a much “faster tapering,” the Fed is to continue “building towards a March hike.”
Flexibility in policy, as well as a potential dismissal of a 50 basis point hike given geopolitical tensions, some poor responses to earnings results, and disappointments in real demand and growth, “could make for a brief market relief.”
“Our forecast includes four hikes for the year, which is consistent with current market pricing,” Nordea adds on in a statement on the Fed not hiking by more than 25 basis points since the early 2000s. “In our view balances are tilted towards balance sheet tightening rather than adding a fifth or sixth hike this year.”
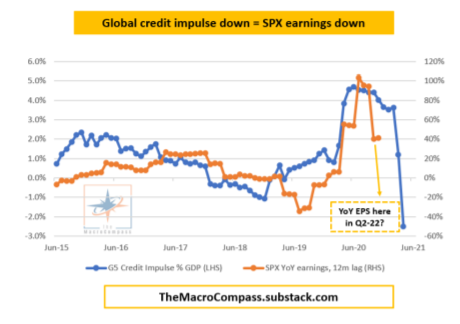
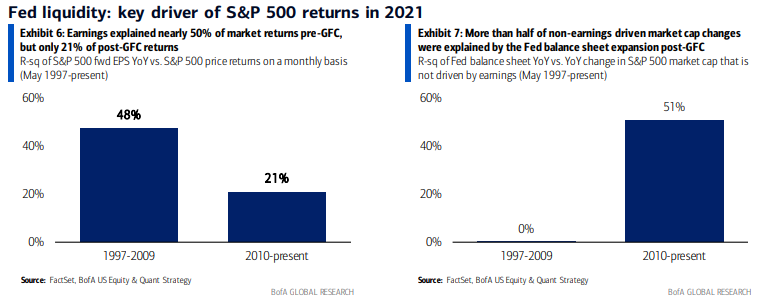
In the end, though, monetary frameworks and max liquidity promoted a divergence in price from fundamentals. Expected monetary policy evolution will make valuations much less justifiable.
“The mechanical impact of QT should result in less liquidity and more net issuance thereby rising rates, but the empirical story, supported by growth prospects, [] is different,” Nordea says.
Still, an “abundance of excess liquidity could provide a cushion as the Fed drains liquidity, a cushion that did not exist in 2018.”
Perspectives: Matt Maley of Miller Tabak + Co. suggests “the amount of leverage that built up over the past several years will take longer to unwind,” and “we’ve moved into a period where investors should sell the rallies rather than buy the dips.”
This is somewhat in opposition to JPMorgan Chase & Co’s (NYSE: JPM) Mark Kolanovic statements that “worries around rates and corporate margins are overdone,” and “the earnings season [will] reassure, and in a worst-case scenario could see a return of the ‘Fed put.’”
When examining extraordinary actions by the Fed, “the average ‘exercise price’ is a -23.8% peak to trough (equating currently to SPX 3,670.00),” Evercore Inc (NYSE: EVR) adds.
“The Fed is likely to ‘exercise the Fed put’ should the average -23.8% strike price come into view.”
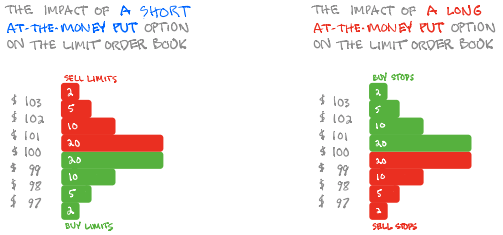
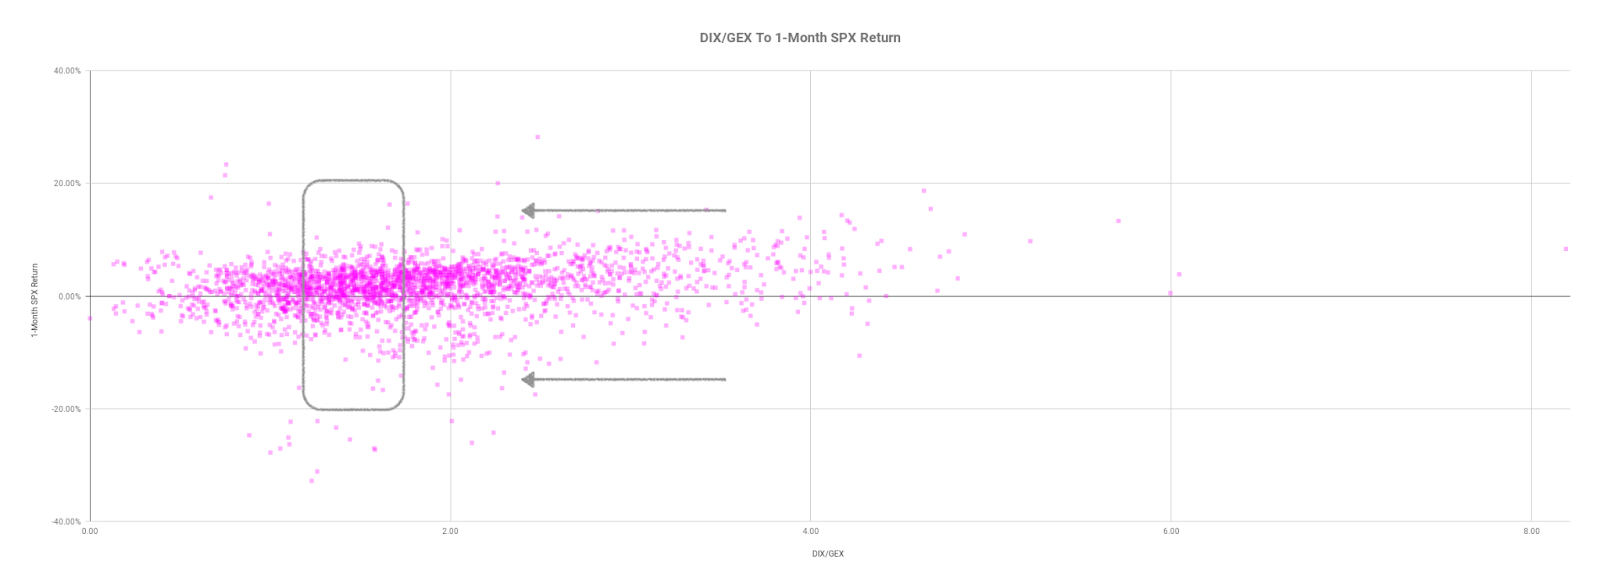
Positioning: A lower liquidity, short-gamma environment (wherein an options delta falls with stock price rises and rises when stock prices fall) has led to more erratic moves, as a result of counterparty hedging activities.
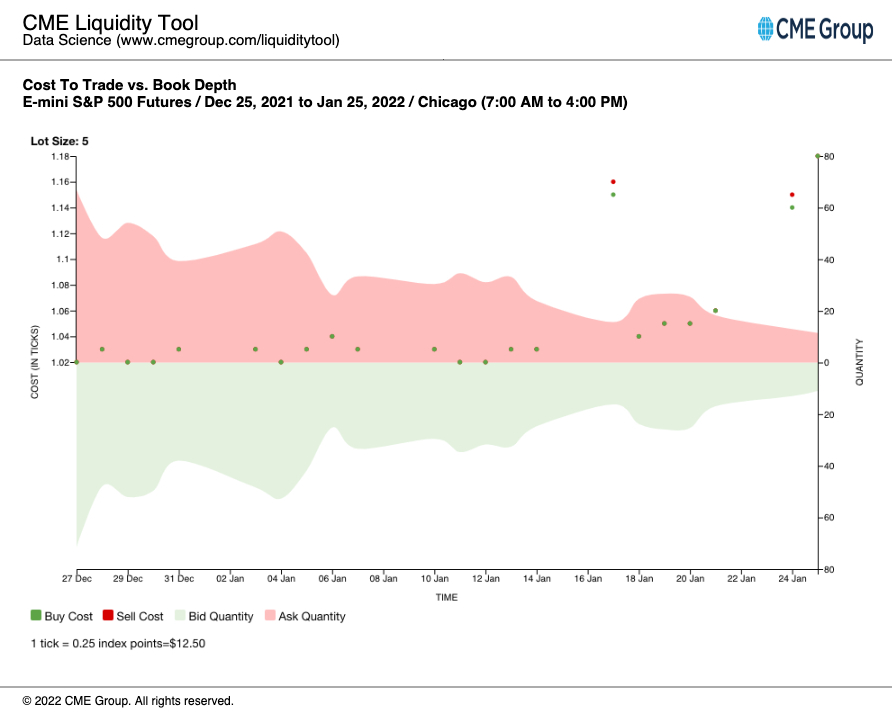
The removal of put-heavy exposure, post-monthly options expiration (OPEX), and a reduction in embedded event premiums tied to the approaching FOMC, opens up a window of strength, wherein dealers have less positive delta exposure to sell against.
In other words, as measures of implied volatility compress, as is the case when there is less demand for downside put protection (a positive-delta trade for the dealers), the dealer’s exposure to positive delta declines.
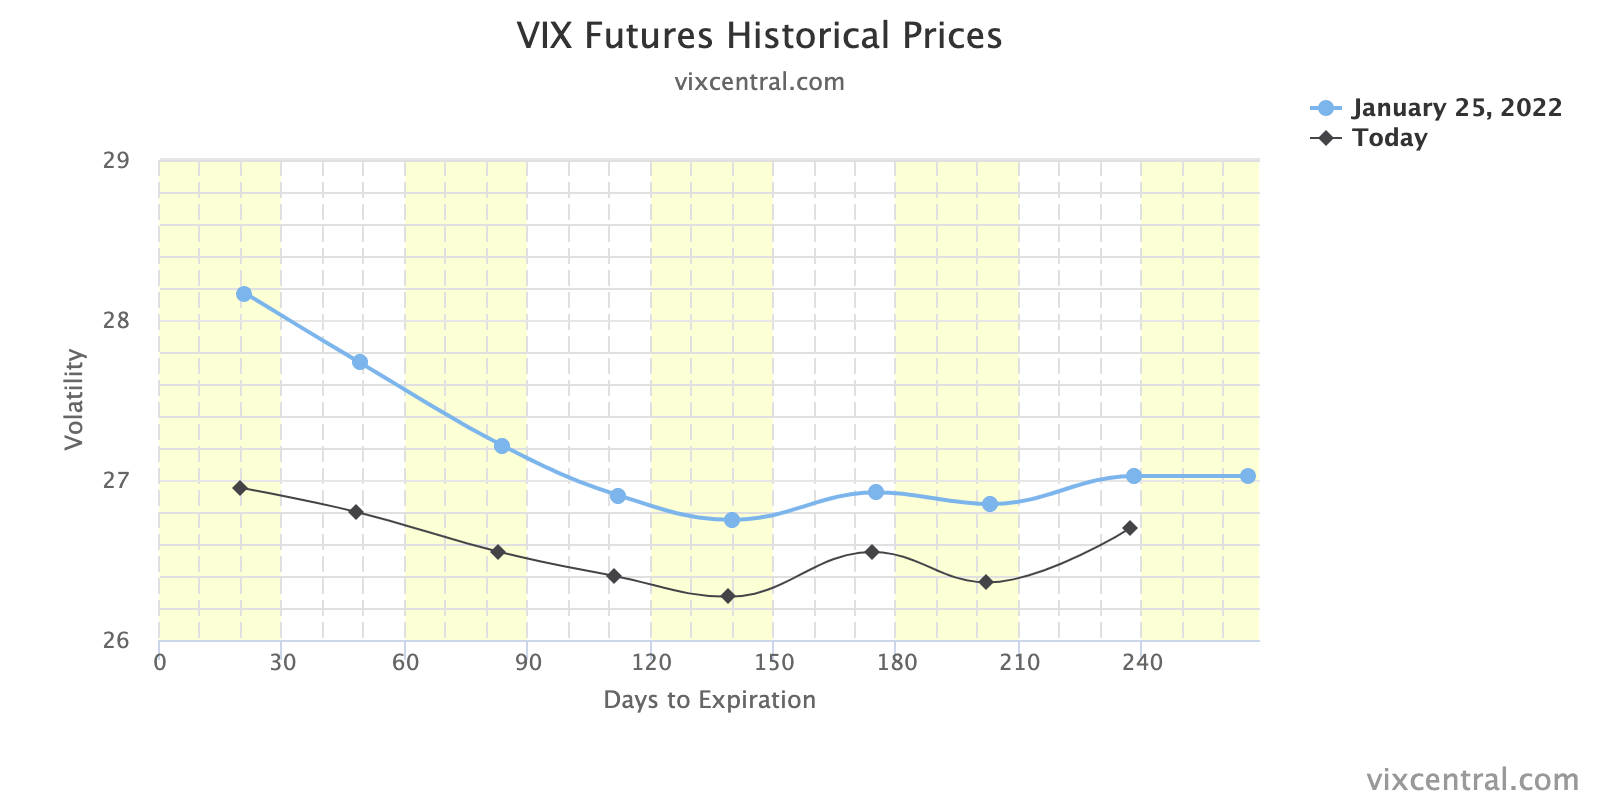
All else equal, this solicits dealer buying of the underlying (a reduction of short-delta hedges).

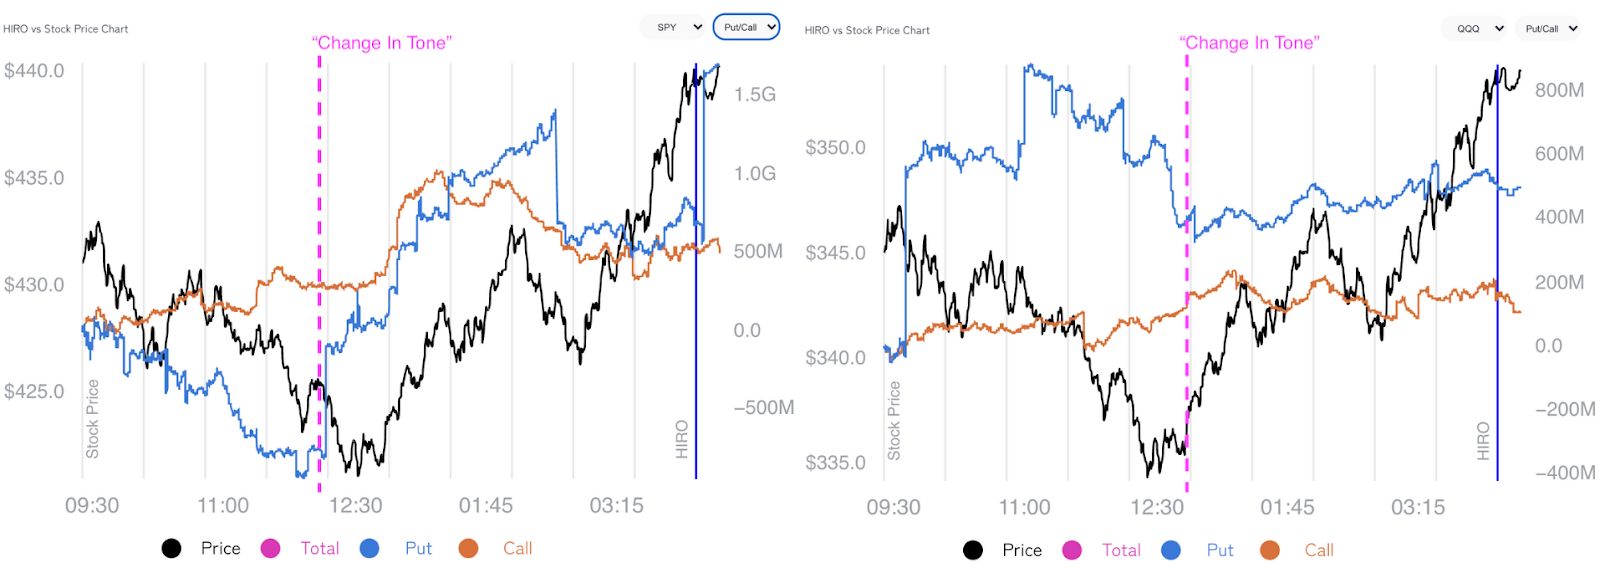
Taking into account options positioning, versus buying pressure (measured via short sales or liquidity provision on the market-making side), metrics are positively skewed, much more than yesterday. Tuesday the tone changed and the dip was bought.
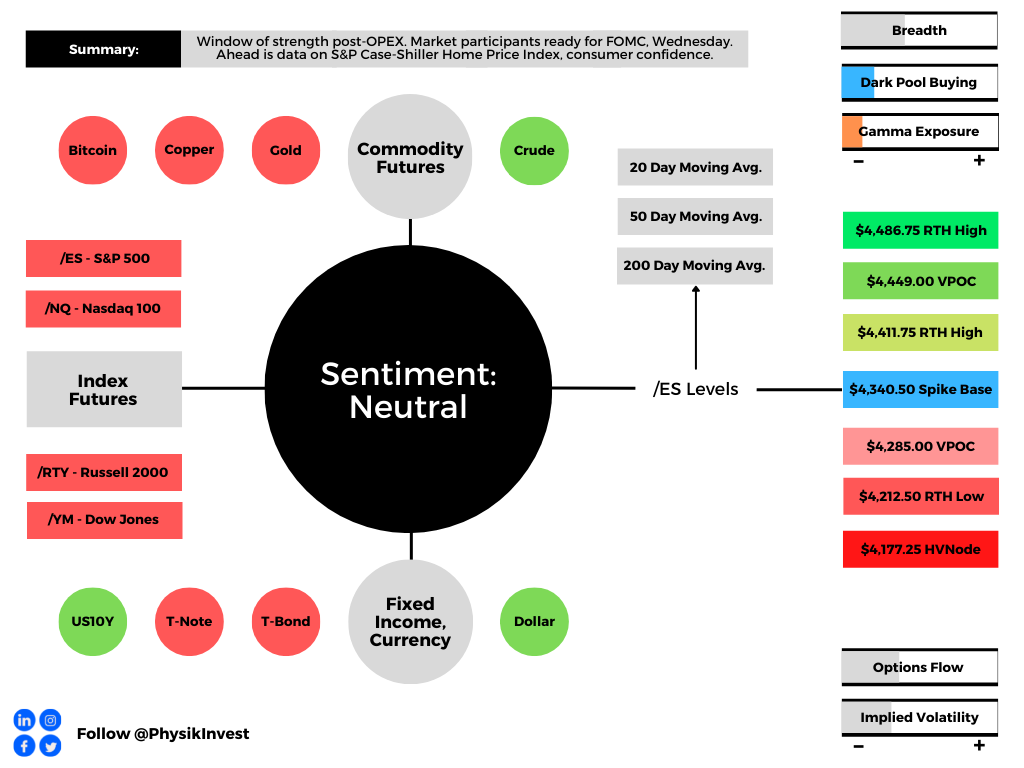
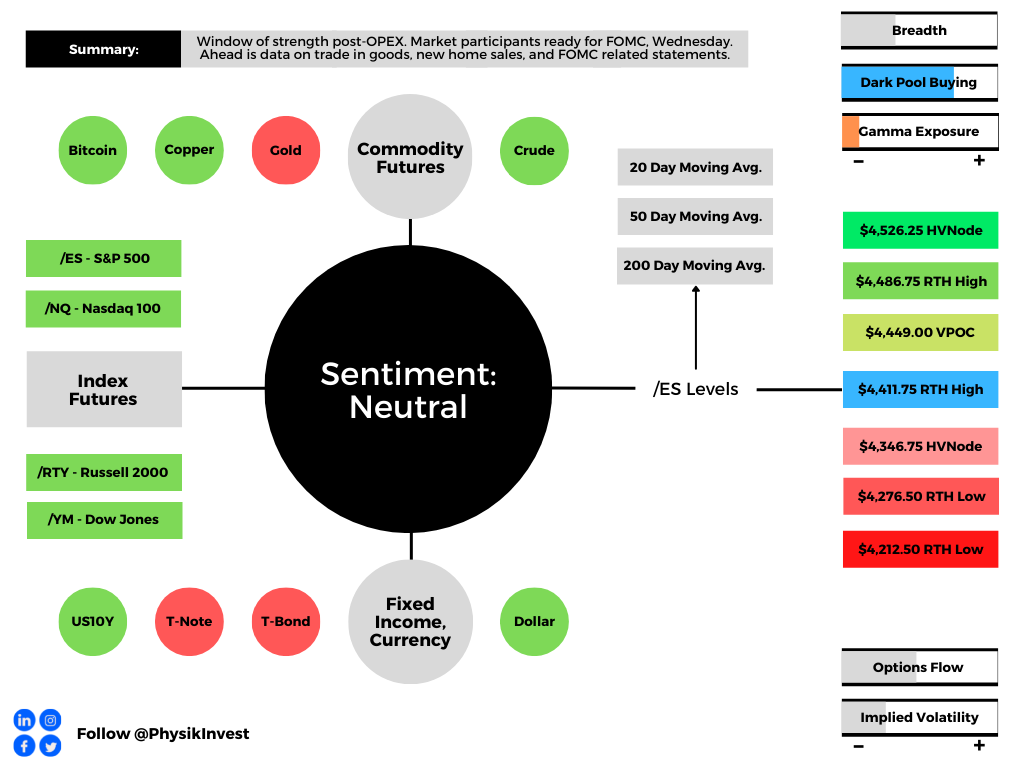
Technical: As of 6:00 AM ET, Wednesday’s regular session (9:30 AM – 4:00 PM ET), in the S&P 500, will likely open in the upper part of a positively skewed overnight inventory, just inside of prior-range and -value, suggesting a limited potential for immediate directional opportunity.
Gap Scenarios In Play (Potentially): Gaps ought to fill quickly. Should they not, that’s a signal of strength; do not fade. Leaving value behind on a gap-fill or failing to fill a gap (i.e., remaining outside of the prior session’s range) is a go-with indicator.

Auctioning and spending at least 1-hour of trade back in the prior range suggests a lack of conviction; in such a case, do not follow the direction of the most recent initiative activity.
In the best case, the S&P 500 trades higher; activity above the $4,411.75 regular trade high (RTH High) puts in play the $4,449.00 untested point of control (VPOC). Initiative trade beyond the VPOC could reach as high as the $4,486.76 RTH High and $4,526.25 high volume area (HVNode), or higher.
In the worst case, the S&P 500 trades lower; activity below the $4,411.75 RTH High puts in play the $4,346.75 HVNode. Initiative trade beyond the HVNode could reach as low as the $4,276.50 and $4,212.50 RTH Low, or lower.
Click here to load today’s key levels into the web-based TradingView charting platform. Note that all levels are derived using the 65-minute timeframe. New links are produced, daily.

What People Are Saying
Definitions
Volume Areas: A structurally sound market will build on areas of high volume (HVNodes). Should the market trend for long periods of time, it will lack sound structure, identified as low volume areas (LVNodes). LVNodes denote directional conviction and ought to offer support on any test.
If participants were to auction and find acceptance into areas of prior low volume (LVNodes), then future discovery ought to be volatile and quick as participants look to HVNodes for favorable entry or exit.
Gamma: Gamma is the sensitivity of an option to changes in the underlying price. Dealers that take the other side of options trades hedge their exposure to risk by buying and selling the underlying. When dealers are short-gamma, they hedge by buying into strength and selling into weakness. When dealers are long-gamma, they hedge by selling into strength and buying into weakness. The former exacerbates volatility. The latter calms volatility.
Vanna: The rate at which the delta of an option changes with respect to volatility.
POCs: POCs are valuable as they denote areas where two-sided trade was most prevalent in a prior day session. Participants will respond to future tests of value as they offer favorable entry and exit.
Options Expiration (OPEX): Traditionally, option expiries mark an end to pinning (i.e, the theory that market makers and institutions short options move stocks to the point where the greatest dollar value of contracts will expire) and the reduction dealer gamma exposure.
About
After years of self-education, strategy development, mentorship, and trial-and-error, Renato Leonard Capelj began trading full-time and founded Physik Invest to detail his methods, research, and performance in the markets.
Capelj is also a Benzinga finance and technology reporter interviewing the likes of Shark Tank’s Kevin O’Leary, JC2 Ventures’ John Chambers, FTX’s Sam Bankman-Fried, and ARK Invest’s Catherine Wood, as well as a SpotGamma contributor developing insights around impactful options market dynamics.
Disclaimer
Physik Invest does not carry the right to provide advice.
In no way should the materials herein be construed as advice. Derivatives carry a substantial risk of loss. All content is for informational purposes only.