The daily brief is a free glimpse into the prevailing fundamental and technical drivers of U.S. equity market products. Join the 300+ that read this report daily, below!
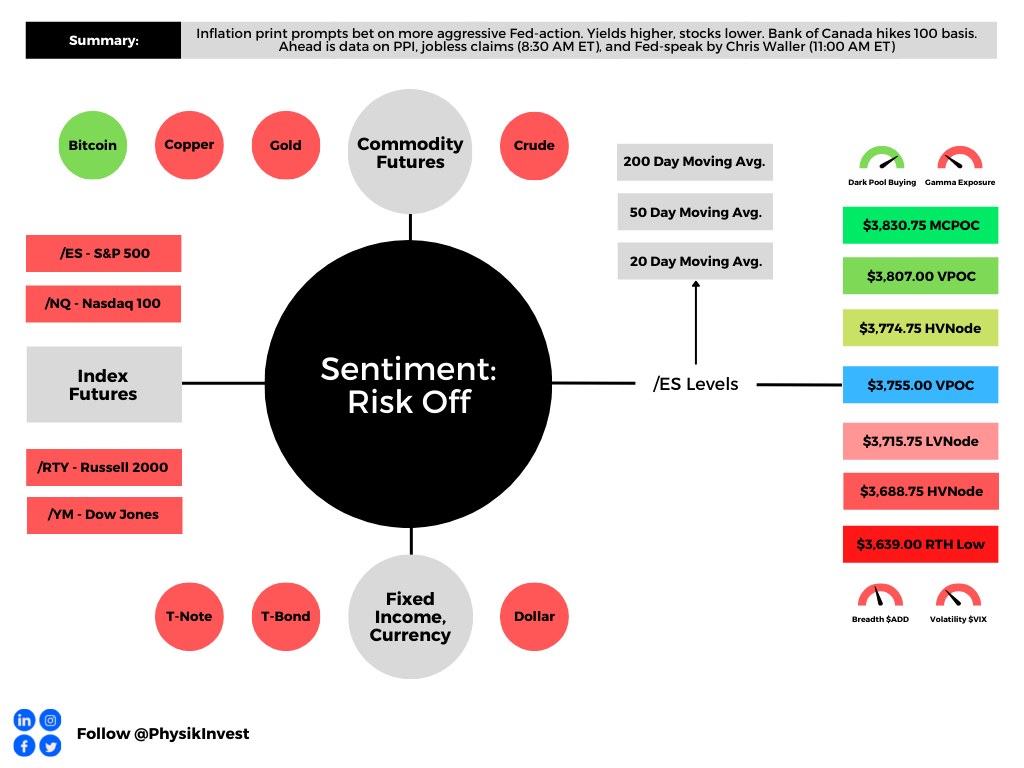
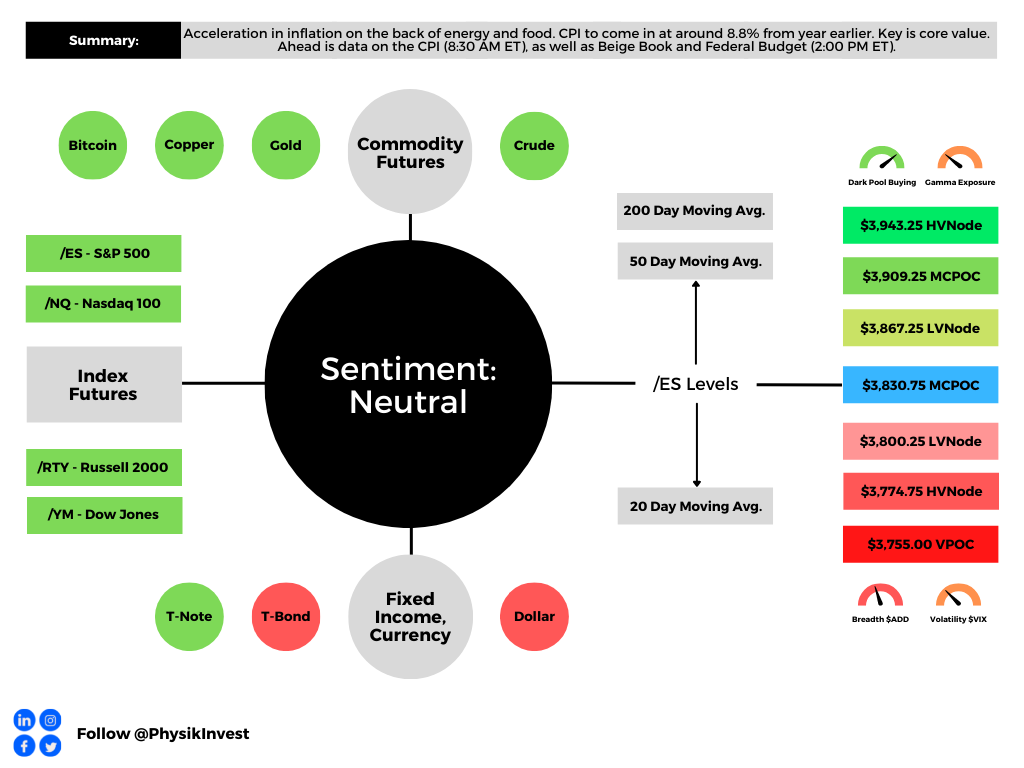
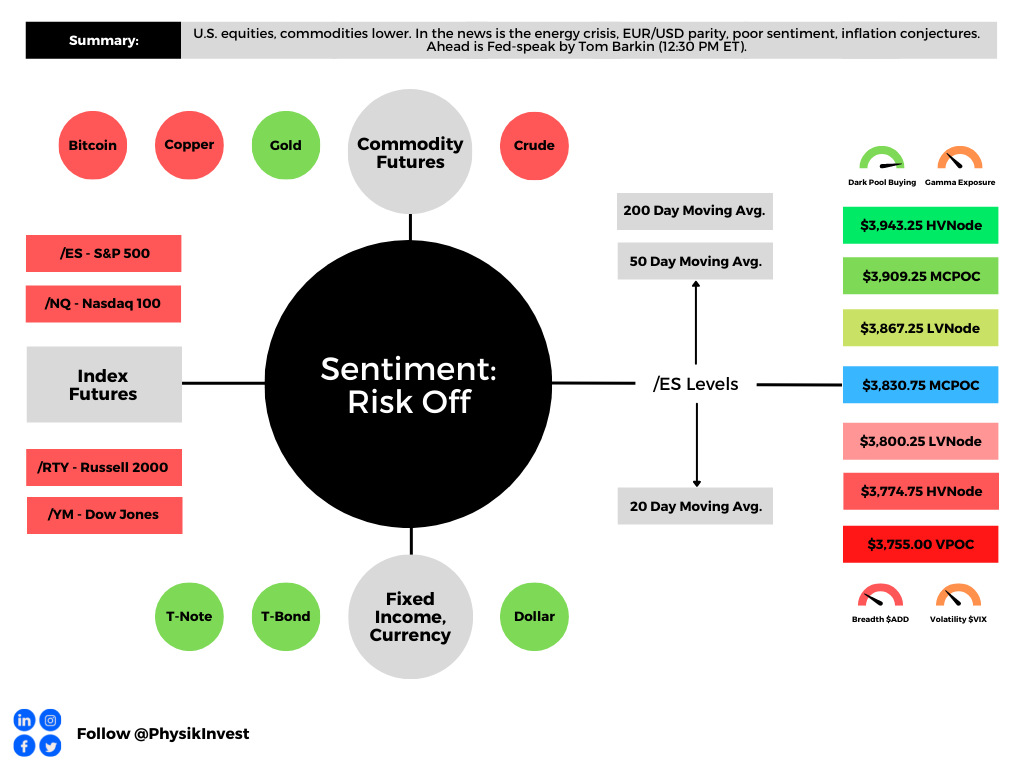
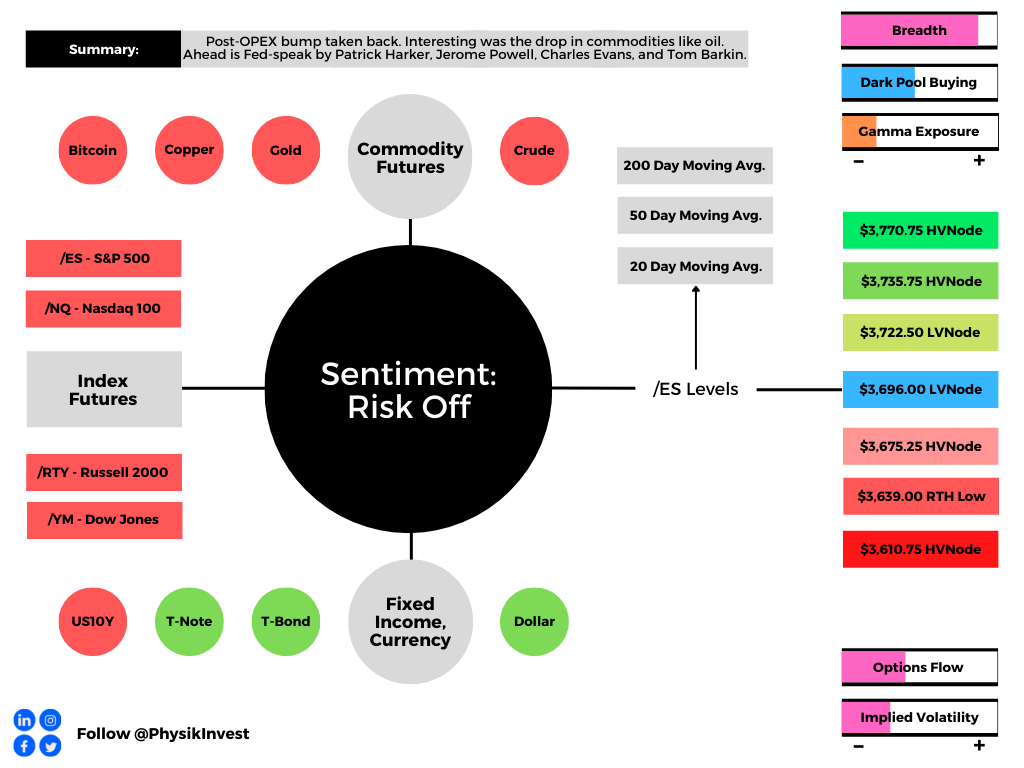
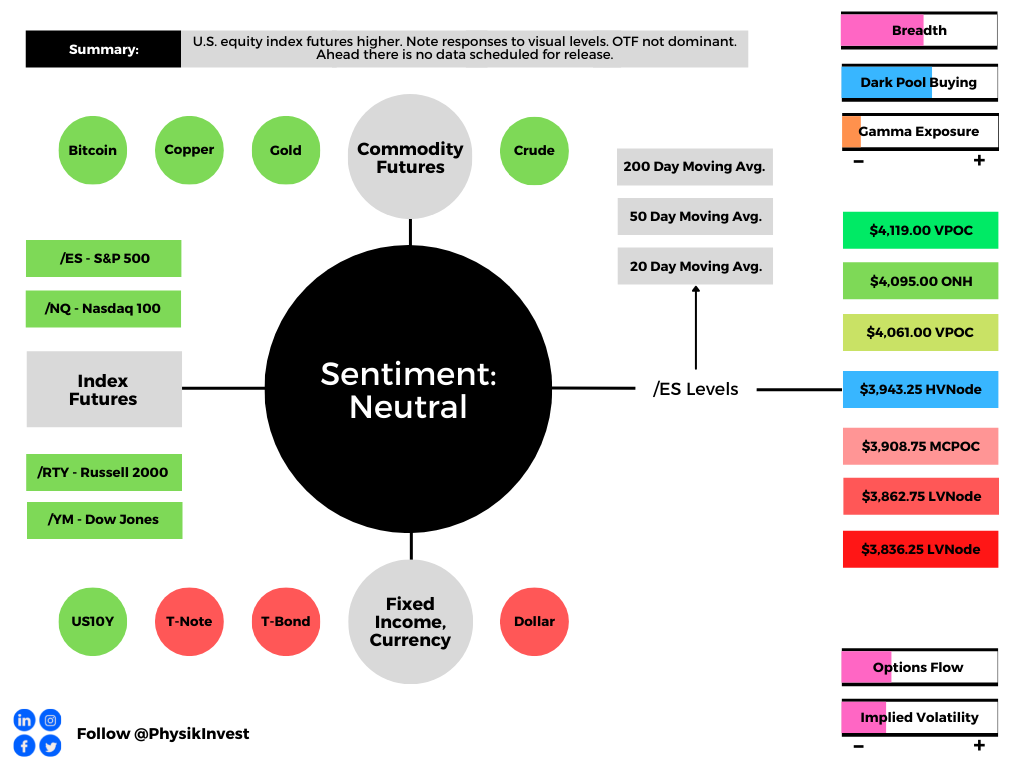
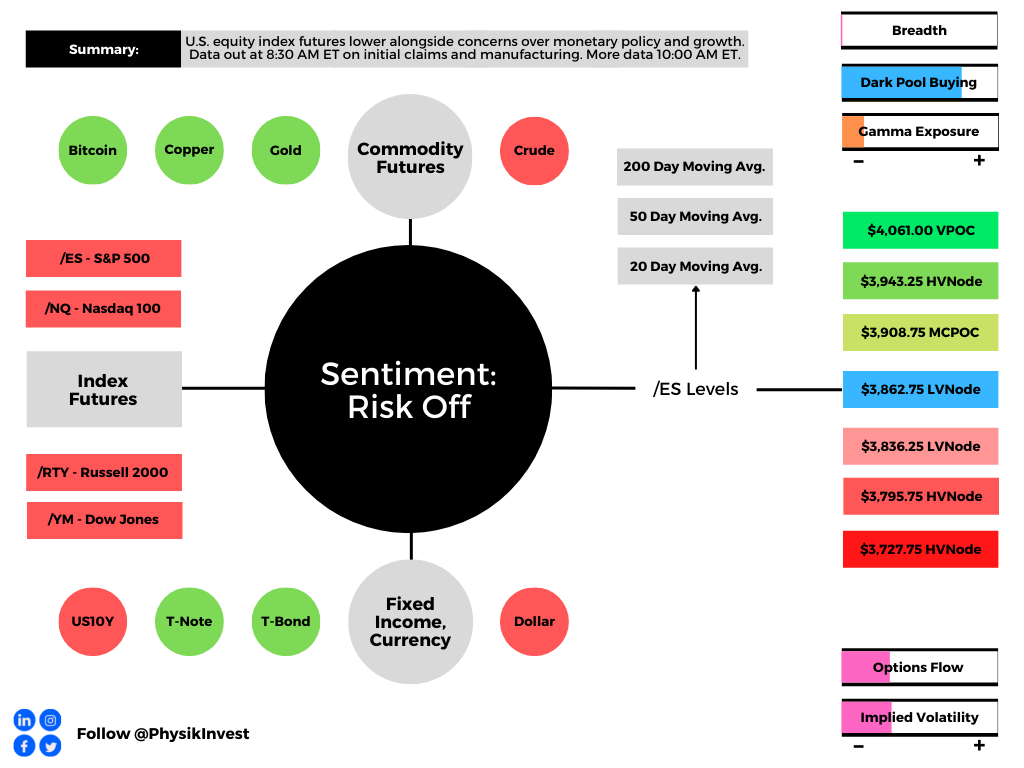
Graphic updated 6:50 AM ET. Sentiment Risk-Off if expected /ES open is below the prior day’s range. /ES levels are derived from the profile graphic at the bottom of the following section. Levels may have changed since initially quoted; click here for the latest levels. SqueezeMetrics Dark Pool Index (DIX) and Gamma (GEX) calculations are based on where the prior day’s reading falls with respect to the MAX and MIN of all occurrences available. A higher DIX is bullish. At the same time, the lower the GEX, the more (expected) volatility. Learn the implications of volatility, direction, and moneyness. Breadth reflects a reading of the prior day’s NYSE Advance/Decline indicator. VIX reflects a current reading of the CBOE Volatility Index (INDEX: VIX) from 0-100.
Fundamental
Adding fuel to the fire – dollar strength, crypto bankruptcies, China contagion fears – was a hot consumer price index (CPI) report released Wednesday.
Expected was an 8.8% rise year-over-year (YoY) and 1.1% month-over-month (MoM). Core CPI (which excludes food and energy) was to rise by 5.7% YoY and 0.5% MoM, respectively.
Officially, the headline number rose to 9.1%. The core CPI rose 5.9% YoY and 0.7% MoM, meaning a peak was established in March (6.5% YoY, then).
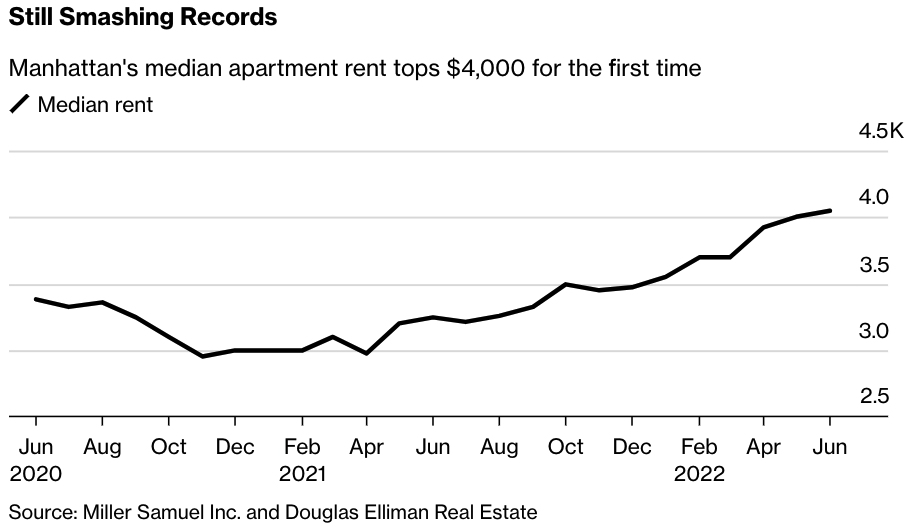
“Though CPI’s spike is led by energy and food prices, which are largely global problems, prices continue to mount for domestic goods and services, from shelter to autos to apparel,” says Robert Frick of the Navy Federal Credit Union.
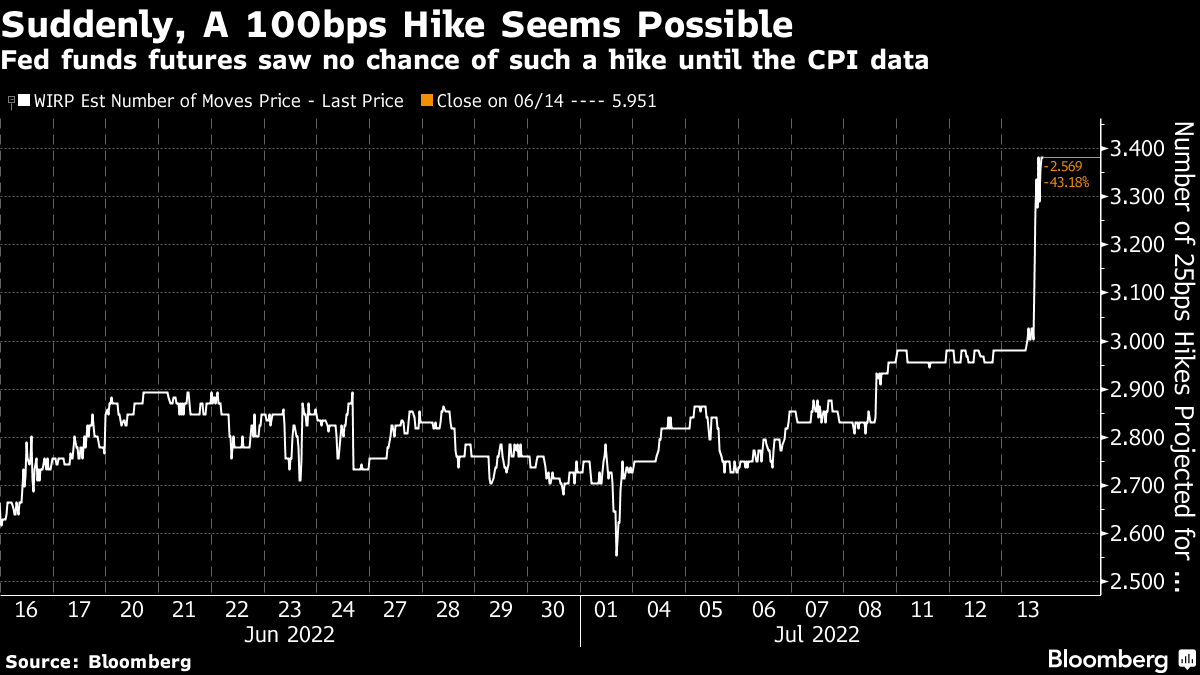
Accordingly, expectations regarding the Federal Reserve’s (Fed) response to hot inflation prints have changed. Participants now are pricing an increased potential for a 100 basis point hike in interest rates, something the Bank of Canada implemented, yesterday.
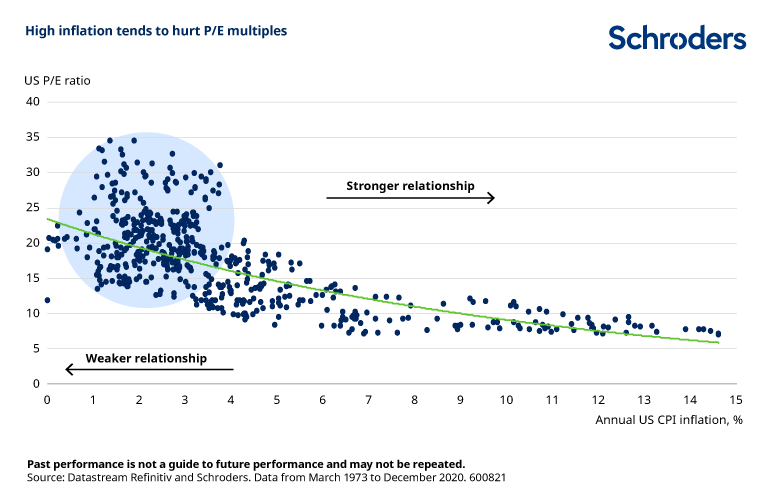
This is a negative for stocks, at the surface. High inflation, and the response to it, tends to hurt multiples (which has been the principal driver of this year’s de-rate, already).
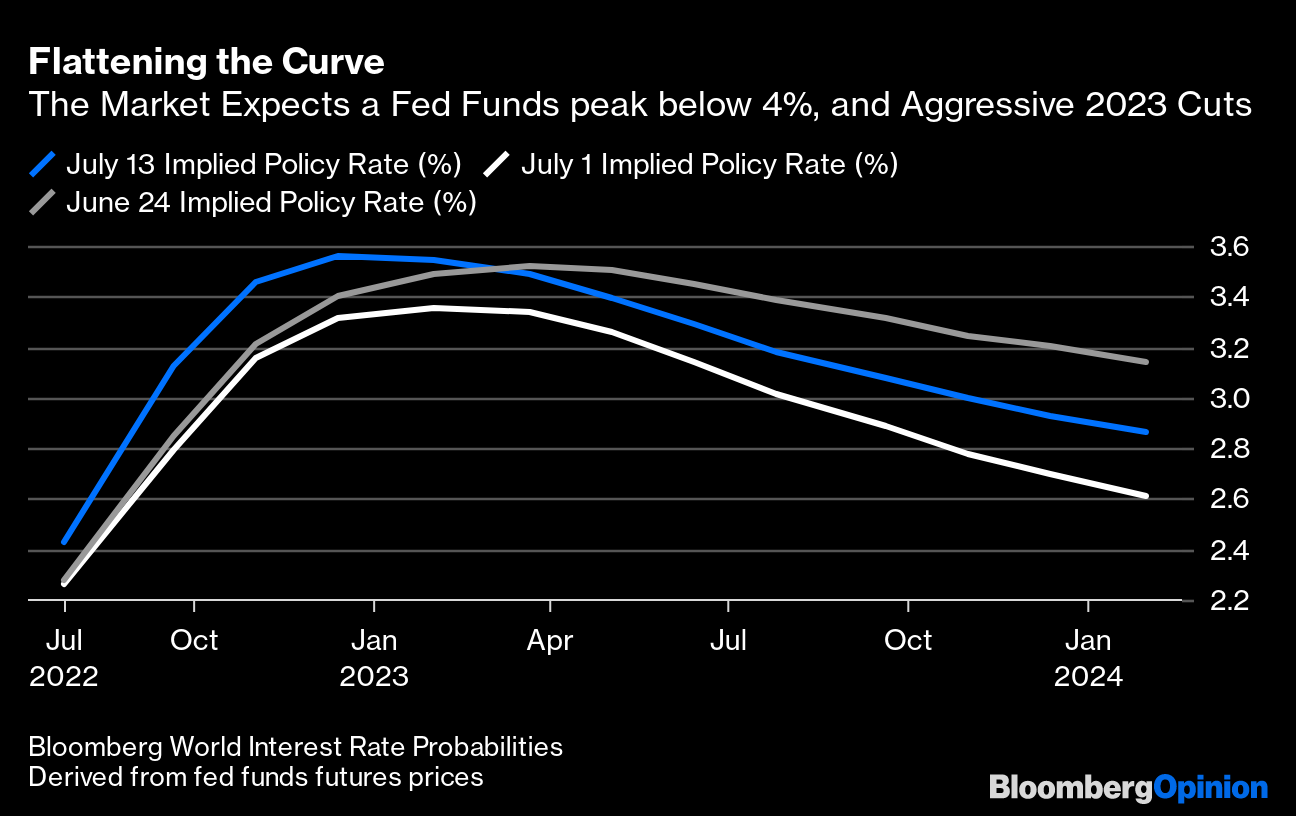
The market expects a Fed Funds peak below 4%, followed by aggressive easing. This is as the Fed’s Beige Book showed signs that inflation is (or soon will be) peaking, amid slowing demand and recession worries.
Little change in the dynamics talked about in past letters. Therefore, we continue rolling forward our positioning narratives.
Post-CPI, the market moved lower, first, and higher, later. This was, in part, the result of dealer inventory rebalancing, as Kai Volatility’s Cem Karsan has explained well many times before.
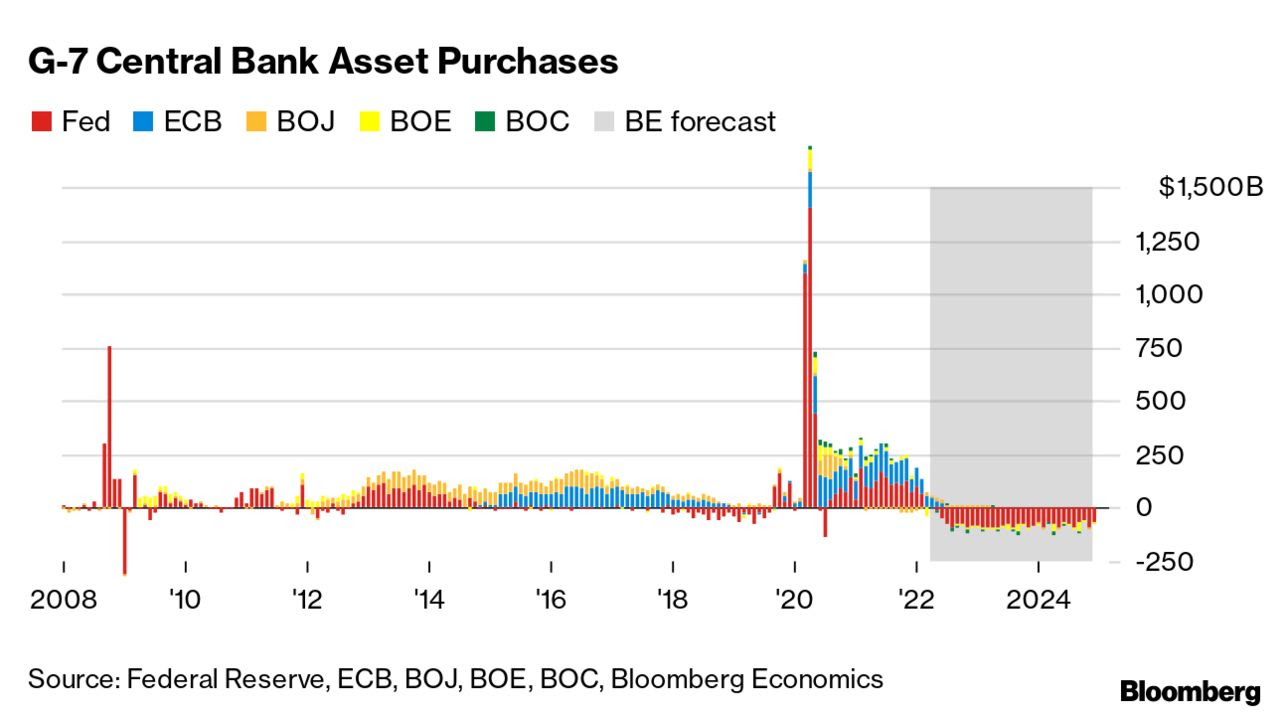
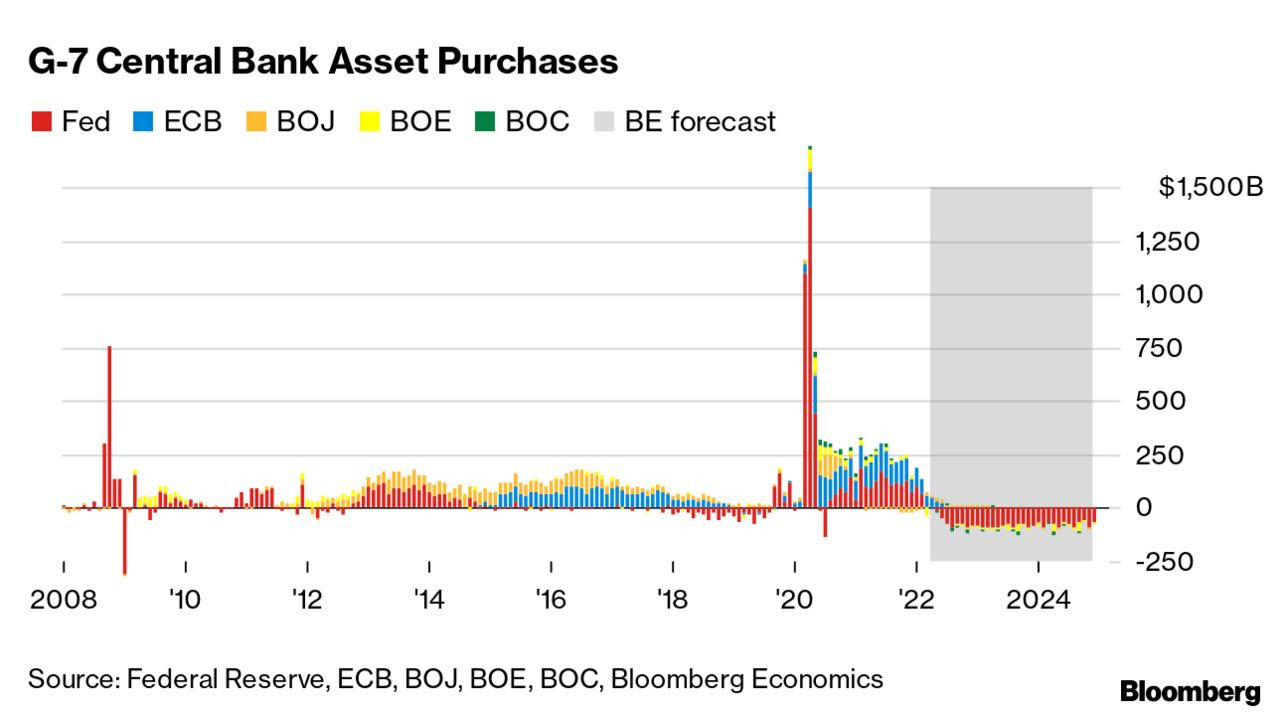
The subsequent move is likely to be “tied to the incremental effects on liquidity (QE/QT).”
Rising inflation probably bolsters the Fed’s backing of a 75 to 100 basis point rate hike. So, don’t fight the Fed. Rising rates and the withdrawal of liquidity, coupled with the impact of inflation and an economic slowing, may prompt continued pressure on equity markets.
Check out The Ambrus Group’s Kris Sidial speak on implied volatility (IVOL) suppression and the implications of a dash for cash (investor exit) and reach for protection.
Technical
As of 6:45 AM ET, Thursday’s regular session (9:30 AM – 4:00 PM ET), in the S&P 500, is likely to open in the lower part of a negatively skewed overnight inventory, just beyond prior-range and -value, suggesting a potential for immediate directional opportunity.
In the best case, the S&P 500 trades higher.
Any activity above the $3,755.00 VPOC puts into play the $3,774.75 HVNode. Initiative trade beyond the HVNode could reach as high as the $3,807.00 VPOC and $3,830.75 MCPOC, or higher.
In the worst case, the S&P 500 trades lower.
Any activity below the $3,755.00 VPOC puts into play the $3,715.75 LVNode. Initiative trade beyond the LVNode could reach as low as the $3,688.75 HVNode and $3,639.00 RTH Low, or lower.
Click here to load today’s key levels into the web-based TradingView charting platform. Note that all levels are derived using the 65-minute timeframe. New links are produced, daily.
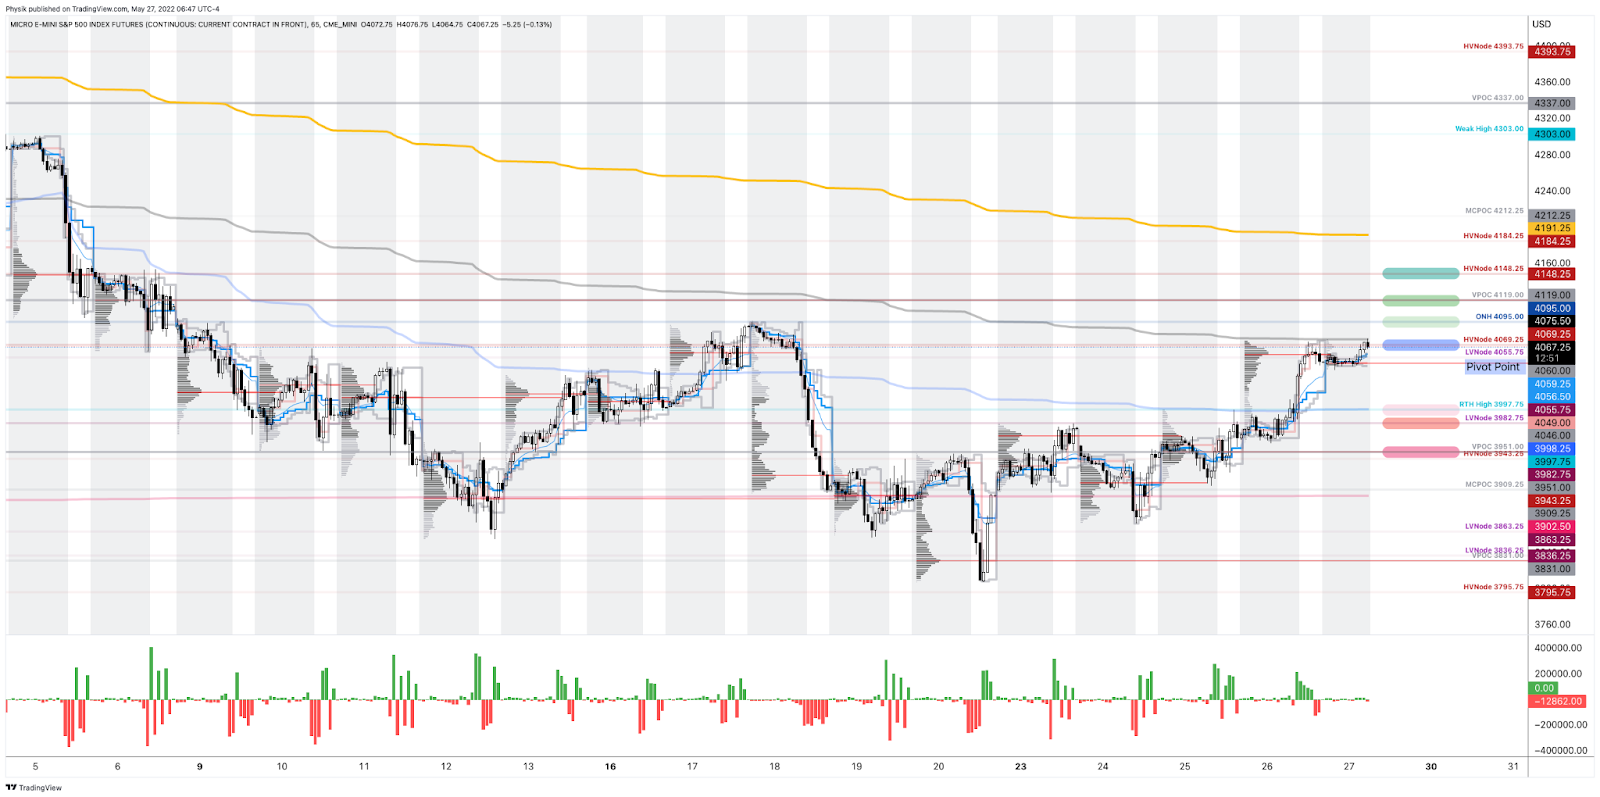
Graphic: 65-minute profile chart of the Micro E-mini S&P 500 Futures.
Considerations: Responsiveness near key-technical areas (that are discernable visually on a chart), suggests technically-driven traders with short time horizons are very active.
Such traders often lack the wherewithal to defend retests and, additionally, the type of trade may be indicative of the other time frame participants waiting for more information to initiate trades.
Definitions
Volume Areas: A structurally sound market will build on areas of high volume (HVNodes). Should the market trend for long periods of time, it will lack sound structure, identified as low volume areas (LVNodes). LVNodes denote directional conviction and ought to offer support on any test.
If participants were to auction and find acceptance into areas of prior low volume (LVNodes), then future discovery ought to be volatile and quick as participants look to HVNodes for favorable entry or exit.
POCs: POCs are valuable as they denote areas where two-sided trade was most prevalent in a prior day session. Participants will respond to future tests of value as they offer favorable entry and exit.
MCPOCs: POCs are valuable as they denote areas where two-sided trade was most prevalent over numerous day sessions. Participants will respond to future tests of value as they offer favorable entry and exit.
Volume-Weighted Average Prices (VWAPs): A metric highly regarded by chief investment officers, among other participants, for quality of trade. Additionally, liquidity algorithms are benchmarked and programmed to buy and sell around VWAPs.
About
After years of self-education, strategy development, mentorship, and trial-and-error, Renato Leonard Capelj began trading full-time and founded Physik Invest to detail his methods, research, and performance in the markets.
Capelj also develops insights around impactful options market dynamics at SpotGamma and is a Benzinga reporter.
In no way should the materials herein be construed as advice. Derivatives carry a substantial risk of loss. All content is for informational purposes only.
The daily brief is a free glimpse into the prevailing fundamental and technical drivers of U.S. equity market products. Join the 300+ that read this report daily, below!
Graphic updated 6:20 AM ET. Sentiment Neutral if expected /ES open is inside of the prior day’s range. /ES levels are derived from the profile graphic at the bottom of the following section. Levels may have changed since initially quoted; click here for the latest levels. SqueezeMetrics Dark Pool Index (DIX) and Gamma (GEX) calculations are based on where the prior day’s reading falls with respect to the MAX and MIN of all occurrences available. A higher DIX is bullish. At the same time, the lower the GEX, the more (expected) volatility. Learn the implications of volatility, direction, and moneyness. Breadth reflects a reading of the prior day’s NYSE Advance/Decline indicator. VIX reflects a current reading of the CBOE Volatility Index (INDEX: VIX) from 0-100.
Fundamental
Key for Wednesday, July 13, are inflation figures – the CPI report – as this will drive perceptions regarding future Fed activity.
Expected is an 8.8% rise year-over-year (YoY) and 1.1% month-over-month (MoM). In May, these numbers were 8.6% and 1.0%, respectively.
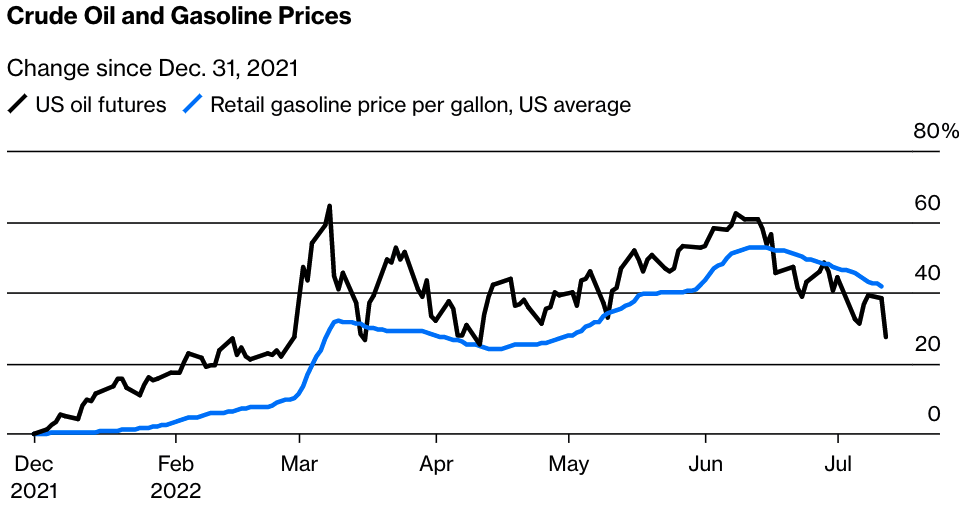
Graphic: Via Bloomberg. “The national average price for a gallon of gasoline retreated to $4.66 as of July 11, a decline of 7% from an all-time high of $5.02 a gallon on June 13. But that is not as large as the fall in oil prices, because fuel manufacturing is in such short supply. Refining now accounts for 26% of the cost of a gallon of gasoline, up from 14%.”
Core CPI (which excludes food and energy) is expected to rise by a rate lower than in April, 5.7% YoY and 0.5% MoM, respectively.
Mattering most is core inflation, which the Fed has more control over. If lower than expected, that may warrant some appetite for risk.
“If I’m right about June being the start of a string of lower core CPI prints, which is what the Fed wants to see, then I think comments from officials will quickly switch to a 50 basis-point hike for September and there were more calls for slowing to 25 basis points late in the year,” said Omair Sharif, founder of Inflation Insights LLC.
On the other hand, if “higher than expected, we’ll feel this is definitely the peak,” said Tom Simons, money market economist at Jefferies Financial Group (NYSE: JEF).
We can speculate as to where the market may move next, after the release of inflation figures, this week. What’s likely is that, even if the print is hot, the first move is to be structural, per Kai Volatility’s Cem Karsan.
“A function of inevitable rebalancing of dealer inventory post-event. The second move and final resolution, if you wait for it, is usually tied to the incremental effects on liquidity (QE/QT).”
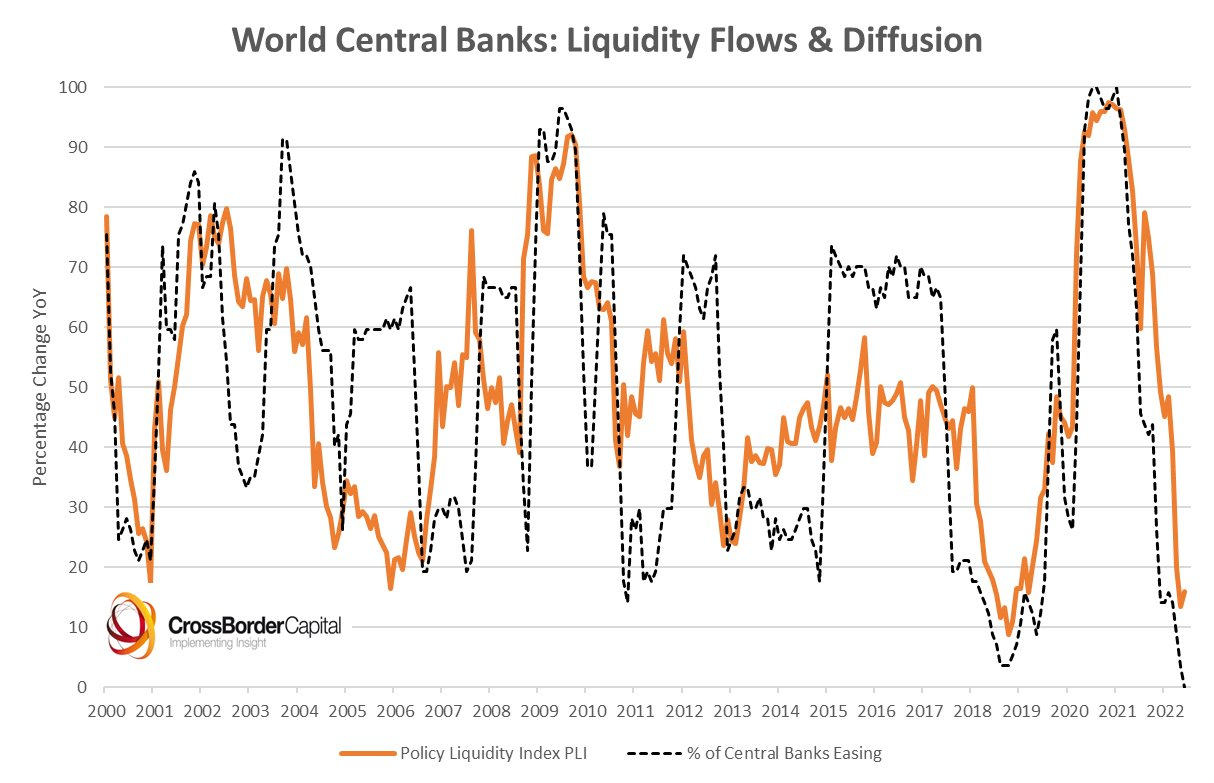
Graphic: Retrieved from CrossBorder Capital. The “evidence of the huge Global liquidity squeeze. This is a major policy blunder building.”
Rising inflation probably bolsters the Fed’s backing of a 75 basis point rate hike on July 27. So, don’t fight the Fed. Rising rates and the withdrawal of liquidity prompts a continued de-rate.
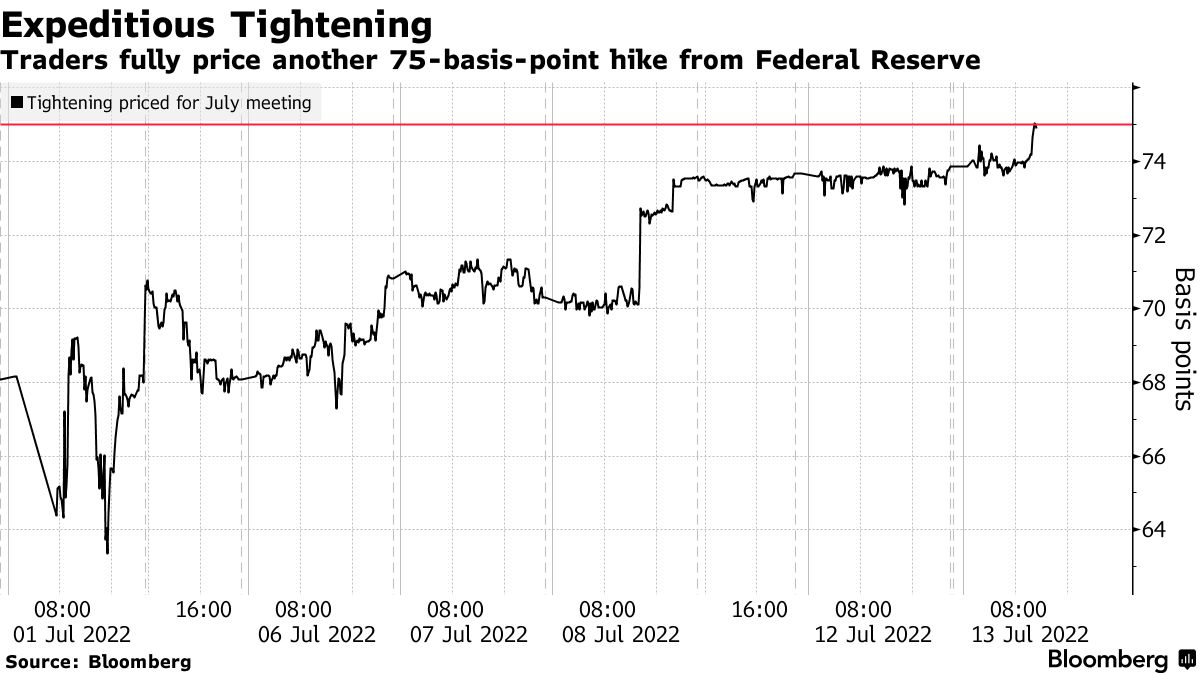
Graphic: Via Bloomberg. “Money markets are betting on a three quarter-percentage-point hike by Federal Reserve officials later this month, wagering the US will need to keep the screws on policy to tame inflation.”
Knowing this, the “flattening in the downside fixed strike skew, while the upside wings [are] more smiley,” as described by JPMorgan Chase & Co (NYSE: JPM), has made for attractive low-cost spread opportunities, as talked about yesterday and in the July 8, 2022 letter.
The moral is as follows: own volatility where the market is likely to not expire. Sell it where the market is likely to expire. Just because implied (IVOL) volatility is at a high starting point does not mean it should be sold, blindly.
As of 6:20 AM ET, Wednesday’s regular session (9:30 AM – 4:00 PM ET), in the S&P 500, is likely to open in the middle part of a positively skewed overnight inventory, inside of prior-range and -value, suggesting a limited potential for immediate directional opportunity.
In the best case, the S&P 500 trades higher.
Any activity above the $3,830.75 MCPOC puts into play the $3,867.25 LVNode. Initiative trade beyond the LVNode could reach as high as the $3,909.25 MCPOC and $3,943.25 HVNode, or higher.
In the worst case, the S&P 500 trades lower.
Any activity below the $3,830.75 MCPOC puts into play the $3,800.25 LVNode. Initiative trade beyond the LVNode could reach as low as the $3,774.75 HVNode and $3,755.00 VPOC, or lower.
Click here to load today’s key levels into the web-based TradingView charting platform. Note that all levels are derived using the 65-minute timeframe. New links are produced, daily.
Graphic: Updated 7/12/2022. 65-minute profile chart of the Micro E-mini S&P 500 Futures.
Considerations: Responsiveness near key-technical areas (that are discernable visually on a chart), suggests technically-driven traders with short time horizons are very active.
Such traders often lack the wherewithal to defend retests and, additionally, the type of trade may be indicative of the other time frame participants waiting for more information to initiate trades.
Definitions
Volume Areas: A structurally sound market will build on areas of high volume (HVNodes). Should the market trend for long periods of time, it will lack sound structure, identified as low volume areas (LVNodes). LVNodes denote directional conviction and ought to offer support on any test.
If participants were to auction and find acceptance into areas of prior low volume (LVNodes), then future discovery ought to be volatile and quick as participants look to HVNodes for favorable entry or exit.
POCs: POCs are valuable as they denote areas where two-sided trade was most prevalent in a prior day session. Participants will respond to future tests of value as they offer favorable entry and exit.
MCPOCs: POCs are valuable as they denote areas where two-sided trade was most prevalent over numerous day sessions. Participants will respond to future tests of value as they offer favorable entry and exit.
Volume-Weighted Average Prices (VWAPs): A metric highly regarded by chief investment officers, among other participants, for quality of trade. Additionally, liquidity algorithms are benchmarked and programmed to buy and sell around VWAPs.
About
After years of self-education, strategy development, mentorship, and trial-and-error, Renato Leonard Capelj began trading full-time and founded Physik Invest to detail his methods, research, and performance in the markets.
Capelj also develops insights around impactful options market dynamics at SpotGamma and is a Benzinga reporter.
In no way should the materials herein be construed as advice. Derivatives carry a substantial risk of loss. All content is for informational purposes only.
The daily brief is a free glimpse into the prevailing fundamental and technical drivers of U.S. equity market products. Join the 300+ that read this report daily, below!
Graphic updated 7:00 AM ET. Sentiment Risk-Off if expected /ES open is below the prior day’s range. /ES levels are derived from the profile graphic at the bottom of the following section. Levels may have changed since initially quoted; click here for the latest levels. SqueezeMetrics Dark Pool Index (DIX) and Gamma (GEX) calculations are based on where the prior day’s reading falls with respect to the MAX and MIN of all occurrences available. A higher DIX is bullish. At the same time, the lower the GEX, the more (expected) volatility. Learn the implications of volatility, direction, and moneyness. Breadth reflects a reading of the prior day’s NYSE Advance/Decline indicator. VIX reflects a current reading of the CBOE Volatility Index (INDEX: VIX) from 0-100.
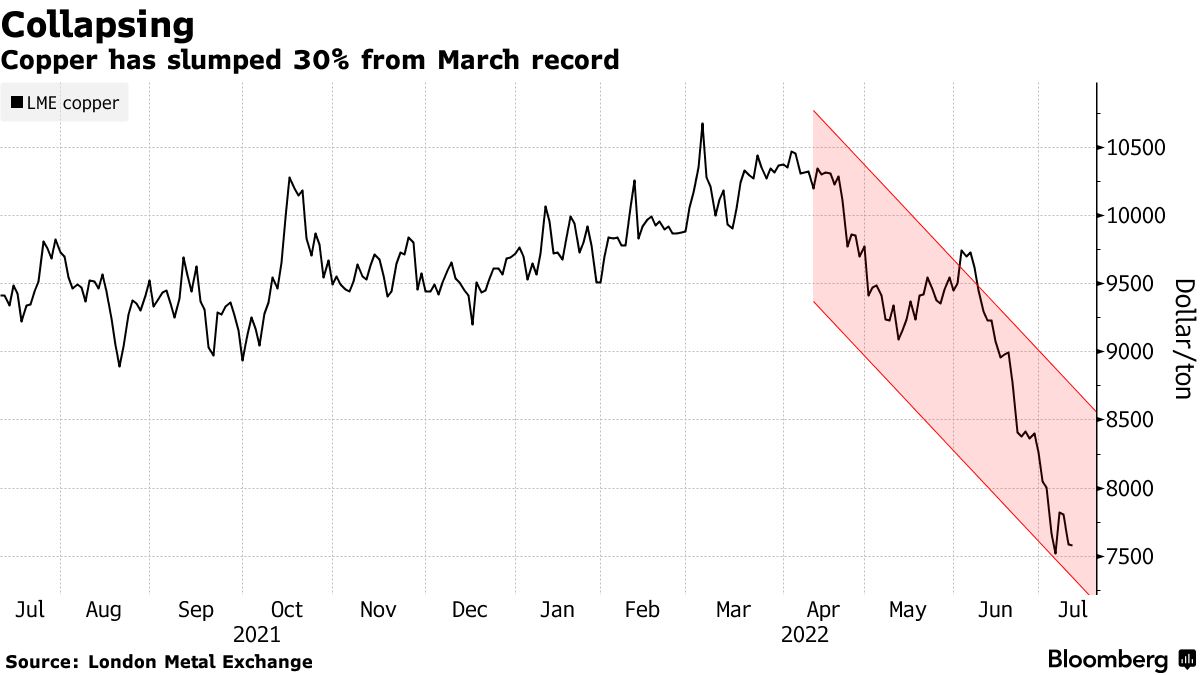
Graphic: Via Bloomberg. Dollar surge, European growth path, waning demand, and increasing supply weigh on copper, a bellwether of the world economy.
A boiling point, if not already, is soon to be reached, in short.
For instance, the energy crisis, which is, in part, the result of earlier capacity erosion, short-term triggers, and panic, is expected to worsen according to the International Energy Agency (IEA).
Per Goldman Sachs Group Inc (NYSE: GS), a “full interruption to Russian flows to Europe would be equivalent to a 35% supply shock to the European gas market.”
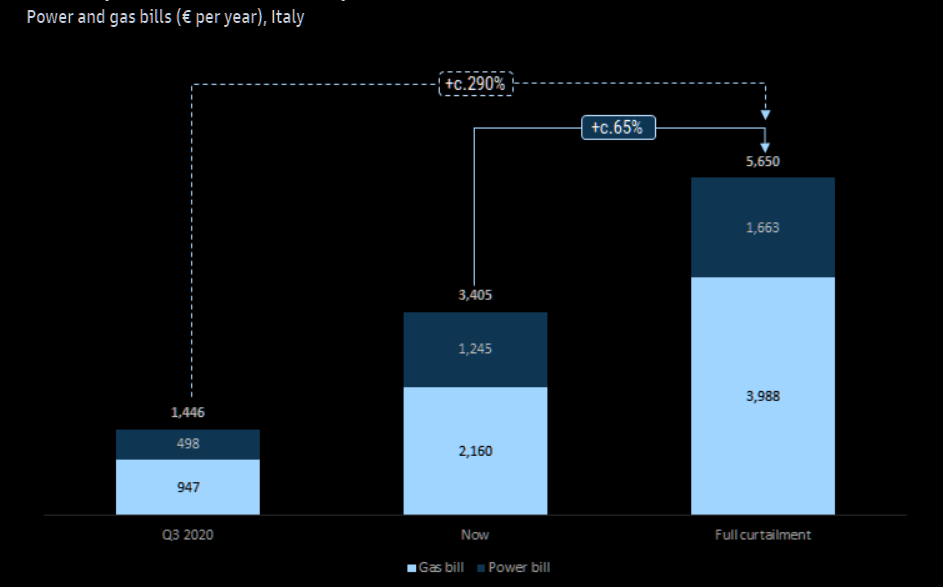
Graphic: Retrieved via The Market Ear. Via Goldman Sachs Group Inc (NYSE: GS). “[W]e estimate bills would increase by c.65% from here in this event, bringing the total household cost for power and gas to nearly €500/month, creating a meaningful affordability problem. Versus the summer-2020 trough, we estimate that gas/power bills would have increased by nearly 300% on this basis.”
What does this mean for the markets we’re focused on day-to-day in this letter?
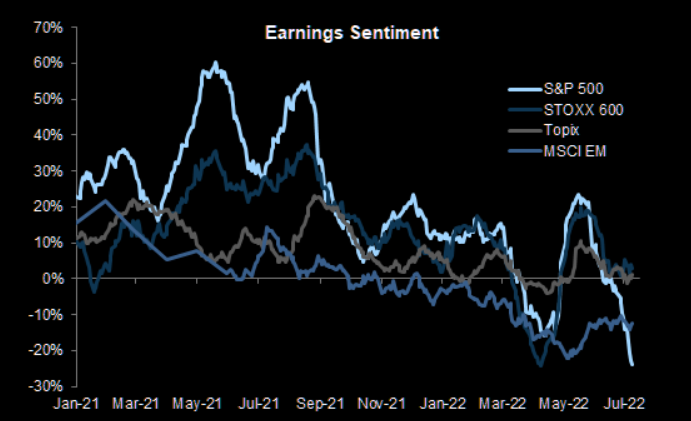
Well – and this is pursuant to the Daily Brief for Monday, July 11 – markets have only suffered through compression in multiples. Does it stop or is there a looming earnings compression?
Most likely there is an earnings compression. For now, it is only sentiment that is taking the hit.
Graphic: Retrieved via The Market Ear. Taken from FactSet Research Systems Inc (NYSE: FDS).
When will the turn occur?
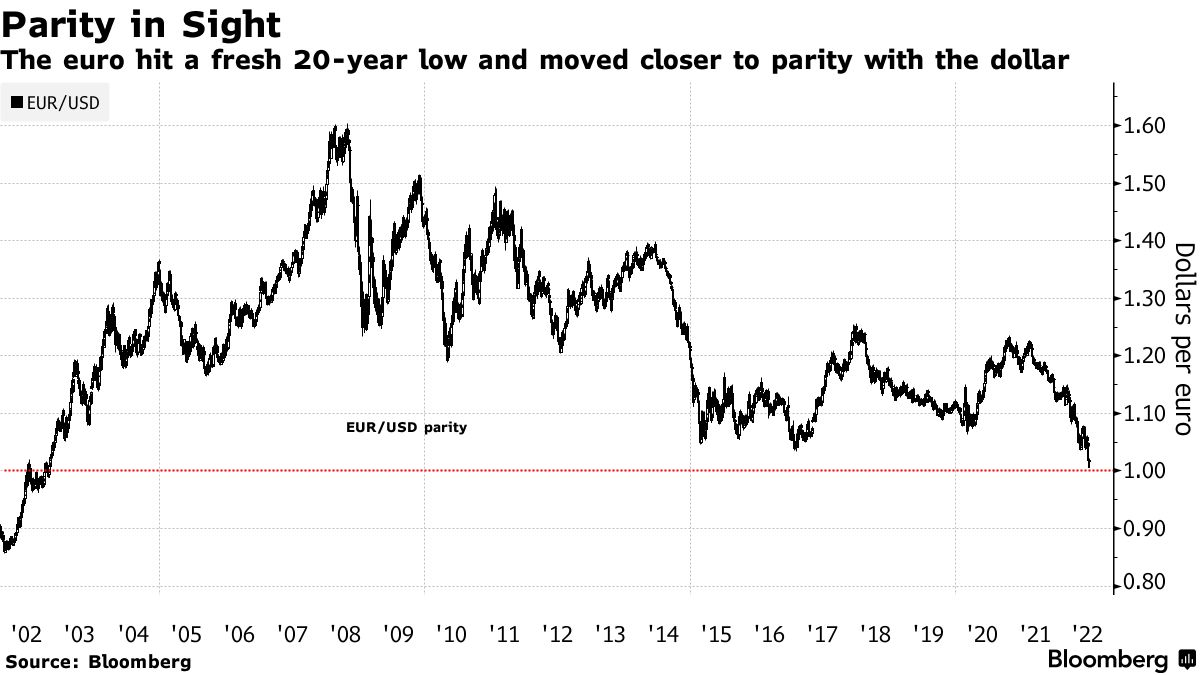
As stated yesterday, it will be the earnings season that is likely to shed clarity on the answer all the while – what is known right now – a strong dollar is for sure to translate into a headwind for S&P 500 earnings growth.
Graphic: Via Bloomberg. The “Fed is still perceived as having more room to hike rates going forward, also on the back of the strong US jobs report for June,” Unicredito SPA (OTC: UNCRY) analysts explained. “On the other hand, other central banks, such as the ECB and the BoE, might be forced to become more prudent, given the more direct exposure their respective economies have to the gas and energy crisis.”
What’s lending to the dollar’s strength?
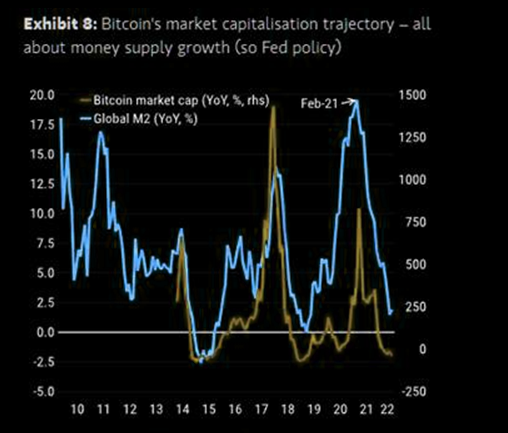
Let’s start with the following. Participants were extending moneyness to nonmonetary assets, given easy monetary policies and an environment of ample debt and leverage (which cuts into asset price volatility).
Graphic: Retrieved from The Market Ear. Via Morgan Stanley (NYSE: MS).
When the reverse happens – tighter liquidity and credit – and volatility eventually rises, the demand (and competition) for money (or cash) deflates assets.
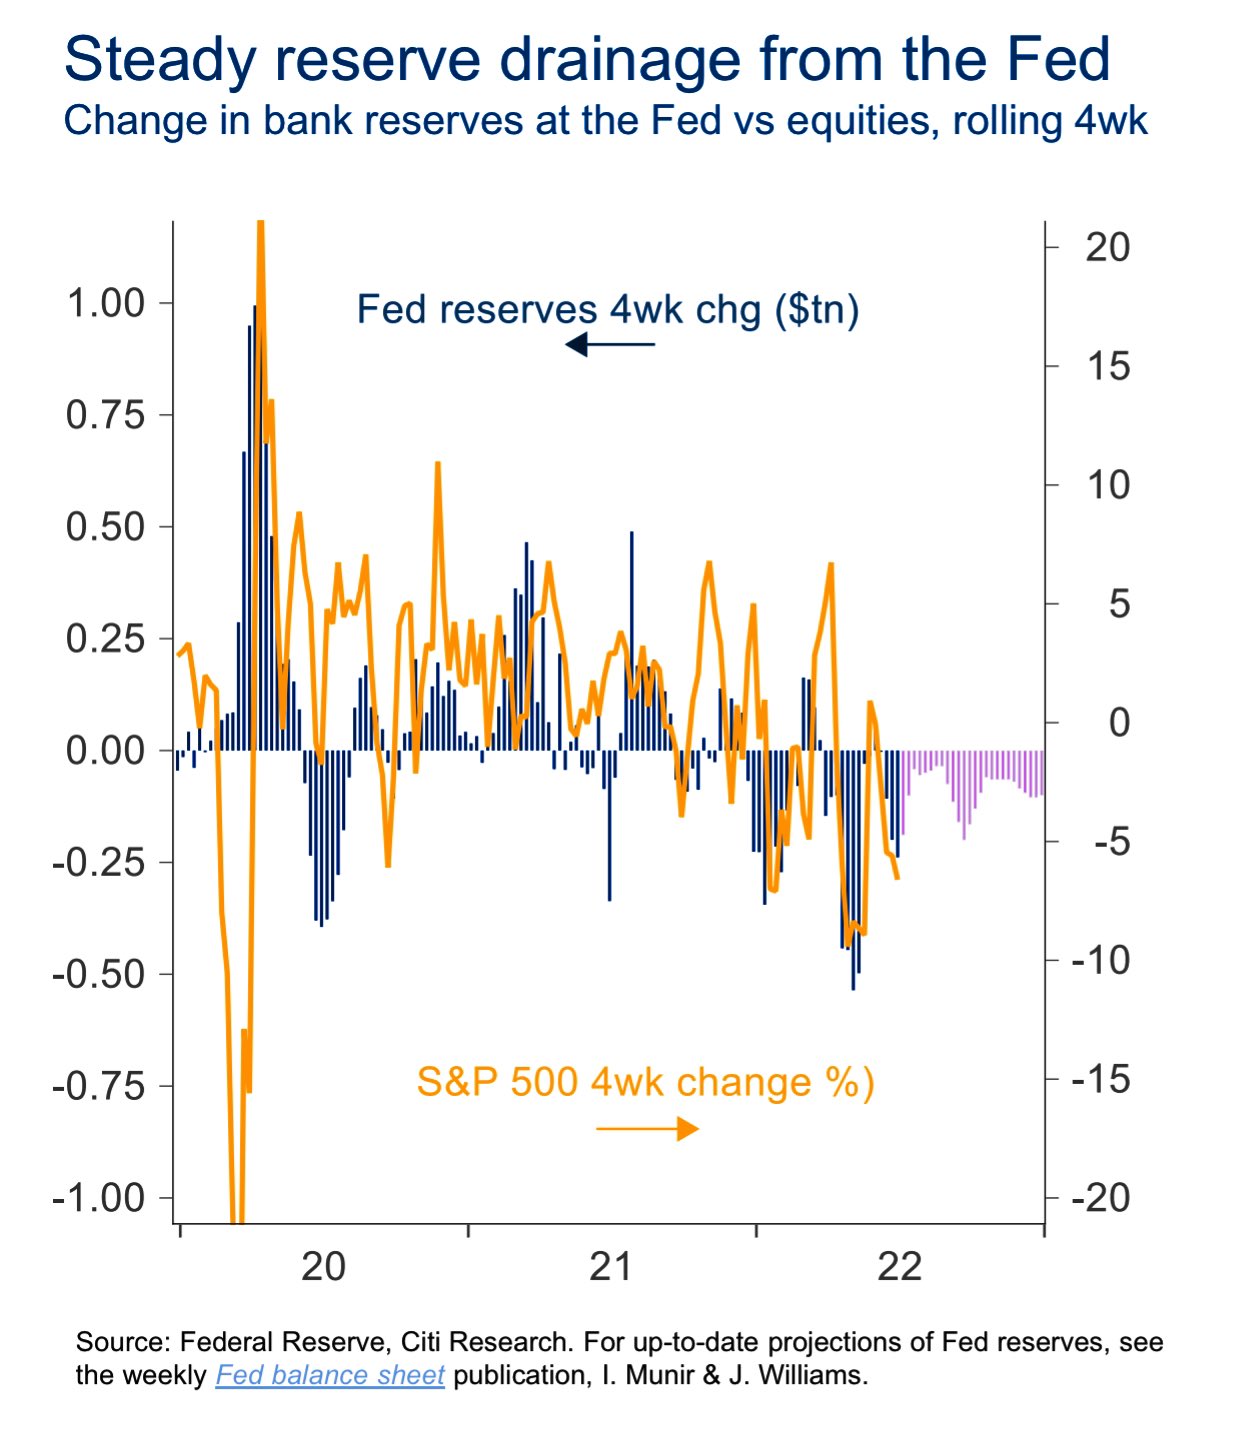
Graphic: Via Citigroup Inc (NYSE: C). According to Joseph Wang, amidst asset price volatility and bank deposits to drain about $1 trillion or so by year-end, investors will “continue to lower their selling prices to compete for the cash they want.”
It is a deflationary pulse manifesting disinflation in consumer prices, that will prompt the Fed to reverse itself on rates and quantitative tightening (QT).
What does this mean?
Depends on the timeframe.
Though the policy pivot may come alongside a peak in the de-rate markets are experiencing, now, longer-term there are multi-decade trends brewing on the back of the de-globalization pulse, for instance, and a tendency to spend wealth, instead of creating it (as supply chains are replicated here at home), is inflationary which makes the context for a more two-sided market in the future (rather than straight up or down).
With the Fed “still perceived as having more room to hike rates going forward,” per Unicredito SPA (OTC: UNCRY), all the while “other central banks, such as the ECB and the BoE … [are] more prudent, given … the[ir] gas and energy crisis,” short-term dollar strength does more to diminish the global reliance on the U.S.
This is explained even better by Lyn Alden of Lyn Alden Investment Strategy.
The dollar is the dominant currency for carry primarily due to easy monetary policies removing the risk of an ultra-strong dollar. Accordingly, the dollar is “the currency that most offshore debt is denominated in all over the world,” as explained by Bankless, who interviewed Alden.
“Non-US entities make dollar-based loans and transactions in pretty much all markets everywhere because it’s considered more trustworthy than native fiat,” they add. “When there’s a disruption in global cash flows, there’s effectively a short squeeze on the dollar.”
“The stronger the dollar gets in comparison, the less tenable it becomes as a global reserve,” and that is a pressure on the long-term trajectory of that currency.
Positioning
Yesterday’s letter was spot on with respect to positioning.
We can speculate as to where the market may move next, after the release of inflation figures, this week. What’s likely is that, even if the print is hot, the first move is to be structural, per Kai Volatility’s Cem Karsan.
“A function of inevitable rebalancing of dealer inventory post-event. The second move and final resolution, if you wait for it, is usually tied to the incremental effects on liquidity (QE/QT).”
Rising inflation probably bolsters the Fed’s backing of a 75 basis point rate hike on July 27. So, don’t fight the Fed. Rising rates and the withdrawal of liquidity prompts a continued de-rate.
Knowing this, the “flattening in the downside fixed strike skew, while the upside wings [are] more smiley,” as described by JPMorgan Chase & Co (NYSE: JPM), has made for attractive low-cost spread opportunities, as talked about yesterday and in the July 8, 2022 letter.
The moral is as follows: own volatility where the market is likely to not expire. Sell it where the market is likely to expire. Just because implied (IVOL) volatility is at a high starting point does not mean it should be sold, blindly.
As of 7:00 AM ET, Tuesday’s regular session (9:30 AM – 4:00 PM ET), in the S&P 500, is likely to open in the lower part of a negatively skewed overnight inventory, outside of prior-range and -value, suggesting a potential for immediate directional opportunity.
In the best case, the S&P 500 trades higher.
Any activity above the $3,830.75 MCPOC puts into play the $3,867.25 LVNode. Initiative trade beyond the LVNode could reach as high as the $3,909.25 MCPOC and $3,943.25 HVNode, or higher.
In the worst case, the S&P 500 trades lower.
Any activity below the $3,830.75 MCPOC puts into play the $3,800.25 LVNode. Initiative trade beyond the LVNode could reach as low as the $3,774.75 HVNode and $3,755.00 VPOC, or lower.
Click here to load today’s key levels into the web-based TradingView charting platform. Note that all levels are derived using the 65-minute timeframe. New links are produced, daily.
Graphic: 65-minute profile chart of the Micro E-mini S&P 500 Futures.
Considerations: Responsiveness near key-technical areas (that are discernable visually on a chart), suggests technically-driven traders with short time horizons are very active.
Such traders often lack the wherewithal to defend retests and, additionally, the type of trade may be indicative of the other time frame participants waiting for more information to initiate trades.
Example: The below 65-minute S&P 500 chart with volume profiles was included in the July 8, 2022 edition of the newsletter. Prices were near an inflection (micro-composite point of control and two key volume-weighted average price levels). From thereon, selling surfaced.
This is what is meant by responsiveness near key-technical areas.
Graphic: Updated 7/2/22. 65-minute profile chart of the Micro E-mini S&P 500 Futures.
Definitions
Volume Areas: A structurally sound market will build on areas of high volume (HVNodes). Should the market trend for long periods of time, it will lack sound structure, identified as low volume areas (LVNodes). LVNodes denote directional conviction and ought to offer support on any test.
If participants were to auction and find acceptance into areas of prior low volume (LVNodes), then future discovery ought to be volatile and quick as participants look to HVNodes for favorable entry or exit.
POCs: POCs are valuable as they denote areas where two-sided trade was most prevalent in a prior day session. Participants will respond to future tests of value as they offer favorable entry and exit.
MCPOCs: POCs are valuable as they denote areas where two-sided trade was most prevalent over numerous day sessions. Participants will respond to future tests of value as they offer favorable entry and exit.
Volume-Weighted Average Prices (VWAPs): A metric highly regarded by chief investment officers, among other participants, for quality of trade. Additionally, liquidity algorithms are benchmarked and programmed to buy and sell around VWAPs.
About
After years of self-education, strategy development, mentorship, and trial-and-error, Renato Leonard Capelj began trading full-time and founded Physik Invest to detail his methods, research, and performance in the markets.
Capelj also develops insights around impactful options market dynamics at SpotGamma and is a Benzinga reporter.
In no way should the materials herein be construed as advice. Derivatives carry a substantial risk of loss. All content is for informational purposes only.
The daily brief is a free glimpse into the prevailing fundamental and technical drivers of U.S. equity market products. Join the 300+ that read this report daily, below!
Overnight, equity index futures resolved a multi-day consolidation and auctioned higher, far beyond the prior day’s range. Commodities were mixed while bonds were lower.
The break from consolidation is one of the most bullish happenings in weeks. We’re monitoring whether participants add to their recent short volatility bets against direction, or whether there is repositioning and this bolsters the initiative probe.
Ahead is data on University of Michigan consumer sentiment, inflation expectations, and new home sales (10:00 AM ET), as well as some Fed speak (7:30 AM and 4:00 PM ET).
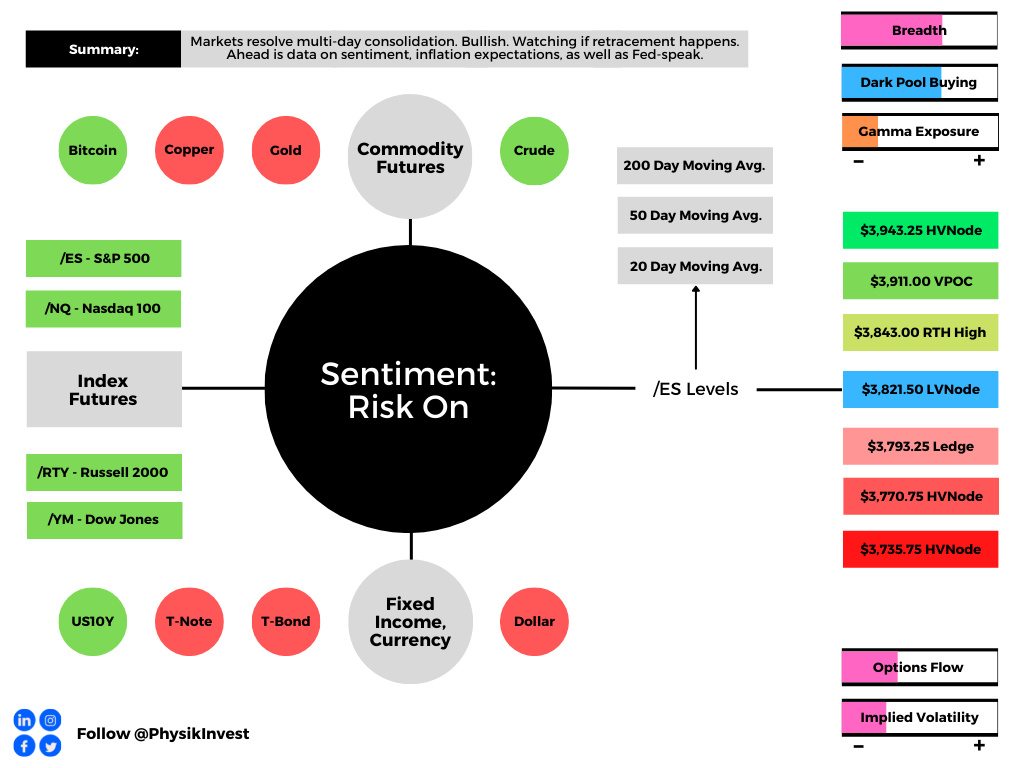
Graphic updated 6:40 AM ET. Sentiment Risk-On if expected /ES open is above the prior day’s range. /ES levels are derived from the profile graphic at the bottom of the following section. Levels may have changed since initially quoted; click here for the latest levels. SqueezeMetrics Dark Pool Index (DIX) and Gamma (GEX) calculations are based on where the prior day’s reading falls with respect to the MAX and MIN of all occurrences available. A higher DIX is bullish. At the same time, the lower the GEX, the more (expected) volatility. Learn the implications of volatility, direction, and moneyness. SHIFT data used for S&P 500 (INDEX: SPX) options activity. Note that options flow is sorted by the call premium spent; if more positive, then more was spent on call options. Breadth reflects a reading of the prior day’s NYSE Advance/Decline indicator. VIX reflects a current reading of the CBOE Volatility Index (INDEX: VIX) from 0-100.
What To Expect
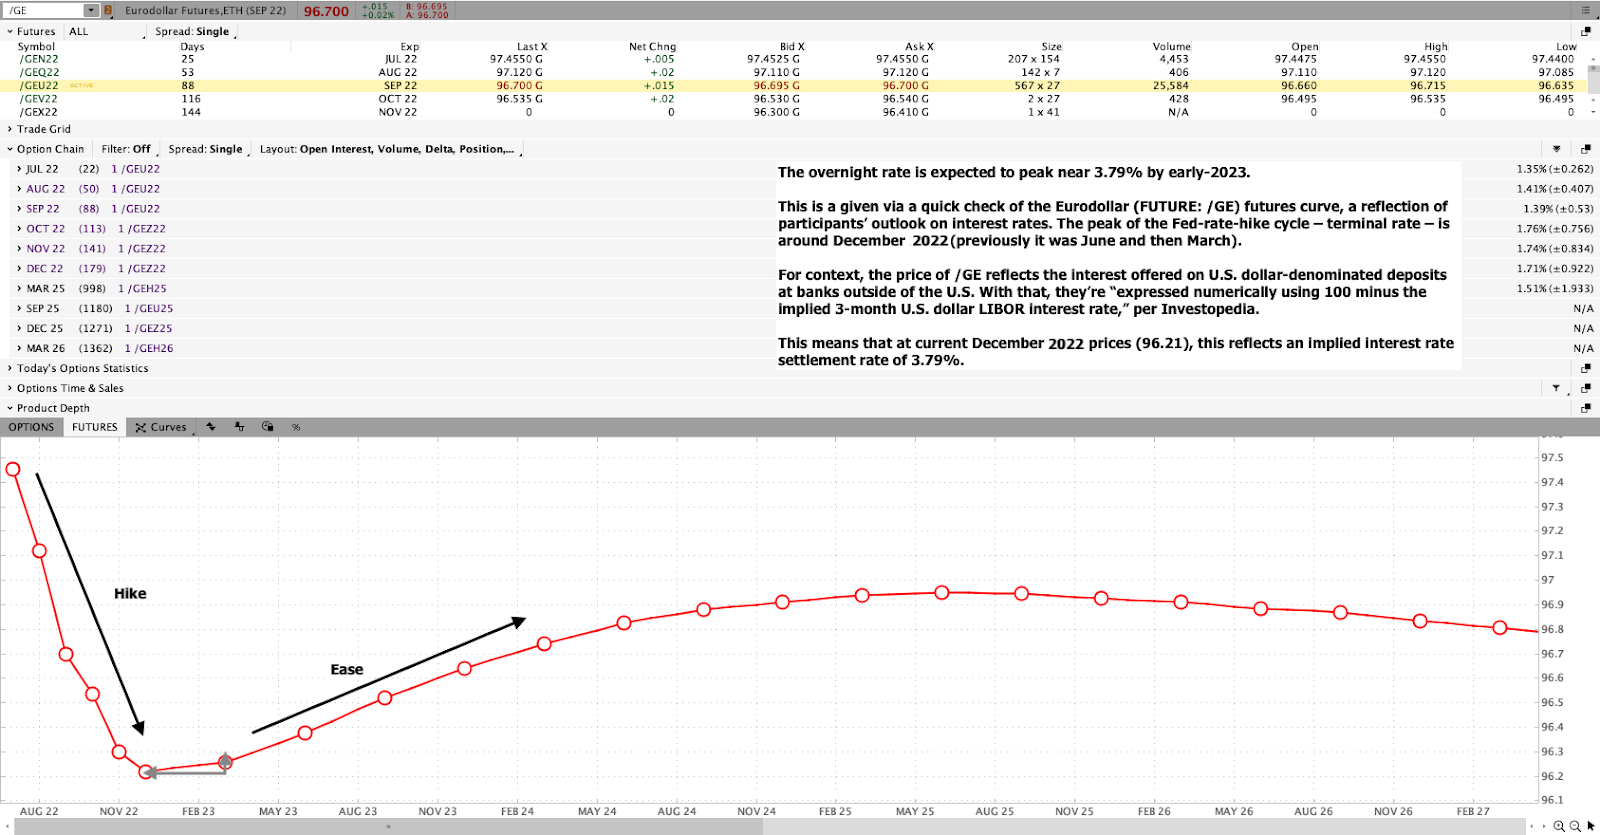
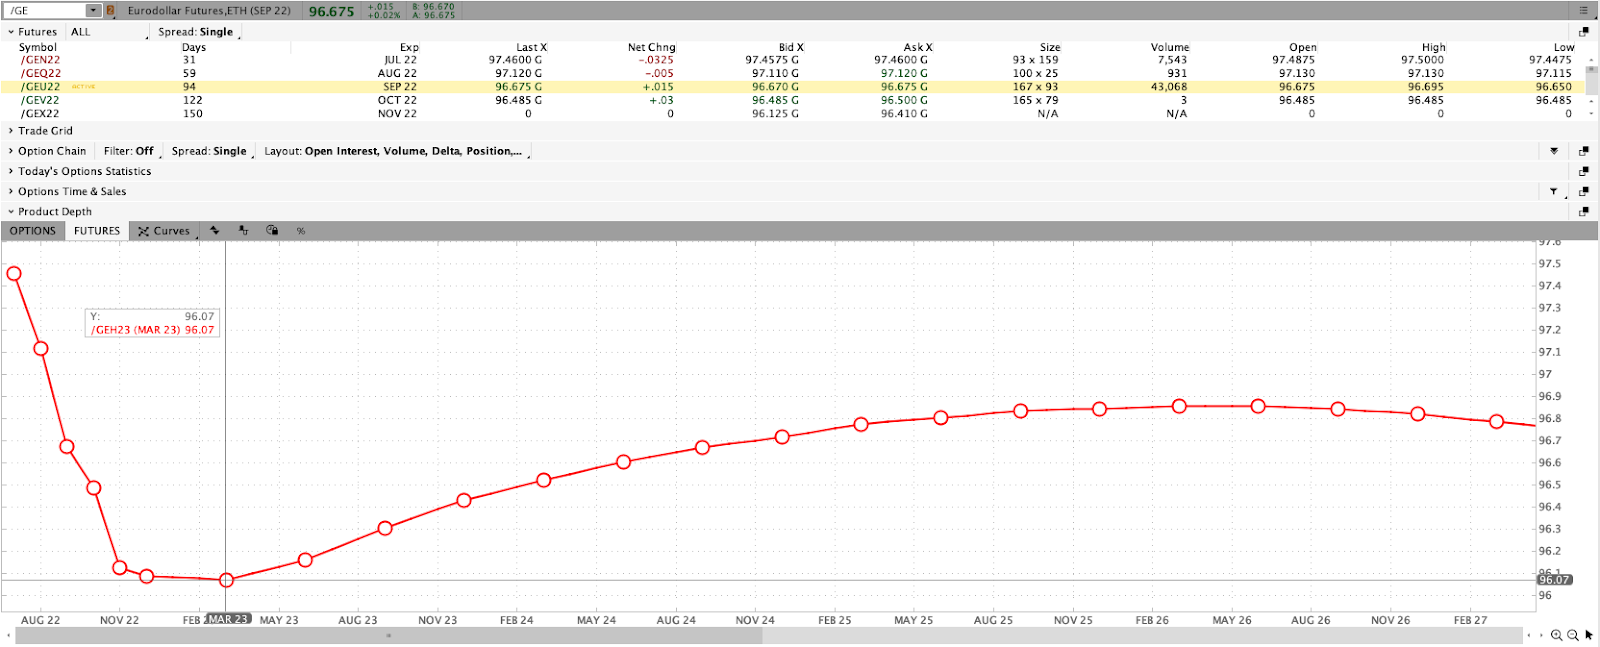
Fundamental: To start, I want to apologize for any confusion, yesterday, with respect to the /GE Eurodollar quote. This newsletter said the peak of the Fed-rate-hike cycle – terminal rate – sat near December 2023.
That’s wrong. It’s December 2022.
Graphic: Via Charles Schwab Corporation-owned (NYSE: SCHW) TD Ameritrade’s Thinkorswim. The Eurodollar (FUTURE: /GE) futures curve is a reflection of participants’ outlook on interest rates. The peak of the Fed-rate-hike cycle – terminal rate – is around DEC 20[22].
Okay, moving on, now!
New data is pointing to a “remarkable” drop in demand for goods and services during June, compared to months prior.
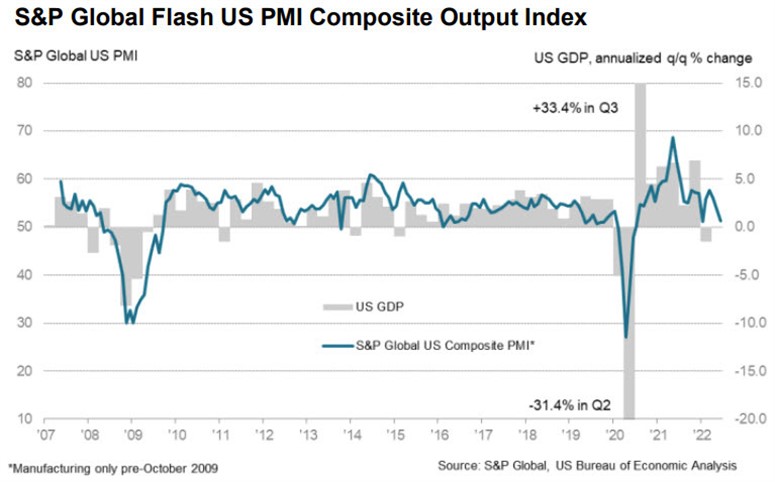
“US economic growth has slowed sharply in June, with deteriorating forward-looking indicators setting the scene for an economic contraction in the third quarter,” S&P Global (NYSE: SPGI) Market Intelligence’s Chris Williamson explained.
“The survey data are consistent with the economy expanding at an annualized rate of less than 1% in June, with the goods-producing sector already in decline and the vast service sector slowing sharply.”
Graphic: Via S&P Global Inc. “This is a sizeable miss and evidence of a quick slowdown in demand, though it’s still in positive territory (above 50). This report is consistent with a shifting narrative away from inflation worries and towards growth worries.”
Businesses (particularly in retail) are way “more concerned about the outlook” of costs and demand, as well as the path in monetary policies and deterioration in financial conditions.
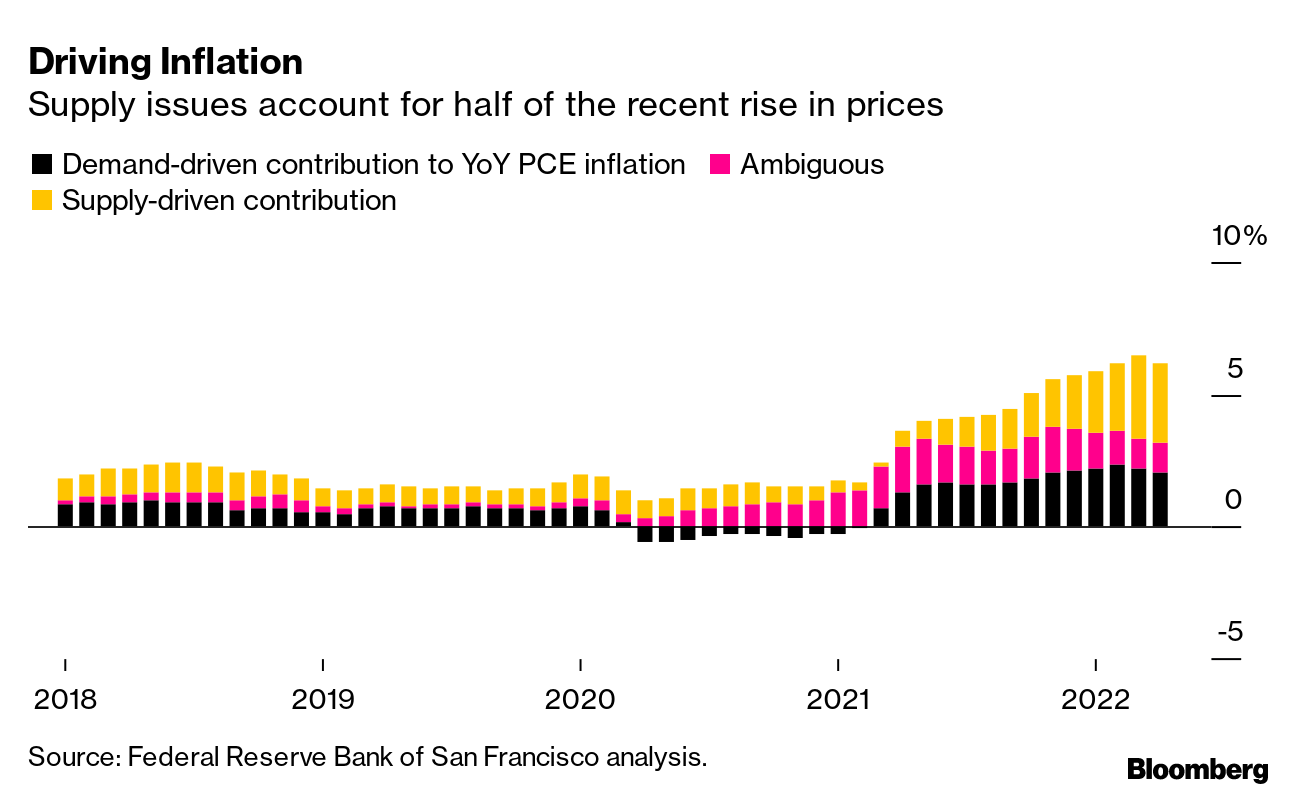
Graphic: Via Bloomberg. “Supply constraints, exacerbated by Russia’s war in Ukraine this year, account for about half of the surge in US inflation, with demand currently making up a third of the increase, according to new research from the Federal Reserve Bank of San Francisco.”
That’s validated by Tesla Inc’s (NASDAQ: TSLA) CEO Elon Musk speaking about the carmaker’s losses from new plants, supply chain problems, and the like.
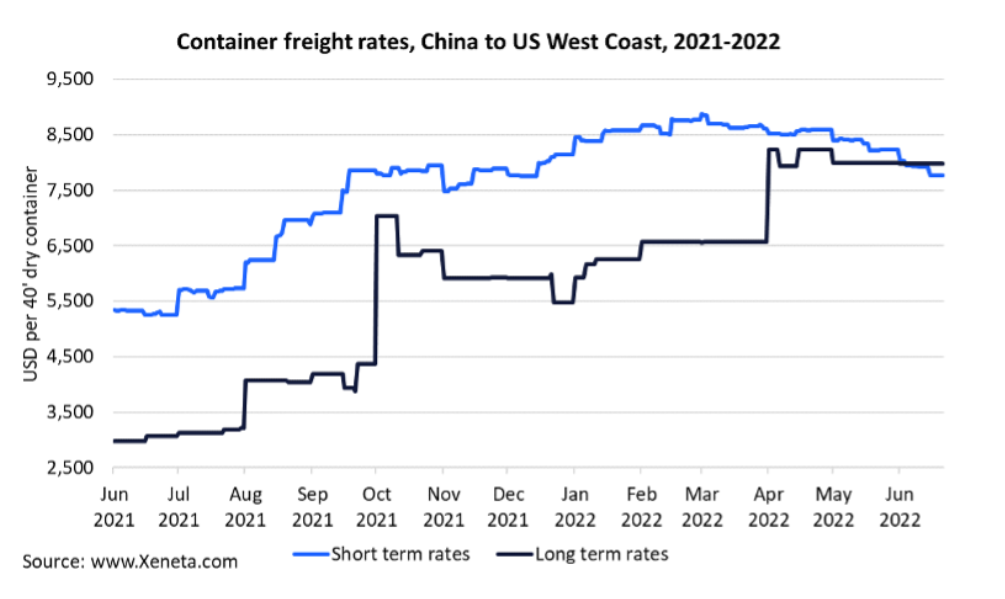
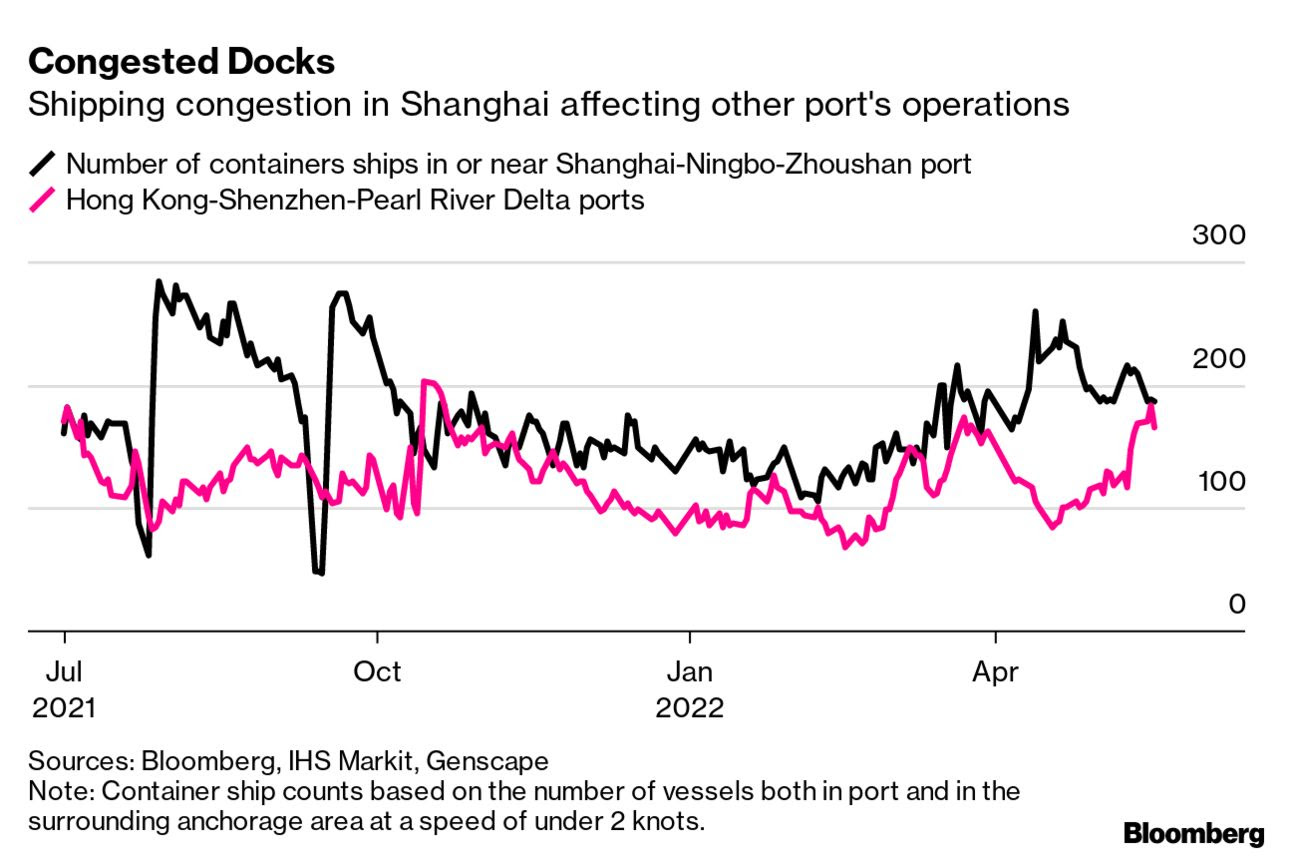
Graphic: Via Bloomberg. “Long-term ocean freight rates between China and the US West Coast are higher than spot prices for the first time since April 2020.”
“The past two years have been an absolute nightmare of supply chain interruptions, one thing after another,” Musk said.
“We’re not out of it yet. That’s overwhelmingly our concern is how do we keep the factories operating so we can pay people and not go bankrupt.”
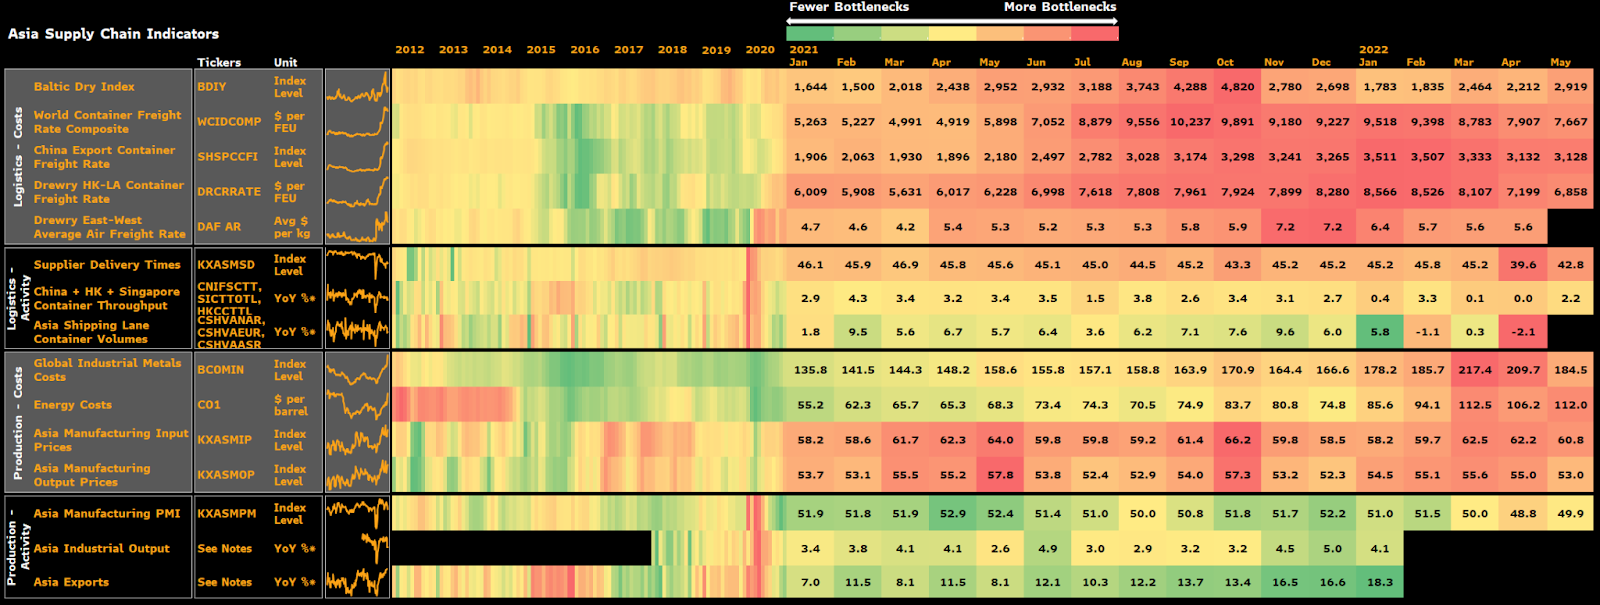
Graphic: Via Bloomberg. “Supply chains in Asia look to be on the mend,” though it will “ take a while for supply and demand to rebalance.”
It’s a global move into recession all at once, as Jeffrey Snider of Alhambra Investments says.
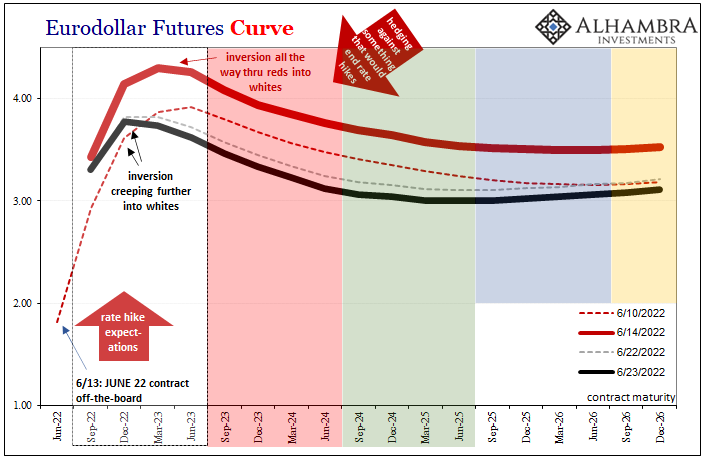
“Combine the potential for break in repo collateral with economy heading toward recession, no wonder the Euro[dollar] curve inversion is spreading as rapidly as it has. Possibility of something big going wrong, therefore ending rate hikes, is huge now.”
“Euro[dollar] squeeze, collateral shortage, deflationary potential in money, and now demand destruction in global real economy.”
Graphic: Via Alhambra Investments.
Over the last four decades, monetary policy was a go-to for supporting the economy. Money was sent to capital and that promoted innovation and, by that token, deflation, ultimately creating “unimportance to cash flows,” as well put by Kai Volatility’s Cem Karsan.
Now, there’s a strong commitment to reducing liquidity and credit, all the while there are chokepoints monetary policymakers have little control over.
This has consequences on the real economy and asset prices, accordingly, which rose and kept deflationary pressures at bay. A stock market drop is both a recession and a direct reflection of the unwind of carry. It is the manifestation of a deflationary shock, and today’s poor sentiments and economic data reflects this.
At the same time, “bonds are not acting as a hedge and appear to be becoming less ‘money’ like due persistent declines in price and elevated rate vol,” as Joseph Wang puts it.
Bank deposits are to drain about $1 trillion or so by year-end, prompting investors to “continue to lower their selling prices to compete for the cash they want.”
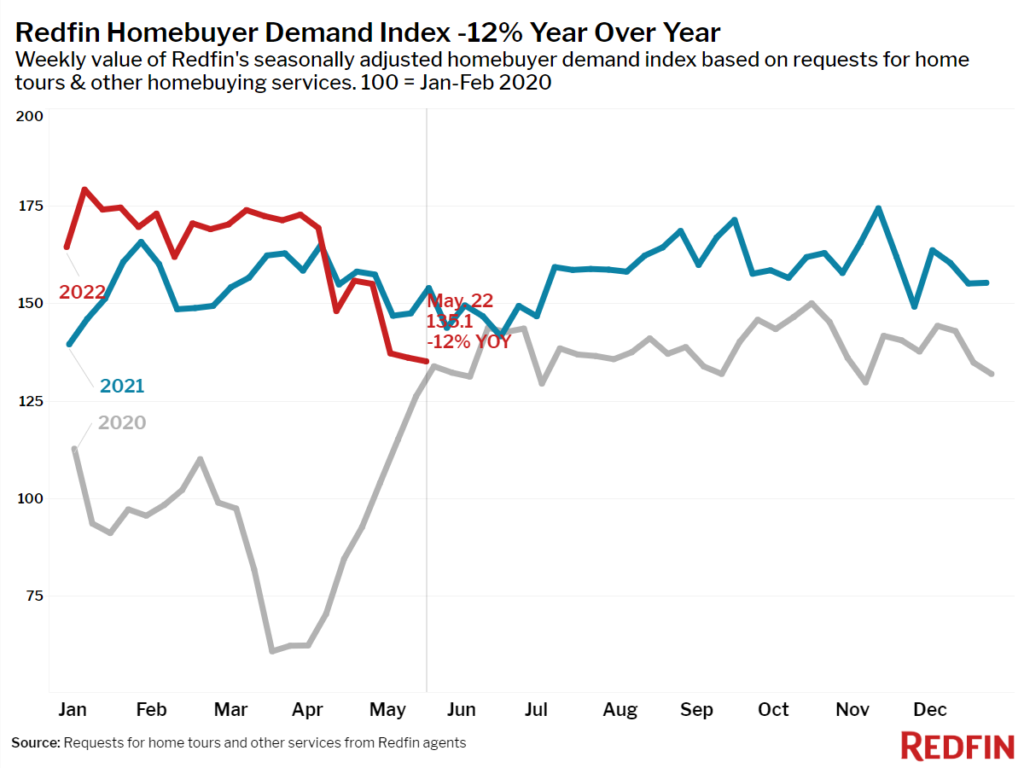
Retail buyers, who, according to Michael Wang of Prometheus Alternative Investments, “were a significant driver of the inflated valuations we saw in tech and crypto,” are capitulating in stocks, all the while froth in housing markets is soon to abate, likewise.
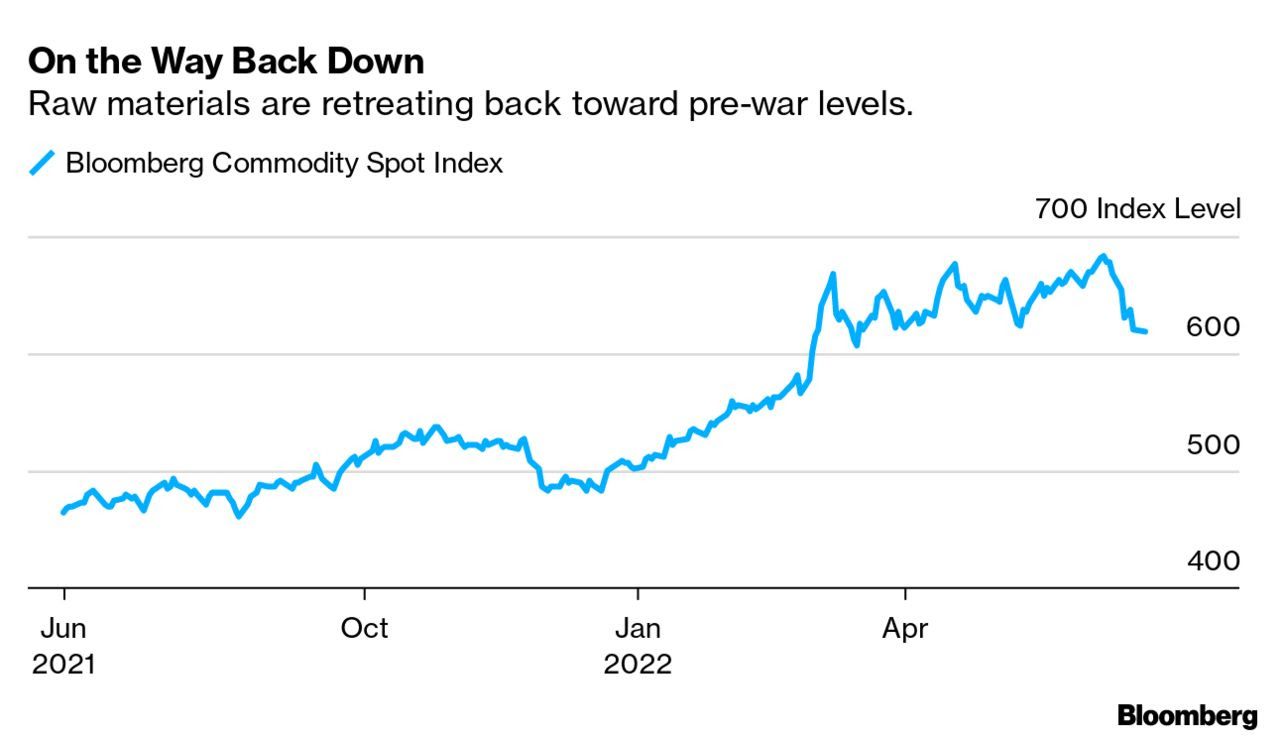
Notwithstanding, Mark Zandi of Moody’s Corporation (NYSE: MCO) does not see “the kind of mortgage defaults and distressed sales that would be necessary for big declines in housing values,” just as prices of raw materials are retreating as inventories are bloating.
As put forth, partially, earlier this week, one has to wonder about the likelihood that inflation is near its high and whether the de-rates have played their course.
Let’s keep an open mind and follow up on this, in detail, next week.
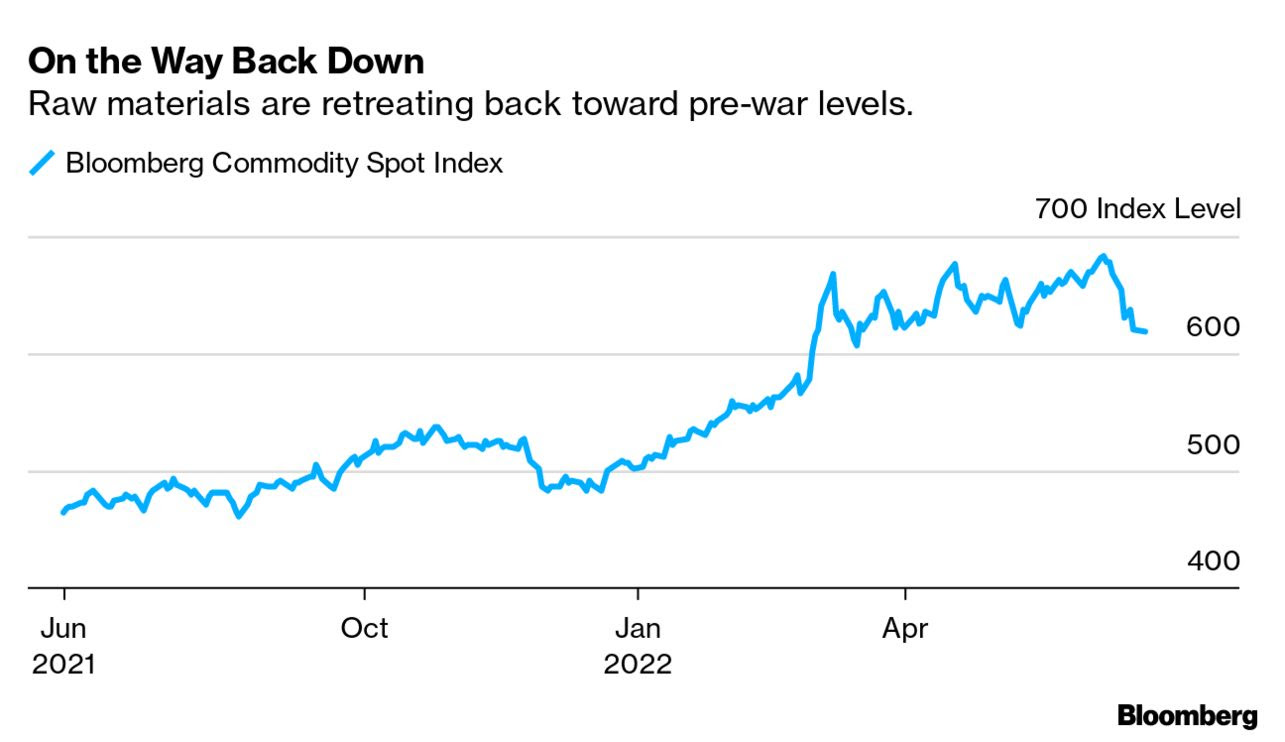
Graphic: Via Bloomberg. “The hot commodities rally is cooling off fast as recession fears again ground and cloud the outlook for demand.”
Positioning: Keeping this section short.
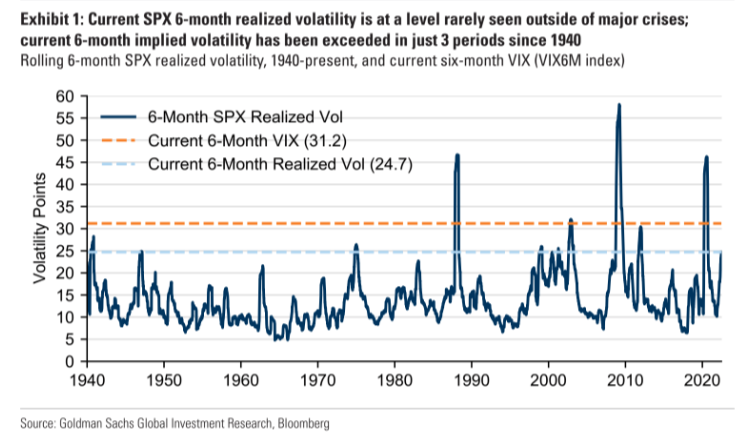
As stated yesterday, a feature of the equity sell-off is the suppression of implied volatility (IVOL) versus that which the market realizes (RVOL) given that participants are hedged and volatility remains in strong supply.
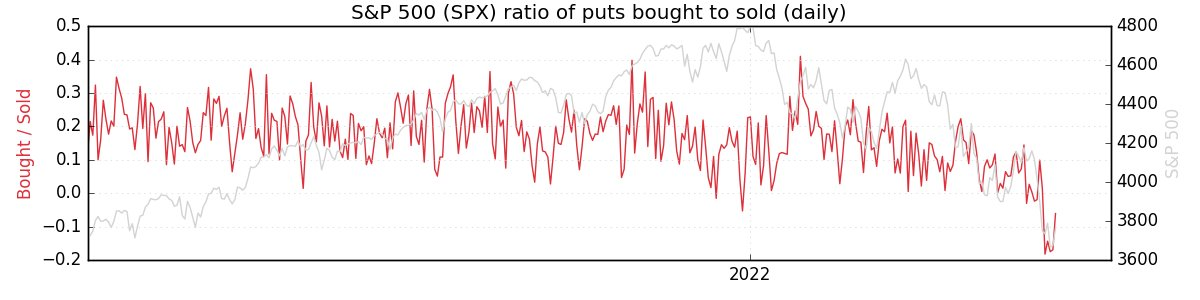
Options data and insights platform SqueezeMetrics explained that this is due in part to lower leverage, too.
“Leveraged long S&P lost favor (understandable), and marginal demand for puts went with it. Creeping into net selling territory is ‘smart’ bear market positioning. Short delta, short skew.”
As I said in SpotGamma’s note, last night, given “the high starting point in IVOL, as well as its place in relation to [RVOL], it makes sense to own structures that benefit either from sharp changes in underlying price or an abrupt repricing in volatility.”
Cutting into the realization of a sharp change in underlying price or a far-reaching rally, however, are short-volatility bets across shorter maturity periods (and the associated hedging), as well as big (and popularized) positions set to roll off at the quarter-end.
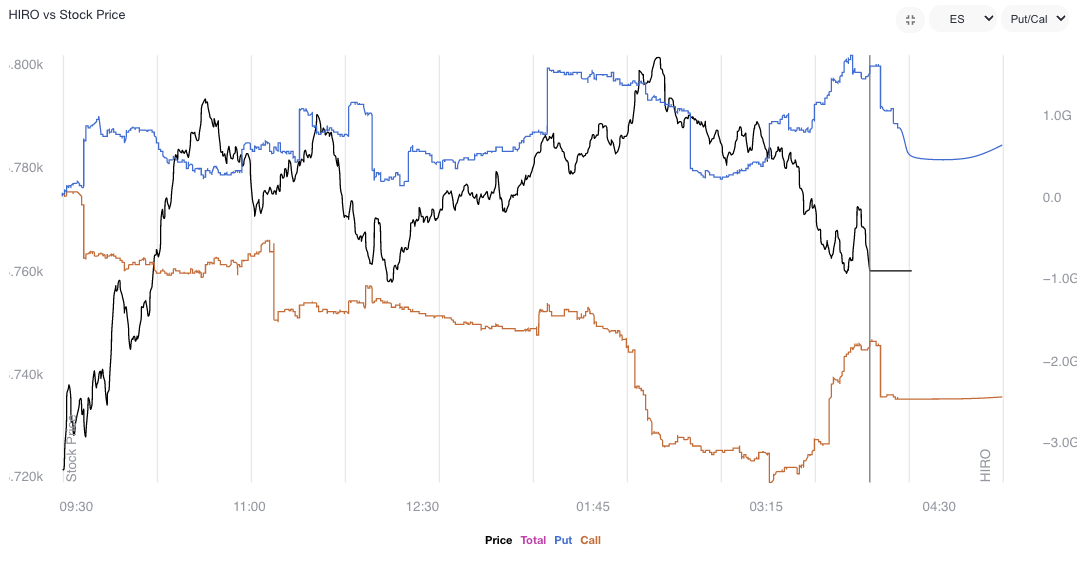
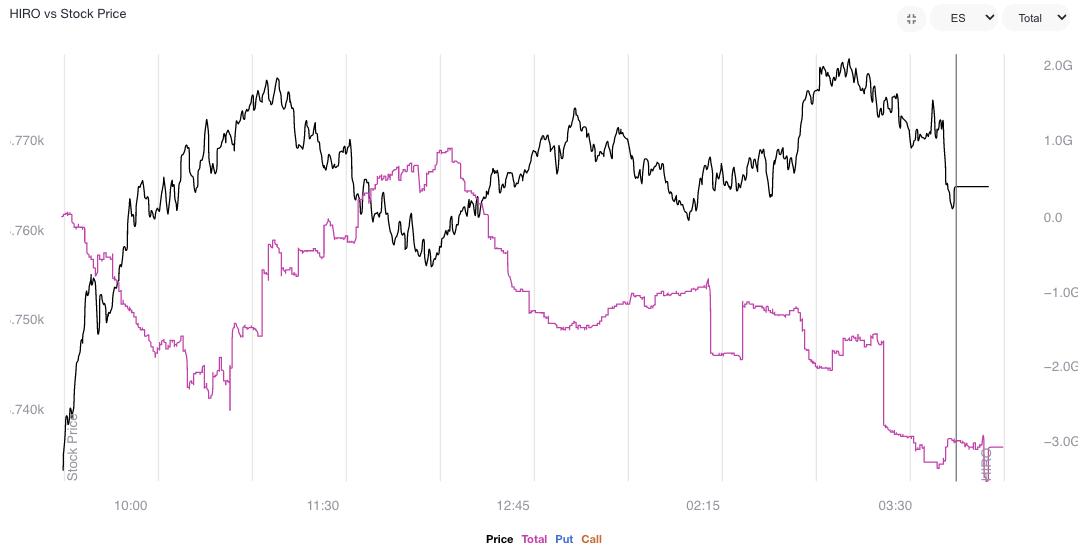
Liquidity providers, per SpotGamma, all else equal, will have to sell to re-hedge, and we will talk about this further, next week.
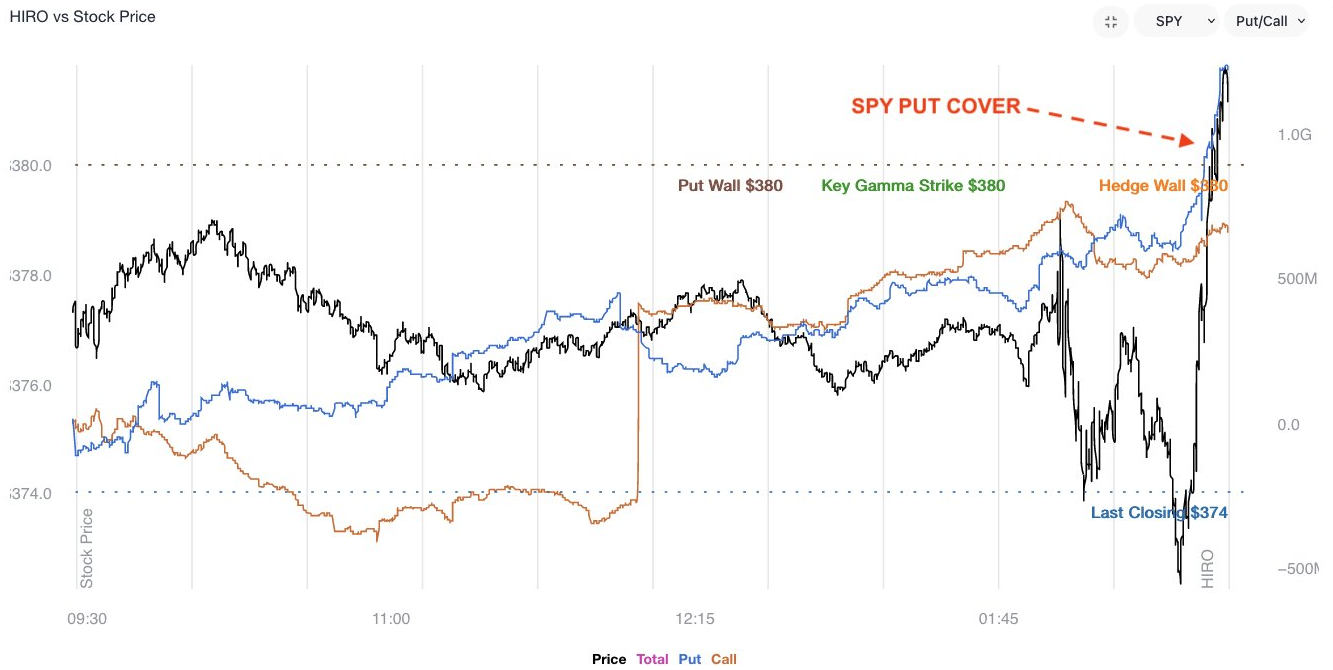
Graphic: Taken 6/22/2022. SpotGamma’s Hedging Impact of Real-Time Options (HIRO) indicator points to selling of put and call options in the S&P 500 (INDEX: SPX) and S&P 500 ETF (SPY). Those liquidity providers, who are on the other side, are more exposed to long volatility, which they hedge by buying (selling) into weakness (strength) underlying.
Technical: As of 6:40 AM ET, Friday’s regular session (9:30 AM – 4:00 PM ET), in the S&P 500, will likely open in the upper part of a positively skewed overnight inventory, outside of prior-range and -value, suggesting a potential for immediate directional opportunity.
In the best case, the S&P 500 trades higher; activity above the $3,821.50 LVNode puts in play the $3,843.00 RTH High. Initiative trade beyond the RTH High could reach as high as the $3,911.00 VPOC and $3,943.25 HVNode, or higher.
In the worst case, the S&P 500 trades lower; activity below the $3,821.50 LVNode puts in play the $3,793.25 ledge. Initiative trade beyond the ledge could reach as low as the $3,770.75 HVNode and $3,735.75 HVNode, or lower.
Click here to load today’s key levels into the web-based TradingView charting platform. Note that all levels are derived using the 65-minute timeframe. New links are produced, daily.
Graphic: 65-minute profile chart of the Micro E-mini S&P 500 Futures.
Considerations: Recent trade has been lackluster and the overnight break is the most bullish happening in weeks. The go-to trade this week was short volatility. Participants responded to tests of key visual areas, and sold options, particularly in shorter maturities.
In the coming session(s), some of those participants will respond to the break in a manner that bolsters the initiative drive. Notwithstanding, the key to watch for is whether participants will use the bump as an opportunity to add to their most recent short volatility bets against the direction.
Ultimately, the more time that is spent outside of the prior consolidation area, the likelihood that the breakout is a signal to look for dips to buy and play rotations to key areas up above.
Definitions
Volume Areas: A structurally sound market will build on areas of high volume (HVNodes). Should the market trend for long periods of time, it will lack sound structure, identified as low volume areas (LVNodes). LVNodes denote directional conviction and ought to offer support on any test.
If participants were to auction and find acceptance into areas of prior low volume (LVNodes), then future discovery ought to be volatile and quick as participants look to HVNodes for favorable entry or exit.
POCs: POCs are valuable as they denote areas where two-sided trade was most prevalent in a prior day session. Participants will respond to future tests of value as they offer favorable entry and exit.
Balance-Break + Gap Scenarios: A change in the market (i.e., the transition from two-time frame trade, or balance, to one-time frame trade, or trend) is occurring.
Monitor for acceptance (i.e., more than 1-hour of trade) outside of the balance area.
Leaving value behind on a gap-fill or failing to fill a gap (i.e., remaining outside of the prior session’s range) is a go-with indicator.
Rejection (i.e., return inside of balance) portends a move to the opposite end of the balance.
About
After years of self-education, strategy development, mentorship, and trial-and-error, Renato Leonard Capelj began trading full-time and founded Physik Invest to detail his methods, research, and performance in the markets.
Capelj also develops insights around impactful options market dynamics at SpotGamma and is a Benzinga reporter.
In no way should the materials herein be construed as advice. Derivatives carry a substantial risk of loss. All content is for informational purposes only.
The daily brief is a free glimpse into the prevailing fundamental and technical drivers of U.S. equity market products. Join the 300+ that read this report daily, below!
Overnight, equity index and commodity futures were sideways to lower all the while bonds and volatility were bid.
This is after participants, based on metrics included later in the letter, took the advance as an opportunity to sell at higher prices. Demanded was protection, and this bid implied volatility.
Big headlines include China sending warplanes near Taiwan after the U.S. rejected its strait claims. The Taiwanese Foreign Minister Joseph Wu wrote that the threat was “more serious than ever.” This is, also, ahead of Taiwan and U.S. officials talking about arms sales.
In other news, Congress was called on to pass a $0.184 per gallon gasoline tax holiday. Growth in job postings slowed as Q2 GDP forecasts have been revised lower, Chinese manufacturing orders declined by 20-30%, U.K. inflation hit a 40-year record, and sellers of homes are cutting prices in some of the hottest markets while the demand for adjustable-rate mortgages surges.
Ahead, the Federal Reserve’s (Fed) Patrick Harker speaks at 9:00 AM ET. Then, Jerome Powell testifies to the Senate Banking Committee at 9:30 AM ET. Later, Charles Evans speaks at 12:50 PM ET, followed by Harker and Barkin, again, at 1:30 PM ET.
Graphic updated 6:30 AM ET. Sentiment Risk-Off if expected /ES open is below the prior day’s range. /ES levels are derived from the profile graphic at the bottom of the following section. Levels may have changed since initially quoted; click here for the latest levels. SqueezeMetrics Dark Pool Index (DIX) and Gamma (GEX) calculations are based on where the prior day’s reading falls with respect to the MAX and MIN of all occurrences available. A higher DIX is bullish. At the same time, the lower the GEX, the more (expected) volatility. Learn the implications of volatility, direction, and moneyness. SHIFT data used for S&P 500 (INDEX: SPX) options activity. Note that options flow is sorted by the call premium spent; if more positive, then more was spent on call options. Breadth reflects a reading of the prior day’s NYSE Advance/Decline indicator. VIX reflects a current reading of the CBOE Volatility Index (INDEX: VIX) from 0-100.
What To Expect
Fundamental: For what it is worth when it comes to talking of theory and the economy, ARK Invest’s Cathie Wood has been spot on, in many ways.
Somewhat pursuant to our detailed analysis on May 18, 2022, which talked about the impact of reduced liquidity and credit on the real economy and asset prices, Wood explained that the U.S. fell into a recession during the first quarter.
“If massive inventor[ies] bloat real GDP in the second quarter, they will unwind and hurt growth for the rest of the year,” she said. Last year, though badly timed, Wood said that inflation would be on its way out due in part to excess inventory which would be reflected in commodity prices.
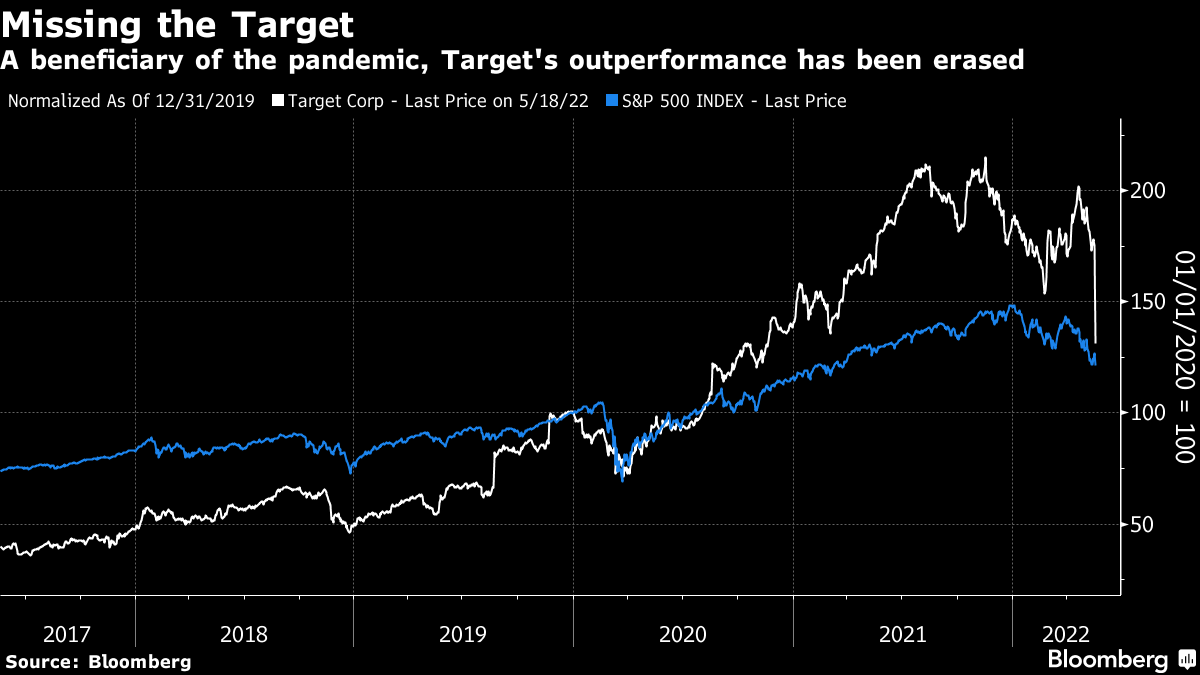
Read: Walmart Inc’s (NYSE: WMT) inventory glut to reduce in a “couple of quarters” and how Target Corporation’s (NYSE: TGT) oversupply problem should scare all retailers.
Graphic: Via Bloomberg. “The hot commodities rally is cooling off fast as recession fears again ground and cloud the outlook for demand.”
“If inventories and stock prices are leading indicators for employment and wages, … then fears of cost-push inflation a la 1970’s should disappear during the next six months.”
To put it briefly, as we’ve talked about in the past, the recent market rout is a recession and the direct reflection of the unwind of carry. It is the manifestation of a deflationary shock, and today’s sentiment and reducing demand for goods, among other things, reflect this.
And, with that, after a period during which capital was misallocated, the Fed is not in a position to control price stability “without bringing down the markets,” per Kai Volatility’s Cem Karsan.
“Bonds are not acting as a hedge and appear to be becoming less ‘money’ like due persistent declines in price and elevated rate vol,” as Joseph Wang, who was a trader at the Fed, puts it.
Bank deposits are to drain about $1 trillion or so by year-end, prompting investors to “continue to lower their selling prices to compete for the cash they want.”
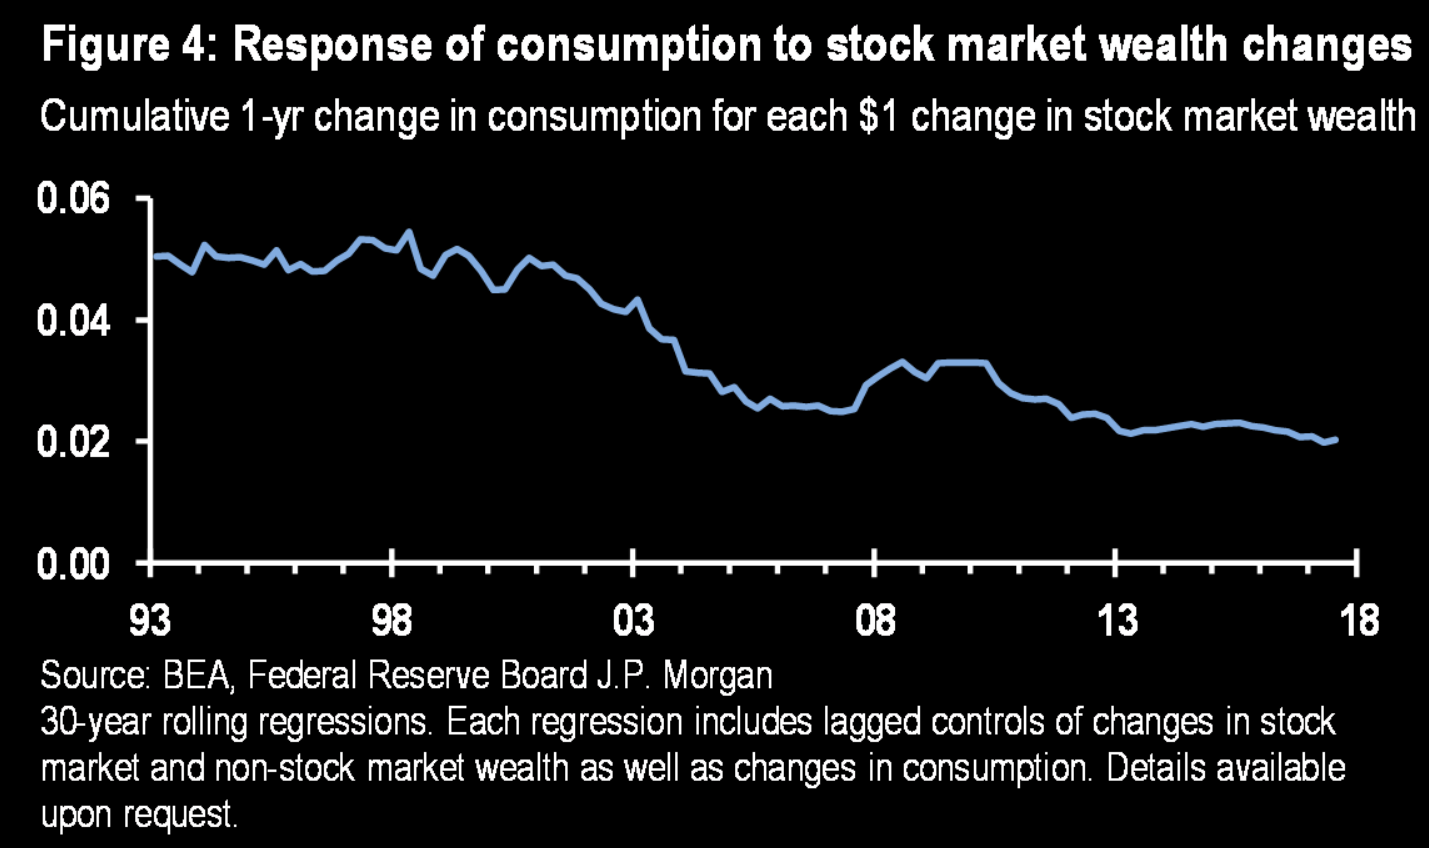
Graphic: Per Bloomberg, “[E]very $1 trillion of QT will equate to a decline of roughly 10% in stocks over the next 12 months or so.”
If it provides any solace, per comments by Credit Suisse Group AG’s (NYSE: CS) Zoltan Pozsar, the Fed, which “can only deal with nominal [and] not real chokepoints,” is likely to change course.
This is as “nominal balance sheet and liquidity trends will, at some point, clash with the realities of a garden variety of supply chain issues.”
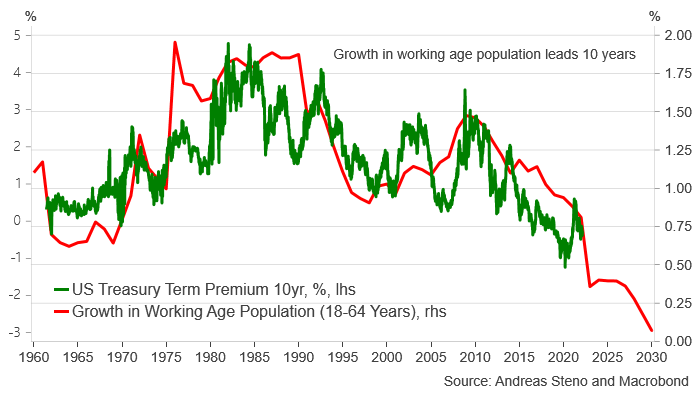
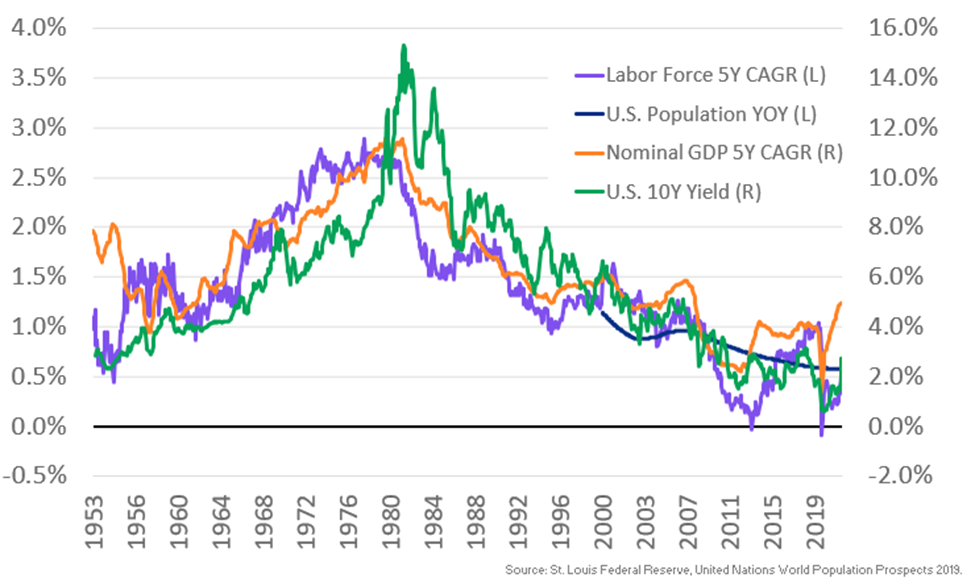
Likewise, Andreas Steno Larsen explains that bond yields remain governed by demographics, and this is good news for stocks, in general.
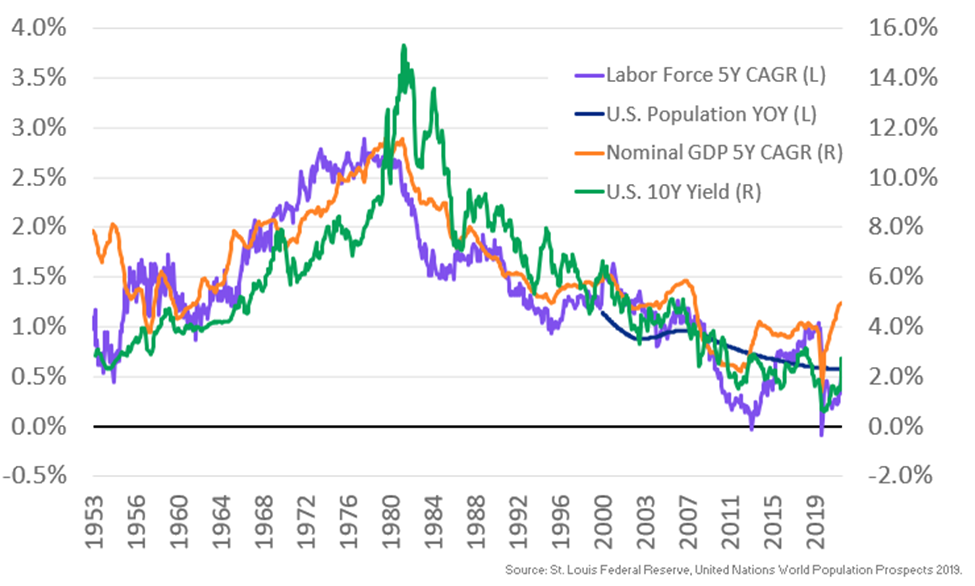
“Just look at the growth rate of the working-age population (10 years forward) versus the term premium of US Treasury bonds. The current bond bear market is not standing on structural pillars.”
Graphic: Via Andreas Steno Larsen. “Bond yields remain governed by demographics over the medium-term. Low(er) for longer.”
Moving on. So, last week, we had a large monthly options expiration (OPEX). After this, liquidity providers’ re-hedging flows supported the market.
Over the weekend, into Tuesday’s U.S. close, equities, then, traded higher. The rally, however, was not confidence-inspiring and was indicative of short-covering.
Per SpotGamma’s Hedging Impact of Real-Time Options (HIRO) indicator, participants took the relief rally “as an opportunity to hedge/sell,” as I wrote for SpotGamma, yesterday.
Graphic: SpotGamma’s combined HIRO reading for the S&P 500 (INDEX: SPX) and SPDR S&P 500 ETF Trust (NYSE: SPY). Trade was responsive (i.e., buy dip, sell rip) up until 2:00 PM ET when demand for negative delta (i.e., put buying, call selling) outweighed that for positive delta.
This ultimately showed up in broad measures of implied volatility. As The Ambrus Group’s Kris Sidial said: “[I]n the final hour, spot [and] vol up.”
This plays into decreased odds for a far-reaching rally. Participants are positioned out in strikes that are lower and the activity in those strikes plays into a change in tone with respect to the non-linearity and strength of volatility and skew with respect to linear changes in asset prices.
As Karsan spoke to, last week, the spikes in short-dated -sticky skew – the “first we’ve seen since [the] secular decline began” – hints at a “critical change in dealer positioning.”
“We’re transitioning to a fat left tail, right-based distribution,” Karsan adds.
So why does any of this matter?
There still appears to be a heavy supply of options, particularly those with less time to maturity, and skew remains poor-performing (hence comments in prior letters on the benefit of buying into implied skew convexity should volatility reprice).
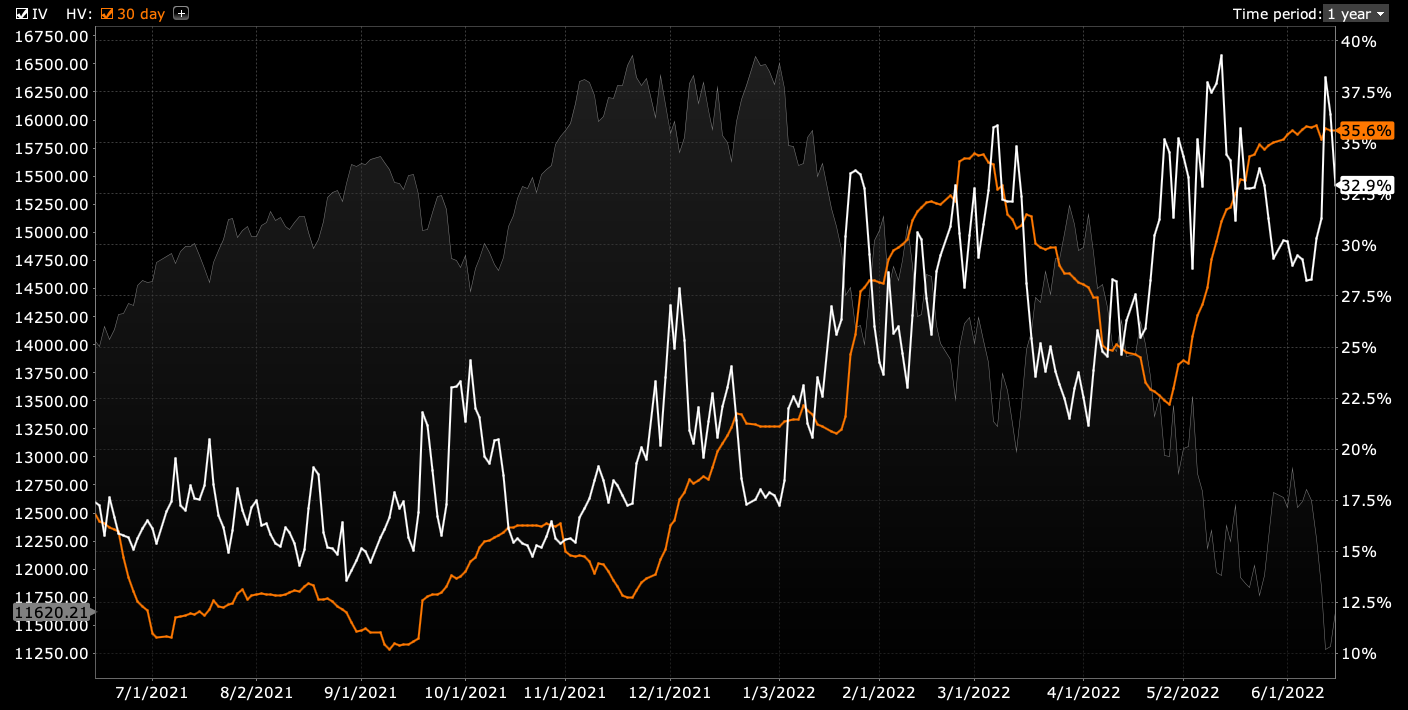
Graphic: Via Charles Schwab Corporation-owned (NYSE: SCHW) TD Ameritrade’s Thinkorswim. Note historical or realized volatility (RVOL) versus that which is implied (IVOL).
Basically, participants are hedged and volatility remains well-supplied.
If there was to be forced selling or demand for protection by a greater share of the market in ways not recently seen, then the repricing of the aforementioned structures would be a boon for those who own them.
Graphic: Via Banco Santander SA (NYSE: SAN) research.
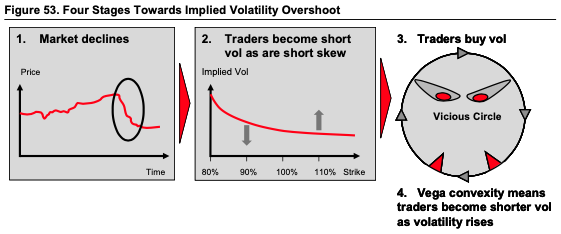
Options have a “non-zero second-order price sensitivity (or convexity) to a change in volatility,” as Mohamed Bouzoubaa et al explain well in the book Exotic Options and Hybrids.
“ATM vanillas are [not] convex in the underlying’s price, … but OTM vanillas do have vega convexity … [so], when the holder of an option is long vega convexity, we say she is long vol-of-vol.”
In other words, by owning that protection – e.g., butterfly and back spreads – you are positioned to monetize on a continued non-linear repricing of volatility. The difficult part is cutting the decay of those spreads when nothing happens.
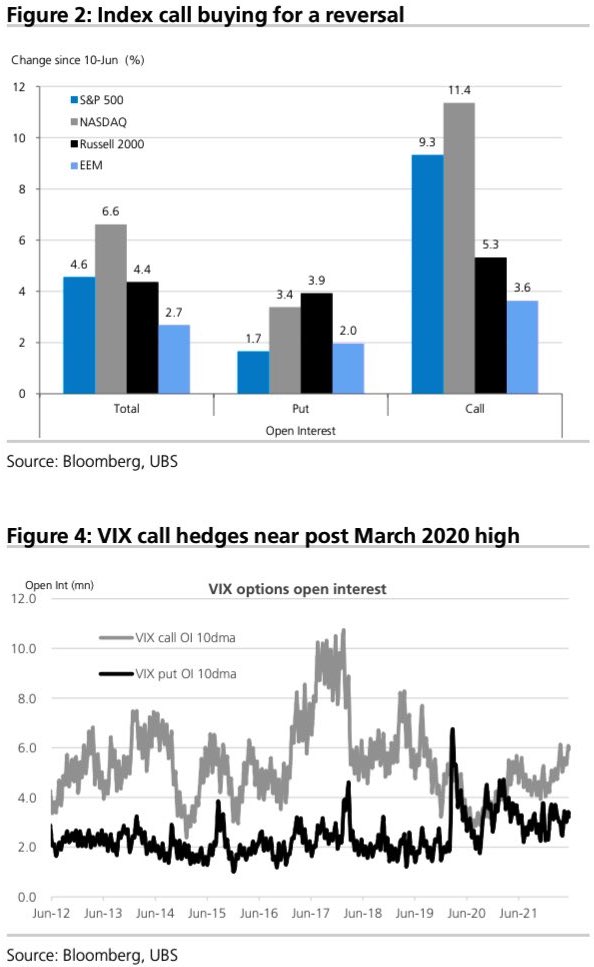
As an aside, despite the bearish tilt in positioning, there has been a notable uptick in index call buying per UBS Group AG (NYSE: UBS), presumably so that participants don’t miss out on a vicious reversal, should one transpire.
Graphic: Via UBS Group AG.
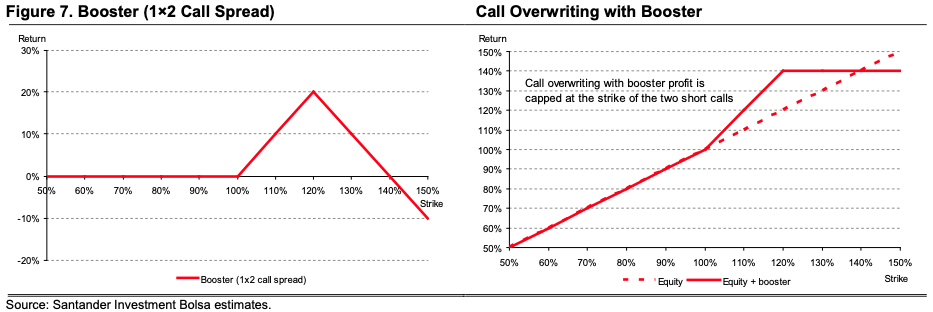
Adding, the “high starting point” in IVOL makes it possible to put on zero- and low-cost bets that deliver asymmetric payouts in case of violent and short-lived reversals.
Graphic: Via Banco Santander SA (NYSE: SAN) research, the return profile, at expiry, of a classic 1×2 (long 1, short 2 further away) ratio spread (the inverse of a back spread).
Technical: As of 6:30 AM ET, Wednesday’s regular session (9:30 AM – 4:00 PM ET), in the S&P 500, will likely open in the lower part of a negatively skewed overnight inventory, inside of prior-range and -value, suggesting a limited potential for immediate directional opportunity.
In the best case, the S&P 500 trades higher; activity above the $3,696.00 low volume area (LVNode) puts in play the $3,722.50 LVNode. Initiative trade beyond the LVNodes could reach as high as the $3,735.75 and $3,770.75 high volume areas (HVNodes), or higher.
In the worst case, the S&P 500 trades lower; activity below the $3,696.00 LVNode puts in play the $3,675.25 HVNode. Initiative trade beyond the HVNode could reach as low as the $3,639.00 RTH Low and $3,610.75 HVNode, or lower.
Click here to load today’s key levels into the web-based TradingView charting platform. Note that all levels are derived using the 65-minute timeframe. New links are produced, daily.
Graphic: 65-minute profile chart of the Micro E-mini S&P 500 Futures.
Considerations: Gap scenarios are in play, today.
Gaps ought to fill quickly. Should they not, that’s a signal of strength; do not fade. Leaving value behind on a gap-fill or failing to fill a gap (i.e., remaining outside of the prior session’s range) is a go-with indicator.
Auctioning and spending at least 1-hour of trade back in the prior range suggests a lack of conviction; in such a case, do not follow the direction of the most recent initiative activity.
Definitions
A structurally sound market will build on areas of high volume (HVNodes). Should the market trend for long periods of time, it will lack sound structure, identified as low volume areas (LVNodes). LVNodes denote directional conviction and ought to offer support on any test.
If participants were to auction and find acceptance into areas of prior low volume (LVNodes), then future discovery ought to be volatile and quick as participants look to HVNodes for favorable entry or exit.
About
After years of self-education, strategy development, mentorship, and trial-and-error, Renato Leonard Capelj began trading full-time and founded Physik Invest to detail his methods, research, and performance in the markets.
Capelj also develops insights around impactful options market dynamics at SpotGamma and is a Benzinga reporter.
In no way should the materials herein be construed as advice. Derivatives carry a substantial risk of loss. All content is for informational purposes only.
The daily brief is a free glimpse into the prevailing fundamental and technical drivers of U.S. equity market products. Join the 300+ that read this report daily, below!
Update: Technicals section now reflects the proper overnight inventory stat.
After a week-long or so de-rate to reflect the impact of higher inflation and harsher monetary policies, equity index futures are trading in a responsive fashion.
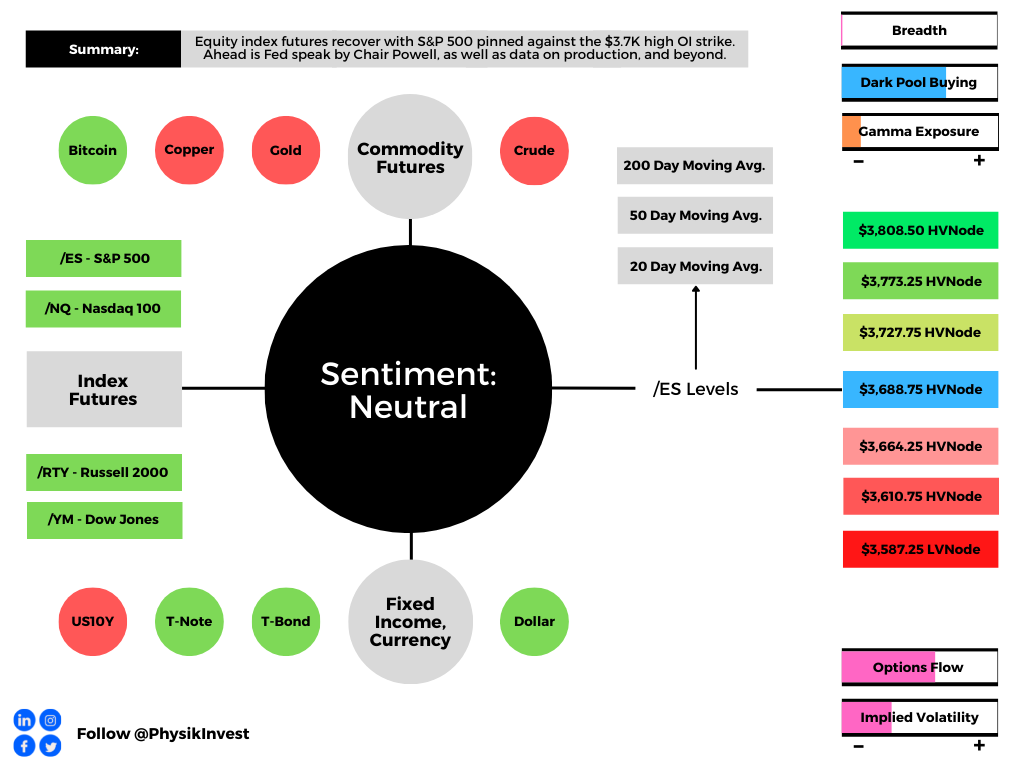
The S&P 500, in particular, lies pinned against the $3,700.00 high options open interest strike. The large June monthly options expiration has implications on the expansion of the range, as noted in prior letters.
The newsflow remains depressing. Taken alone, you’d think the Federal Reserve (Fed) would be “soft[ly] landing” us into a depression, just in time for WWIII to help us get out of it.
Kidding. The utmost sympathy for those negatively affected by war and economic hardship.
The distinction between the economy and the market is blurred and the drop is the recession. The equity markets are a mechanism pricing the implications of all the points we talk about, in real-time, months (6-12) in advance.
Given that, there are better measures to assess whether a de-rate has played out, fully. In the last session, information, generated by the market – internals, volatility measures, and the like – suggested to us that more selling was in store, all the while there was a definite change in tone in the non-linear strength of volatility and skew with respect to linear changes in price of assets.
Should you care for the narratives in news, then here it is:
The Bank of England (BOE) pointed to the potential for a more aggressive rate hike schedule if data were to reflect a wage spiral. The Swiss National Bank (SNB) upped rates an unexpected 50 basis points. The White House weighed fuel-export limits. Both residential permitting and housing starts plummeted with the 30-year fixed-rate breaching 6.00%.
Adding, U.S. junk bond spreads topped 500 basis points for the first time since 2020, and China, also, launched its third most modern aircraft carrier.
Ahead, Fed Chair Jerome Powell speaks at 8:45 AM ET. Then updates on industrial production and capacity utilization (9:15 AM ET), as well as leading economic indicators (10:00 AM ET).
Graphic updated 6:30 AM ET. Sentiment Neutral if expected /ES open is inside of the prior day’s range. /ES levels are derived from the profile graphic at the bottom of the following section. Levels may have changed since initially quoted; click here for the latest levels. SqueezeMetrics Dark Pool Index (DIX) and Gamma (GEX) calculations are based on where the prior day’s reading falls with respect to the MAX and MIN of all occurrences available. A higher DIX is bullish. At the same time, the lower the GEX, the more (expected) volatility. Learn the implications of volatility, direction, and moneyness. SHIFT data used for S&P 500 (INDEX: SPX) options activity. Note that options flow is sorted by the call premium spent; if more positive, then more was spent on call options. Breadth reflects a reading of the prior day’s NYSE Advance/Decline indicator. VIX reflects a current reading of the CBOE Volatility Index (INDEX: VIX) from 0-100.
What To Expect
Team. We’re going to have to keep it a bit shorter, today, and leave out the fundamentals section. Sorry!
In a nutshell, and this is borrowing from a past post-Federal Open Market Committee (FOMC) event letter, as well put forth by Kai Volatility’s Cem Karsan, on a Fed day, “the first move tends to be structural. A function of the inevitable rebalancing of dealer inventory post-event.”
Graphic: Via SpotGamma’s Hedging Impact of Real-Time Options (HIRO) indicator alluded to counterparty buyback of static short delta hedges to positive delta options exposures.
“The second move and final resolution, if you wait for it, is usually tied to the incremental effects on liquidity (QE/QT).”
Essentially, the baseline bear trend held because, essentially, the Fed is, indeed, expected to continue raising rates and withdrawing liquidity. This will prompt a continued de-rate with QT being “a direct flow of capital to capital markets.”
Graphic: Via Charles Schwab Corporation-owned (NYSE: SCHW) TD Ameritrade’s Thinkorswim. The Eurodollar (FUTURE: /GE) futures curve is a reflection of participants’ outlook on interest rates. The peak of the Fed-rate-hike cycle – terminal rate – is around March 2023.
Great, moving on. What’s next?
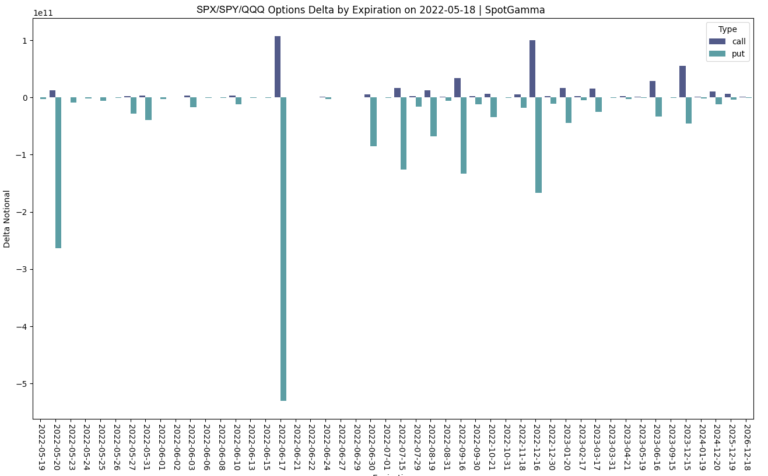
Essentially, with the June monthly options expiration (OPEX), expected is a roll-off of a large amount of customer negative delta exposure (via put options they own). Taken in a vacuum, with expiration, liquidity providers (who are short put options and short underlying to hedge) will re-hedge (buyback static short-delta, among other things), and this is taken as bullish.
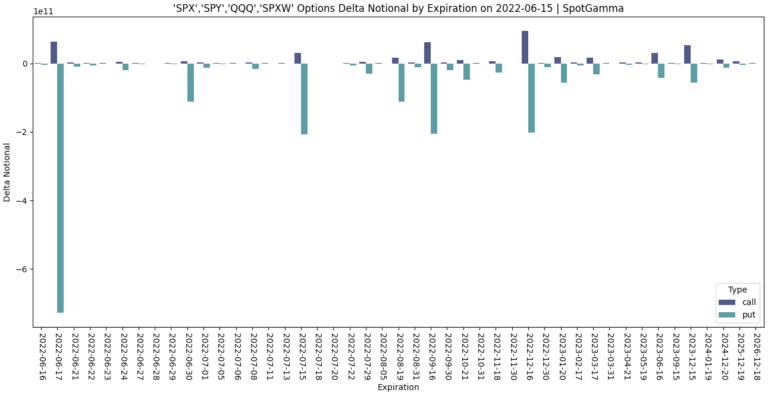
Graphic: Via SpotGamma. “While many of these put positions could be paired off with other offsetting positions (i.e. netting out some of this delta), we remain of the opinion that a lot of these put positions are investor short hedges which will be rolled out and down on OPEX. This means that large ITM puts will be exchanged for OTM puts, which creates a short delta hedge imbalance for dealers (i.e. they need to cover short futures). This is what may drive the OPEX-related rally.
However, this is definitely discounting the impact on delta from participants rolling forward their bets on direction.
Graphic: Via Shift Search. Participants, mainly sell to close their short-dated bets on the downside while buying to open those that are further out in time and lower in price.
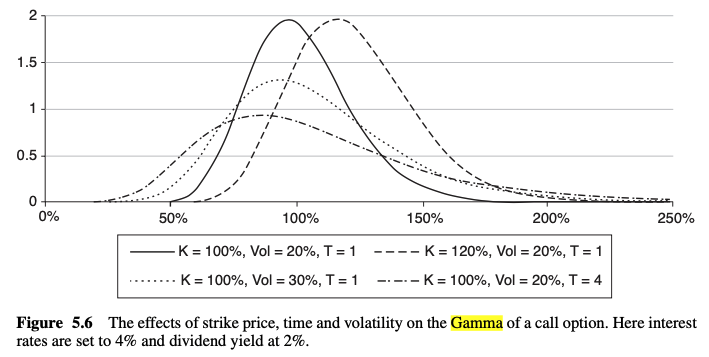
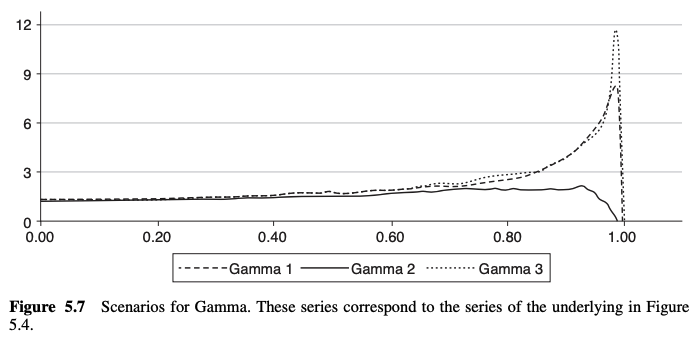
As talked about yesterday, we were to gauge the delta impact by how far below the high open interest strikes the equity indexes were to travel. As stated, these options, have little time to expiry and, thus, their gamma (the sensitivity of the option to change indirection) grows rather large, at near-the-money strikes.
Graphic: Text taken from Exotic Options and Hybrids: A Guide to Structuring, Pricing and Trading.
As the time to expiry narrows, above the strike in question delta decays, and counterparts buy back their static delta hedges.
As the time to expiry narrows, below the strike in question delta expands and counterparts sell more static delta to hedge.
Graphic: Text taken from Exotic Options and Hybrids: A Guide to Structuring, Pricing and Trading.
This means that if far below these high-interest strikes, associated hedging, less any new reach for protection would keep markets pressured. If above, hedging, less new sales of protection, would bolster markets higher.
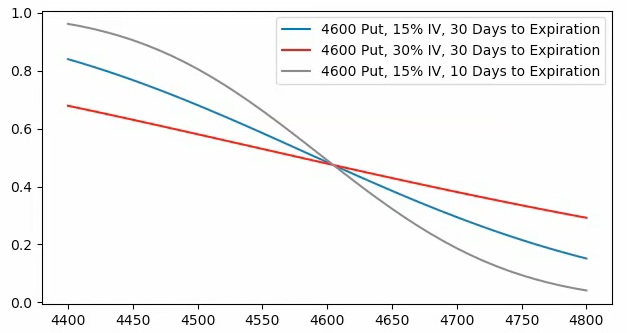
Graphic: Via SpotGamma. “SPX prices X-axis. Option delta Y-axis. When the factors of implied volatility and time change, hedging ratios change. For instance, if SPX is at $4,700.00 and IV jumps 15% (all else equal), the dealer may sell an additional 0.2 deltas to hedge their exposure to the addition of a positive 0.2 delta. The graphic is for illustrational purposes, only.”
Ultimately, if lower, all else equal, the June 17 OPEX will coincide with the removal of the in-the-money options exposures in question. Negating the rollover of exposures and leaving the door open to some delta imbalance (need to buy to re-hedge exposure) suggests that after this expiration, markets may have less pressure to rally against.
“The SPX index quarterly option notional is higher than usual, but the market is below the concentration of risk given the recent selloff,” Tanvir Sandhu, chief global derivatives strategist at Bloomberg Intelligence, wrote in a note. “Price action will reflect the economic context, but flows from expiring in-the-money hedges may support the market.”
What do you do with this information?
Well, recall that we’ve talked ad nauseam about the supply and demand of volatility, as well as how that impacted the volatility realized (RVOL) and implied (IVOL) by the market.
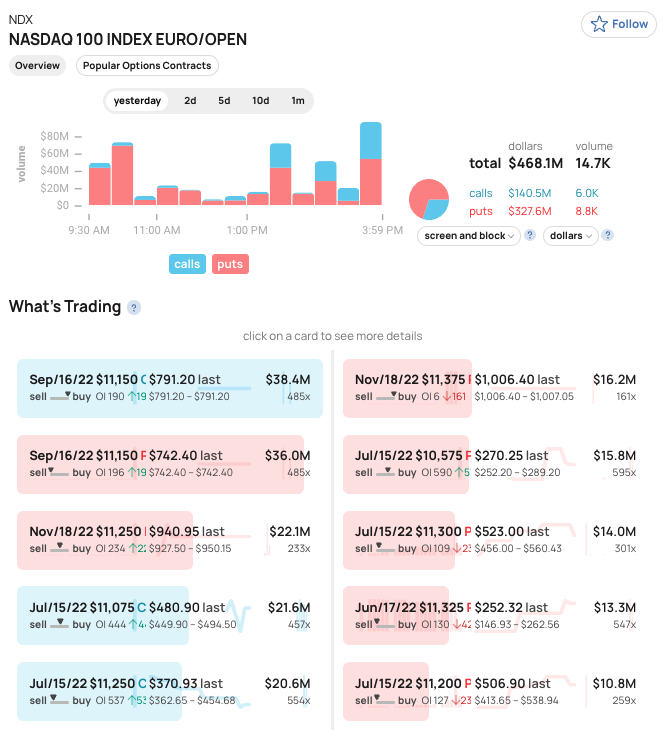
Graphic: Taken by Physik Invest from Interactive Brokers Group Inc (NASDAQ: IBKR). The divergence in volatility implied (IVOL) by participants’ options activity, versus that which the market realizes (RVOL) resurfaced on June 15, 2022, in the Nasdaq 100 (INDEX: NDX).
Essentially there was an “absolute slamming” (i.e., sale of options), particularly in shorter-dated tenors and this played into the generally poor performance in skew, hence our comments on the benefit to buying into implied skew convexity should volatility reprice.
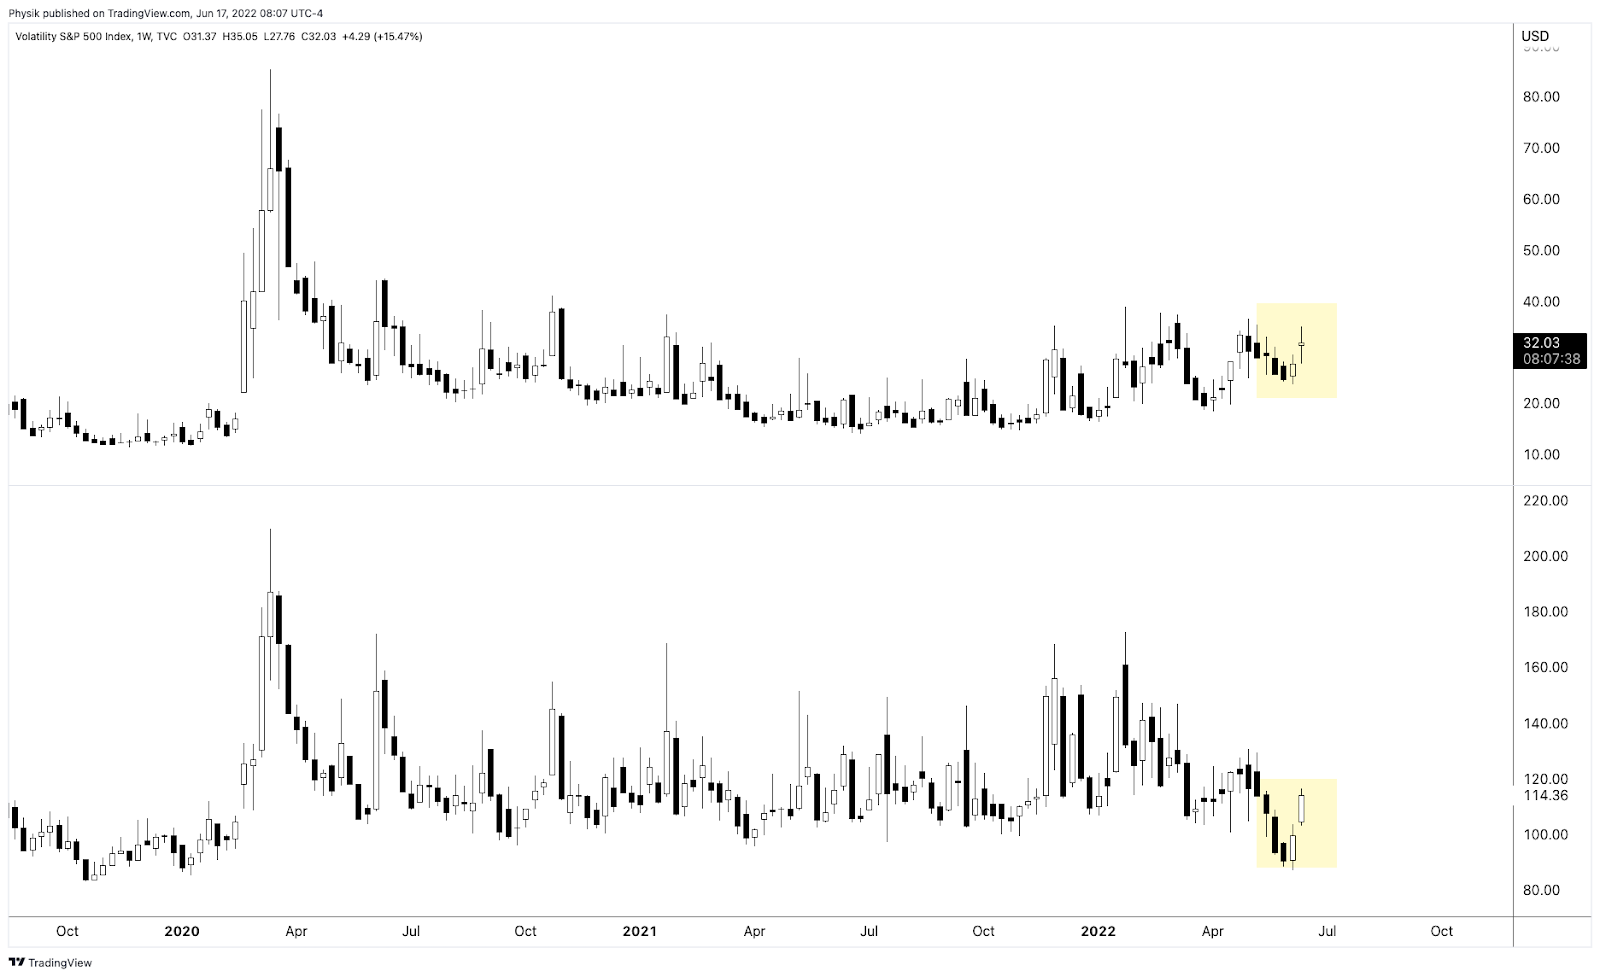
Graphic: Via TradingView. Taken by Physik Invest. The Cboe VVIX Index (INDEX: VVIX), the expected volatility of the 30-day forward price of the VIX, or the volatility of volatility (a naive but useful measure of skew), was very depressed, too, in comparison to the VIX, itself.
Basically, participants are hedged and volatility remains well-supplied.
To hedge or capitalize on a potential reach for protection, amid forced selling or demand for protection by a greater share of the market in ways not recently seen, then the repricing in those structures would be a boon to those that own them.
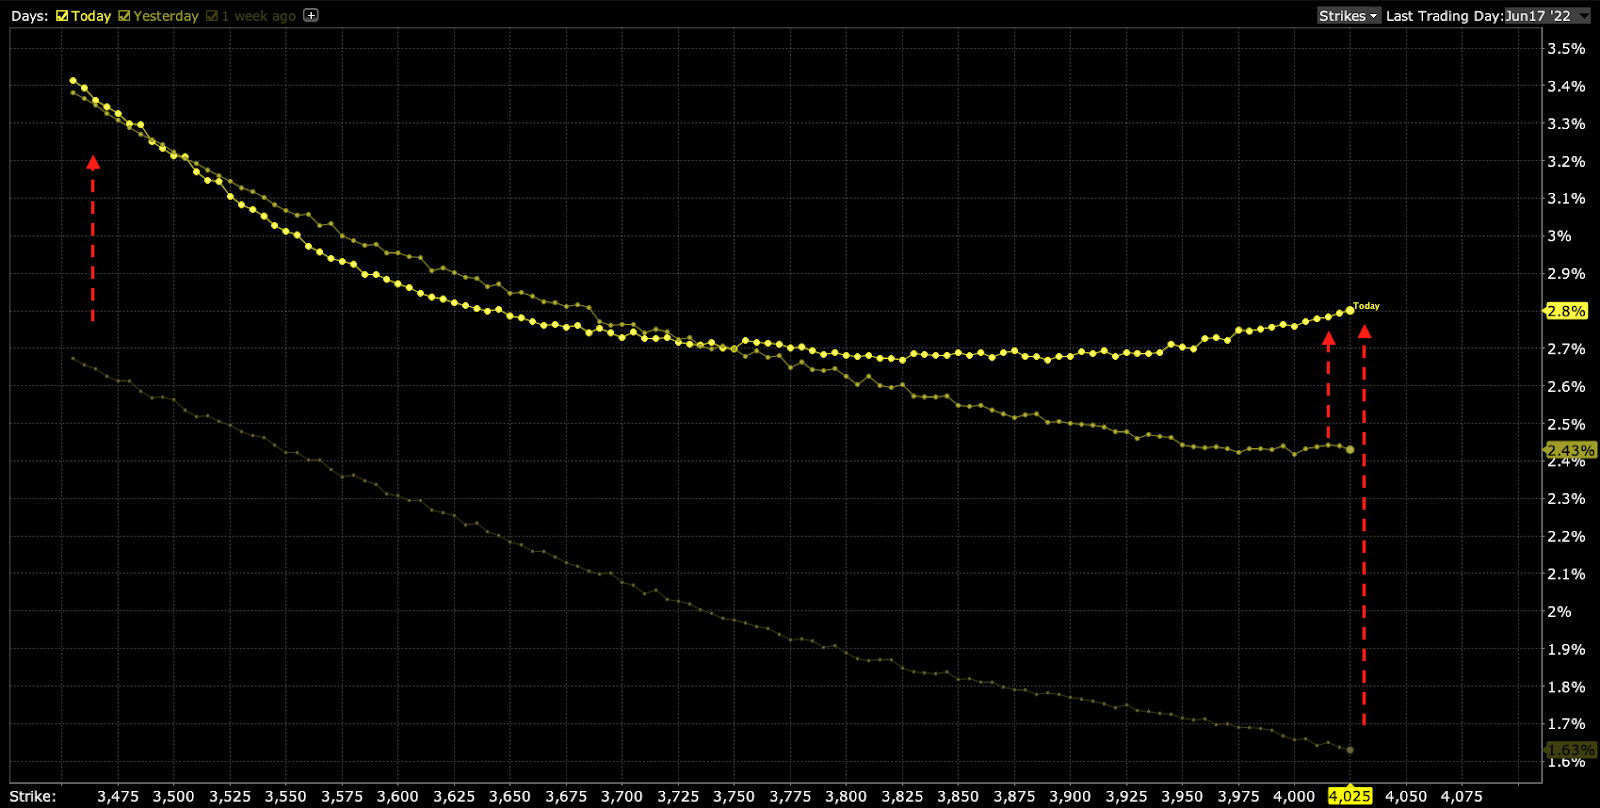
Graphic: Taken by Physik Invest from Interactive Brokers Group Inc (NASDAQ: IBKR).
To quote Benn Eifert of QVR Advisors: “Skew goes up if vol outperforms the skew curve a lot on a selloff.”
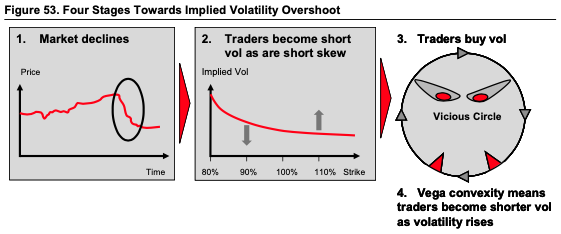
Graphic: Via Banco Santander SA (NYSE: SAN) research.
And, as touched on in this morning’s introduction, there was a definite change in tone in the non-linear strength of volatility and skew with respect to linear changes in the price of assets.
Personally, I, along with a partner who I trade closely with, saw increases in the prices of ratio structures (long or short one option near-the-money, short or long two or more further out-of-the-money) by hundreds of percent for only a few basis points of change in the indexes.
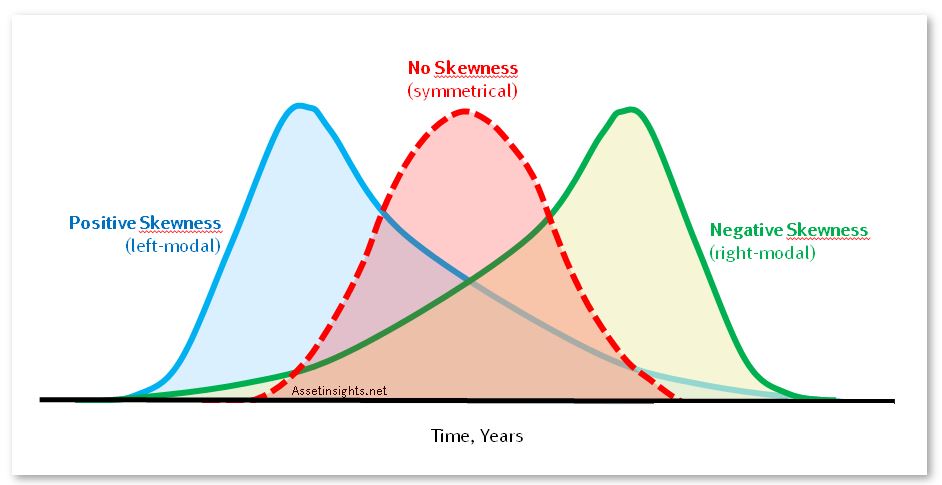
As Karsan explained online, there was “a spike in short-dated -sticky skew, [the] first we’ve seen since [the] secular decline began and it hints [at] a potentially critical change in dealer positioning [and] the distribution of underlying outcomes.”
“We’re transitioning to a fat left tail, right-based distribution.”
Graphic: Via English Stack Exchange. Visualizing the transition to a fat left tail and right-based distribution that is skewed negative (i.e., the green distribution).
So why does any of this matter?
This is a validation of our perspectives on how one should position, given what the supply and demand of volatility looked like prior.
Options have a “non-zero second-order price sensitivity (or convexity) to a change in volatility,” as Mohamed Bouzoubaa et al explain well in the book Exotic Options and Hybrids.
“ATM vanillas are [not] convex in the underlying’s price, … but OTM vanillas do have vega convexity … [so], when the holder of an option is long vega convexity, we say she is long vol-of-vol.”
In other words, by owning that protection, you are positioned to monetize on a continued non-linear repricing of volatility. However, doing this in a manner that cuts decay (when nothing happens) is the difficult part.
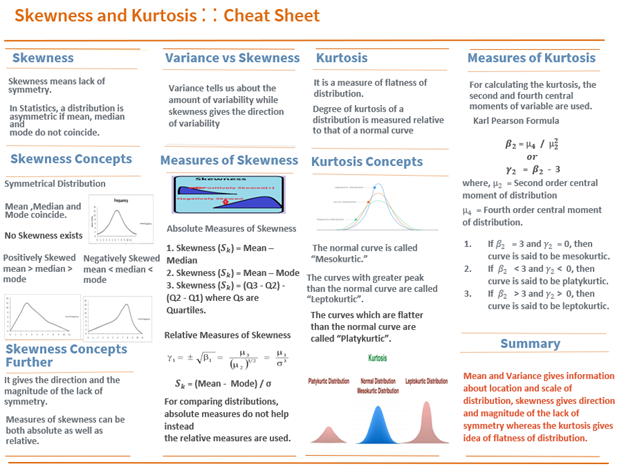
Graphic: Sourced via Towards AI. Skewness and kurtosis cheat sheet.
Technical: As of 6:30 AM ET, Friday’s regular session (9:30 AM – 4:00 PM ET), in the S&P 500, will likely open in the lower part of a positively skewed overnight inventory, inside of prior-range and -value, suggesting a potential for immediate directional opportunity.
In the best case, the S&P 500 trades higher; activity above the $3,688.75 HVNode puts in play the $3,727.75 HVNode. Initiative trade beyond the $3,727.75 HVNode could reach as high as the $3,773.25 HVNode and $3,808.50 HVNode, or higher.
In the worst case, the S&P 500 trades lower; activity below the $3,688.75 HVNode puts in play the $3,664.25 HVNode. Initiative trade beyond the $3,664.25 HVNode could reach as low as the $3,610.75 HVNode and $3,587.25 LVNode, or lower.
Click here to load today’s key levels into the web-based TradingView charting platform. Note that all levels are derived using the 65-minute timeframe. New links are produced, daily.
Graphic: 65-minute profile chart of the Micro E-mini S&P 500 Futures.
Definitions
Should the market trend for long periods of time, it will lack sound structure, identified as low volume areas (LVNodes). LVNodes denote directional conviction and ought to offer support on any test.
If participants were to auction and find acceptance into areas of prior low volume (LVNodes), then future discovery ought to be volatile and quick as participants look to HVNodes for favorable entry or exit.
About
After years of self-education, strategy development, mentorship, and trial-and-error, Renato Leonard Capelj began trading full-time and founded Physik Invest to detail his methods, research, and performance in the markets.
Capelj also develops insights around impactful options market dynamics at SpotGamma and is a Benzinga reporter.
In no way should the materials herein be construed as advice. Derivatives carry a substantial risk of loss. All content is for informational purposes only.
The daily brief is a free glimpse into the prevailing fundamental and technical drivers of U.S. equity market products. Join the 300+ that read this report daily, below!
Overnight, futures for commodities, the equity indexes, and bonds were weak. There was no salvation in different assets. Instead, the realized correlation, across markets, tightened.
This is on the heels of inflation data updates that have traders pricing a 50-50 odds for a 75 basis point interest rate hike in July, after a 50 basis point hike this month.
That said, Ben Bernanke, who is a former Federal Reserve (Fed) Chair, said monetary policy leaders may be able to sidestep a big recession, expressing hopes that improvements in supply chains, among other things, would help rein inflation.
In other news, Chinese military officials warned their U.S. counterparts to avoid the Taiwan Strait and dismissed the need for the United Nations to review labor standards in the Xinjiang region.
This is as Britain’s economy unexpectedly shrank and Russia claims it has destroyed U.S. and European weapons stores in Ukraine. Additionally, despite OPEC+’s modest output gains, the average price of a gallon of gas rose to over $5 per gallon in the U.S.
This output shock is likely to last into 2023 with gas potentially reaching as high as $6-$7.
Interestingly, as an aside, power grid operators in the Midwest are suggesting rolling blackouts in the coming years. This is just as power use in the South hit all-time records.
Ahead is data on inflation expectations (11:00 AM ET). This week’s focus is on the Federal Open Market Committee’s (FOMC) monetary policy decisions and large derivative expirations.
Graphic updated 6:30 AM ET. Sentiment Risk-Off if expected /ES open is below the prior day’s range. /ES levels are derived from the profile graphic at the bottom of the following section. Levels may have changed since initially quoted; click here for the latest levels. SqueezeMetrics Dark Pool Index (DIX) and Gamma (GEX) calculations are based on where the prior day’s reading falls with respect to the MAX and MIN of all occurrences available. A higher DIX is bullish. At the same time, the lower the GEX, the more (expected) volatility. Learn the implications of volatility, direction, and moneyness. SHIFT data used for S&P 500 (INDEX: SPX) options activity. Note that options flow is sorted by the call premium spent; if more positive, then more was spent on call options. Breadth reflects a reading of the prior day’s NYSE Advance/Decline indicator. VIX reflects a current reading of the CBOE Volatility Index (INDEX: VIX) from 0-100.
What To Expect
Fundamental: The CPI report was released Friday.
Expected was an 8.2% rise year-over-year (YoY) and 0.7% month-over-month (MoM). Core CPI (which excludes food and energy) was to rise by 5.9% YoY and 0.5% MoM, respectively.
Officially, the headline number rose to 8.6%, and, the same day, consumer sentiment dropped to record lows while expectations for inflation (5-10 years from now) jumped 0.3%.
As Bloomberg’s John Authers put it well, the report’s details “were if anything even more alarming. There’s no way around it; this was a bad report.”
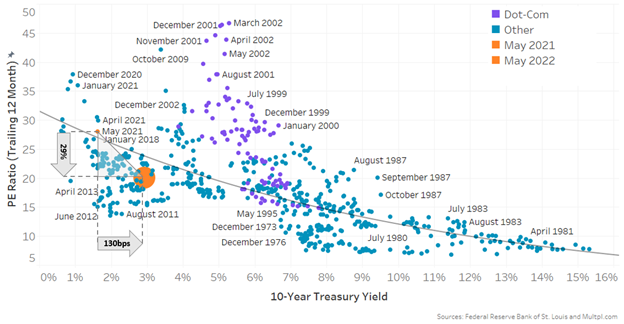
Graphic: Via Schroders plc (OTC: SHNWF). Taken from the Weekly S&P 500 ChartStorm. “Everyone’s (current) favorite economic data report was out this week and it showed annual CPI inflation running at an 8.6% clip. On this chart that would imply a P/E ~11x (Current P/E is ~20x).
Subsequently, a key part of the U.S. yield curve turned upside down while traders priced more tightening by September (i.e., two 50 basis point hikes and one that is potentially 75 basis points), selling nearly everything but the U.S. dollar.
Graphic: Via CME Group Inc’s (NASDAQ: CME) FedWatch Tool.
Early last week, after commentaries resumed, we talked about the reach for cash amid poor safety in fixed income and stock price declines.
Ultimately, to quote Joseph Wang who was a trader at the Fed, an increase in the RRP (reverse repo) and QT (which is a direct flow of capital to capital markets) “would drain the pool of bank deposits by ~$1t by year-end,” and this may prompt investors to “continue to lower their selling prices to compete for the cash they want.”
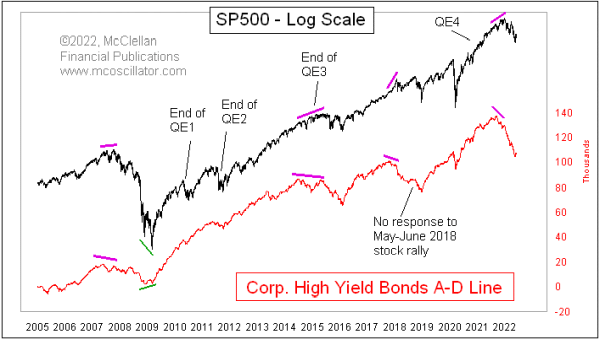
Graphic: Via McClellan Financial Publications. “These bonds move a lot more like the stock market than like T-Bonds. What makes them even more interesting is that they tend to be terribly sensitive to liquidity, both good and bad.”
“Inflation is eating margins, eating consumer demand, and causing the dramatic monetary tightening we are witnessing. None of this is good for stocks,” said James Athey of Abrdn.
“There is still much downside to come.”
Positioning: In short, prior-mentioned supply and demand dynamics resulted in divergences between the volatility that the market realizes (RVOL) and that which is implied (IVOL).
Graphic: Via Robson Chow, founder at Tradewell. The SPDR S&P 500 ETF Trust (NYSE: SPY) “is off ~5% in two trading sessions and implied volatility is still below realized volatility.”
Basically, participants are hedged and volatility remains well-supplied, due in part to suppressive volatility selling, as well as passive flows supporting the largest index constituents.
Consequently, the market’s descent has been orderly and not exacerbated by the demand for hedges and associated repricings of volatility.
This was expected, per Kai Volatility Cem Karsan’s commentary published in December 2021.
Accordingly, for “divergences in RVOL and IVOL to resolve, it would likely take forced selling,” as I explained in a recent SpotGamma commentary.
This is similar to the happenings of the Global Financial Crisis when, according to The Ambrus Group’s Kris Sidial, “vol slowly [ground] until the eventual October 2008 move (i.e., Lehman).”
“The markets were understanding that there was a change going on, especially in credit. But that risk was discounted until it was forced into realization.”
In light of this, on June 8, we talked about long volatility structures (that, one, either sold very short-dated pre-FOMC and OPEX volatility to fund that which is farther-dated or, two, buy into implied skew convexity, non-linear with respect to delta [gamma] and vega [volga] changes).
Why would you do that?
When you think there is to be an outsized move in the underlying, relative to what is priced, you buy options (positive exposure to gamma) so that you may have gains that are potentially amplified in case of directional movement.
When you think there is to be an outsized move in the implied volatility, relative to what is priced, you buy options (positive exposure to volga) so that you may have gains that are potentially amplified in case of implied volatility repricing.
Graphic: Via Banco Santander SA (NYSE: SAN) research.
Ultimately, “liquidity providers’ response to demand for protection (en masse) would, then, likely exacerbate the move and aid in the repricing of volatility to levels where there would be more stored energy to catalyze a rally.”
More on these dynamics later this week.
Technical: As of 6:30 AM ET, Monday’s regular session (9:30 AM – 4:00 PM ET), in the S&P 500, will likely open in the lower part of a negatively skewed overnight inventory, outside of prior-range and -value, suggesting a potential for immediate directional opportunity.
In the best case, the S&P 500 trades higher; activity above the $3,808.50 HVNode puts in play the $3,836.25 LVNode. Initiative trade beyond the $3,836.25 LVNode could reach as high as the $3,863.25 LVNode and $3,911.00 VPOC, or higher.
In the worst case, the S&P 500 trades lower; activity below the $3,808.50 HVNode puts in play the $3,768.25 HVNode. Initiative trade beyond the $3,768.25 HVNode could reach as low as the $3,727.75 and $3,688.75 HVNode, or lower.
Click here to load today’s key levels into the web-based TradingView charting platform. Note that all levels are derived using the 65-minute timeframe. New links are produced, daily.
Graphic: 65-minute profile chart of the Micro E-mini S&P 500 Futures.
Definitions
Volume Areas: A structurally sound market will build on areas of high volume (HVNodes). Should the market trend for long periods of time, it will lack sound structure, identified as low volume areas (LVNodes). LVNodes denote directional conviction and ought to offer support on any test.
If participants were to auction and find acceptance into areas of prior low volume (LVNodes), then future discovery ought to be volatile and quick as participants look to HVNodes for favorable entry or exit.
Point Of Control: POCs are valuable as they denote areas where two-sided trade was most prevalent in a prior day session. Participants will respond to future tests of value as they offer favorable entry and exit.
Micro Composite Point Of Control: POCs are valuable as they denote areas where two-sided trade was most prevalent over numerous day sessions. Participants will respond to future tests of value as they offer favorable entry and exit.
Volume-Weighted Average Prices (VWAPs): A metric highly regarded by chief investment officers, among other participants, for quality of trade. Additionally, liquidity algorithms are benchmarked and programmed to buy and sell around VWAPs.
About
After years of self-education, strategy development, mentorship, and trial-and-error, Renato Leonard Capelj began trading full-time and founded Physik Invest to detail his methods, research, and performance in the markets.
Capelj also develops insights around impactful options market dynamics at SpotGamma and is a Benzinga reporter.
In no way should the materials herein be construed as advice. Derivatives carry a substantial risk of loss. All content is for informational purposes only.
Overnight, U.S. equity index futures came off of their Thursday peaks before, late in the morning, trading to a new rally high, at which is a confluence of technical nuances.
Thursday’s cash session was characterized by a near-vertical advance into mid-day. Then, trade became two-sided, a feature of short-covering and not new buying. More on this, later.
In the news was Citigroup Inc’s (NYSE: C) downgrading of U.S. stocks on recession risks and the “elements of a deflating bubble,” while leaning optimistic on China assets due to marginal policy support, there. This is on the heels of similar conclusions put forward by BlackRock Inc (NYSE: BLK) and Morgan Stanley (NYSE: MS).
Mortgage rates staged their biggest drop since April of 2020 as “the housing market has clearly slowed, and the deceleration is spreading to other segments of the economy,” the Federal Home Loan Mortgage Corporation’s (OTC: FMCC) Sam Khater explained.
In other news, Secretary of State Antony Blinken took aim at China, commenting on the U.S.’s intention to “shape the strategic environment around Beijing to advance [its] vision for an open, inclusive international system.” This is as the U.S. also plans economic talks with Taiwan.
Pippa Malmgren, who is a former White House adviser and economist we wrote on earlier this week, discussed more of this decoupling and coordination among Eastern and Western powers.
In a two-part series, she explains the challenging of U.S. island bases by China and Russia, as well as their maritime strategies, “island hopping [and] shopping.” Check them out.
Today we received data on PCE inflation, real disposable and personal income, along with consumer spending and trade in goods (8:30 AM ET). University of Michigan Sentiment and five-year inflation expectations come later (10:00 AM ET).
Graphic updated 6:45 AM ET. Sentiment Neutral if expected /ES open is inside of the prior day’s range. /ES levels are derived from the profile graphic at the bottom of the following section. Levels may have changed since initially quoted; click here for the latest levels. SqueezeMetrics Dark Pool Index (DIX) and Gamma (GEX) calculations are based on where the prior day’s reading falls with respect to the MAX and MIN of all occurrences available. A higher DIX is bullish. At the same time, the lower the GEX, the more (expected) volatility. Learn the implications of volatility, direction, and moneyness. SHIFT data used for S&P 500 (INDEX: SPX) options activity. Note that options flow is sorted by the call premium spent; if more positive, then more was spent on call options. Breadth reflects a reading of the prior day’s NYSE Advance/Decline indicator. VIX reflects a current reading of the CBOE Volatility Index (INDEX: VIX) from 0-100.
What To Expect
Fundamental: At its core, there’s a commitment to cutting liquidity and credit after the spending of COVID-era “benefits and lockdown savings … created a lot of demand,” and inflation.
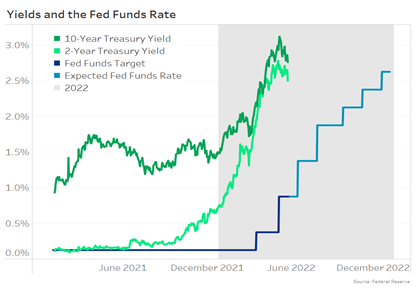
Graphic: Via the Federal Reserve. Taken from Nasdaq Inc (NASDAQ: NDAQ). “Rates have risen dramatically this year, impacting valuations of stocks and bonds.”
This has consequences on the real economy and asset prices, accordingly, which rose and kept the deflationary pressures of prevailing monetary policies at bay.
Graphic: Taken from Nasdaq Inc. “At a very simple level, rising rates increase interest expenses, reducing profits. But they also cause investors, who can earn more interest on safe cash deposits, to demand stronger returns from all other investments too.”
As unpacked, in detail, on May 18, 2022, there is an argument that stock market drops are both a recession and a reflection of the unwind of carry (or investment in long-duration bets with cheap debt) – a deflationary shock.
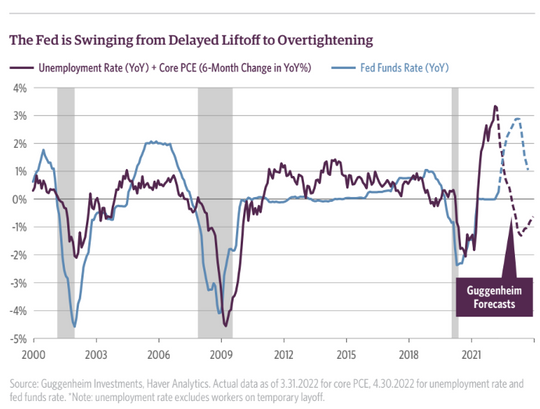
Graphic: Via Bloomberg. “Tighter financial conditions themselves are a clear success story for the Fed — it is the only way they can reduce inflationary pressures,” said Seema Shah, chief strategist at Principal Global Investors.
“The Fed has a mandate … to control price stability,” Kai Volatility’s Cem Karsan had explained.
“With supply-side economics, the only way that they can control this ultimately is to pull back. And slow capital markets decrease via the wealth effect. Ultimately, there’s a significant lag, so they are not in a position to ultimately control inflation without bringing down markets.”
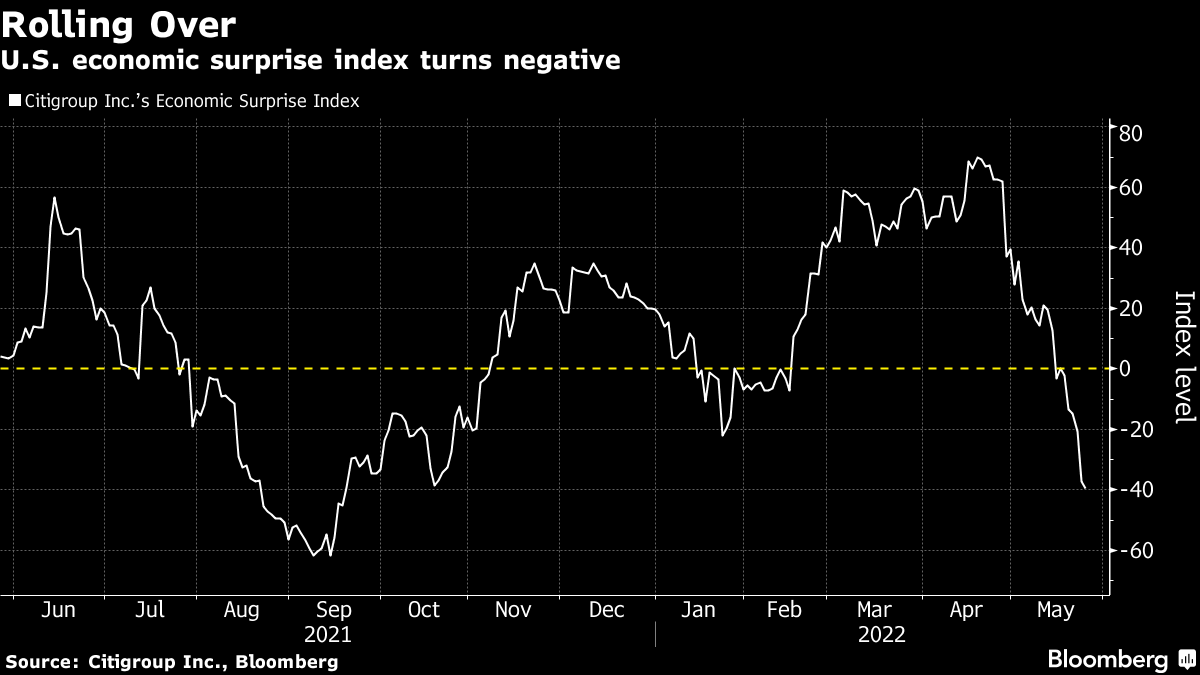
Graphic: Via Bloomberg. “Of course, economic growth is a good thing. But too much of that good thing will just continue to stoke inflation. With that perspective in mind, the slowdown in surprises is positive.”
Accordingly, in our May 25, 2022 commentary, in which we discussed what to search for in the minutes of the last Federal Open Market Committee (FOMC) meeting. Knowing that there’s a lag in policy impact, we accurately floated the potential for the Federal Reserve (Fed) to “shift gears” late this summer if further cooling of inflation and “evidence of a growth slowdown.”
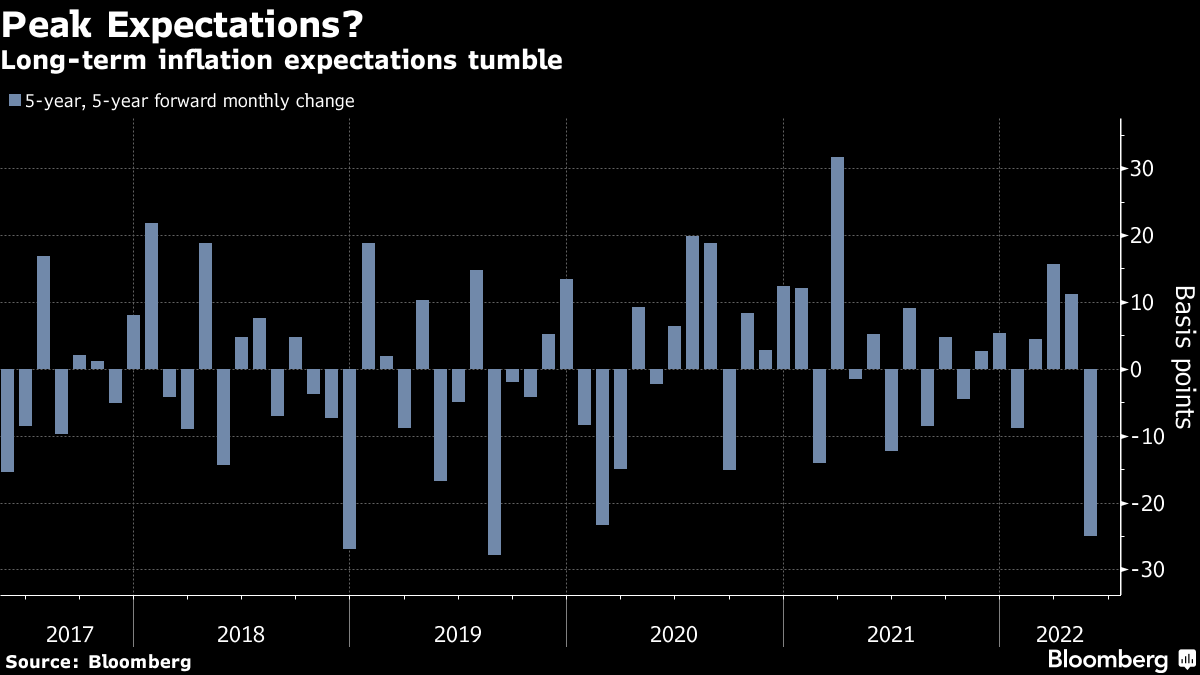
Graphic: Via Bloomberg. “After hitting a record above 3% last month, 10-year breakevens are on track for their biggest monthly drop since March 2020. The so-called five-year, five-year forward — the Fed’s favored measure — is set to post its biggest drop in May since August 2019.”
“Policy works with a lag,” as Diane Swonk of Grant Thorton explained. The Fed may pause as it seeks to “catch up but not outrun the market in its effort to tighten credit market conditions.”
“There is still more progress to be made in bringing inflation expectations down to resonate with the Committee’s target, but current valuations are at least in the realm of acceptable,” Ian Lyngen, who is head of U.S. rates strategy at the Bank of Montreal (NYSE: BMO), said.
“The market is showing some faith in Powell’s inflation-fighting creditability.”
Graphic: Taken from Nasdaq Inc. “Although inflation is high right now, it’s because of Covid and the Ukraine war. Both, hopefully, will pass, and 3%-4% inflation a year from now seems possible if the economy slows to a more normal level. In turn, that means the interest rate that keeps the U.S. economy growing slowly is likely much lower than we might currently be thinking. It might, in fact, be right around where bond rates are now.”
Concluding the fundamental section with remarks from a March 2022 Substack newsletter published by Andreas Steno Larsen of the Stenos Signals Substack.
“I simply don’t find >3.5% territory for the Fed Funds feasible as the hiking cycle peaked at 2.25-2.50% in 2018/2019 and fundamentals have worsened since. Debt loads are much higher, demographics have weakened, and the labour force is smaller, which suggests that the neutral rate is lower, not higher, than in 2018/2019.”
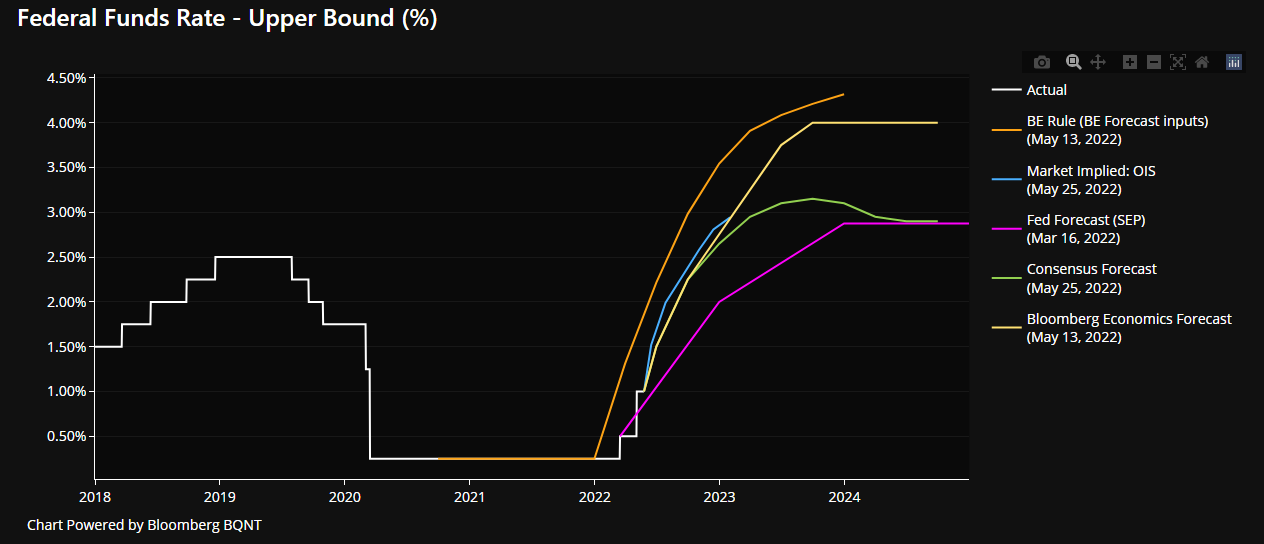
Graphic: Via Bloomberg. “The swaps market and consensus forecasts to Bloomberg Economics both imply considerably faster rate hikes, while Bloomberg’s own forecast is more hawkish still.”
Positioning: Per Bank of America Corporation (NYSE: BAC) notes, investors poured nearly $20 billion into global stocks (in the week to May 25, 2022).
As I wrote in a SpotGamma note, notable was the reversal in beaten-down areas of the market, as well as the implosion at the front-end of the volatility term structure, affecting protection most sensitive to changes in direction and volatility.
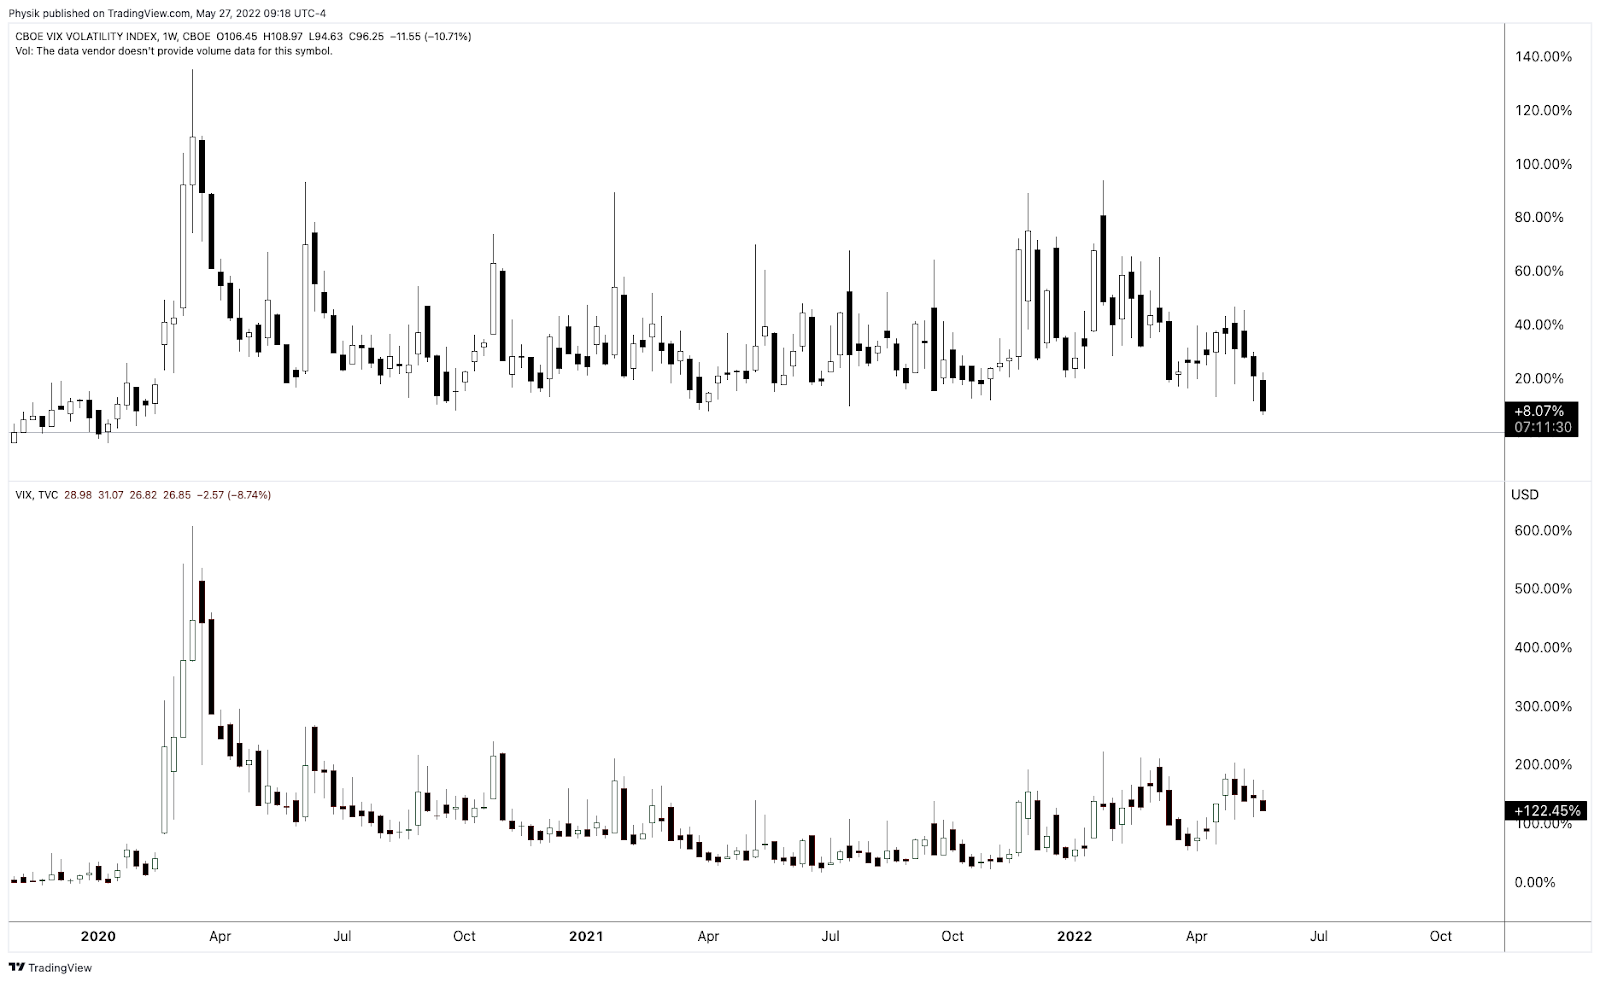
The Cboe VVIX Index (INDEX: VVIX), the expected volatility of the 30-day forward price of the VIX or the volatility of volatility (a naive but useful measure of skew), dropped off markedly, too, in comparison to the VIX, itself.
Graphic: Via Physik Invest. Taken from TradingView. VVIX, top. VIX, bottom.
Further, as stated in SpotGamma’s note, a “falling VVIX (and VIX term structure drop off) may be the product of a collapse in the value of customers’ long put exposures concentrated in very short-dated timeframes (potentially exposures hedging tail risks with respect to the release of FOMC minutes, among other things).”
“It is then as the skew, here, decays, and term structure compresses, that liquidity providers buy back their hedges to the puts they are short (i.e., the vanna dynamic pointed to, earlier).”
This market-generated information helps us give context to this most recent equity market rally that is characterized by a little change in demand for bets on upside further in price and time
All else equal, this is not a feature of sustainable market rallies.
Why you ask?
Those names that have been most depressed, and are now reversing, were recipients of heavy demand for protection in the months prior.
For this reason – participants being well hedged – selling was orderly, rather than violent as in past episodes of market shock when the reach for protection solicited a cascading reaction that exacerbated underlying price movements due to liquidity providers’ hedging.
Graphic: Via Banco Santander SA (NYSE: SAN) research.
The large drop off in term structure, as well as the VVIX versus the VIX, is affecting protection most sensitive to changes in direction and volatility and the unwind of liquidity providers’ short futures and stock hedges to this protection is, in part, playing into this internally weak rally.
So, what? How do you play this? Good question.
It still may make sense to have exposure to underlying markets, synthetically (i.e., own options), as detailed, well, May 25, 2022. Read that letter for detail on how to think about trade structure.
Technical: As of 6:45 AM ET, Friday’s regular session (9:30 AM – 4:00 PM ET), in the S&P 500, will likely open in the upper part of a positively skewed overnight inventory, inside of prior-range and -value, suggesting a limited potential for immediate directional opportunity.
In the best case, the S&P 500 trades higher; activity above the $4,069.25 HVNode puts in play the $4,095.00 ONH. Initiative trade beyond the ONH could reach as high as the $4,119.00 VPOC and $4,148.25 HVNode, or higher.
In the worst case, the S&P 500 trades lower; activity below the $4,069.25 HVNode puts in play the $3,997.75 RTH High. Initiative trade beyond the RTH High could reach as low as the $3,982.75 LVNode and $3,951.00 VPOC, or lower.
Click here to load today’s key levels into the web-based TradingView charting platform. Note that all levels are derived using the 65-minute timeframe. New links are produced, daily.
Graphic: 65-minute profile chart of the Micro E-mini S&P 500 Futures.
Definitions
Overnight Highs And Lows (ONH and ONL): Typically, there is a low historical probability associated with overnight rally-highs (lows) ending the upside (downside) discovery process.
Volume Areas: A structurally sound market will build on areas of high volume (HVNodes). Should the market trend for long periods of time, it will lack sound structure, identified as low volume areas (LVNodes). LVNodes denote directional conviction and ought to offer support on any test.
If participants were to auction and find acceptance into areas of prior low volume (LVNodes), then future discovery ought to be volatile and quick as participants look to HVNodes for favorable entry or exit.
POCs: POCs are valuable as they denote areas where two-sided trade was most prevalent in a prior day session. Participants will respond to future tests of value as they offer favorable entry and exit.
MCPOCs: POCs are valuable as they denote areas where two-sided trade was most prevalent over numerous day sessions. Participants will respond to future tests of value as they offer favorable entry and exit.
About
After years of self-education, strategy development, mentorship, and trial-and-error, Renato Leonard Capelj began trading full-time and founded Physik Invest to detail his methods, research, and performance in the markets.
Capelj also develops insights around impactful options market dynamics at SpotGamma and is a Benzinga reporter.
In no way should the materials herein be construed as advice. Derivatives carry a substantial risk of loss. All content is for informational purposes only.
The daily brief is a free glimpse into the prevailing fundamental and technical drivers of U.S. equity market products. Join the 300+ that read this report daily, below!
Ahead of a $1.9 trillion options expiration, which we unpack later in the letter, the equity index and commodity futures, as well as yields, were bid.
This activity was on the heels of good news coming from overseas. China lowered prime rates on the five-year by a record to boost mortgages and loans amid an ongoing pandemic slump.
In other news, China warned the U.S. over a ‘dangerous situation’ forming over Taiwan, and the U.S. is set to block Russian debt payments, raising concerns of default.
This is as Russian forces, per Michael Horowitz of Le Beck Int’l, broke “Ukrainian defenses west of Popasna in the Donbass, … a tactical success for Russia, the first in a very long time.”
Ahead, there is no data scheduled for release. Enjoy your Friday!
Graphic updated 6:30 AM ET. Sentiment Neutral if expected /ES open is inside of the prior day’s range. /ES levels are derived from the profile graphic at the bottom of the following section. Levels may have changed since initially quoted; click here for the latest levels. SqueezeMetrics Dark Pool Index (DIX) and Gamma (GEX) calculations are based on where the prior day’s reading falls with respect to the MAX and MIN of all occurrences available. A higher DIX is bullish. At the same time, the lower the GEX, the more (expected) volatility. Learn the implications of volatility, direction, and moneyness. SHIFT data used for S&P 500 (INDEX: SPX) options activity. Note that options flow is sorted by the call premium spent; if more positive, then more was spent on call options. Breadth reflects a reading of the prior day’s NYSE Advance/Decline indicator. VIX reflects a current reading of the CBOE Volatility Index (INDEX: VIX) from 0-100.
Moody’s Corporation’s (NYSE: MCO) Mark Zandi explains “the odds that the economy will suffer a downturn beginning in the next 12 months at one in three with uncomfortable near-even odds of a recession in the next 24 months.”
Graphic: Via The Macro Compass. “Analyst consensus for the 2022 US real GDP growth has been consistently revised down this year.”
Per Bloomberg’s John Authers, U.S. housing is slowing down in the context of still-heightened sales. Data on home building suggests builders “aren’t running scared” while chokepoints still are feeding into support for house prices.
“Now, with inflation rising, the Fed is more concerned about wealth effects,” Authers explained.
“The rise in asset prices has made a lot of people wealthier and encouraged them to spend accordingly. It’s also stoked inequality. A fall in home values would be helpful at this point,” and it’s something the Fed is keen on “pursuing,” as talked about in letters earlier this week.
Positioning: Friday marks the roll off of $460 billion of derivatives across single stocks and $855 billion of S&P 500-linked contracts, according to a Bloomberg report quoting Goldman Sachs Group Inc (NYSE: GS) research.
Graphic: Via Goldman Sachs Group Inc. Taken from Bloomberg.
Into this event, participants are hedged and volatility remains well-supplied, due in part to suppressive volatility selling, as well as passive flows supporting the largest index constituents.
Consequently, the market’s descent has been orderly and not exacerbated by the demand for hedges and associated repricings of volatility.
This was expected, per Kai Volatility Cem Karsan’s commentary published in December 2021.
“If a meaningful volatility event has recently transpired [e.g., COVID-19], implied volatility demand tends to be high,” as sellers of it were liquidated in previous declines and “buyers have been rewarded with profits and demand for their services.”
Graphic: Via Bloomberg. “2022 is shaping up to be the busiest year for option trading. Almost 40 million contracts have changed hands daily on average, 6% above last year’s record, data compiled by Bloomberg show.”
“Market participants are thus overly hedged going into the second move, resulting in the suppression of implied volatility and skew along with a dampening of realized volatility.”
Given the aforementioned supply and demand dynamic, as well as illiquidity, we continue to observe a “divergence in the volatility (movement of underlying equity market up and down) realized, versus that which is implied by options activity,” SpotGamma says.
Graphic: Via @ftx_chris. “The relationship between illiquidity & volatility is a critical market driver for traditional markets now. In simple terms: lower liquidity creates increased volatility.”
“For some of these reasons – tempered measures of implied volatility – the market’s missing a lot of the ‘stored energy’ or ‘vanna fuel’ that’s helped support it in past periods of turmoil.”
Graphic: Via @HalfersPower. “1 day return distribution when QQQ ROC[1] > 3.7%. Historically you can expect the weakest relative mean forward returns, and second-highest mean realized volatility amongst deciles.”
So, barring changes in fundamentals, the catalysts to a potential rally are few and far between, and we elaborated on this in an earlier commentary.
Graphic: Via SqueezeMetrics. Updated May 13, 2022. “VIX compressing to 30 on a modest pre-market rally with dealer gamma exposure more negative than it’s been in years is not how you get sustained rallies—it’s how you get energy for bigger downside moves.”
Heading into Friday, Bloomberg quotes the $4,000.00 S&P 500 (INDEX: SPX) strike having “93,000 open positions set to run out, … includ[ing] 41,024 calls and 52,269 puts.”
Graphic: Via SpotGamma.
An open well below $4,000.00 means that this expiration will coincide with the removal of a lot of in-the-money put-delta. That means, post-expiration, per SpotGamma, “market makers will be free to buy back stocks to cover the short exposures that are no longer needed.”
“Any ultimate rally off of Opex, we’d consider to be short covering, and subject to swift reversals into the end of next week.”
Technical: As of 6:30 AM ET, Friday’s regular session (9:30 AM – 4:00 PM ET), in the S&P 500, will likely open in the upper part of a positively skewed overnight inventory, just inside of prior-range and -value, suggesting a limited potential for immediate directional opportunity.
In the best case, the S&P 500 trades higher; activity above the $3,943.25 high volume area (HVNode) puts in play the $4,061.00 untested point of control (VPOC). Initiative trade beyond the VPOC could reach as high as the $4,095.00 overnight high (ONH) and $4,119.00 VPOC, or higher.
In the worst case, the S&P 500 trades lower; activity below the $3,943.25 HVNode puts in play the $3,908.75 micro composite point of control (MCPOC). Initiative trade beyond the MCPOC could reach as low as the $3,862.75 and $3,836.25 low volume areas (LVNodes), or lower.
Click here to load today’s key levels into the web-based TradingView charting platform. Note that all levels are derived using the 65-minute timeframe. New links are produced, daily.
Graphic: 65-minute profile chart of the Micro E-mini S&P 500 Futures.
Considerations: Push-and-pull, as well as responsiveness near key-technical areas (discernable visually on a chart), suggests technically-driven traders with shorter time horizons are (becoming) active.
Such traders often lack the wherewithal to defend retests.
Large participants (who often move by committee) seldom respond to key technical inflections. It is their activity that often results in poor reliability of our technical levels.
Sometimes, the better trade is to wait for the larger participants’ entry and use the expansion of the range as a confirmation of a new trend.
Definitions
Overnight Rally Highs (Lows): Typically, there is a low historical probability associated with overnight rally-highs (lows) ending the upside (downside) discovery process.
Volume Areas: A structurally sound market will build on areas of high volume (HVNodes). Should the market trend for long periods of time, it will lack sound structure, identified as low volume areas (LVNodes). LVNodes denote directional conviction and ought to offer support on any test.
If participants were to auction and find acceptance into areas of prior low volume (LVNodes), then future discovery ought to be volatile and quick as participants look to HVNodes for favorable entry or exit.
POCs: POCs are valuable as they denote areas where two-sided trade was most prevalent in a prior day session. Participants will respond to future tests of value as they offer favorable entry and exit.
MCPOCs: POCs are valuable as they denote areas where two-sided trade was most prevalent over numerous day sessions. Participants will respond to future tests of value as they offer favorable entry and exit.
About
After years of self-education, strategy development, mentorship, and trial-and-error, Renato Leonard Capelj began trading full-time and founded Physik Invest to detail his methods, research, and performance in the markets.
Capelj also develops insights around impactful options market dynamics at SpotGamma and is a Benzinga reporter.
In no way should the materials herein be construed as advice. Derivatives carry a substantial risk of loss. All content is for informational purposes only.
The daily brief is a free glimpse into the prevailing fundamental and technical drivers of U.S. equity market products. Join the 300+ that read this report daily, below!
Overnight, equity index futures continued lower as weakness spread overseas. Commodities were mixed and yields were lower. At a high-level, measures of implied volatility held their bid.
Apart from the removal of structural forces underpinning a rally into mid-week, earnings reports played into “fears of the consequences of if inflation is brought under control,” per Bloomberg.
Ahead is data on jobless claims and manufacturing (8:30 AM ET). Later, existing home sales and leading economic indicators (10:00 AM ET). No events are scheduled for tomorrow.
Graphic updated 8:30 AM ET. Sentiment Risk-Off if expected /ES open is below the prior day’s range. /ES levels are derived from the profile graphic at the bottom of the following section. Levels may have changed since initially quoted; click here for the latest levels. SqueezeMetrics Dark Pool Index (DIX) and Gamma (GEX) calculations are based on where the prior day’s reading falls with respect to the MAX and MIN of all occurrences available. A higher DIX is bullish. At the same time, the lower the GEX, the more (expected) volatility. Learn the implications of volatility, direction, and moneyness. SHIFT data used for S&P 500 (INDEX: SPX) options activity. Note that options flow is sorted by the call premium spent; if more positive, then more was spent on call options. Breadth reflects a reading of the prior day’s NYSE Advance/Decline indicator. VIX reflects a current reading of the CBOE Volatility Index (INDEX: VIX) from 0-100.
What To Expect
Fundamental: On the heels of Target reporting lower profits on costs and tighter margins, the beloved Cathie Wood of Ark Invest chimed in with a note on an explosion in inventories. Late last year, we quoted Wood suggesting businesses were scrambling to increase inventories.
Graphic: Via Bloomberg. “Target announced that sales were up, but profit was down thanks to increasing costs and tightening margins. Also like Walmart the day before, the market rewarded the stock with its biggest one-day decline since the Black Monday crash of October 1987. That’s alarming, although it’s worth pointing out that Target had been a conspicuous beneficiary of the pandemic to date.”
Though early, she said inflation would eventually be on its way out and inventory build-ups were one of the indicators to watch.
“Walmart Inc’s (NYSE: WMT) inventories increased 33% in nominal terms on a year over year basis, translating into 20-25% in real or unit terms, as Target Corporation’s (NYSE: TGT) inventories increased by 42% and 30-35%, respectively,” Wood said.
At the same time, sentiment has plunged to Great Recession levels, all the while consumers are “rebelling against their loss of purchasing power,” and China is in turmoil (talked about May 16).
These comments play into the recession narratives we unpacked earlier this week (May 17 and May 18). Monetary policies sent money to capital and that bolstered deflationary trends.
Then came the pandemic and the increasing effects of inequality; money was sent to labor, and that bolstered inflationary trends.
Graphic: Via Bloomberg. “Overall wage increases were 6% in April, for the second month running — too high for the Fed’s comfort but at least with no increase. It is the least well paid who are commanding the highest percentage rises.”
As we quoted Kai Volatility’s Cem Karsan explaining, today’s contractionary monetary policy is a blunt tool and is not equipped to “address the main problem which is a lack of supply to absorb the demand.”
Graphic: Via Bloomberg. “China appears to be gradually easing its lockdown of Shanghai, but that won’t bring immediate relief to global supply-chain congestion.”
Likewise, Credit Suisse Group AG’s (NYSE: CS) Zoltan Pozsar explained what he felt was “the Fed is pursuing demand destruction through negative wealth effects,” as the “central banks can only deal with nominal” chokepoints.
Graphic: Via JPMorgan Chase & Co (NYSE: JPM). Taken from The Market Ear. “A stronger dollar, lower equity prices, and higher mortgage rates will weigh on demand growth [and] Over time weaker output demand should lead to weaker labor demand Don’t fight the Fed as this is what Fed wants (slower growth).”
By that token, we must “[c]onsider at least the possibility that the extreme volatility and lack of liquidity [we] see in markets is by design, and the Fed will not be deterred by it, but rather that it will be emboldened by it in its singular pursuit of price stability.”
Why does any of this matter?
As quoted, yesterday, “[w]ith supply-side economics, the only way that they can control [price stability] is to pull back. And slow capital markets decrease via the wealth effect. Ultimately, there’s a significant lag, so [the Fed is] not in a position to ultimately control inflation without bringing down markets.”
By that token, a stock market drop is both a recession and a direct reflection of the unwind of global carry. It is the manifestation of a deflationary shock, and today’s sentiment, the gradual build-up of inventories, tightening of financial conditions, and the like, are a reflection of this.
Graphic: Via Guggenheim Partners. Taken from MarketWatch. The “ Fed is headed toward overtightening financial conditions just as employment show some softness.”
Perspectives: Recall that the indexes are trading relatively strong, in comparison to constituents, especially those that are smaller technology and growth companies.
Essentially, “we’re two-thirds of the way through a dot-com type collapse,” we quoted Simplify Asset Management’s Mike Green explaining.
“It’s just happened underneath the surface of the indices which is [that] … dynamic of passive flows supporting the largest stocks within the index, whereas the smaller stocks can be influenced to a greater extent by the behavior of discretionary managers.”
Pursuant to those remarks, JPMorgan Chase & Co’s Marko Kolanovic says there are significant opportunities in the beaten areas of the market.
“I almost refuse to talk about ‘where should I buy S&P?’” he said adding that “[m]ost of the bad things have happened already this year.”
“There will be no recession this year, some summer increase in consumer activity on the back of reopening, China increasing monetary and fiscal measures.”
Per the earlier quoted Pozsar, Kolanovic, like Wood, maybe too early in his calls.
“Banks’ stock buybacks are lowering SLRs [], and the Fed is about to embark on QT,” Pozsar says. For context, QT (Quantitative Tightening) is the central banking authorities’ removal of balance sheet assets via sales or the non-reinvestment of the principal sum of maturing securities.
The dynamic is as follows: if bonds are sold, their values fall and yields rise, thus pushing yield-hungry investors into less risky asset categories.
“These nominal balance sheet and liquidity trends, will at some point clash with the realities of a garden variety of supply chain issues,” as a result of geopolitical chokepoints.
Graphic: Per Bloomberg, “[E]very $1 trillion of QT will equate to a decline of roughly 10% in stocks over the next 12 months or so.”
Given Pozsar’s findings, the Fed is likely to do QE again in the summer of 2023.
Checking Eurodollar (FUTURE: /GE), a reflection of participants’ outlook for U.S. interest rates, shows the peak of the Fed-rate-hike cycle – terminal rate – at around June 2023.
Positioning: This week’s expiration of options on the Cboe Volatility Index (INDEX: VIX), per SpotGamma, pulled forward the positive effects of volatility compression heading into the large May monthly equity and index options expiration (OPEX).
“Barring a forced re-pricing, we saw what was already little fuel to the upside drained into the weighty VIX options expiration (as bets on the VIX decay, this leads to hedging that bolsters S&P 500 upside),” SpotGamma said.
“Following this event (and the coming monthly May OPEX), we see the door open to lower prices amid the removal of “max put” positioning which “clears the way for lower-lows.”
Heading into the monthly OPEX, if the S&P 500 Index (INDEX: SPX) is well below $4,000.00, “the buyback of short futures to short put exposures that no longer require liquidity providers to hedge,” may bolster a sharp reversal.
Graphic: Via SpotGamma. Taken from The Market Ear. “Deep short gamma where dealers are trapped in selling low and buying high and the poor liquidity environment, where the pushing of deltas (both ways) gets even more magnified due to non-existent volumes. This dynamic works both ways.”
Technical: As of 8:30 AM ET, Thursday’s regular session (9:30 AM – 4:00 PM ET), in the S&P 500, will likely open in the lower part of a negatively skewed overnight inventory, outside of prior-range and -value, suggesting a potential for immediate directional opportunity.
In the best case, the S&P 500 trades higher; activity above the $3,862.75 low volume area (LVNode) puts in play the $3,908.75 micro composite point of control (MCPOC). Initiative trade beyond the MCPOC could reach as high as the $3,943.25 high volume area (HVNode) and $4,061.00 virgin point of control (VPOC), or higher.
In the worst case, the S&P 500 trades lower; activity below the $3,862.75 LVNode puts in play the $3,836.25 LVNode. Initiative trade beyond the LVNodes could reach as low as the $3,795.75 and $3,727.25 HVNodes, or lower.
Click here to load today’s key levels into the web-based TradingView charting platform. Note that all levels are derived using the 65-minute timeframe. New links are produced, daily.
Graphic: 65-minute profile chart of the Micro E-mini S&P 500 Futures.
Definitions
Overnight Rally Highs (Lows): Typically, there is a low historical probability associated with overnight rally-highs (lows) ending the upside (downside) discovery process.
Volume Areas: A structurally sound market will build on areas of high volume (HVNodes). Should the market trend for long periods of time, it will lack sound structure, identified as low volume areas (LVNodes). LVNodes denote directional conviction and ought to offer support on any test.
If participants were to auction and find acceptance into areas of prior low volume (LVNodes), then future discovery ought to be volatile and quick as participants look to HVNodes for favorable entry or exit.
POCs: POCs are valuable as they denote areas where two-sided trade was most prevalent in a prior day session. Participants will respond to future tests of value as they offer favorable entry and exit.
MCPOCs: POCs are valuable as they denote areas where two-sided trade was most prevalent over numerous day sessions. Participants will respond to future tests of value as they offer favorable entry and exit.
Volume-Weighted Average Prices (VWAPs): A metric highly regarded by chief investment officers, among other participants, for quality of trade. Additionally, liquidity algorithms are benchmarked and programmed to buy and sell around VWAPs.
About
After years of self-education, strategy development, mentorship, and trial-and-error, Renato Leonard Capelj began trading full-time and founded Physik Invest to detail his methods, research, and performance in the markets.
Capelj also develops insights around impactful options market dynamics at SpotGamma and is a Benzinga reporter.
In no way should the materials herein be construed as advice. Derivatives carry a substantial risk of loss. All content is for informational purposes only.