Categories
Commentary

Daily Brief For August 12, 2022

The daily brief is a free glimpse into the prevailing fundamental and technical drivers of U.S. equity market products. Join the 750+ that read this report daily, below!
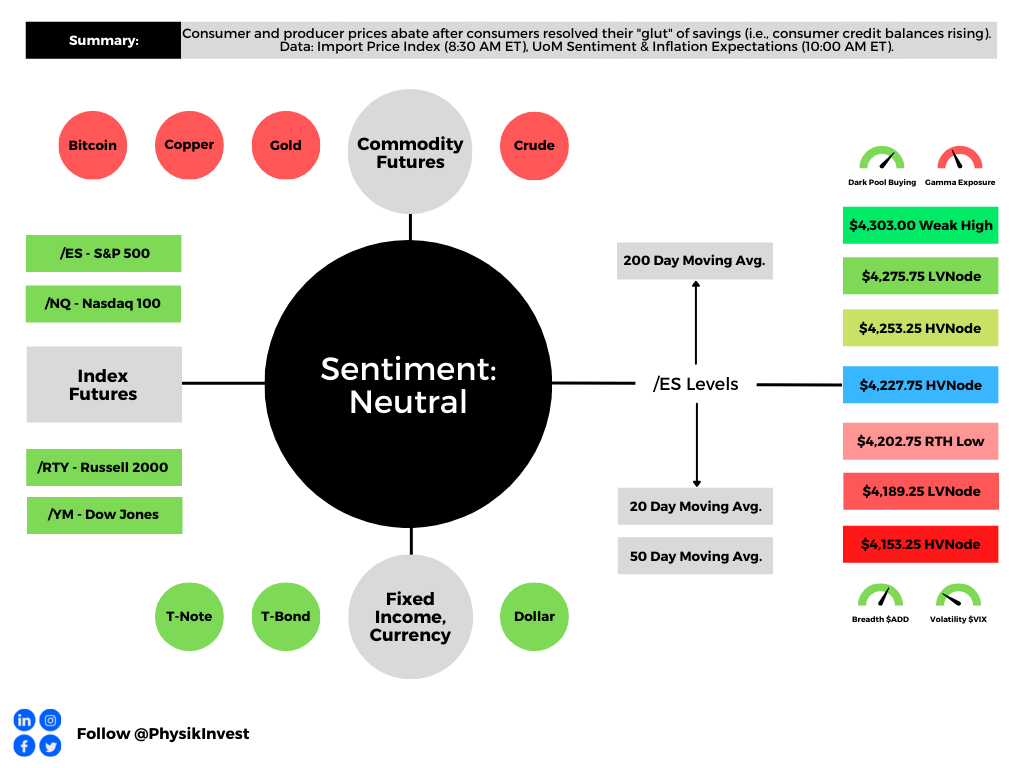
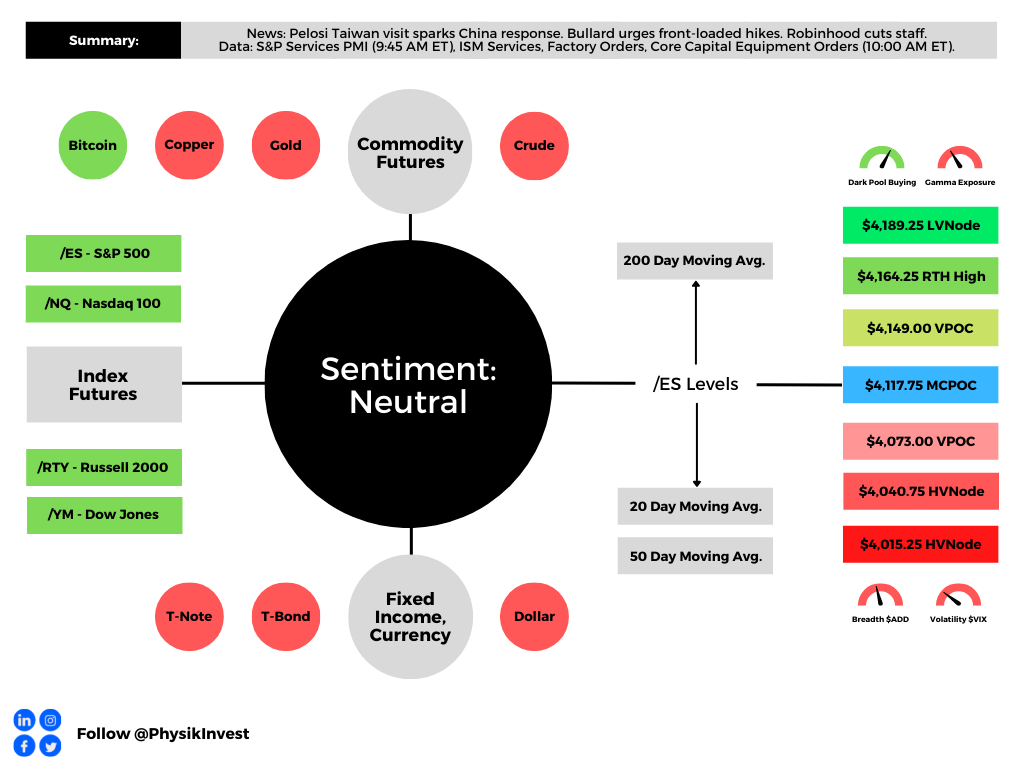
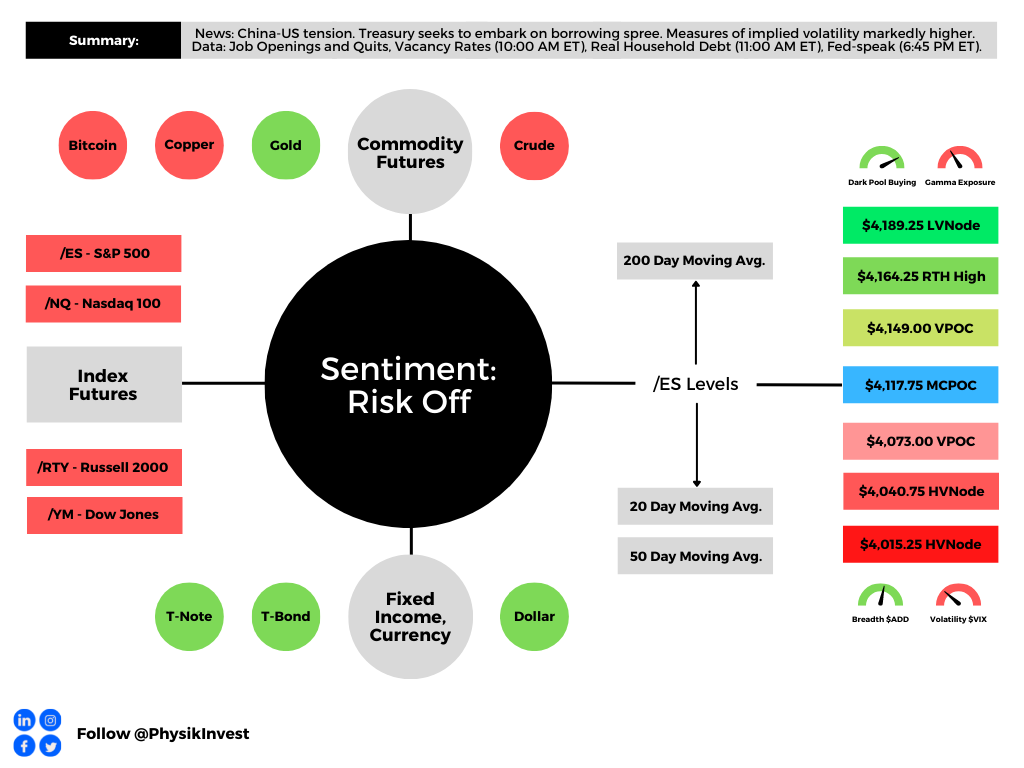
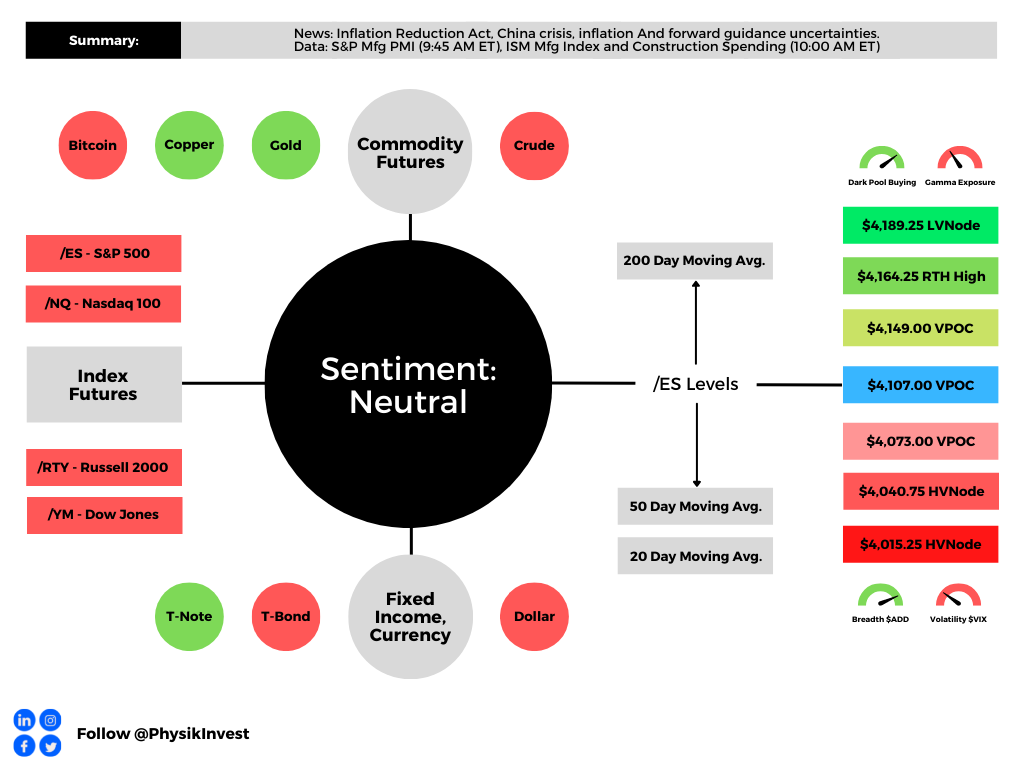
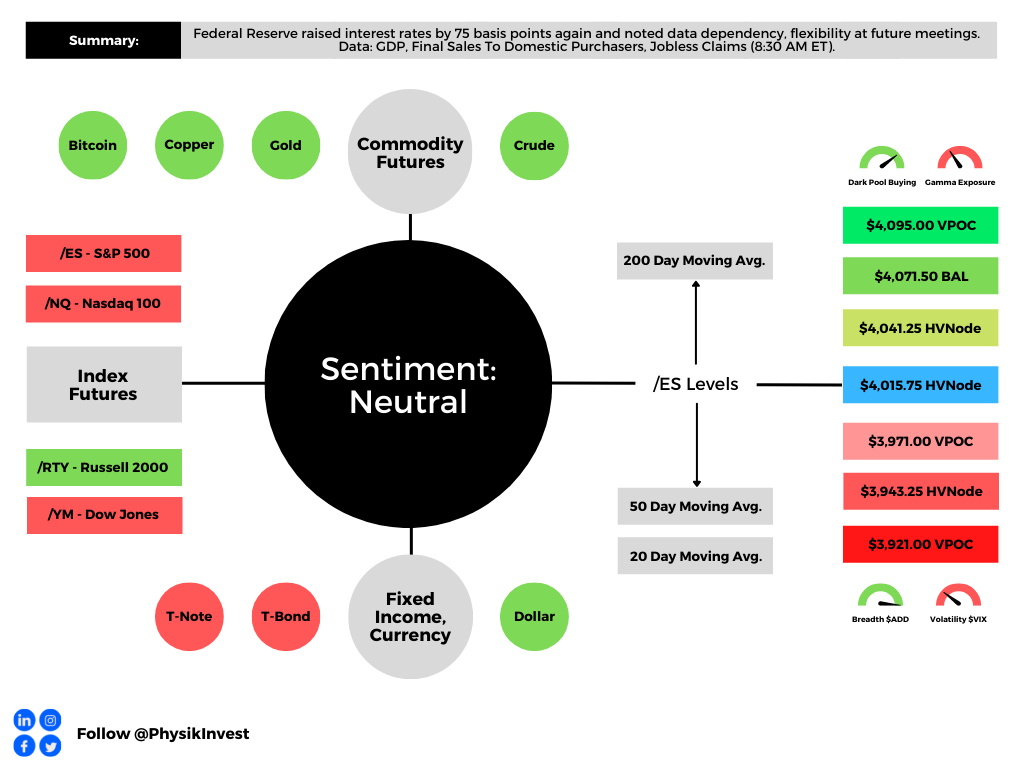
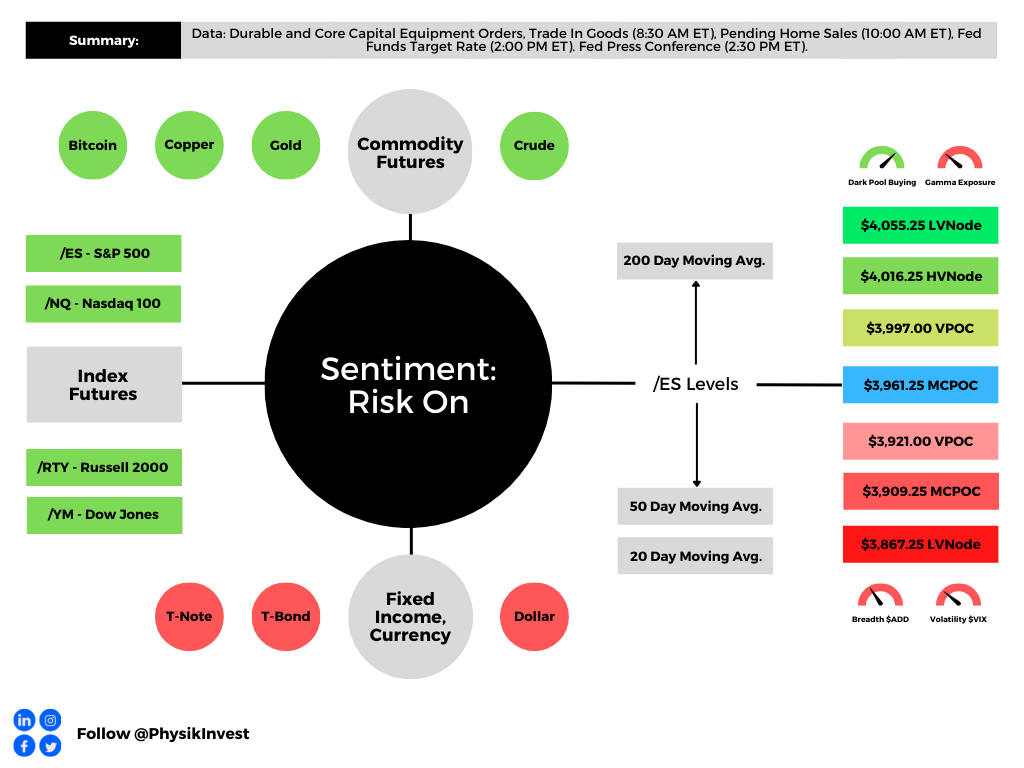
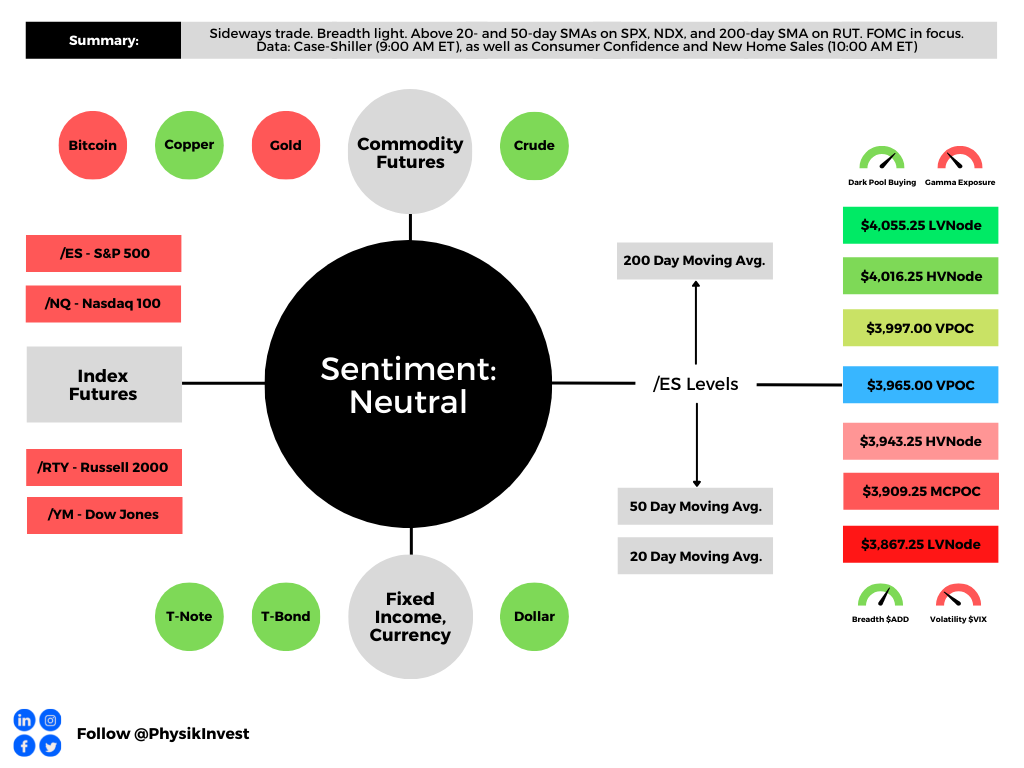
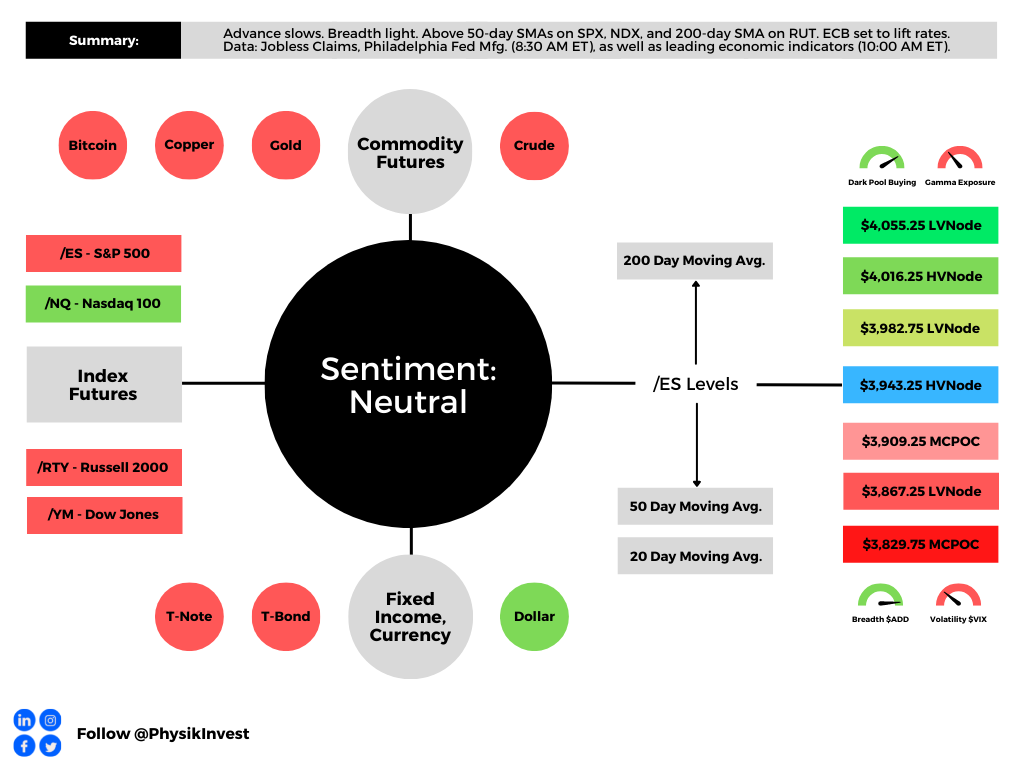
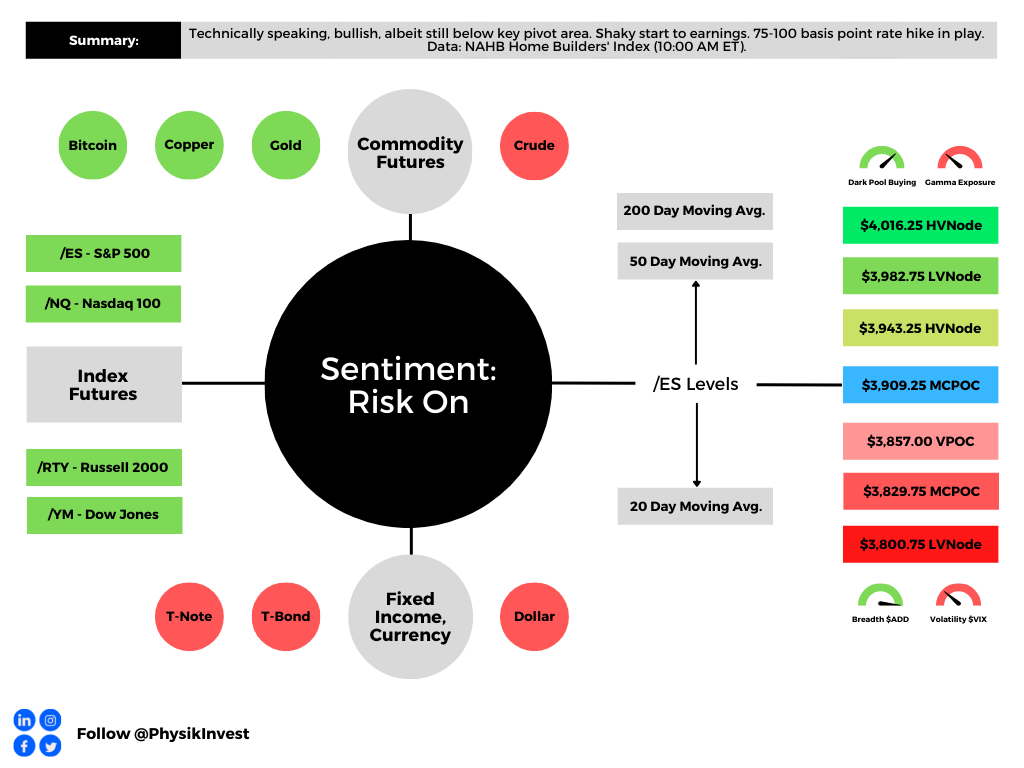
Graphic updated 7:00 AM ET. Sentiment Neutral if expected /ES open is inside of the prior day’s range. /ES levels are derived from the profile graphic at the bottom of the following section. Levels may have changed since initially quoted; click here for the latest levels. SqueezeMetrics Dark Pool Index (DIX) and Gamma (GEX) calculations are based on where the prior day’s reading falls with respect to the MAX and MIN of all occurrences available. A higher DIX is bullish. At the same time, the lower the GEX, the more (expected) volatility. Learn the implications of volatility, direction, and moneyness. Breadth reflects a reading of the prior day’s NYSE Advance/Decline indicator. VIX reflects a current reading of the CBOE Volatility Index (INDEX: VIX) from 0-100.

Fundamental

We’ll skip the fundamentals section, today, and do an in-depth review, sometime next week.

Positioning

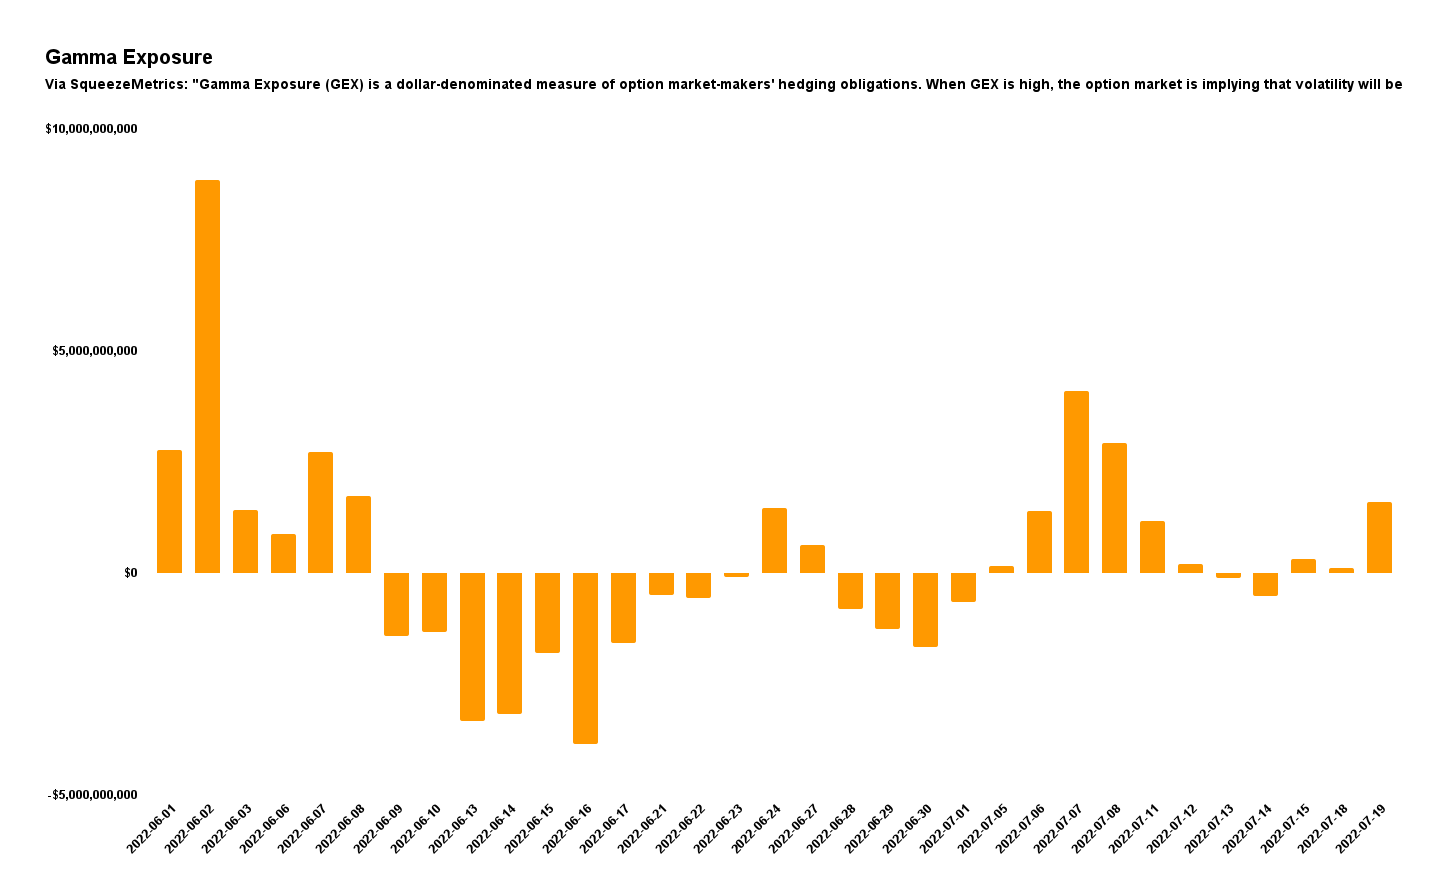
As of 7:00 AM ET, Friday’s expected volatility, via the Cboe Volatility Index (INDEX: VIX), sits at ~1.06%. Net gamma exposures generally rising may promote tighter trading ranges.
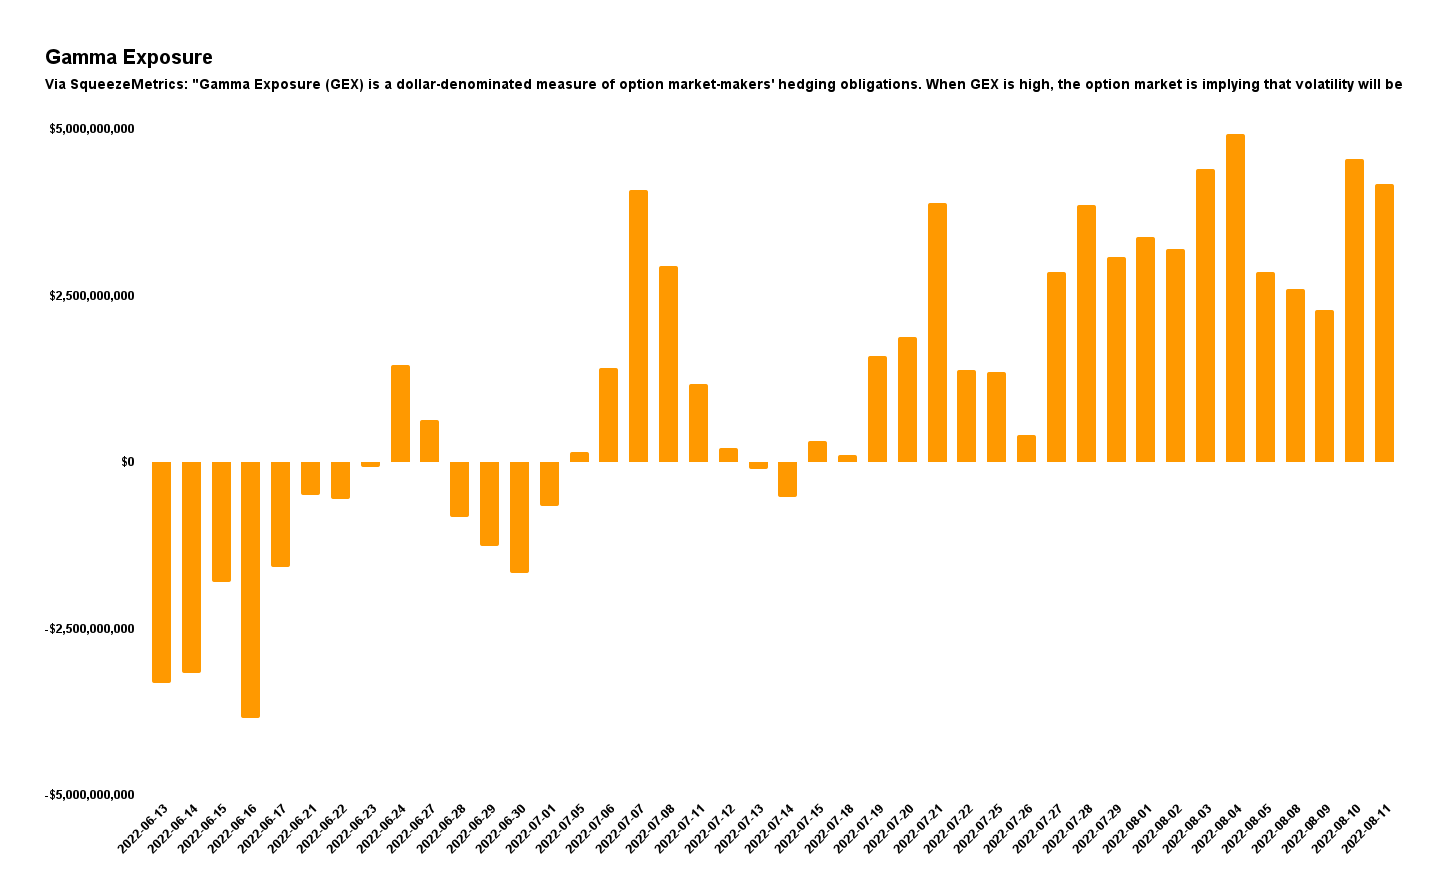
Graphic: Via Physik Invest. Data retrieved from SqueezeMetrics.

As stated yesterday, it may be beneficial for traders to shift their focus to dynamic structures. In other words, be a buyer of options structures (i.e., replace static directional exposures or Delta with those that are dynamic).

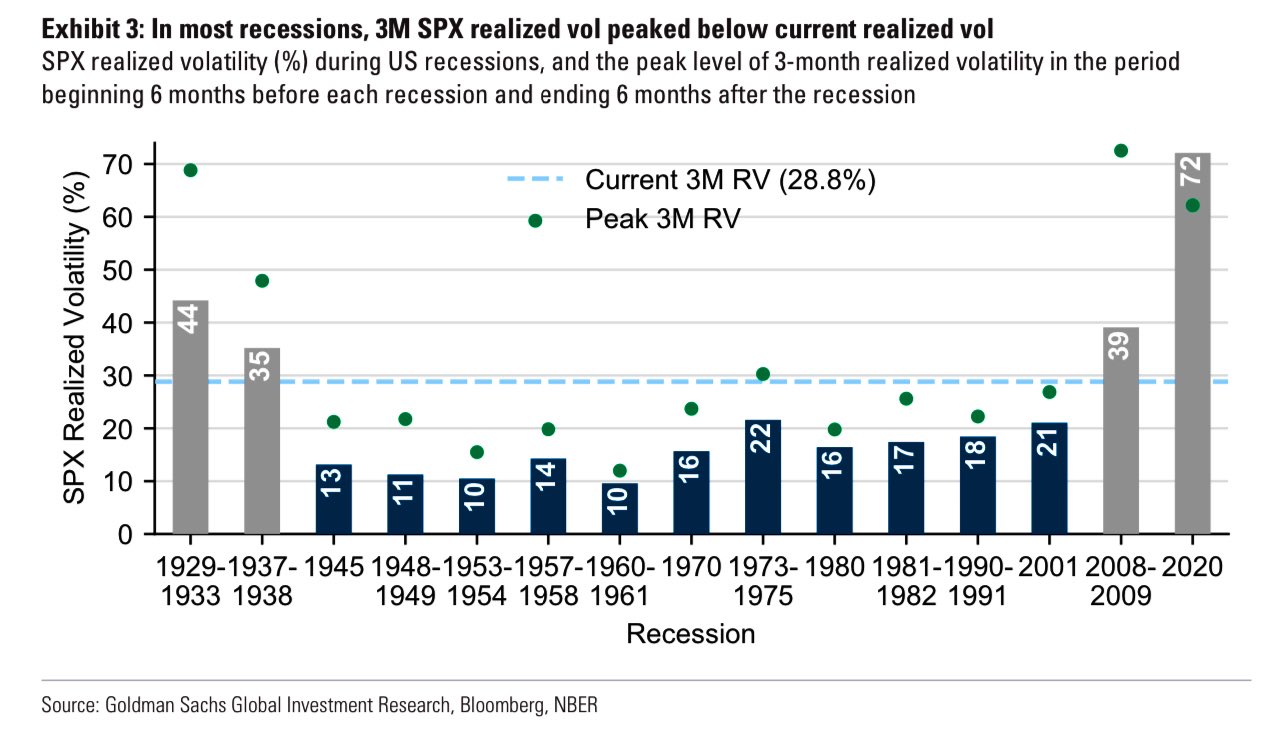
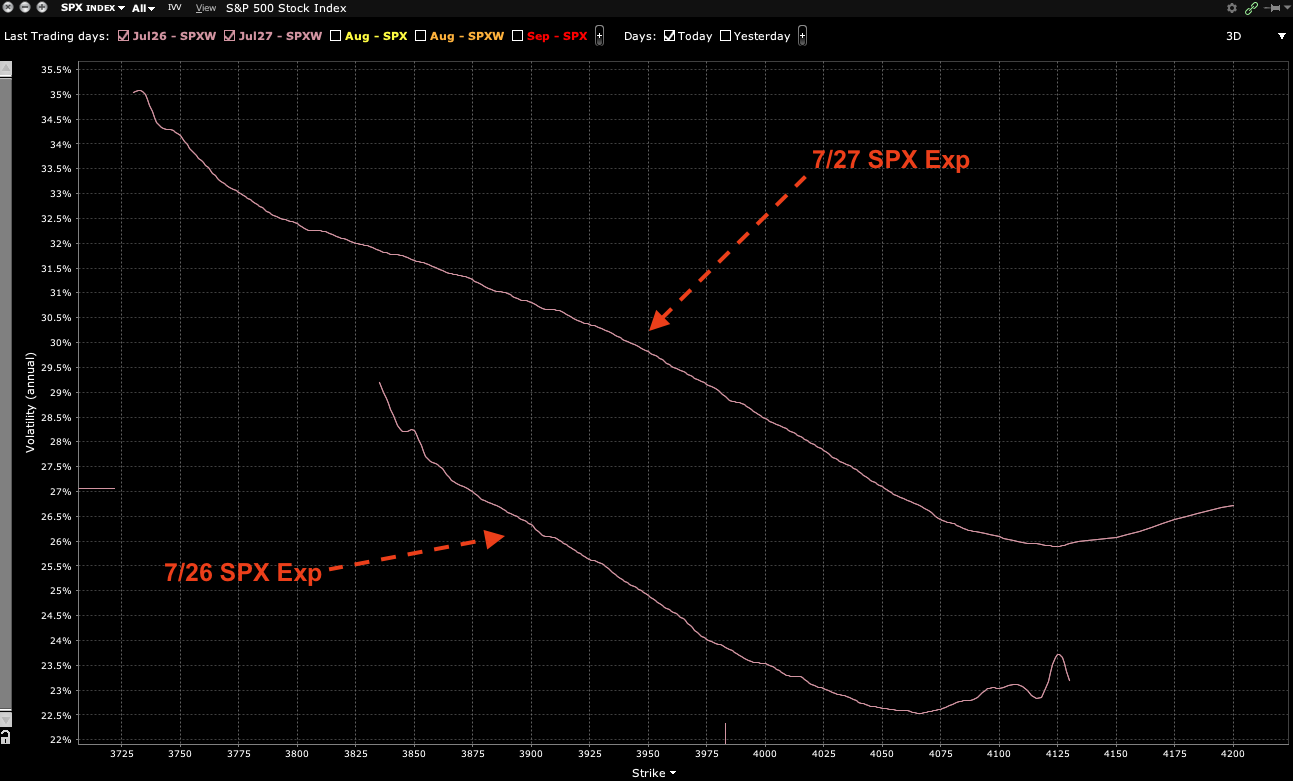
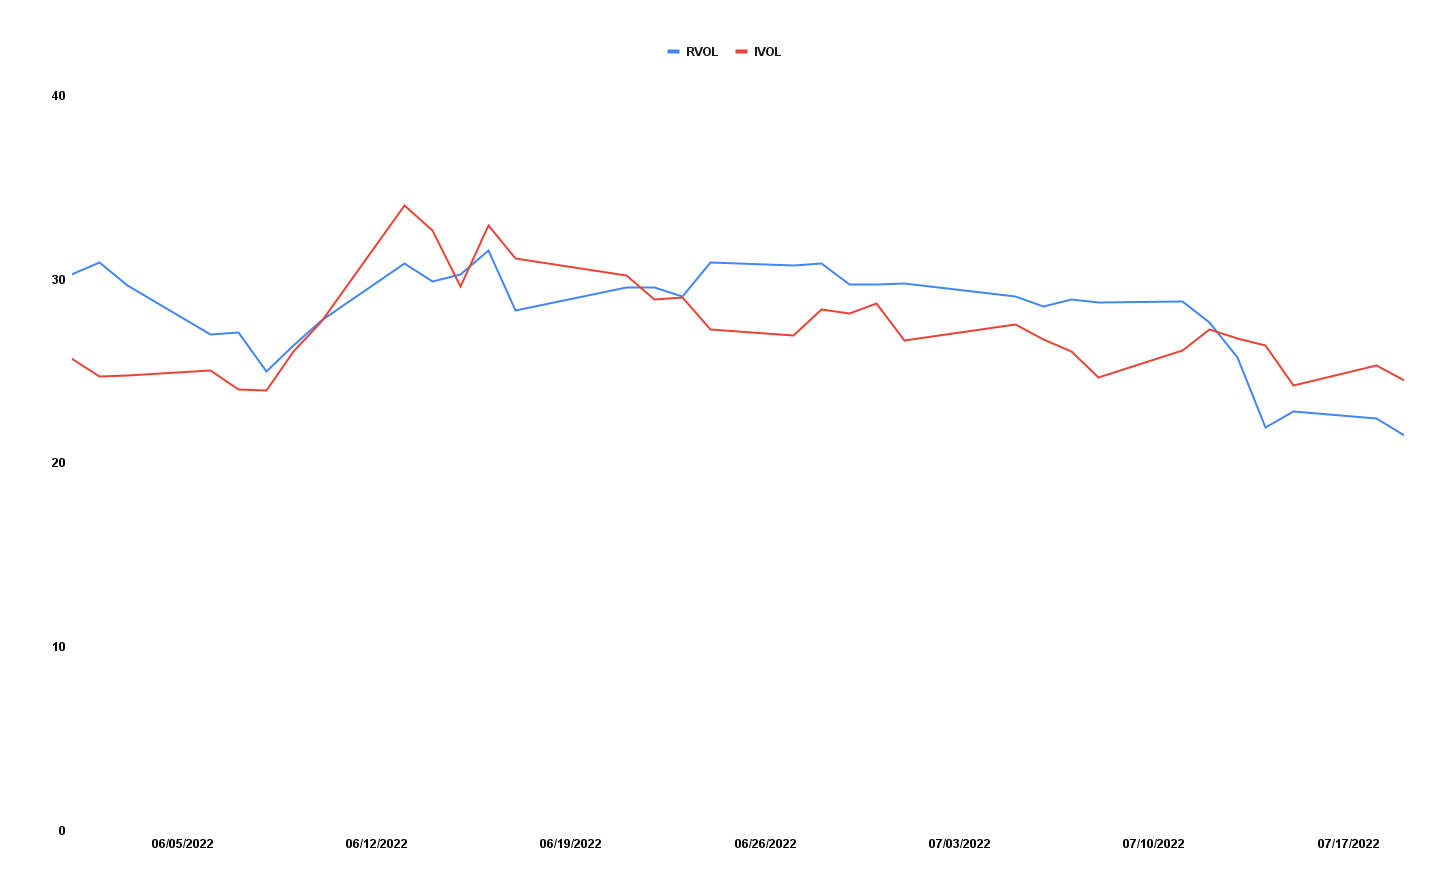
This is (1) due to where realized (RVOL) and implied (IVOL) volatility measures, and skew. 
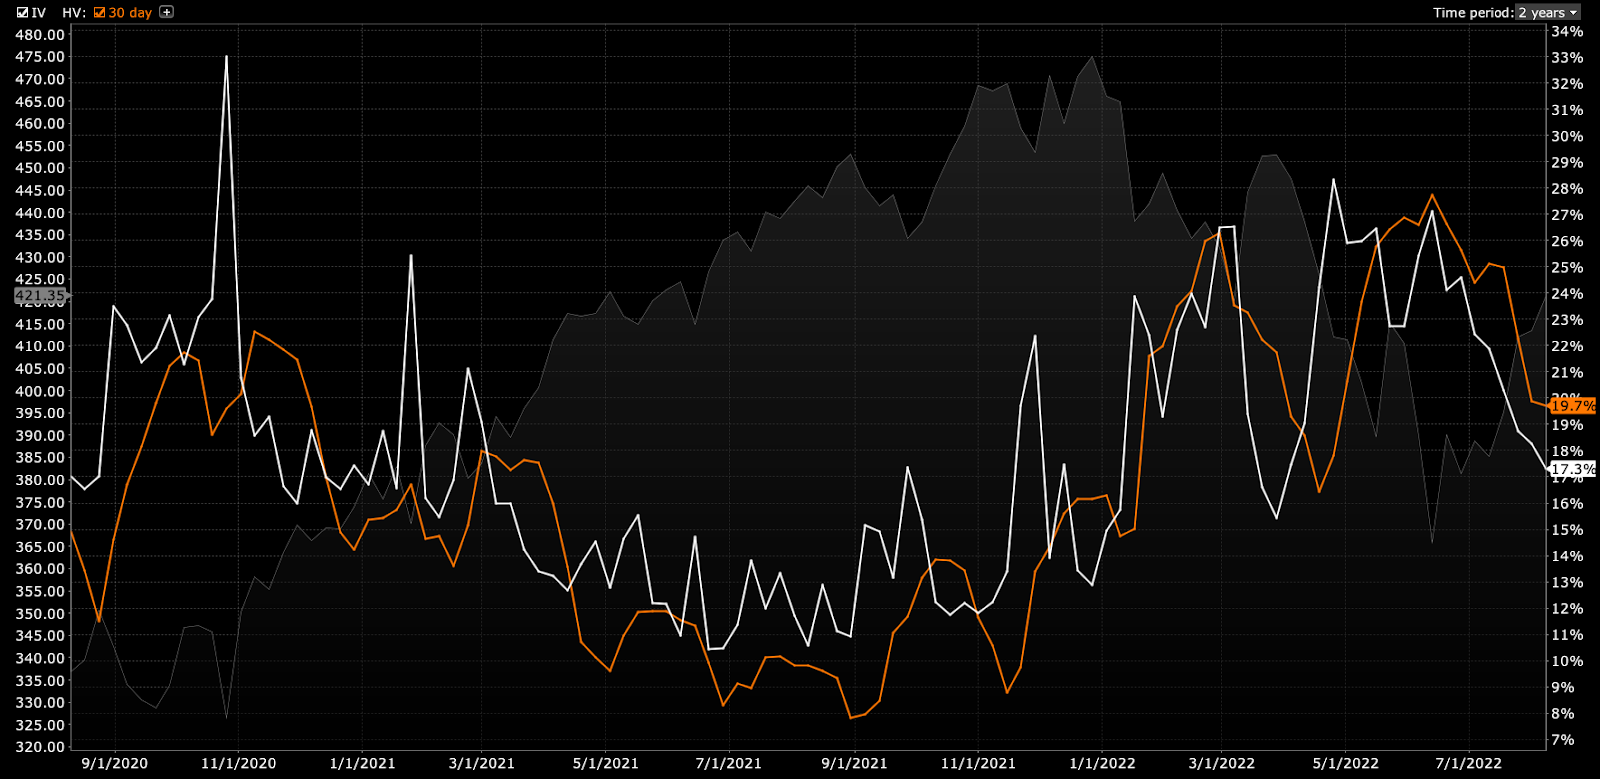
Graphic: Retrieved from Interactive Brokers Group Inc’s (NASDAQ: IBKR) Trader Workstation.

As well as (2) increased average stock correlation and lower return dispersion which, per Societe Generale SA (OTC: SCGLY) research, make stock picking hard(er).

It can be the case that Delta hedging becomes easier, too, as one asset, in a more correlated environment, can better offset the first-order sensitivities elsewhere.
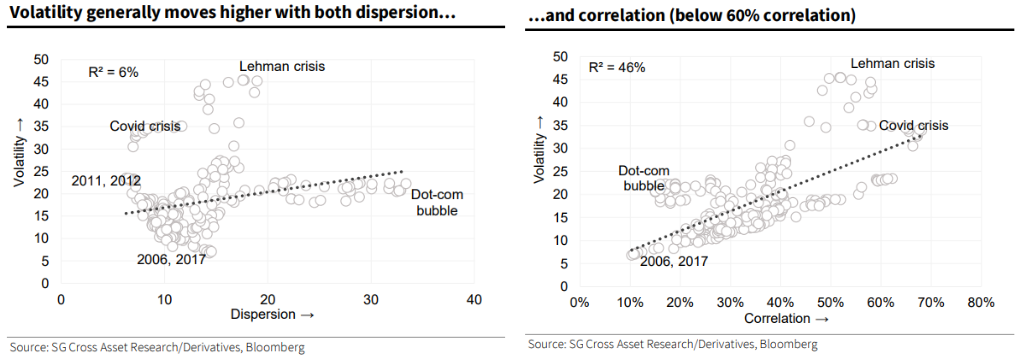
Graphic: Retrieved from Bloomberg. Via Societe Generale.

The reason why? 

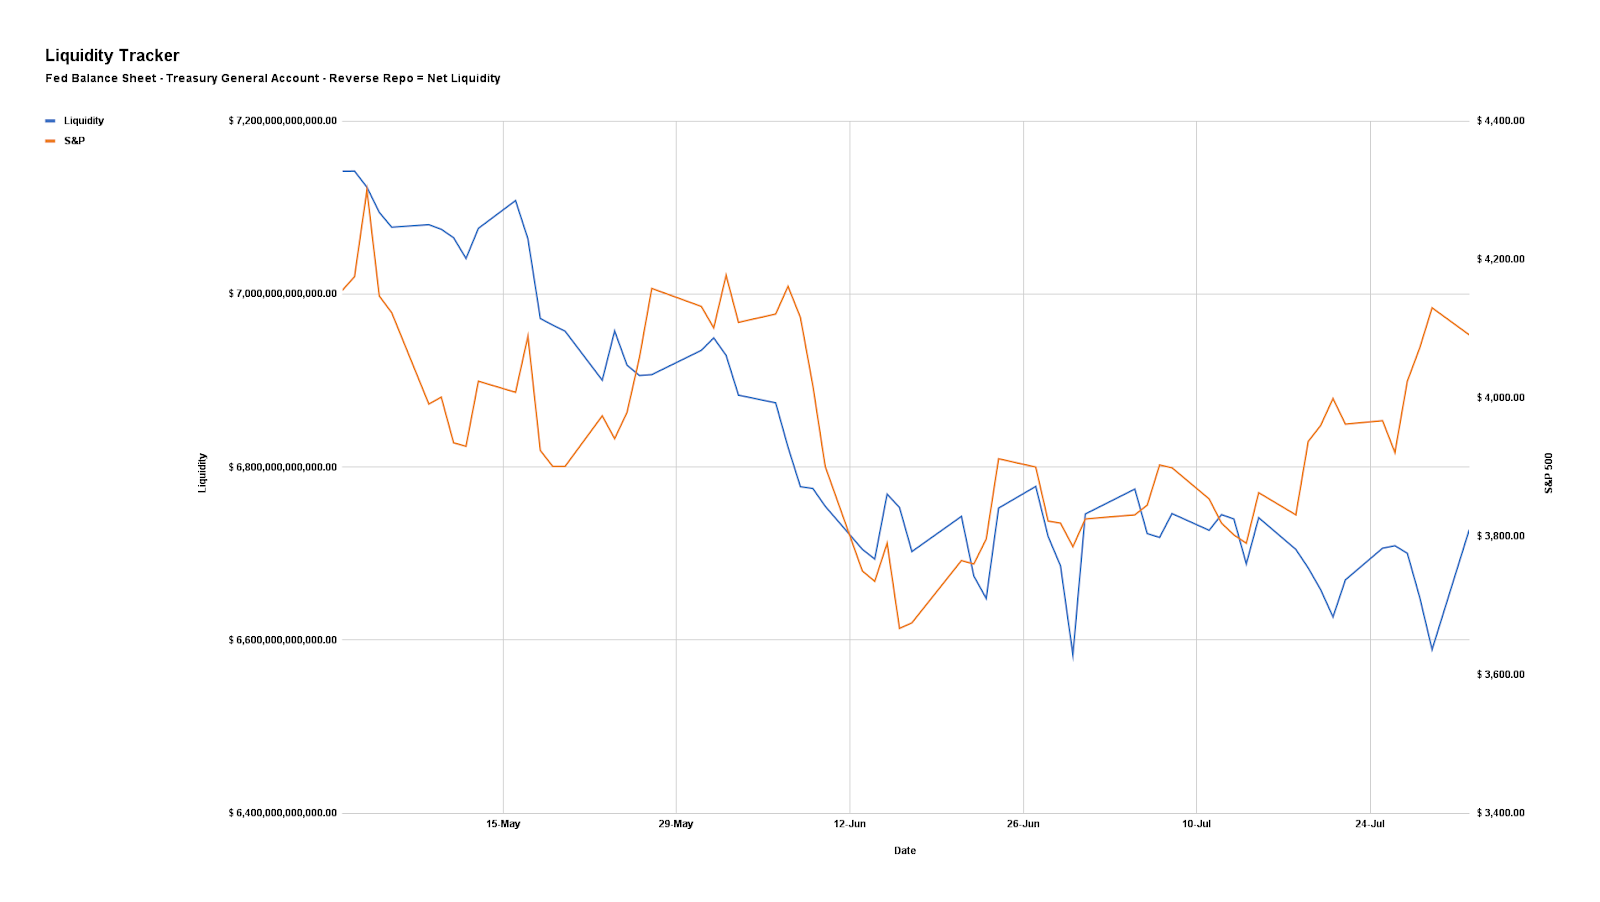
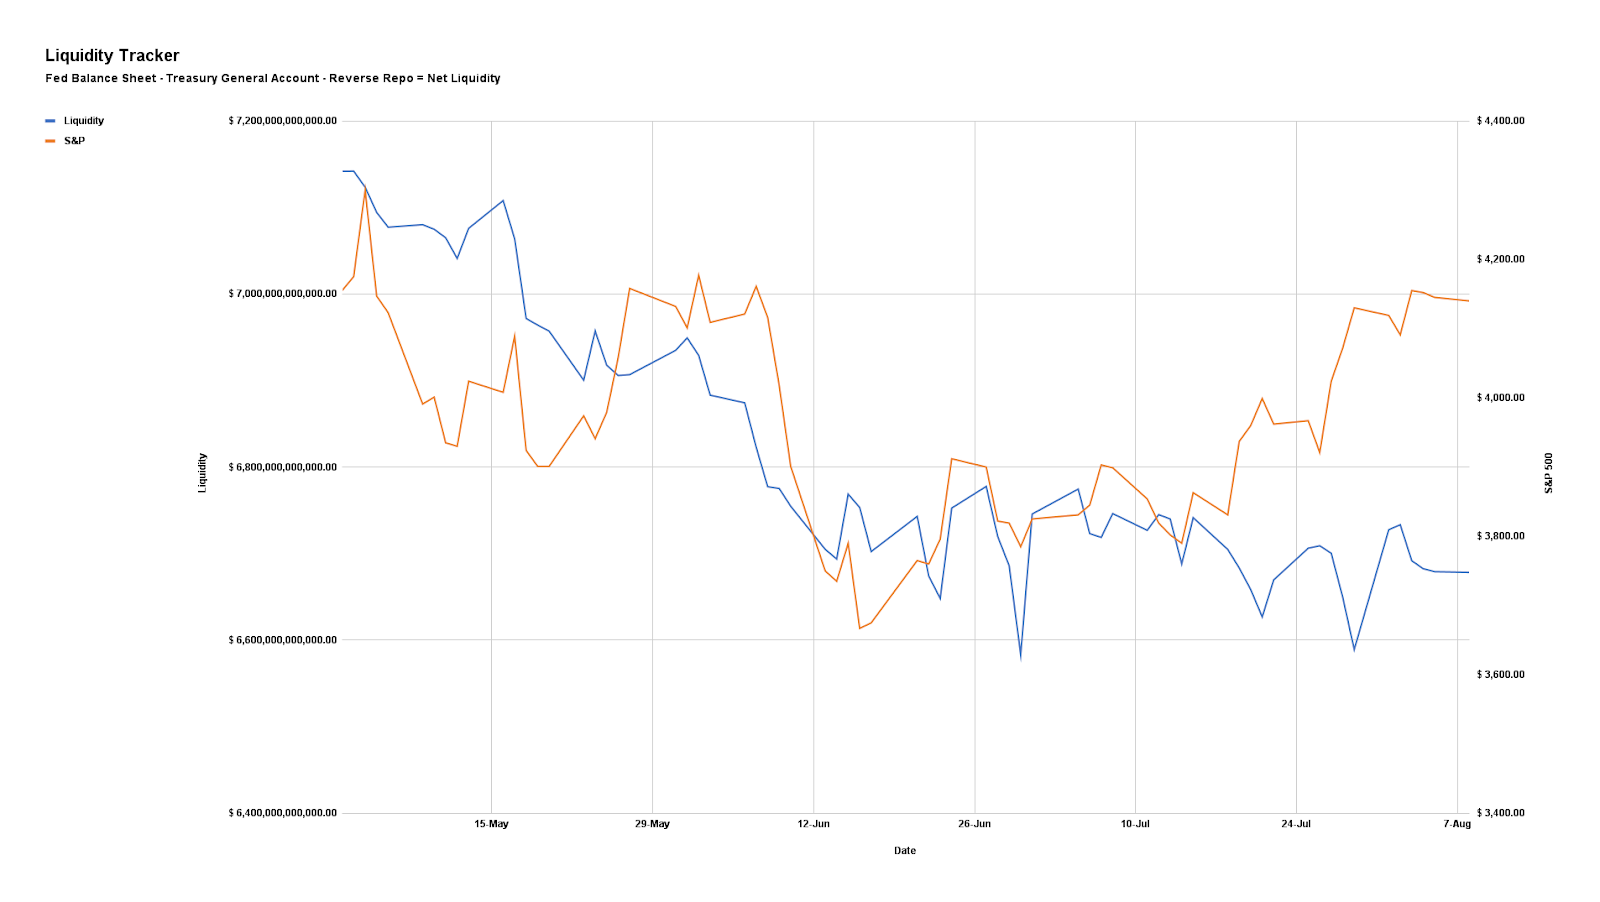
In regards to the correlation and dispersion remark, that’s more to do with the risk-off sentiment and the impact of tightening liquidity affecting all risk assets, basically.
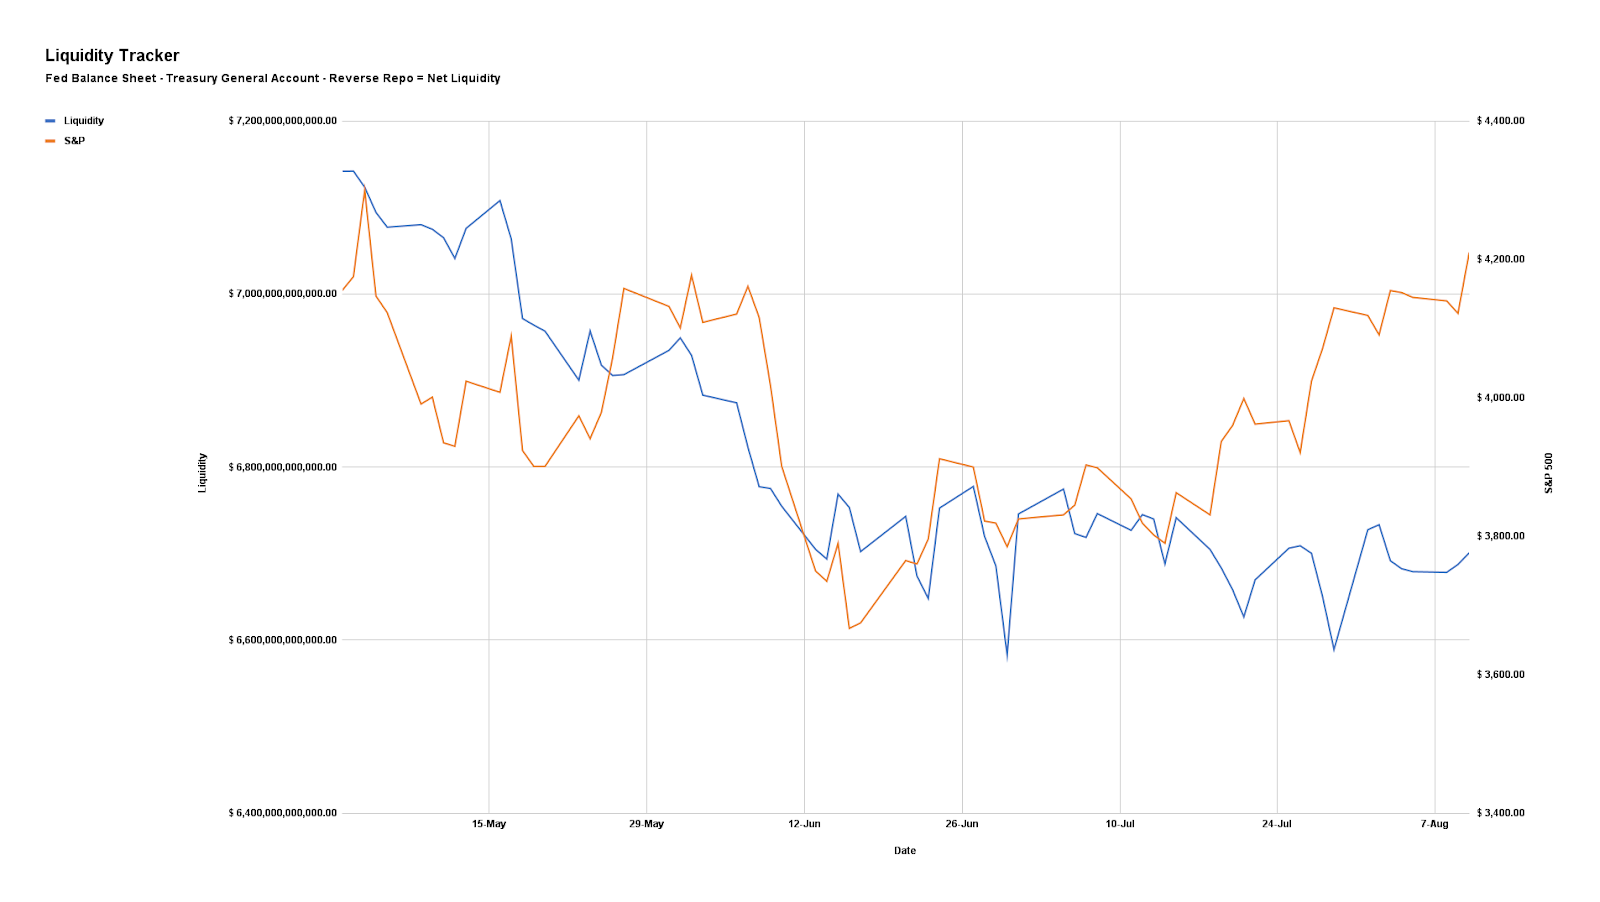
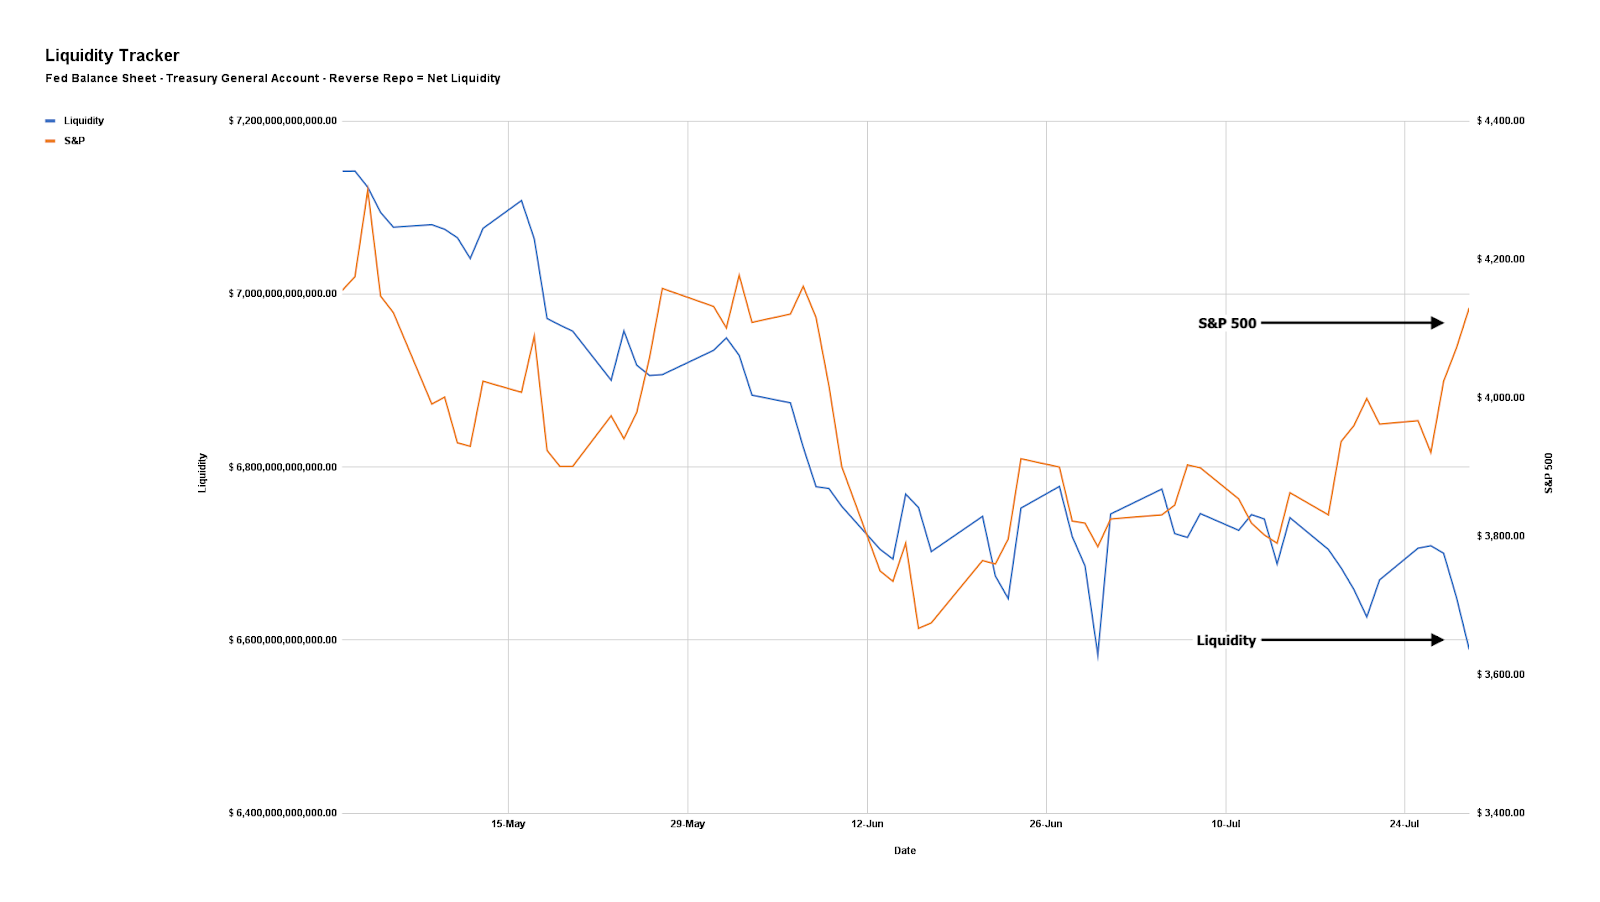
Graphic: Via Physik Invest. Data compiled by @jkonopas623. Fed Balance Sheet data, here. Treasury General Account Data, here. Reverse Repo data, here. NL = BS – TGA – RRP.

Regarding the volatility issue (RVOL, IVOL, and skew), that’s more to do with hedging trends. 

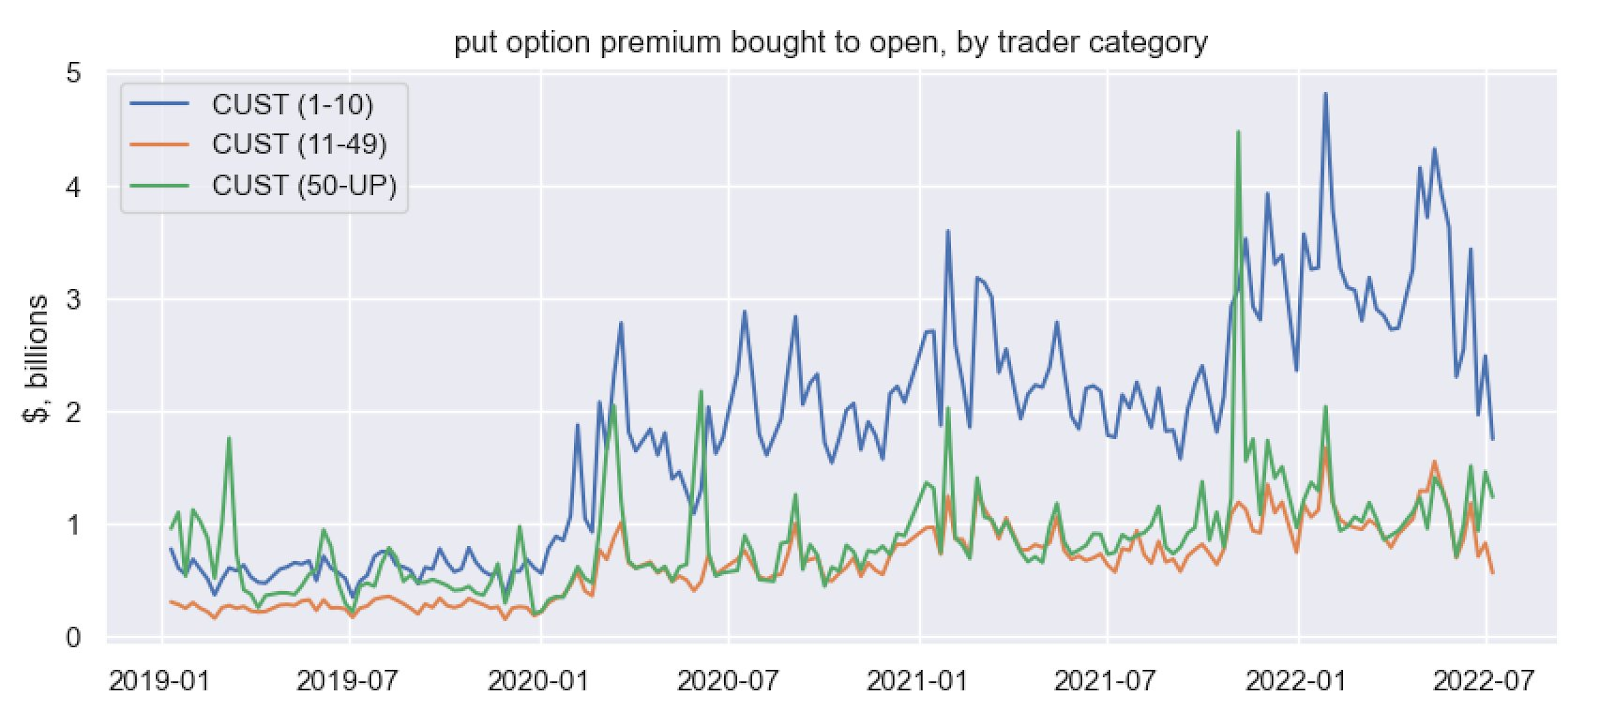
Essentially, the monetization and counterparty hedging of existing customer hedges, as well as the sale of short-dated volatility, particularly in some of the single names where there was “rich” volatility, into the fall, lent to lackluster performance in IVOL and index mean reversion.

Accordingly, “if commodities are not performing … as a hedge, that opens the door,” to markets falling and traders demand equity volatility hedges, per The Ambrus Group’s Kris Sidial.

Learn about options dealer flows, inflation, and investing in a changing world with Cem Karsan.
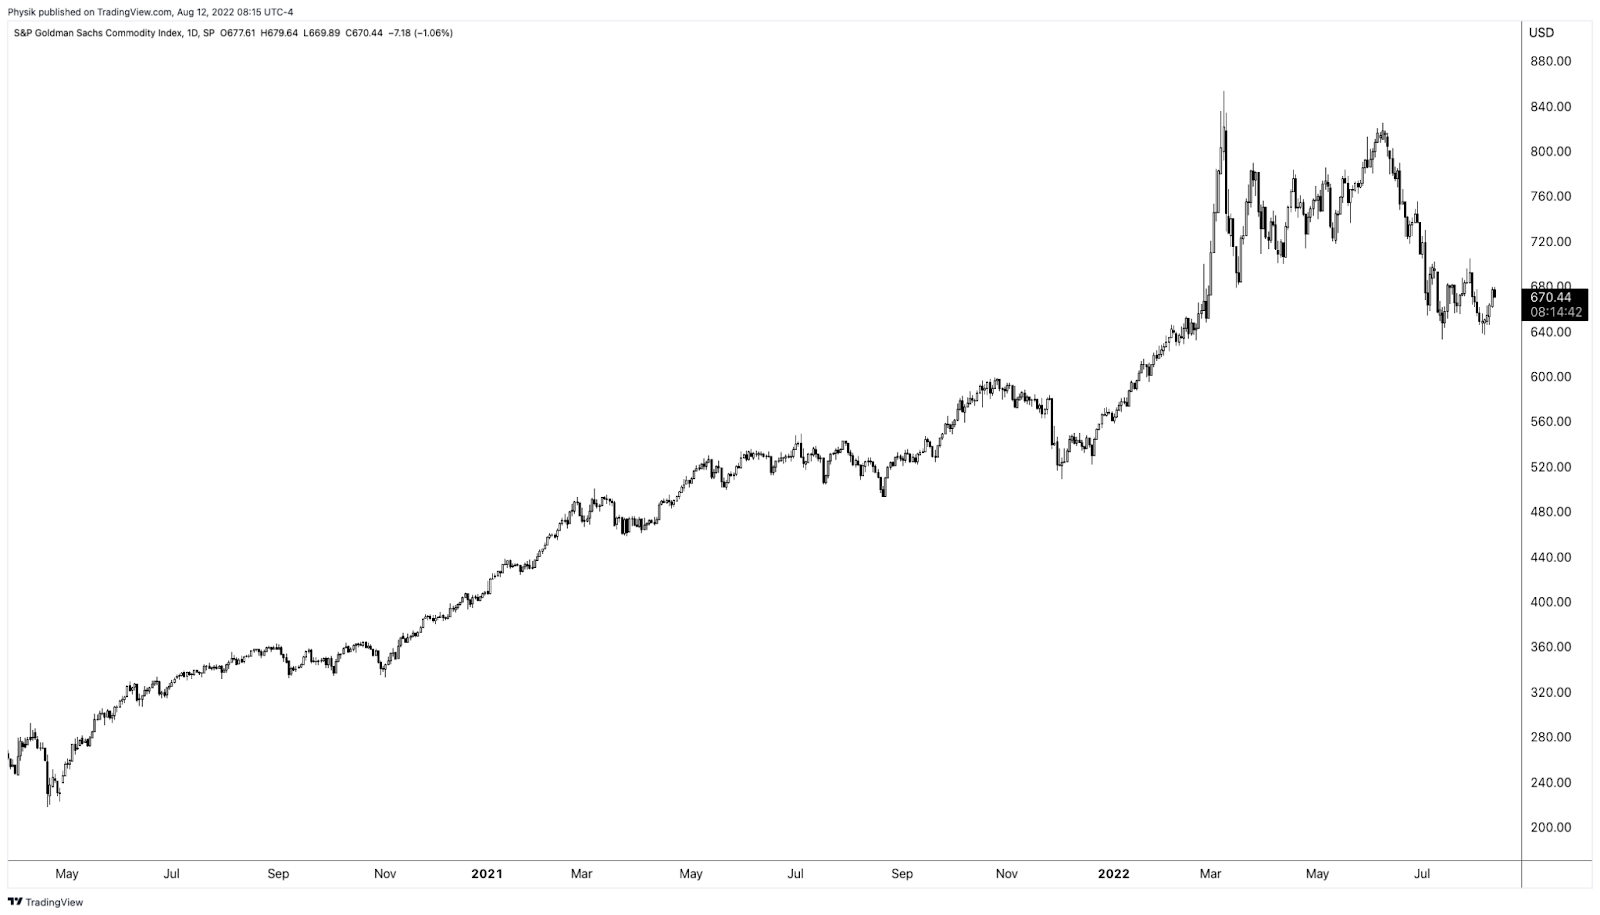
Graphic: Retrieved by Physik Invest from TradingView. S&P Goldman Sachs Commodity Index.

Adding, per to SpotGamma, “a lot of the boost from volatility compression has played out. With IVOL at a lower bound, it may be opportune to replace static Delta bets for those that are dynamic (i.e., long option exposures) and have less to lose in this lower volatility environment.”
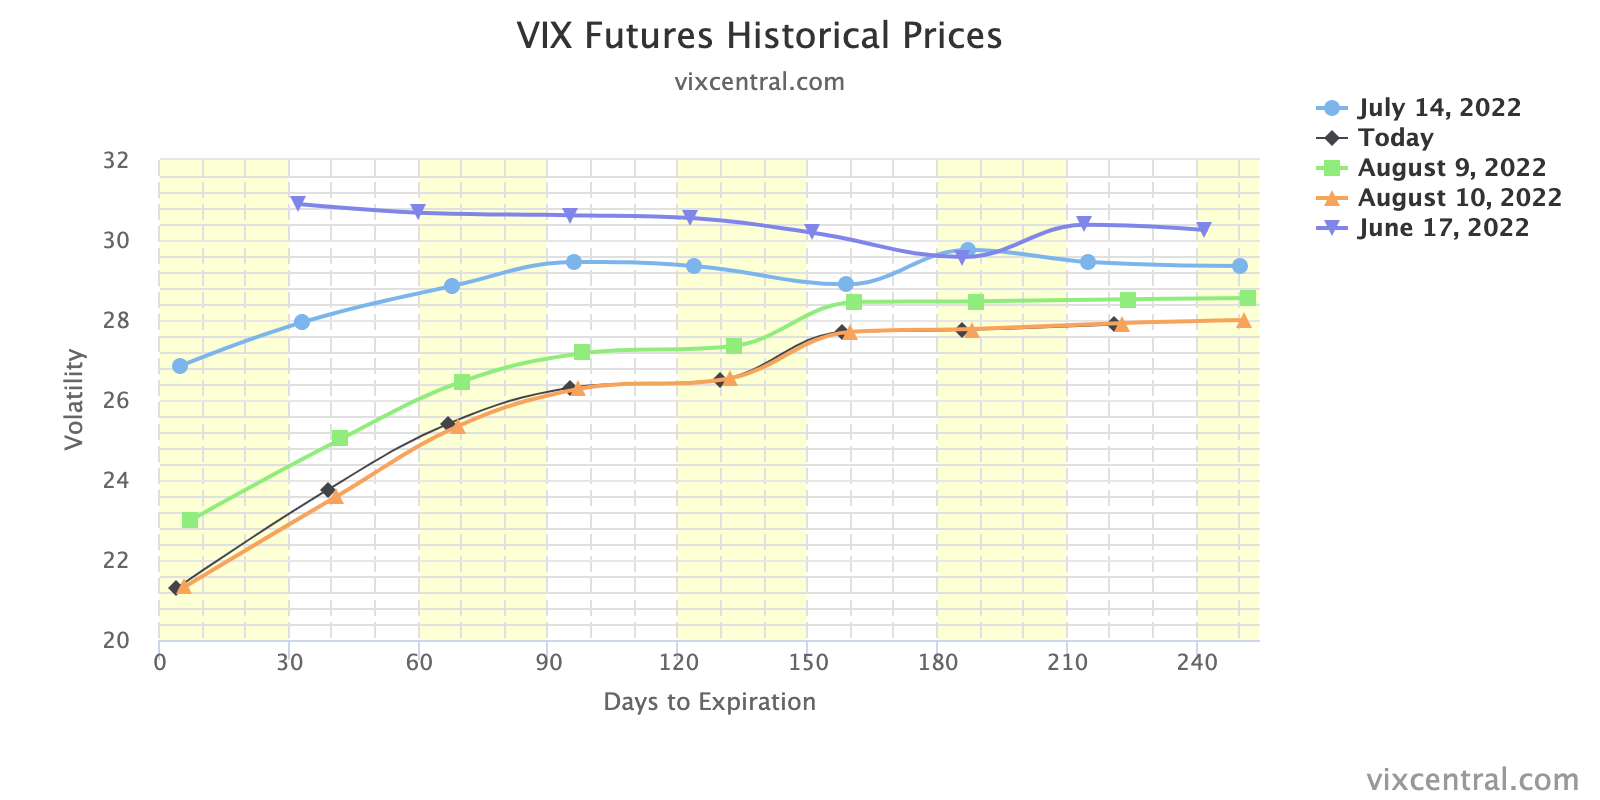
Graphic: Retrieved from Vix Central. The term structure of IVOL.

“In a case where market participants see the Fed keeping its commitment to aggressive monetary policy action, negative Delta options exposures may outperform static short equity (bets on the downside).”
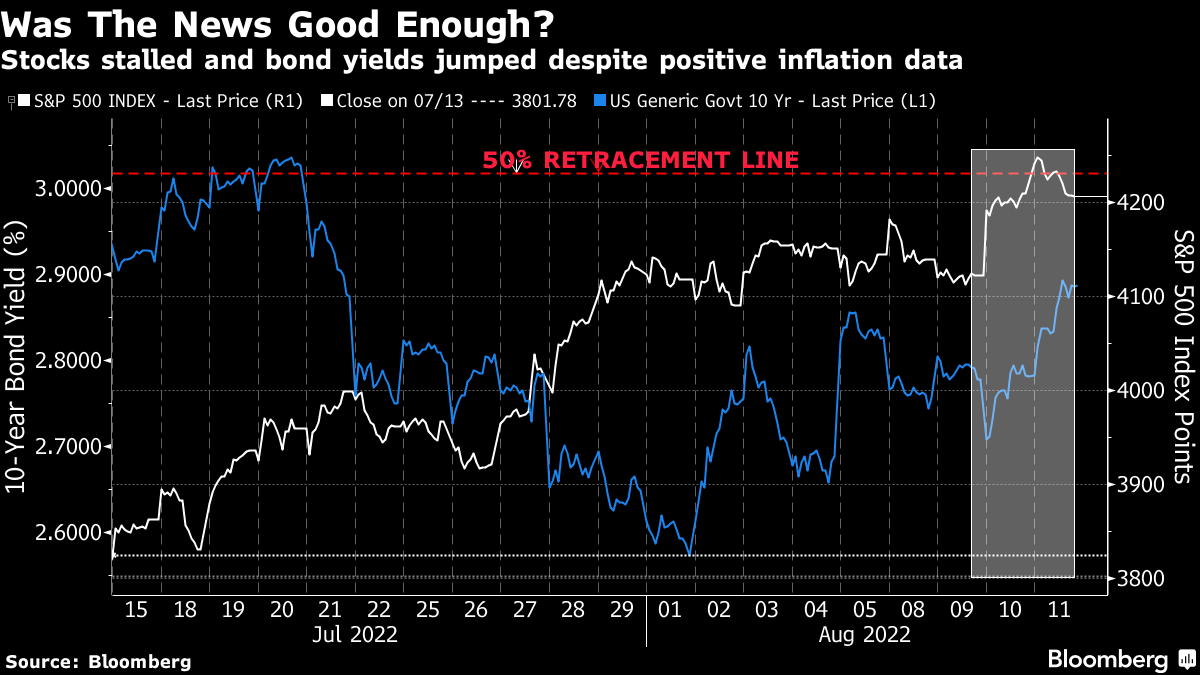
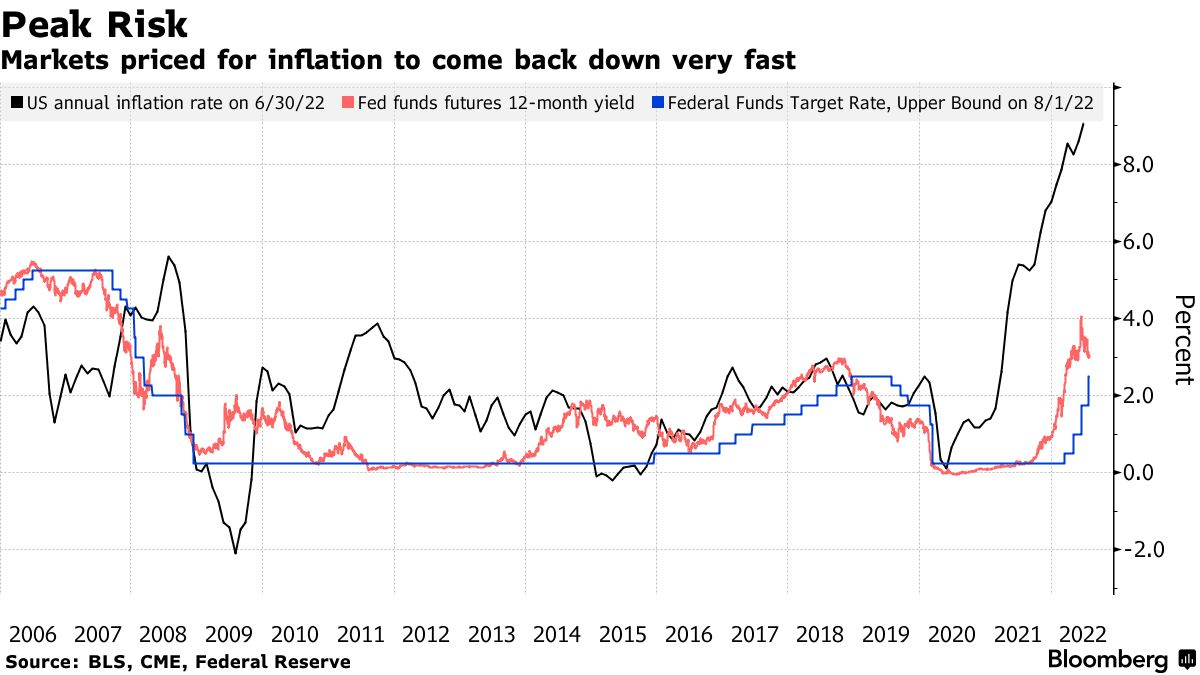
Graphic: Retrieved from Bloomberg. “Thursday’s message was that on mature reflection, the progress on the economy didn’t justify taking the stock market any higher than it was at the start of the day.”

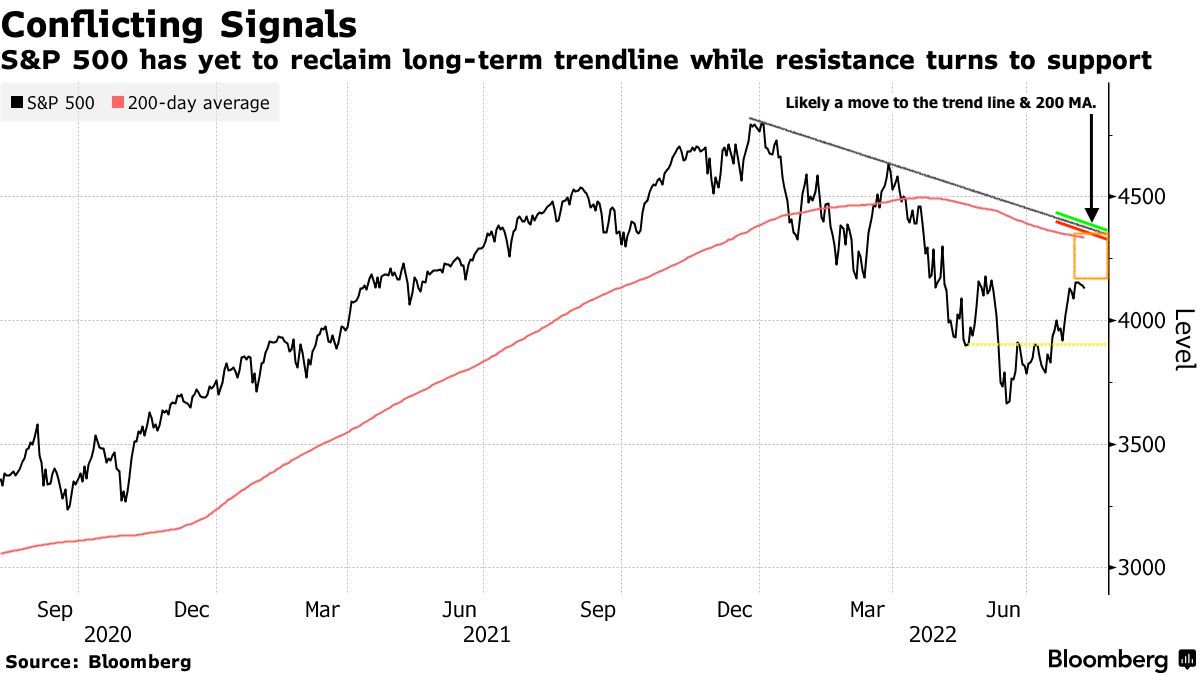
If bullish, sample structures to consider, given a smiley skew, include low- or zero-cost bullish call ratio spreads, against the trend resistances in products like the S&P 500 (INDEX: SPX).
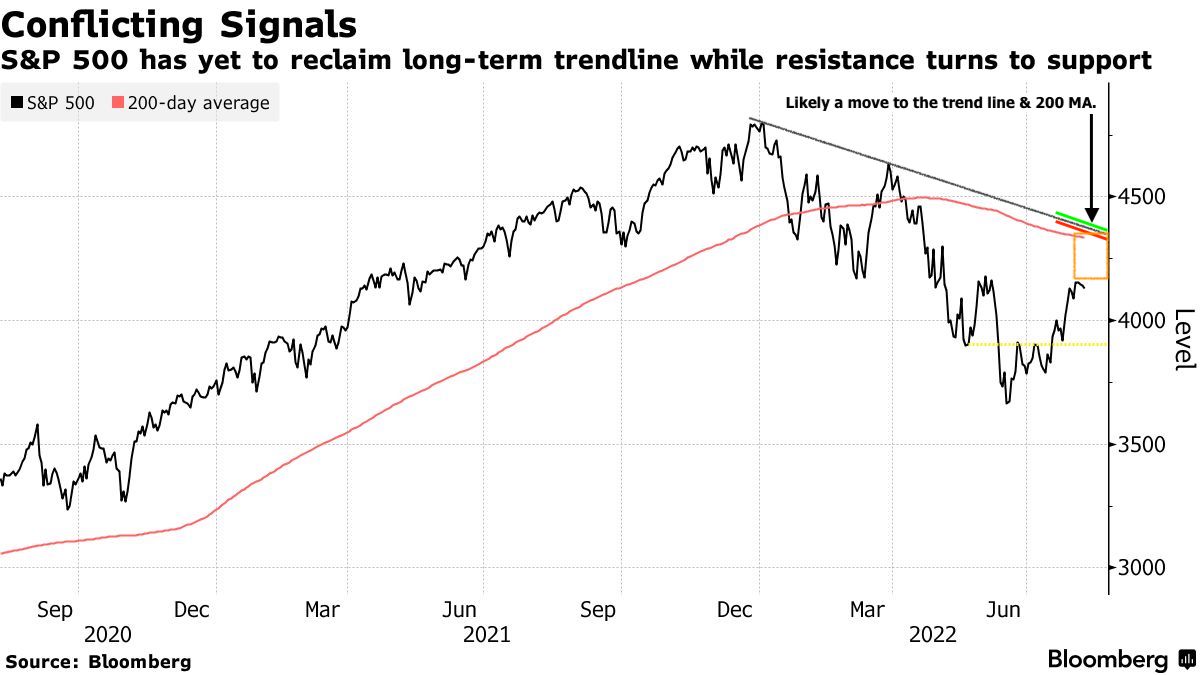
Graphic: Retrieved from Bloomberg. Drawn on by Physik Invest.

Technical

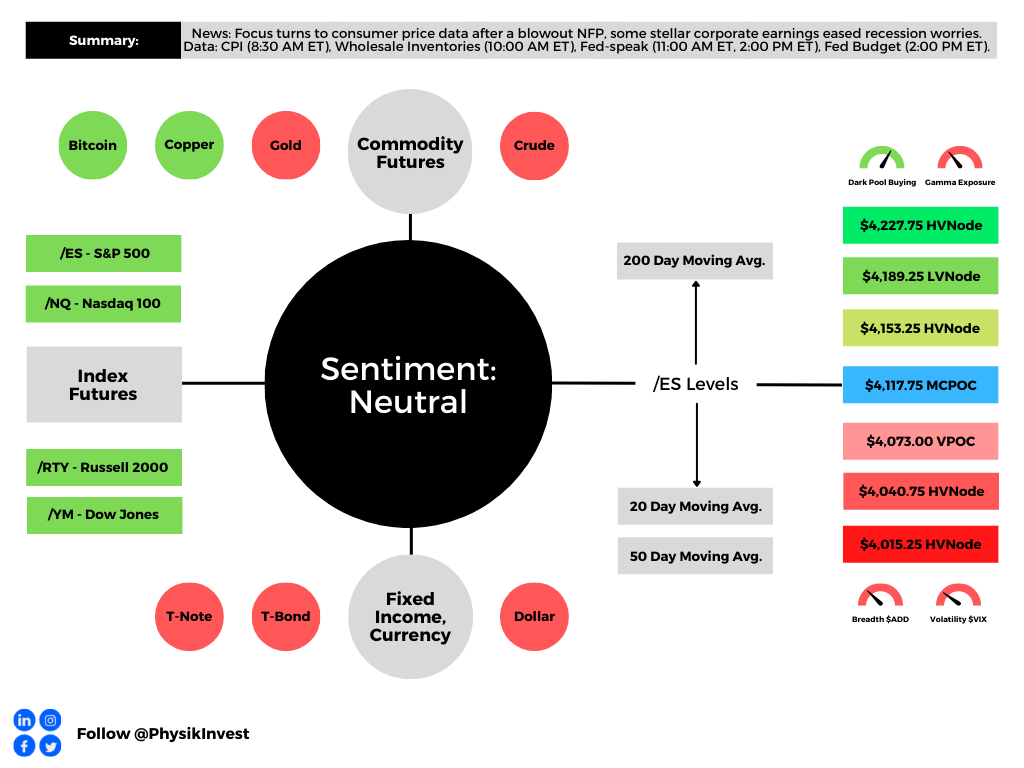
As of 7:00 AM ET, Friday’s regular session (9:30 AM – 4:00 PM ET), in the S&P 500, is likely to open in the middle part of a nearly balanced overnight inventory, inside of prior-range and -value, suggesting a limited potential for immediate directional opportunity.

In the best case, the S&P 500 trades higher.

Any activity above the $4,227.75 HVNode puts into play the $4,253.25 HVNode. Initiative trade beyond the latter could reach as high as the $4,275.75 LVNode and $4,303.00 Weak High, or higher.

In the worst case, the S&P 500 trades lower.

Any activity below the $4,227.75 HVNode puts into play the $4,202.75 RTH Low. Initiative trade beyond the RTH Low could reach as low as the $4,189.25 LVNode and $4,153.25 HVNode, or lower.

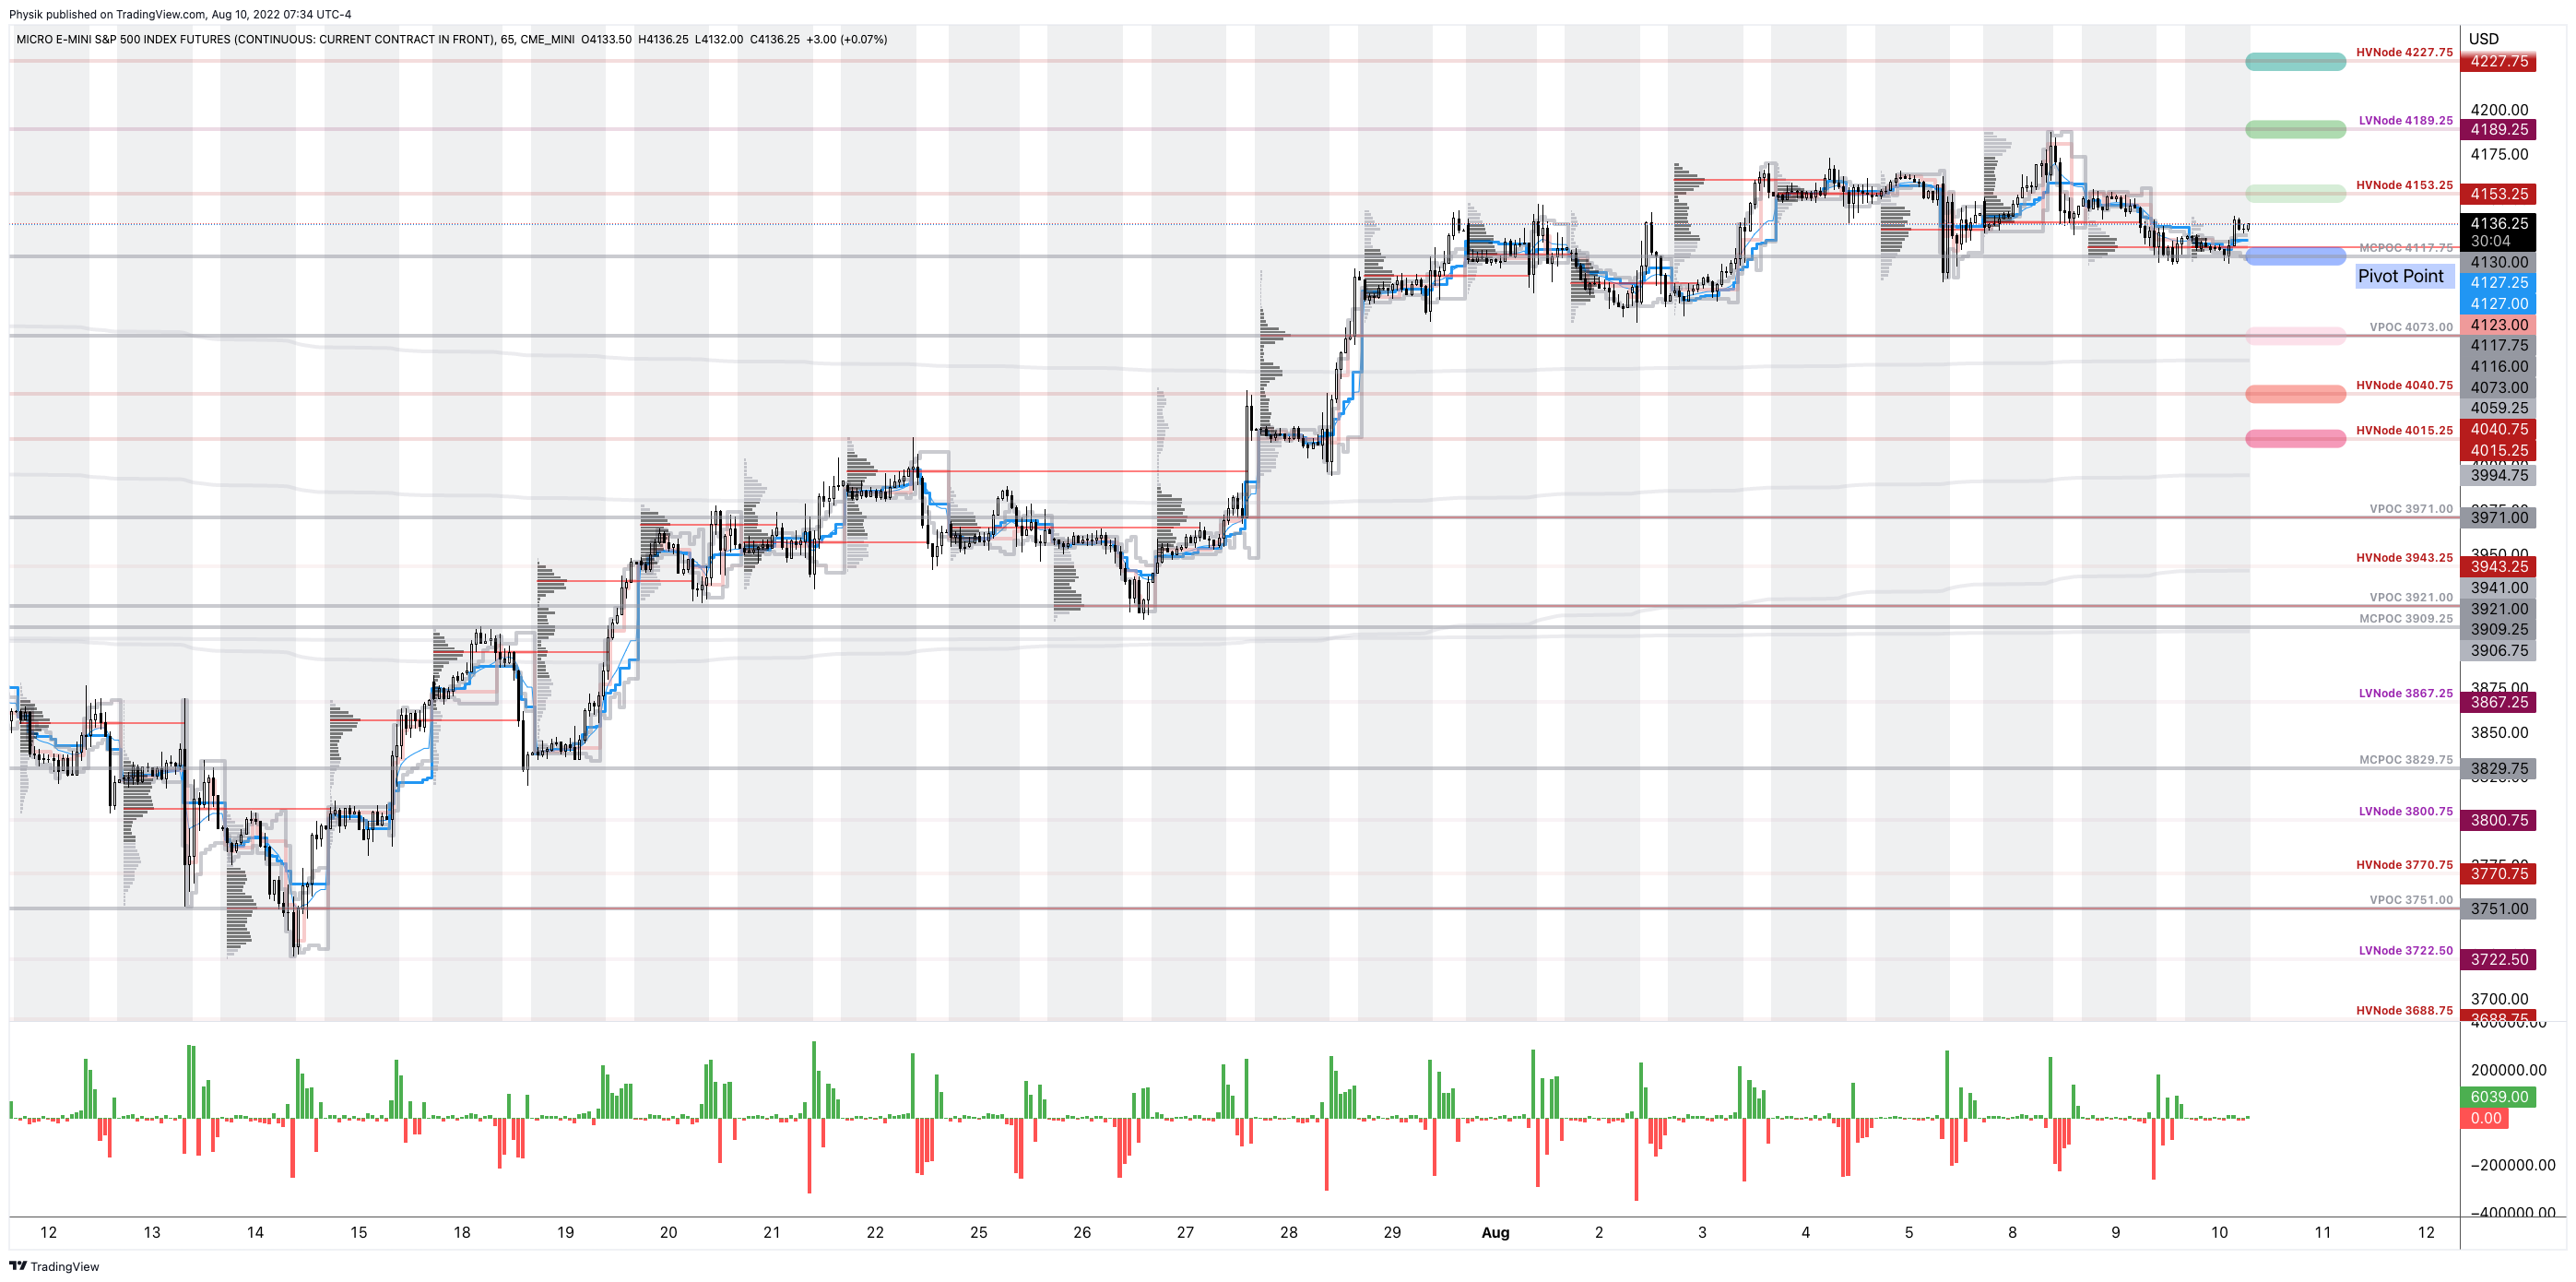
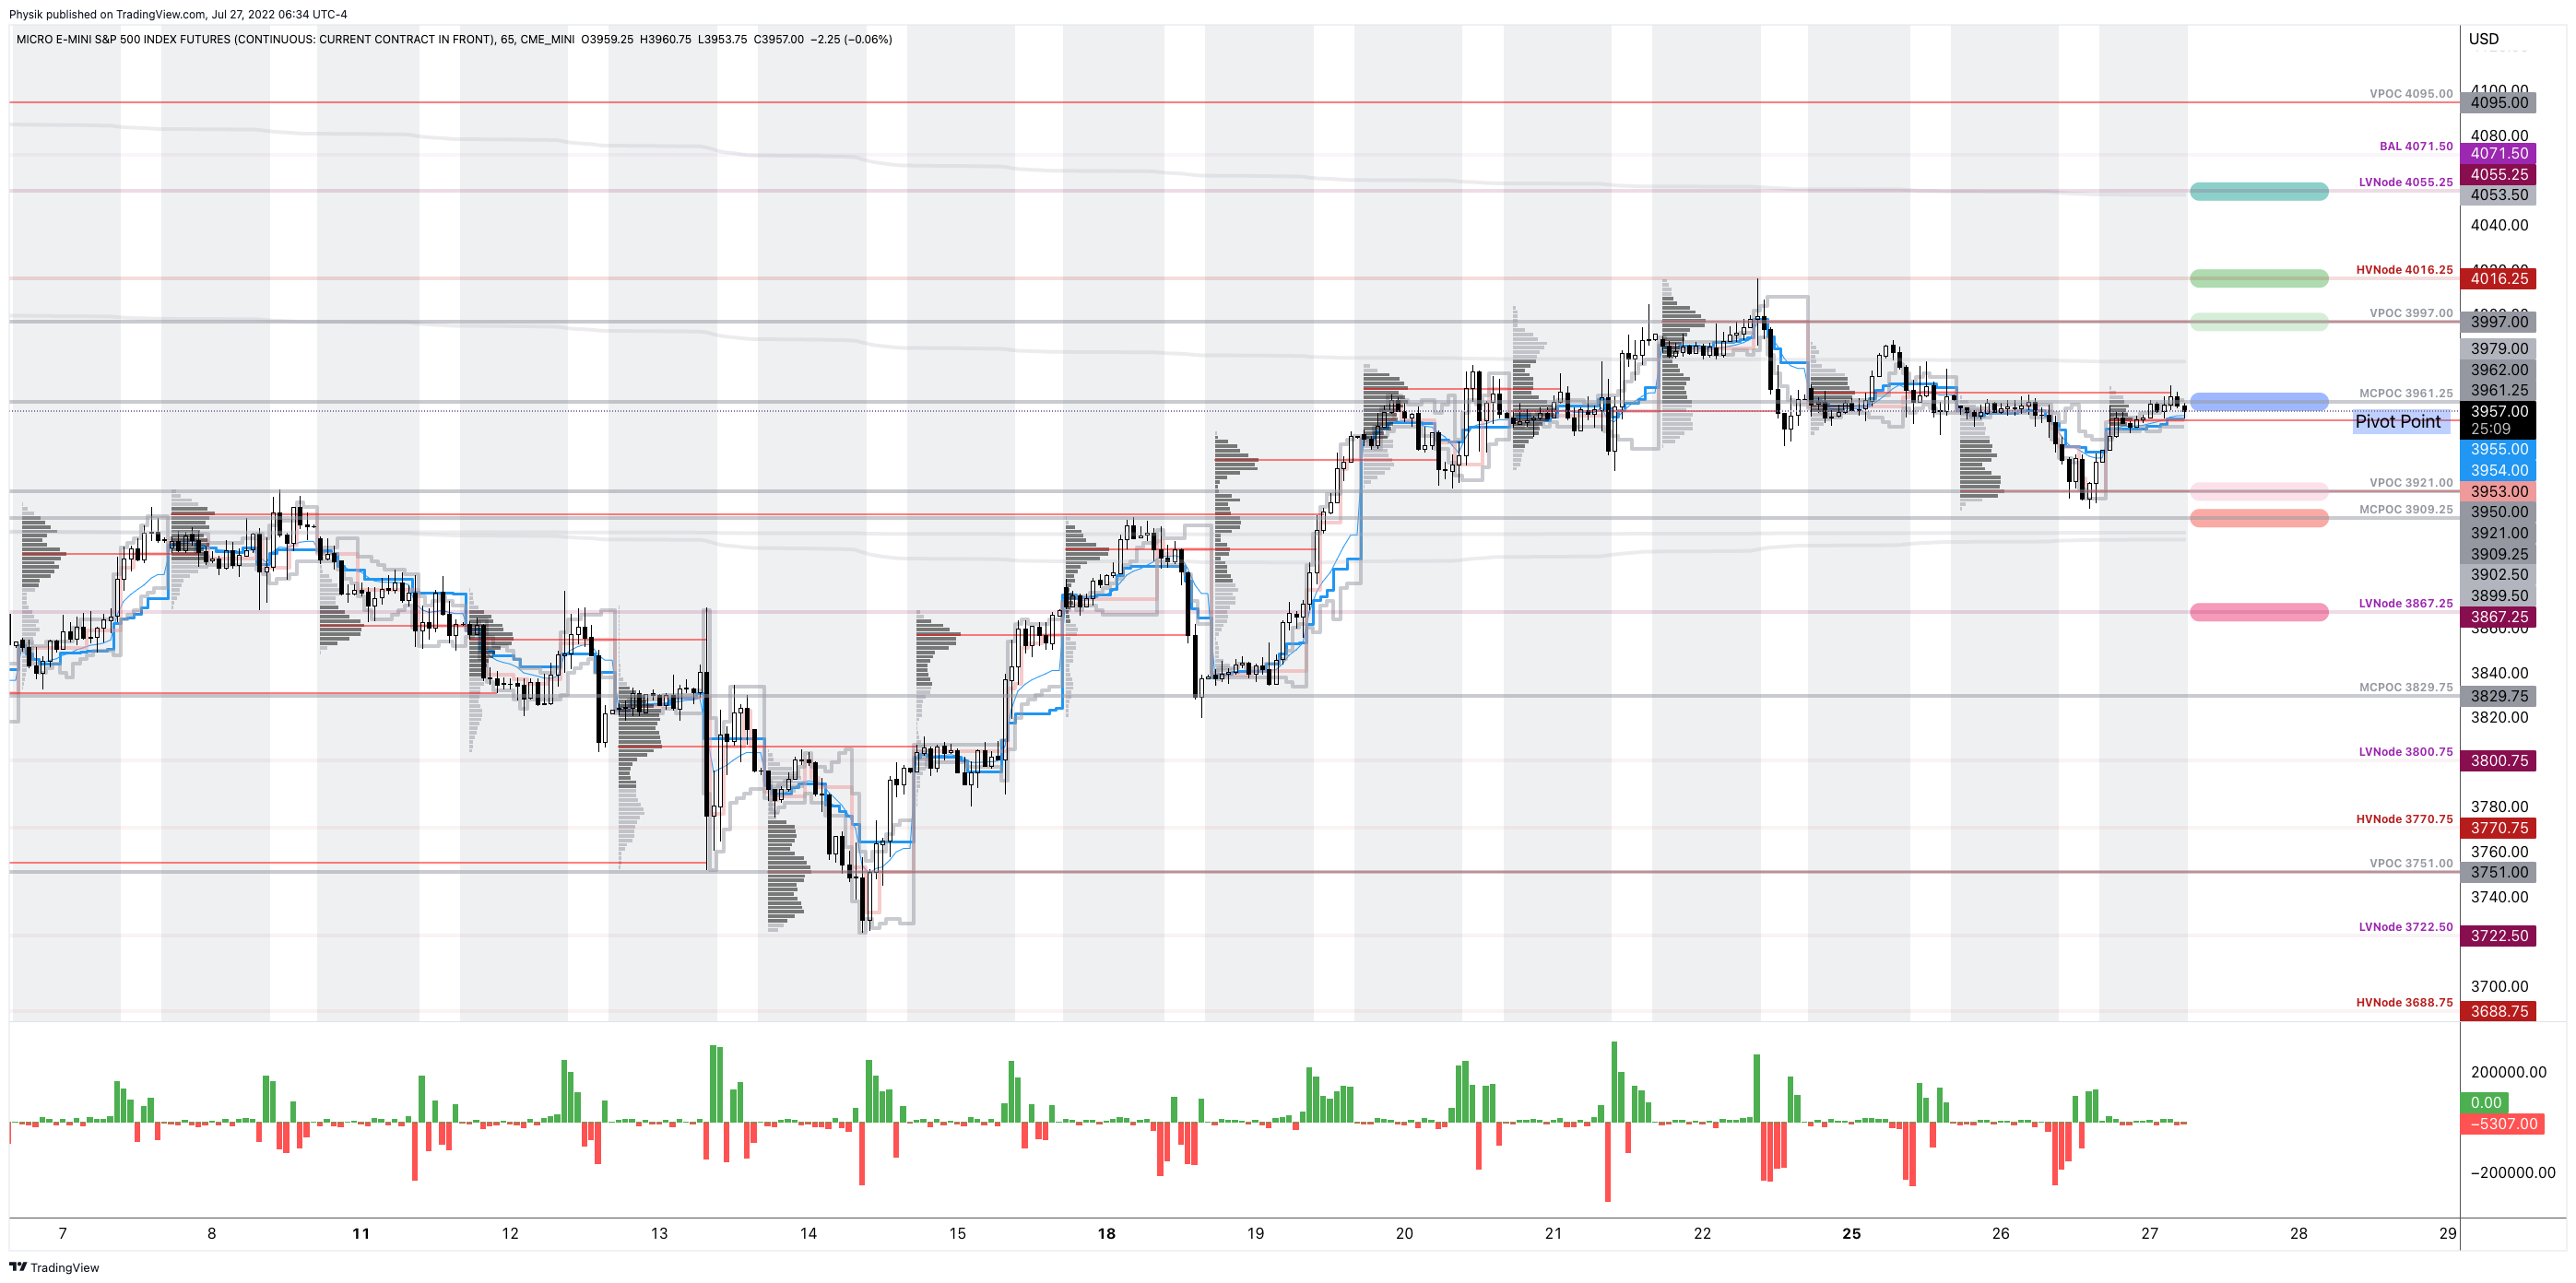
Click here to load today’s key levels into the web-based TradingView charting platform. Note that all levels are derived using the 65-minute timeframe. New links are produced, daily.
Graphic: 65-minute profile chart of the Micro E-mini S&P 500 Futures.

Definitions

Volume Areas: A structurally sound market will build on areas of high volume (HVNodes). Should the market trend for long periods of time, it will lack sound structure, identified as low volume areas (LVNodes). LVNodes denote directional conviction and ought to offer support on any test. 

If participants were to auction and find acceptance into areas of prior low volume (LVNodes), then future discovery ought to be volatile and quick as participants look to HVNodes for favorable entry or exit.

POCs: POCs are valuable as they denote areas where two-sided trade was most prevalent in a prior day session. Participants will respond to future tests of value as they offer favorable entry and exit.

MCPOCs: POCs are valuable as they denote areas where two-sided trade was most prevalent over numerous day sessions. Participants will respond to future tests of value as they offer favorable entry and exit.

Volume-Weighted Average Prices (VWAPs): A metric highly regarded by chief investment officers, among other participants, for quality of trade. Additionally, liquidity algorithms are benchmarked and programmed to buy and sell around VWAPs.

About

After years of self-education, strategy development, mentorship, and trial-and-error, Renato Leonard Capelj began trading full-time and founded Physik Invest to detail his methods, research, and performance in the markets.

Capelj also develops insights around impactful options market dynamics at SpotGamma and is a Benzinga reporter.

Some of his works include conversations with ARK Invest’s Catherine Wood, investors Kevin O’Leary and John Chambers, FTX’s Sam Bankman-Fried, ex-Bridgewater Associate Andy Constan, Kai Volatility’s Cem Karsan, The Ambrus Group’s Kris Sidial, among many others.

Disclaimer

In no way should the materials herein be construed as advice. Derivatives carry a substantial risk of loss. All content is for informational purposes only.

Categories
Commentary

Daily Brief For August 10, 2022

The daily brief is a free glimpse into the prevailing fundamental and technical drivers of U.S. equity market products. Join the 750+ that read this report daily, below!

Graphic updated 7:40 AM ET. Sentiment Neutral if expected /ES open is inside of the prior day’s range. /ES levels are derived from the profile graphic at the bottom of the following section. Levels may have changed since initially quoted; click here for the latest levels. SqueezeMetrics Dark Pool Index (DIX) and Gamma (GEX) calculations are based on where the prior day’s reading falls with respect to the MAX and MIN of all occurrences available. A higher DIX is bullish. At the same time, the lower the GEX, the more (expected) volatility. Learn the implications of volatility, direction, and moneyness. Breadth reflects a reading of the prior day’s NYSE Advance/Decline indicator. VIX reflects a current reading of the CBOE Volatility Index (INDEX: VIX) from 0-100.

Fundamental

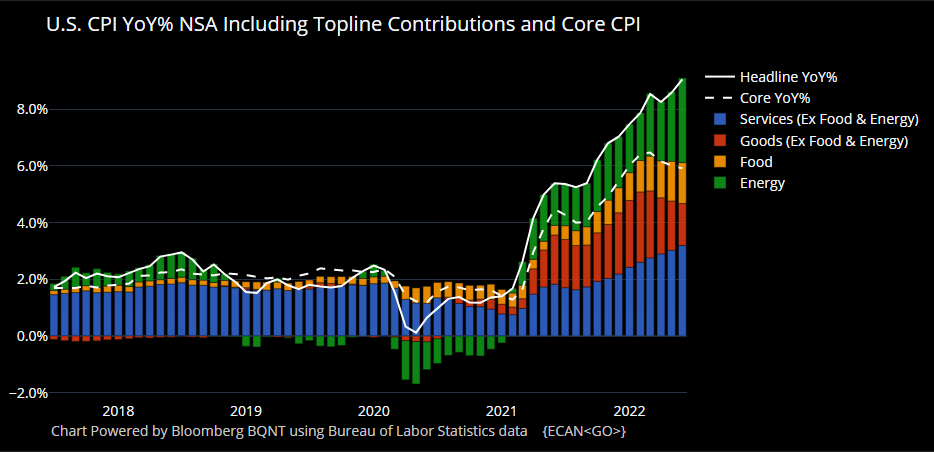
Wednesday’s inflation figures – the CPI (Consumer Price Index) – will help drive perceptions regarding future Fed activity.

Expected is an 8.7% rise year-over-year (YoY) and 0.2% month-over-month (MoM). In June, these numbers were 9.1% and 1.3%, respectively. 

Core CPI (which excludes food and energy) is expected to rise by a rate higher than in June, 6.1% YoY and 0.5% MoM, respectively.

Mattering most is core inflation, which the Fed has more control over. If lower than expected, that may warrant some appetite for risk.

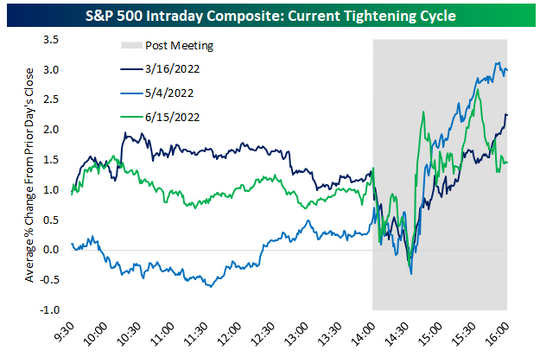
Over the last 6 months, immediately after the release of CPI data, the average movement in the S&P 500 was -1.27%.

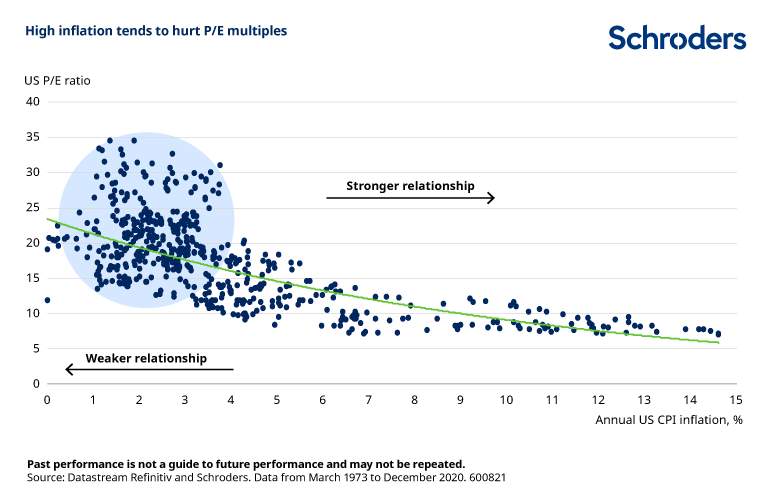
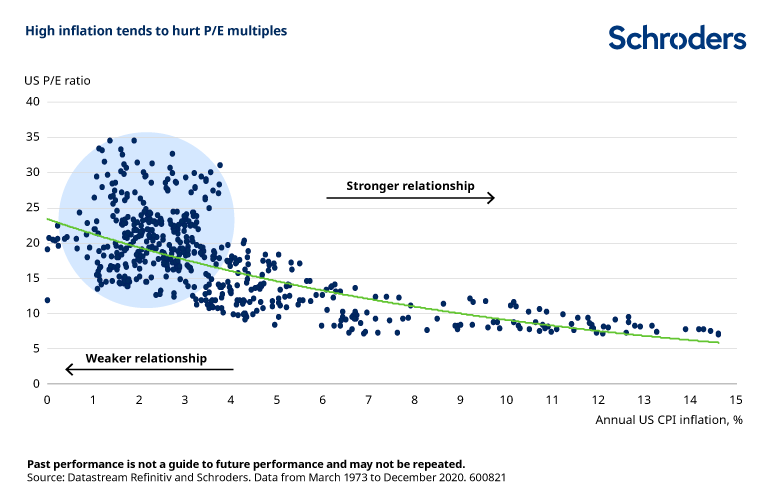
Moreover, businesses with promising futures often command a price high above their level of earnings (P/E). However, with inflation, prices in the economy rise, resulting in investors requiring better rates of return to maintain their purchasing power, per Investopedia.

Accordingly, if investors demand a higher rate of return, the P/E has to fall. That’s because you are “paying less for more earnings and, as earnings grow, the return you achieve is higher.”

Graphic: Retrieved from the Weekly S&P 500 ChartStorm. Via Schroders Plc (OTC: SHNWF).

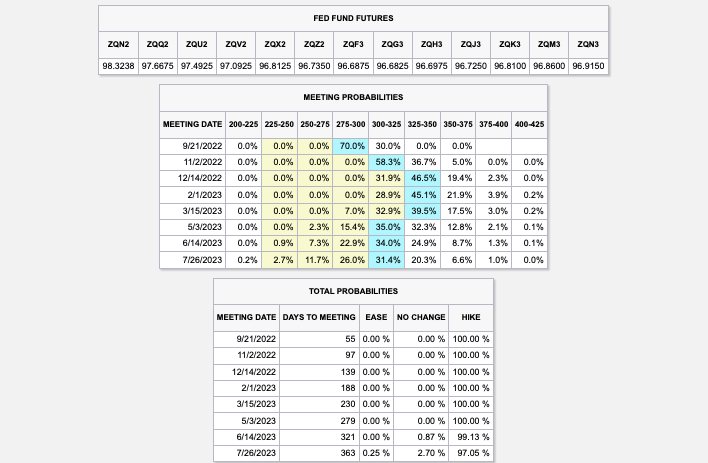
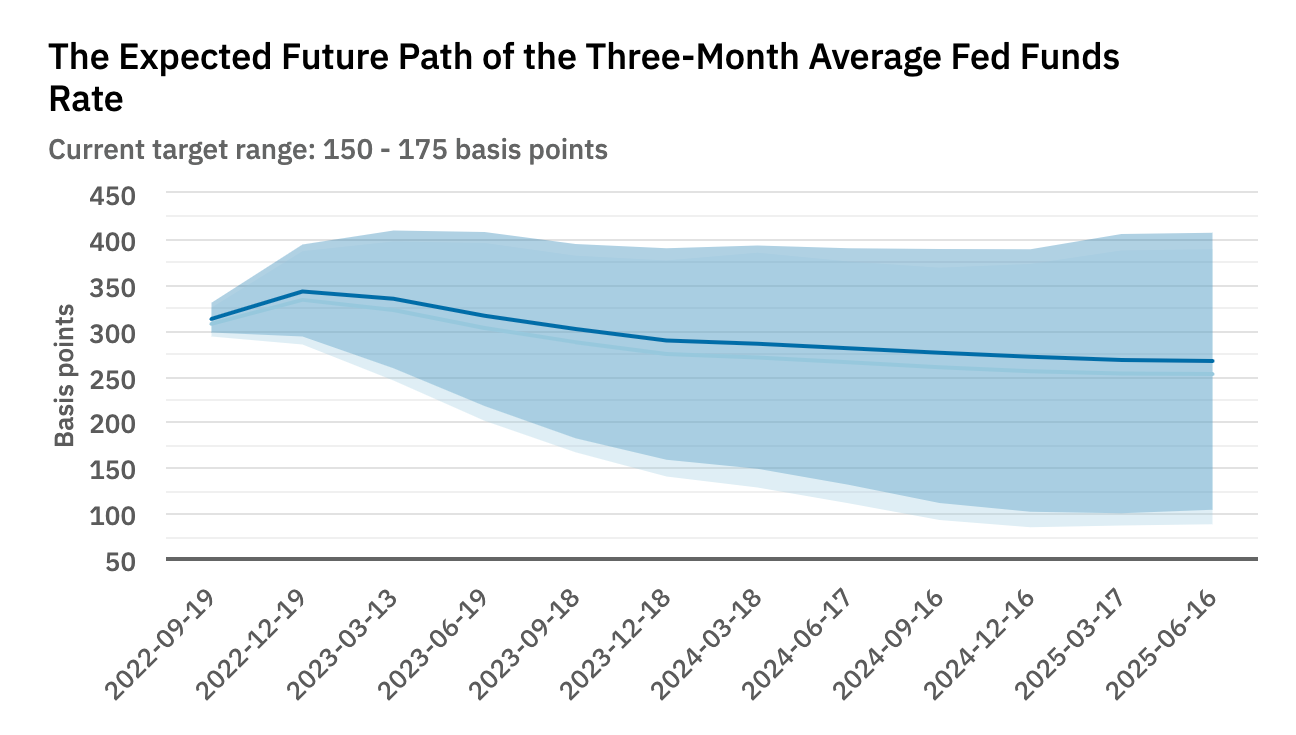
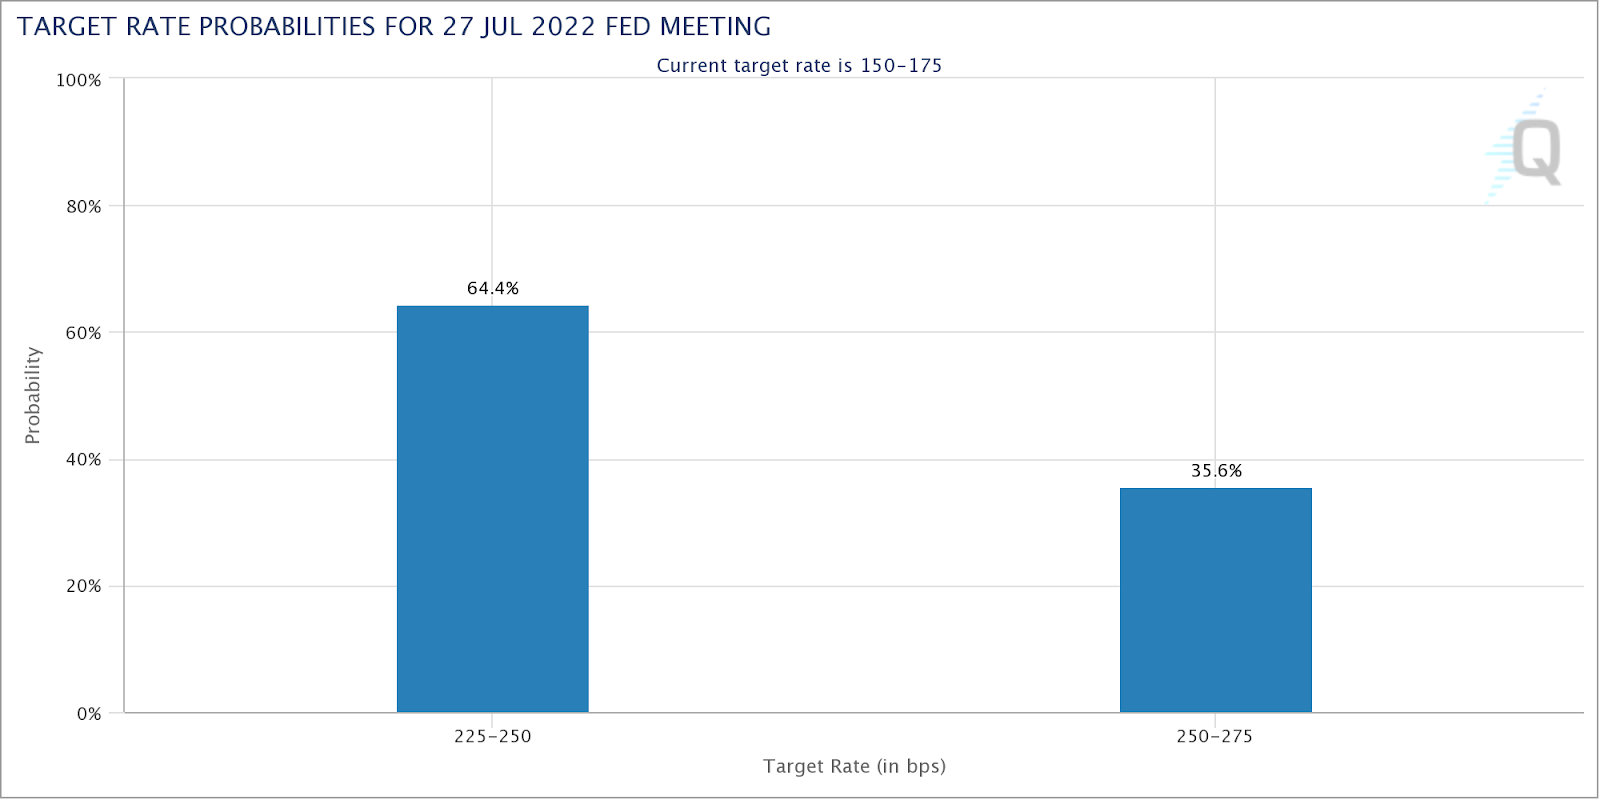
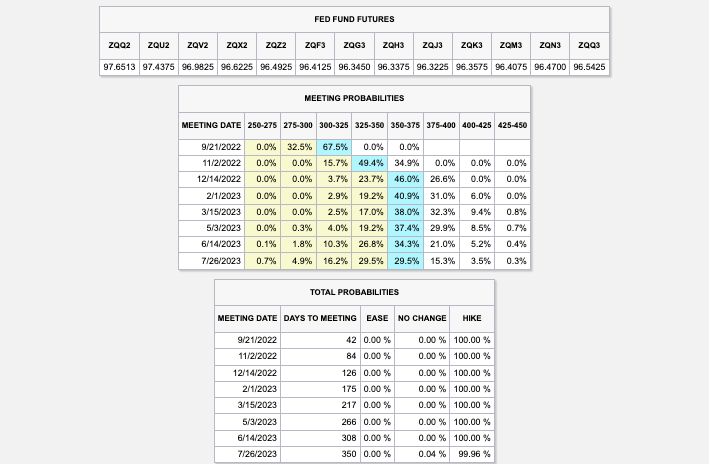
In response to much hotter inflation participants may make significant changes in their forecasts for action by the Federal Reserve (Fed). 

Graphic: Retrieved from CME Group Inc’s (NASDAQ: CME) FedWatch Tool.

To explain, to stem inflation, the Fed reversed its easy monetary policies and is both raising rates and engaging in quantitative tightening (QT), which amplifies the effects of the former and is the opposite of quantitative easing (QE), “widely seen as the preeminent driver of markets during the post-crisis decade.”

Those stocks commanding some of the highest prices in anticipation of future growth are (and will) be impacted the most as their discounted cash flows and ability to finance growth reduce.

Though “rates take up most attention,” what’s more important are “the decisions the Fed — and other central banks — have to make about bringing their balance sheets down,” per Bloomberg.

Graphic: Via Physik Invest. Data compiled by @jkonopas623. Fed Balance Sheet data, here. Treasury General Account Data, here. Reverse Repo data, here. NL = BS – TGA – RRP.

Positioning

As of 7:15 AM ET, Wednesday’s expected volatility, via the Cboe Volatility Index (INDEX: VIX), sits at ~1.17%. Net gamma exposures decreasing may promote larger trading ranges.

Adding, volatility is at a low point and the “flattening in the downside fixed strike skew” seems to have played its course.

As SpotGamma explains, “given that implied volatility is at a low point, if participants’ fears with respect to [CPI] are assuaged, volatility compression would likely do less to bolster equity market upside than when the VIX was at a higher starting point (e.g., 30).”

On the other hand, “the marginal impact of increased demand for options strikes down below, further out in time, is likely to do a lot to add to underlying market pressures.”

So, per Kai Volatility’s Cem Karsan, though the first market moves after CPI may be a “function of inevitable rebalancing of dealer inventory post-event,” if the “final resolution is lower,” per  “the incremental effects” of liquidity (i.e., QE and QT), then options could outperform their delta (i.e., exposure to direction), not like what happened over the past half-year, as said August 5.

Sample structures to consider include low- or zero-cost bullish call ratio spreads to the upside, against the trend resistances in products like the S&P 500 (INDEX: SPX).

Graphic: Retrieved from Bloomberg. Drawn on by Physik Invest.

Technical

As of 7:30 AM ET, Wednesday’s regular session (9:30 AM – 4:00 PM ET), in the S&P 500, is likely to open in the upper part of a balanced overnight inventory, inside of prior-range and -value, suggesting a limited potential for immediate directional opportunity, all else equal.

In the best case, the S&P 500 trades higher.

Any activity above the $4,117.75 MCPOC puts into play the $4,153.25 HVNode. Initiative trade beyond the HVNode could reach as high as the $4,189.25 LVNode and $4,227.75 HVNode, or higher.

In the worst case, the S&P 500 trades lower.

Any activity below the $4,117.75 MCPOC puts into play the $4,073.00 VPOC. Initiative trade beyond the VPOC could reach as low as the $4,040.75 and $4,015.25 HVNodes, or lower.

Click here to load today’s key levels into the web-based TradingView charting platform. Note that all levels are derived using the 65-minute timeframe. New links are produced, daily.
Graphic: 65-minute profile chart of the Micro E-mini S&P 500 Futures.

Definitions

Volume Areas: A structurally sound market will build on areas of high volume (HVNodes). Should the market trend for long periods of time, it will lack sound structure, identified as low volume areas (LVNodes). LVNodes denote directional conviction and ought to offer support on any test. 

If participants were to auction and find acceptance into areas of prior low volume (LVNodes), then future discovery ought to be volatile and quick as participants look to HVNodes for favorable entry or exit.

POCs: POCs are valuable as they denote areas where two-sided trade was most prevalent in a prior day session. Participants will respond to future tests of value as they offer favorable entry and exit.

MCPOCs: POCs are valuable as they denote areas where two-sided trade was most prevalent over numerous day sessions. Participants will respond to future tests of value as they offer favorable entry and exit.

Volume-Weighted Average Prices (VWAPs): A metric highly regarded by chief investment officers, among other participants, for quality of trade. Additionally, liquidity algorithms are benchmarked and programmed to buy and sell around VWAPs.

About

After years of self-education, strategy development, mentorship, and trial-and-error, Renato Leonard Capelj began trading full-time and founded Physik Invest to detail his methods, research, and performance in the markets.

Capelj also develops insights around impactful options market dynamics at SpotGamma and is a Benzinga reporter.

Some of his works include conversations with ARK Invest’s Catherine Wood, investors Kevin O’Leary and John Chambers, FTX’s Sam Bankman-Fried, ex-Bridgewater Associate Andy Constan, Kai Volatility’s Cem Karsan, The Ambrus Group’s Kris Sidial, among many others.

Disclaimer

In no way should the materials herein be construed as advice. Derivatives carry a substantial risk of loss. All content is for informational purposes only.

Categories
Commentary

Daily Brief For August 3, 2022

The daily brief is a free glimpse into the prevailing fundamental and technical drivers of U.S. equity market products. Join the 700+ that read this report daily, below!

Graphic updated 9:15 AM ET. Sentiment Neutral if expected /ES open is inside of the prior day’s range. /ES levels are derived from the profile graphic at the bottom of the following section. Levels may have changed since initially quoted; click here for the latest levels. SqueezeMetrics Dark Pool Index (DIX) and Gamma (GEX) calculations are based on where the prior day’s reading falls with respect to the MAX and MIN of all occurrences available. A higher DIX is bullish. At the same time, the lower the GEX, the more (expected) volatility. Learn the implications of volatility, direction, and moneyness. Breadth reflects a reading of the prior day’s NYSE Advance/Decline indicator. VIX reflects a current reading of the CBOE Volatility Index (INDEX: VIX) from 0-100.

Fundamental

Our August 1 letter assessed, mainly, the impacts of a burgeoning economic war that is hot as well put by a recent note authored by Credit Suisse Group AG’s (NYSE: CS) Zoltan Pozsar.

Read: Dr. Pippa Malmgren’s “A Hot War In Cold Places,” which was quoted by Credit Suisse’s Pozsar. Additionally, check out our archives for more analysis of Malmgren’s perspectives.

“Great powers are waging hot wars involving the flow of technologies, goods, and commodities,” the big “contributors to inflation,” a longer-lasting structural issue, Pozar puts forth.

Further, it is the case that “the pillars of the low inflation world are changing,” and geopolitics are the factors bolstering longer-lasting uncertainty and risk premia.

What was the case, before?

Previously, central bankers were waging wars “against deflationary impulses coming from the globalization of cheap resources (labor, goods, and commodities),” which we covered before.

Now, central bankers have a more difficult task stemming inflationary impulses coming from a complex and non-linear economic war between the U.S., China, and Russia that will do more, long-term, to “weaken the pillars of the globalized, low inflation world.”

So: 

  • Deflation, on globalization (and outward supply shifts), was fought with asset price inflation. 
  • Inflation, on de-globalization (and inward supply shifts), is fought with asset price deflation.

Exacerbating the de-globalization pulse on popular sovereignty, which I had the honor of talking on with Andy Constan, recently, are “wealth gains sapping labor force participation” and trends such as ESG, among other things. 

“It’s a mess: it’s easier to deal with the politics of wage setting than it is to ‘grow’ people – even in The Matrix, that’s possible only over time. Until then, we are stuck with a labor shortage, and President Biden’s top labor lawyer is the anti-Reagan: she’s encouraging the unionization of workers from Amazon to Starbucks…as opposed to firing them,” Pozsar explains.

For context, among the factors that helped Chairman Volcker stem inflation were new energy investment and the weakening of unions.

Accordingly, in a move from “generating demand structurally to soak up an excess supply of cheap stuff, to curbing demand structurally to adjust to shortages,” the prevailing tightening effort is not cyclical, as in corresponding to a business cycle. It’s structural.

It requires the sharp, “inward shift of supply curves across multiple fronts (labor, goods, and commodities),” putting the economy on an “L”-shaped path (i.e., a vertical drop in activity via recession, and flatline for a period of time as rates remain higher for longer to prevent a sharp rise in inflation, again).

Market participants, because of this, should be thinking about how deep (i.e., long-lasting) a recession is needed to curb inflation (rather than if a recession will happen at all); necessary is the purge of the “Super Size Me” mentality, Pozsar explains, and slow “interest-rate sensitive parts of the economy (housing and durables),” as well as reduce “demand for labor in services, … a function of the level of wealth across a range of assets (housing, stocks, as well as crypto).

“[W]hat the Fed is telling us when it flat-out dismisses two-quarters of negative GDP growth is that it isn’t focusing as much on the rate-sensitive parts of the economy as it did in the past,” Pozsar well summarizes, adding that 5-6% rates are not out of the realm of possibilities.

“Instead, it is focusing much more on the services economy and the labor market, which still remain strong. And therein lies the cautionary tale for the market.”

Looking out further in time, after inflation has been stemmed, the question is how the economy accelerates, again, and achieves stable growth. That depends on the West developing its own supply of things so “that ‘L’ becomes ‘L/’ and … that recovery [will be driven by] fiscally funded industrial policy.”

Graphic: Retrieved from Bloomberg. “Interest rates may be kept high for a while to ensure that rate cuts won’t cause an economic rebound (an ‘L’ and not a ‘V’), which might trigger a renewed bout of inflation,” Pozsar wrote in his note. “The risks are such that Powell will try his very best to curb inflation, even at the cost of a ‘depression’ and not getting reappointed.”

Positioning

Regarding the topic of liquidity – money available for circulation – which was discussed in-depth Tuesday, August 2, below is an updated chart of our Liquidity Tracker. Conditions are mostly unchanged.

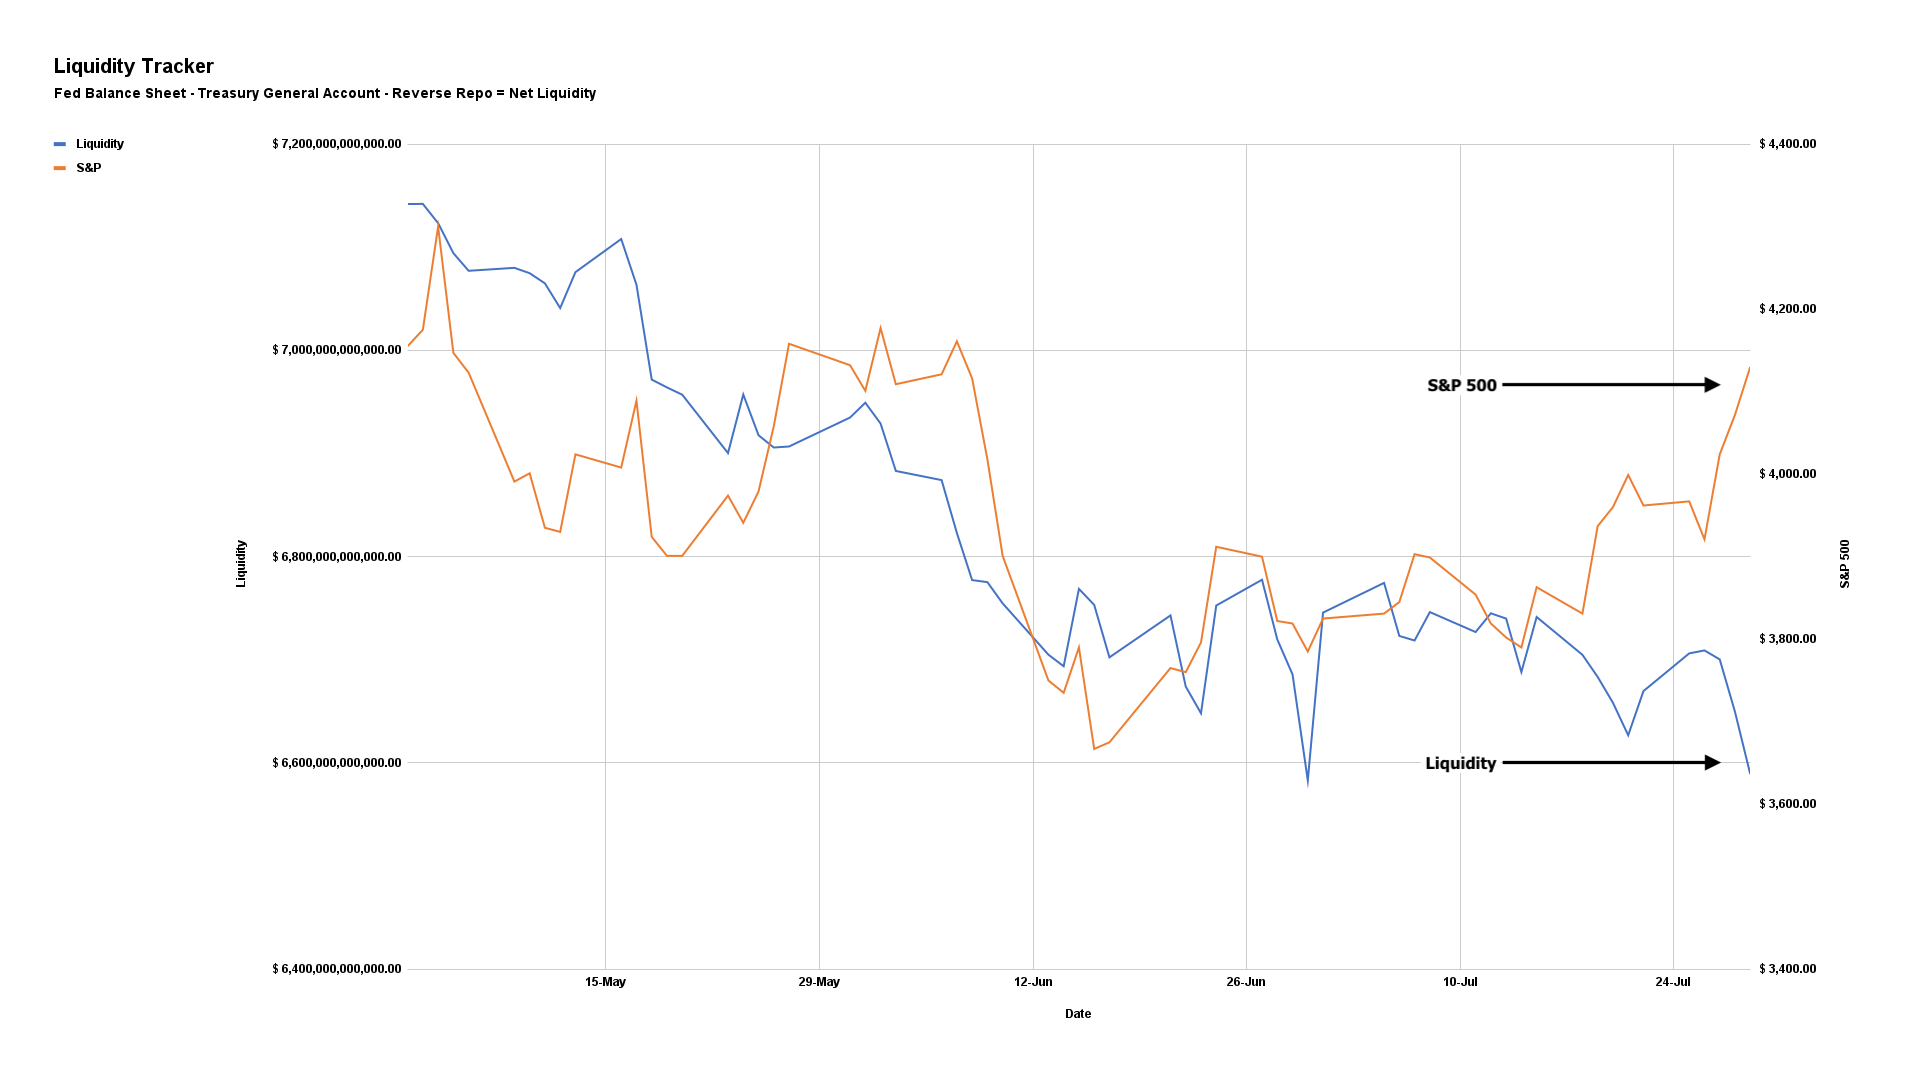
Graphic: Via Physik Invest. Data compiled by @jkonopas623. Fed Balance Sheet data, here. Treasury General Account Data, here. Reverse Repo data, here. NL = BS – TGA – RRP.

Moreover, in terms of options-related positioning, as of 8:50 AM ET, Wednesday’s expected volatility, via the Cboe Volatility Index (INDEX: VIX), sits at ~1.21%. Net gamma exposures increasing may promote tighter ranges.

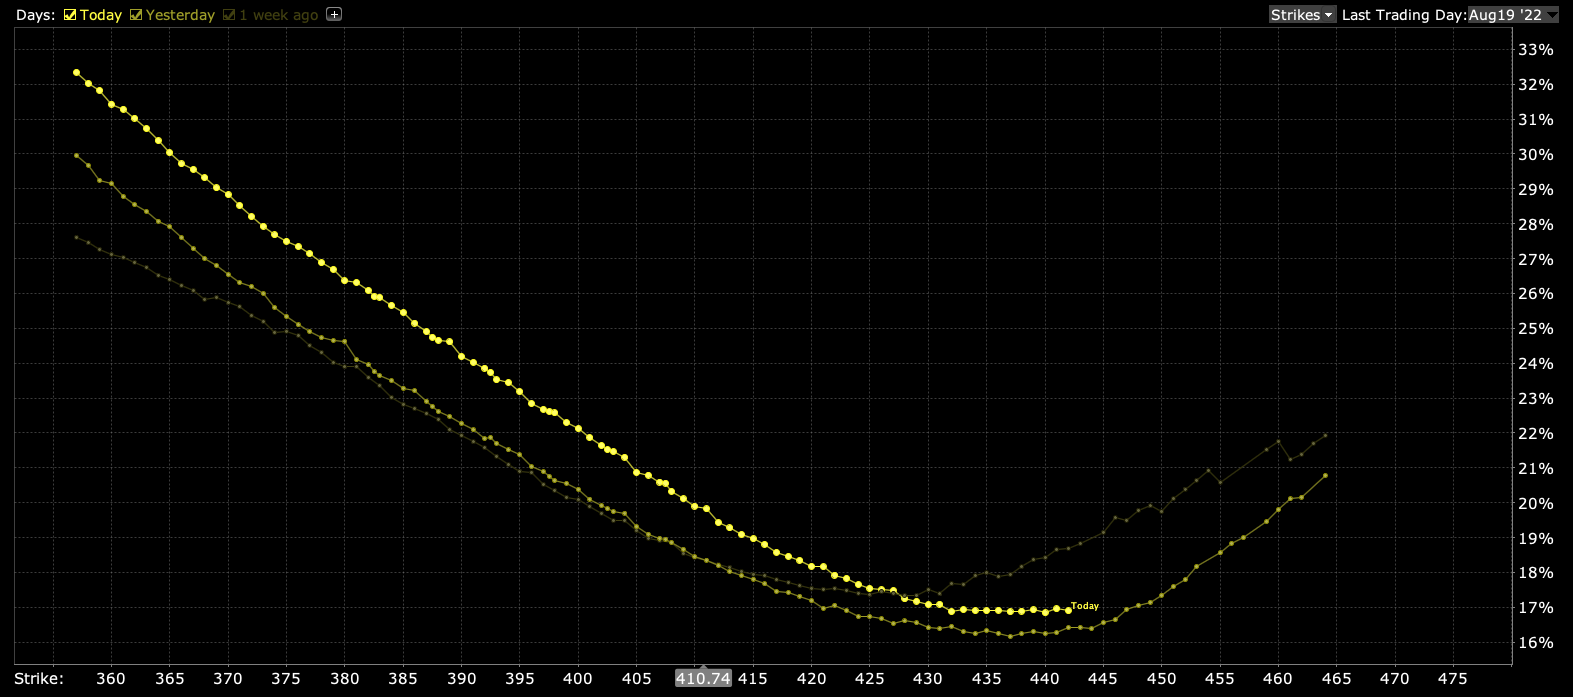
Given where realized (RVOL) and implied (IVOL) volatility measures are, as well as skew, it is beneficial to be a buyer of complex options structures (e.g., put back spread).

The reason why? 

Well, as discussed in-depth Tuesday, prevailing policy narratives are likely to bolster risk premia “everywhere else,” and that does more to support our recent positioning analyses and the case for an “untethering” in equity implied volatility (IVOL), “one of the most supportive things into the decline,” per statements by Kai Volatility’s Cem Karsan.

Basically, given the macro risk, IVOL is likely at a lower bound (as validated by the S&P 500 trading higher and downside skew holding a bid) and, per The Ambrus Group’s Kris Sidial, “if you wanted to go out and hedge, the opportunity is still there in the equity space.”

Through downside protection (e.g., butterfly and back spreads) you can position yourself to monetize on the sort-of non-linear repricing in volatility we’re alluding there is potential for. The bid in skew is helping those structures maintain their value better, essentially.

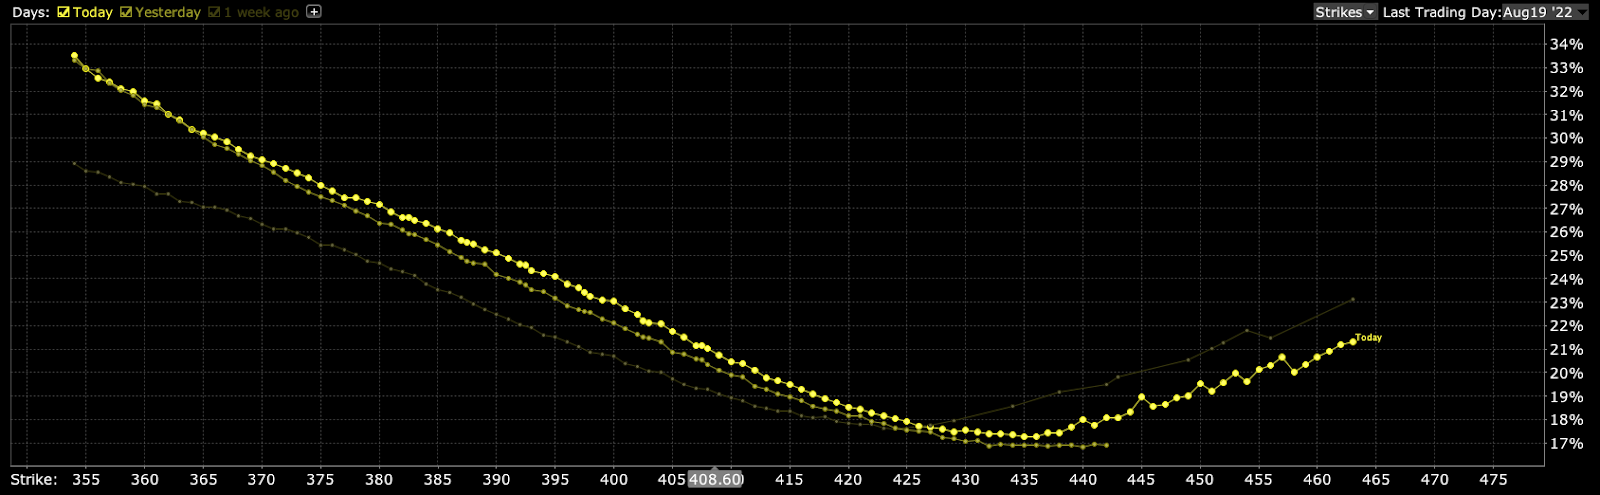
Graphic: Time-lapse skew on the S&P 500 (INDEX: SPX) for Tuesday, Monday, and one week ago. Retrieved from Interactive Brokers Group Inc’s (NASDAQ: IBKR) Trader Workstation.

Technical

As of 6:30 AM ET, Tuesday’s regular session (9:30 AM – 4:00 PM ET), in the S&P 500, is likely to open in the upper part of a positively skewed overnight inventory, inside of prior-range and -value, suggesting a limited potential for immediate directional opportunity.

In the best case, the S&P 500 trades higher.

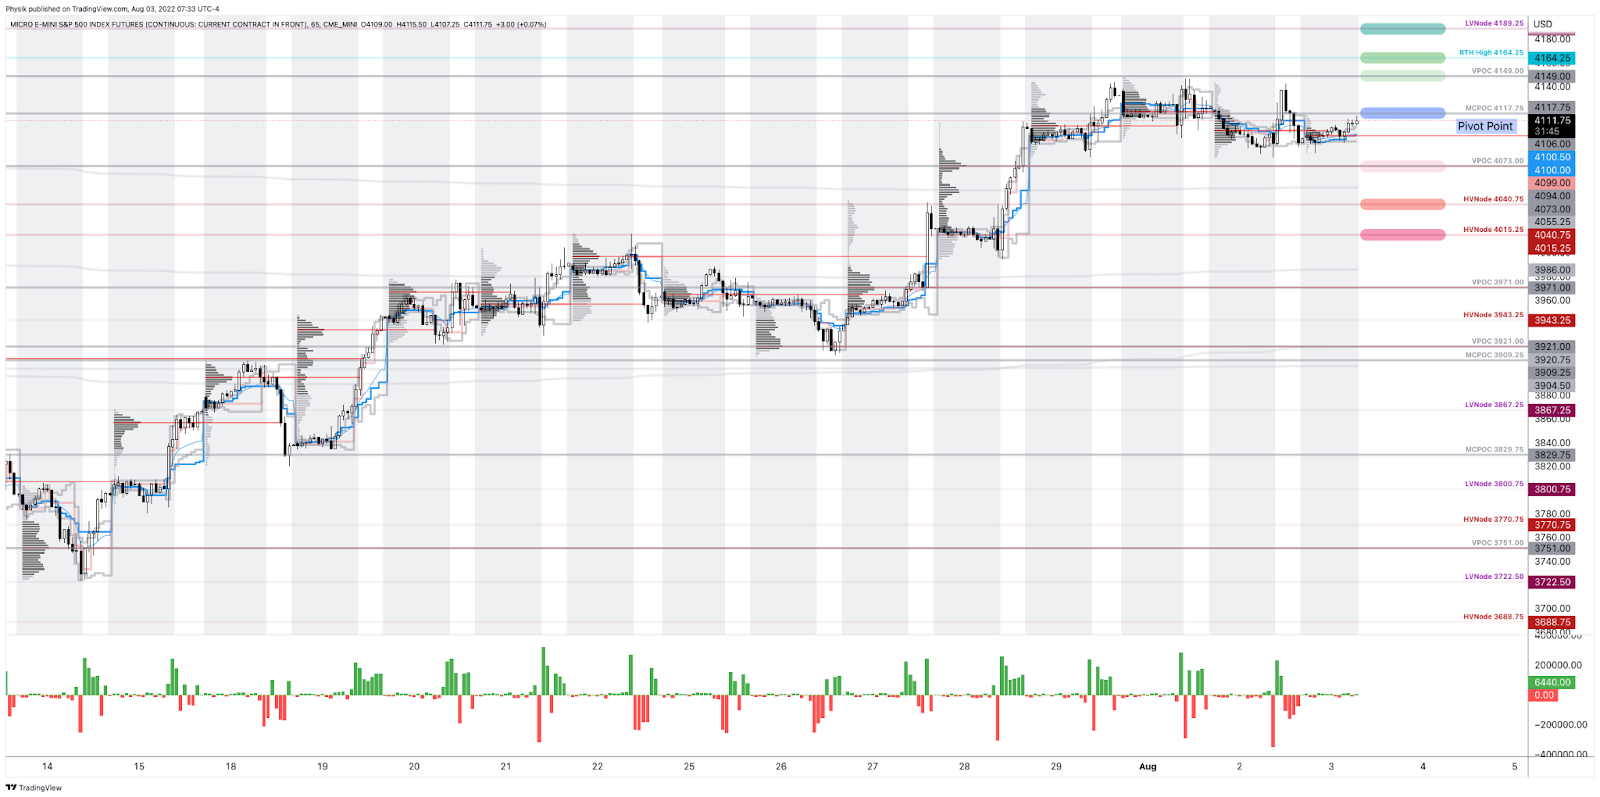
Any activity above the $4,117.75 MCPOC puts into play the $4,149.00 VPOC. Initiative trade beyond the VPOC could reach as high as the $4,164.25 RTH High and $4,189.25 LVNode, or higher.

In the worst case, the S&P 500 trades lower.

Any activity below the $4,117.75 MCPOC puts into play the $4,073.00 VPOC. Initiative trade beyond the VPOC could reach as low as the $4,040.75 and $4,015.25 HVNodes, or lower.

Click here to load today’s key levels into the web-based TradingView charting platform. Note that all levels are derived using the 65-minute timeframe. New links are produced, daily.
Graphic: 65-minute profile chart of the Micro E-mini S&P 500 Futures.

Definitions

Volume Areas: A structurally sound market will build on areas of high volume (HVNodes). Should the market trend for long periods of time, it will lack sound structure, identified as low volume areas (LVNodes). LVNodes denote directional conviction and ought to offer support on any test. 

If participants were to auction and find acceptance into areas of prior low volume (LVNodes), then future discovery ought to be volatile and quick as participants look to HVNodes for favorable entry or exit.

POCs: POCs are valuable as they denote areas where two-sided trade was most prevalent in a prior day session. Participants will respond to future tests of value as they offer favorable entry and exit.

MCPOCs: POCs are valuable as they denote areas where two-sided trade was most prevalent over numerous day sessions. Participants will respond to future tests of value as they offer favorable entry and exit.

Volume-Weighted Average Prices (VWAPs): A metric highly regarded by chief investment officers, among other participants, for quality of trade. Additionally, liquidity algorithms are benchmarked and programmed to buy and sell around VWAPs.

About

After years of self-education, strategy development, mentorship, and trial-and-error, Renato Leonard Capelj began trading full-time and founded Physik Invest to detail his methods, research, and performance in the markets.

Capelj also develops insights around impactful options market dynamics at SpotGamma and is a Benzinga reporter.

Some of his works include conversations with ARK Invest’s Catherine Wood, investors Kevin O’Leary and John Chambers, FTX’s Sam Bankman-Fried, ex-Bridgewater Associate Andy Constan, Kai Volatility’s Cem Karsan, The Ambrus Group’s Kris Sidial, among many others.

Disclaimer

In no way should the materials herein be construed as advice. Derivatives carry a substantial risk of loss. All content is for informational purposes only.

Categories
Commentary

Daily Brief For August 2, 2022

The daily brief is a free glimpse into the prevailing fundamental and technical drivers of U.S. equity market products. Join the 700+ that read this report daily, below!

Graphic updated 6:30 AM ET. Sentiment Risk-Off if expected /ES open is below the prior day’s range. /ES levels are derived from the profile graphic at the bottom of the following section. Levels may have changed since initially quoted; click here for the latest levels. SqueezeMetrics Dark Pool Index (DIX) and Gamma (GEX) calculations are based on where the prior day’s reading falls with respect to the MAX and MIN of all occurrences available. A higher DIX is bullish. At the same time, the lower the GEX, the more (expected) volatility. Learn the implications of volatility, direction, and moneyness. Breadth reflects a reading of the prior day’s NYSE Advance/Decline indicator. VIX reflects a current reading of the CBOE Volatility Index (INDEX: VIX) from 0-100.

Fundamental

The U.S. Treasury upped its borrowing estimate by $262 billion as federal revenue projections shifted.

Here’s why this matters.

Per Damped Spring’s Andy Constan, on an “overwhelming high issuance in Q1,” markets sold, and on “light issuance, once QT start[ed], plus some crazy tax receipts in Q3,” markets rallied.

With the Treasury’s debt managers seeking to borrow more than $400 billion through September, compared to the original estimate of $180 billion or so, anticipated is added borrowing through new marketable debt issuances.

“This is the reason I dumped my long equities after 3:00 when the news hit,” Constan added.

Overall, this news is important because it has an impact on the money available for circulation.

To explain, after the Federal Reserve (Fed) bean upping the size of its balance sheet (BS) in an unprecedented way in 2020, the deployment of this money – liquidity – boosted risk-asset prices and the cost of living.

We can measure the availability of this liquidity, as well showcased by Max Anderson, online. 

Graphic: Via Physik Invest. Data compiled by @jkonopas623. Fed Balance Sheet data, here. Treasury General Account Data, here. Reverse Repo data, here. NL = BS – TGA – RRP.

So, what’s going on, now?

To rein inflation, and undo some of its intervention, the Treasury issued fewer short-dated T-bills, and the Fed raised rates on Reverso Repo (RRP), “the next best low-duration-risk alternative.”

This has sucked over $2 trillion out of the economy, “six times more than ever done before.”

That said, unlike in the past, however, “relative changes in [the] Treasury General Account (TGA) and RRP” are way bigger than changes in the size of the BS. 

As a result, the game changes. 

The “changes in TGA and RRP have taken over as the primary drivers [of] Net Liquidity,” the money available to circulate in the economy. “[S]ince 2020, the Treasury and Reverse Repo [control] that. Not the size of Fed’s balance sheet.”

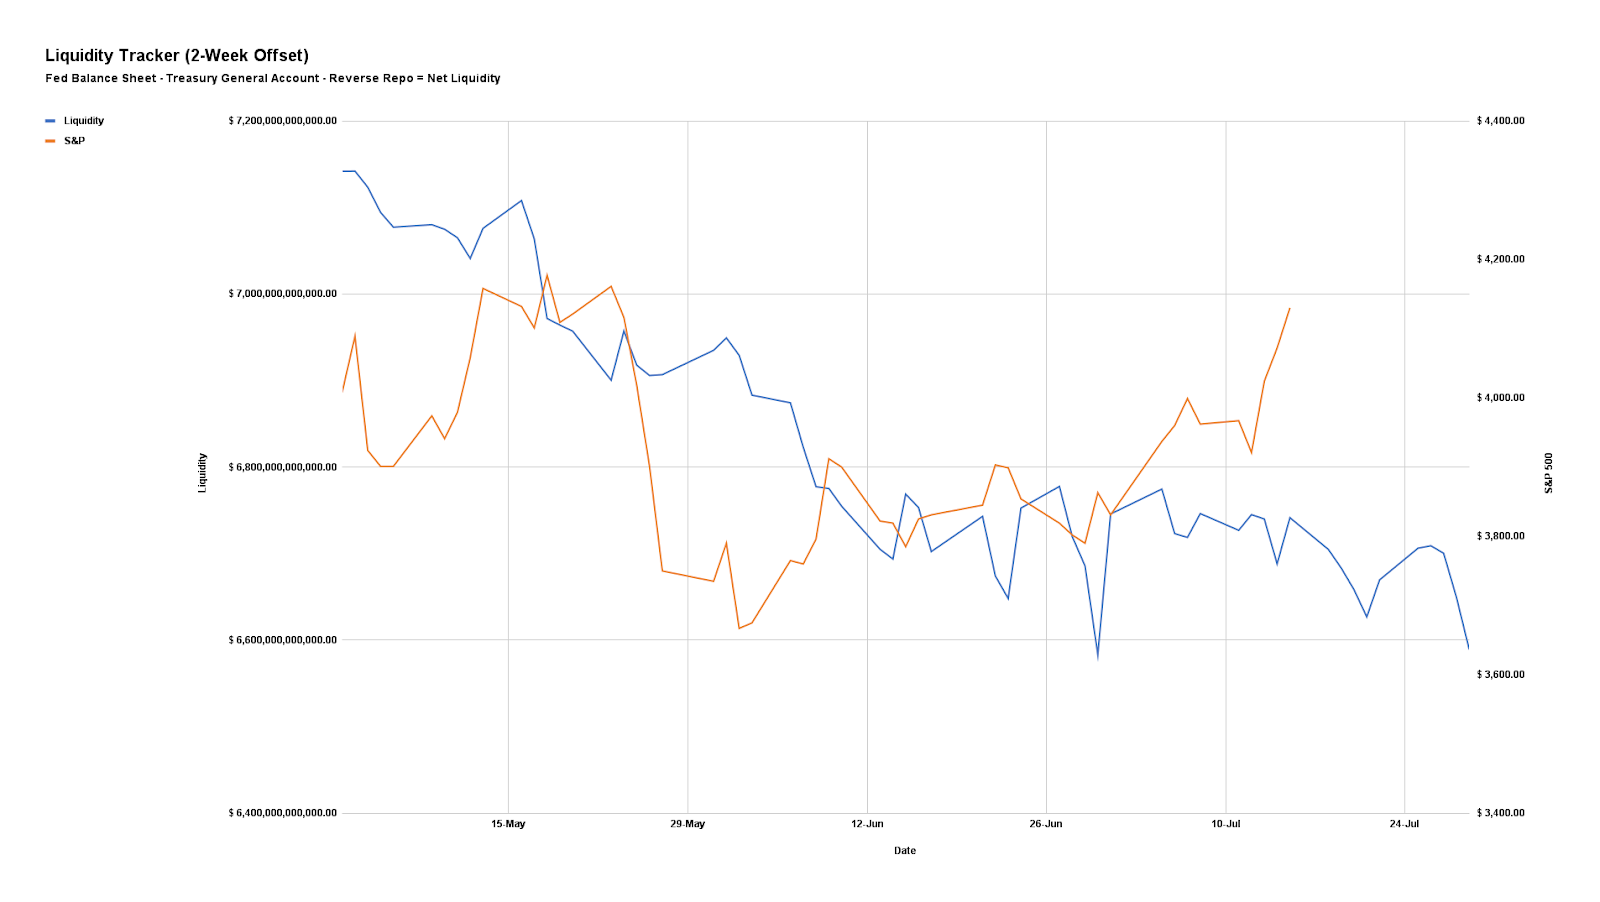
That’s per the tight correlation between Net Liquidity and the S&P 500. Offsetting the two by two weeks (i.e., using the path of Net Liquidity to forecast the path of the S&P 500 by two weeks in advance) reveals a tight correlation.

As Anderson puts it, “when there’s a change in Liquidity, it takes two weeks to propagate out into the economy and impact asset prices. And that change in Liquidity predicts next two week’s change in asset prices with 95% correlation.”

See a file containing the data and charts, here. We’ll work to improve the charts in subsequent letters.
Graphic: Via Physik Invest. Data compiled by @jkonopas623. Fed Balance Sheet data, here. Treasury General Account Data, here. Reverse Repo data, here. NL = BS – TGA – RRP.

Positioning

As of 6:30 AM ET, Tuesday’s expected volatility, via the Cboe Volatility Index (INDEX: VIX), sits at ~1.29%. Net gamma exposures increasing may promote tighter ranges.

Given where realized (RVOL) and implied (IVOL) volatility measures are, as well as skew, it is beneficial to be a buyer of complex options structures (e.g., back spreads).

The reason why? 

Pursuant to our comments on monetary policymakers ditching forward guidance, which, per the Macro Compass’ Alfonso Peccatiello leaves “no anchor for bond markets, … and higher volatility,” bolsters risk premia “everywhere else.”

As stated Monday, this does more to support our recent positioning analyses and the case for an “untethering” in equity IVOL, “one of the most supportive things into the decline,” per statements by Kai Volatility’s Cem Karsan.

Here’s some context.

As well explained in the Daily Brief for July 21, 2022, heading into the 2022 decline, institutions repositioned and hedged, even allocating to “commodity trend following,” per our Daily Brief for July 15, 2022, which worked well the first two quarters.

The monetization and counterparty hedging of existing customer hedges, as well as the sale of short-dated volatility, particularly in some of the single names where there was “rich” volatility, into the fall, lent to lackluster performance in IVOL and index mean reversion.

This trend is coming to an end as entities are squeezed out of trades that aren’t working (i.e., participants rotate out of volatility and commodities).

Per Karsan, as “volatility itself, on the equity side, becomes less and less hedged on the customer level, … [the] market can really begin to respond to the core macro factors.”

Should markets experience a shock (e.g., China and U.S. tensions escalate), the new demand for hedges may result in an “untethering” in IVOL, which was “one of the most supportive things into the decline,” Karsan said, adding that now is the best time to rotate into call options which are outperforming “their delta to the upside.”

Accordingly, given the macro risk, IVOL is likely at a lower bound (as validated by the S&P 500 trading higher and downside skew holding a bid) and, per The Ambrus Group’s Kris Sidial, “if you wanted to go out and hedge, the opportunity is still there in the equity space.”

Through downside protection (e.g., butterfly and back spreads) you can position yourself to monetize on the sort-of non-linear repricing in volatility we’re alluding there is potential for. The bid in skew is helping those structures maintain their value better, essentially.

Graphic: Time-lapse skew on the S&P 500 (INDEX: SPX) for Monday, Friday, and one week ago. Retrieved from Interactive Brokers Group Inc’s (NASDAQ: IBKR) Trader Workstation.

Technical

As of 6:30 AM ET, Tuesday’s regular session (9:30 AM – 4:00 PM ET), in the S&P 500, is likely to open in the lower part of a negatively skewed overnight inventory, outside of prior-range and -value, suggesting a potential for immediate directional opportunity.

In the best case, the S&P 500 trades higher.

Any activity above the $4,117.75 MCPOC puts into play the $4,149.00 VPOC. Initiative trade beyond the VPOC could reach as high as the $4,164.25 RTH High and $4,189.25 LVNode, or higher.

In the worst case, the S&P 500 trades lower.

Any activity below the $4,117.75 MCPOC puts into play the $4,073.00 VPOC. Initiative trade beyond the VPOC could reach as low as the $4,040.75 and $4,015.25 HVNodes, or lower.

Click here to load today’s key levels into the web-based TradingView charting platform. Note that all levels are derived using the 65-minute timeframe. New links are produced, daily.
Graphic: 65-minute profile chart of the Micro E-mini S&P 500 Futures.

Definitions

Volume Areas: A structurally sound market will build on areas of high volume (HVNodes). Should the market trend for long periods of time, it will lack sound structure, identified as low volume areas (LVNodes). LVNodes denote directional conviction and ought to offer support on any test. 

If participants were to auction and find acceptance into areas of prior low volume (LVNodes), then future discovery ought to be volatile and quick as participants look to HVNodes for favorable entry or exit.

POCs: POCs are valuable as they denote areas where two-sided trade was most prevalent in a prior day session. Participants will respond to future tests of value as they offer favorable entry and exit.

MCPOCs: POCs are valuable as they denote areas where two-sided trade was most prevalent over numerous day sessions. Participants will respond to future tests of value as they offer favorable entry and exit.

Volume-Weighted Average Prices (VWAPs): A metric highly regarded by chief investment officers, among other participants, for quality of trade. Additionally, liquidity algorithms are benchmarked and programmed to buy and sell around VWAPs.

About

After years of self-education, strategy development, mentorship, and trial-and-error, Renato Leonard Capelj began trading full-time and founded Physik Invest to detail his methods, research, and performance in the markets.

Capelj also develops insights around impactful options market dynamics at SpotGamma and is a Benzinga reporter.

Some of his works include conversations with ARK Invest’s Catherine Wood, investors Kevin O’Leary and John Chambers, FTX’s Sam Bankman-Fried, ex-Bridgewater Associate Andy Constan, Kai Volatility’s Cem Karsan, The Ambrus Group’s Kris Sidial, among many others.

Disclaimer

In no way should the materials herein be construed as advice. Derivatives carry a substantial risk of loss. All content is for informational purposes only.

Categories
Commentary

Daily Brief For August 1, 2022

The daily brief is a free glimpse into the prevailing fundamental and technical drivers of U.S. equity market products. Join the 700+ that read this report daily, below!

Graphic updated 6:30 AM ET. Sentiment Neutral if expected /ES open is inside of the prior day’s range. /ES levels are derived from the profile graphic at the bottom of the following section. Levels may have changed since initially quoted; click here for the latest levels. SqueezeMetrics Dark Pool Index (DIX) and Gamma (GEX) calculations are based on where the prior day’s reading falls with respect to the MAX and MIN of all occurrences available. A higher DIX is bullish. At the same time, the lower the GEX, the more (expected) volatility. Learn the implications of volatility, direction, and moneyness. Breadth reflects a reading of the prior day’s NYSE Advance/Decline indicator. VIX reflects a current reading of the CBOE Volatility Index (INDEX: VIX) from 0-100.

Fundamental

Today, we add to our narrative updates with respect to the Inflation Reduction Act, China crises, implications of earnings growth that’s down below the surface, the Federal Reserve’s pivot from forward guidance, how uncertainties boost risk premia, and geopolitics. Then, in the coming days, we’ll hone in on measuring the impact.

Let’s get into it.

Inflation Reduction Act Disinflationary

The bill, which reforms the tax code, cuts health-care costs, and helps with climate change, per Noah Smith’s letter, is disinflationary.

The reason being? 

It works to shrink the deficit by $288 billion, over a decade. Additionally, though government investments are “inflationary in the short-term, and deflationary in the medium term,” embedded tax hikes “should more than cancel out the short-term inflationary piece.”

China Crisis Contained

Next, is the crisis in China. 

After Evergrande fears “peaked in September, … people stopped paying their mortgages,” in protest, per Marc Rubinstein’s Net Interest letter

Why is this problematic?

Typically, purchasers place “down payments into developer’s escrow accounts some 18-24 months before taking delivery of their home which are then topped up via mortgage loans.”

Though these funds would “cover the remaining cost of construction,” developers mismanaged and, “when the market turned – and traditional credit channels turned off their supply of new credit – many developers ran out of funds to complete projects.”

Despite “unfinished residential projects across China representing only 1.7% of total outstanding mortgage loans, … [they’re] a lot riskier,” now. Homes are a big chunk of household wealth and damage to this area of the market has major implications.

For context, home prices are to China what stock markets are to the Federal Reserve and peripheral bond spreads are to the European Central Bank.

Notwithstanding, despite “excessive leverage, regulatory arbitrage, and irresponsible risk-taking, … [China] banks are able to pursue a borrower’s other assets if they default on their mortgage, … [so] strategic defaults are less likely.”

Here Comes The Earnings De-rate?

As well explained in last Friday’s morning letter, essentially, the 2022 decline was mainly about higher inflation and interest rates. 

“The second half will be about earnings,” Blockworks puts well. Here’s why.

Despite, “S&P 500 earnings [] on track to rise by a robust 9.4% in aggregate,” per statements by Deutsche Bank AG’s (NYSE: DB) Binky Chadha, growth “is down sharply below the surface.”

If the massive increase in energy earnings, the return to profitability for pandemic-impacted businesses, and the drag on banks from loan loss provisioning are excluded, the “earnings adjusted for seasonality are on track to fall sharply by -4.5% quarter-on-quarter, one of the steepest declines.” 

This is among the factors prompting the likes of Meta Platforms Inc (NASDAQ: META) and Amazon Inc (NASDAQ: AMZN) to trim resources like labor.

Uncertainties Boost Risk Premia

Alfonso Peccatiello, in his letter The Macro Compass, explains that the Federal Reserve ditching forward guidance gave “markets the green light to freely design their probability distributions across all asset classes, without any anchor.”

This explains the big rally in risk assets like equities.

Notwithstanding, the Fed no longer being on autopilot promotes uncertainty and higher volatility in bonds, which is an “enemy for risk assets,” over longer time horizons.

“While ditching forward guidance might be the right monetary policy strategy, … when there is no anchor for bond markets, implied volatility will have a hard time coming down. And a higher volatility in one of the biggest, most liquid markets in the world generally requires higher (not lower) risk premia everywhere else.”

This does more to support our recent positioning analyses and the case for an “untethering” in equity implied volatility, “one of the most supportive things into the decline,” per statements by Kai Volatility’s Cem Karsan.

Tensions Flare, Elsewhere

While, on one hand, the pressures from the Russia and Ukraine conflict are beginning to ebb as the first ship carrying Ukrainian grains left for Lebanon, tensions elsewhere are flaring.

To be specific, news regarding the unrest in the Balkans, between Kosovo and Serbia, hit the wire, yesterday. Per Washington Post coverage, “Ethnic Serbs in northern municipalities of Kosovo bordering Serbia blocked roads and skirmished with police on the eve of the implementation of a law requiring them to replace their license plates with Kosovo plates.”

Per Newsweek coverage, in response, a NATO mission called KFOR would “take whatever measures are necessary to keep a safe and secure environment in Kosovo at all times, in line with its U.N. mandate.”

Adding, “Observers fear Moscow might see an opportunity in the current tensions between the two countries to push the U.S. and the NATO mission out of Kosovo.”

This is as a Chinese invasion of Taiwan may come sooner than expected, Axios reports.

Technical

As of 6:30 AM ET, Monday’s regular session (9:30 AM – 4:00 PM ET), in the S&P 500, is likely to open in the middle part of a negatively skewed overnight inventory, inside of prior-range and -value, suggesting a limited potential for immediate directional opportunity.

In the best case, the S&P 500 trades higher.

Any activity above the $4,107.00 VPOC puts into play the $4,149.00 VPOC. Initiative trade beyond the VPOCs could reach as high as the $4,164.25 RTH High and $4,189.25 LVNode, or higher.

In the worst case, the S&P 500 trades lower.

Any activity below the $4,107.00 VPOC puts into play the $4,073.00 VPOC. Initiative trade beyond the $4,073.00 VPOC could reach as low as the $4,040.75 and $4,015.25 HVNodes, or lower.

Click here to load today’s key levels into the web-based TradingView charting platform. Note that all levels are derived using the 65-minute timeframe. New links are produced, daily.
Graphic: 65-minute profile chart of the Micro E-mini S&P 500 Futures.

Definitions

Volume Areas: A structurally sound market will build on areas of high volume (HVNodes). Should the market trend for long periods of time, it will lack sound structure, identified as low volume areas (LVNodes). LVNodes denote directional conviction and ought to offer support on any test. 

If participants were to auction and find acceptance into areas of prior low volume (LVNodes), then future discovery ought to be volatile and quick as participants look to HVNodes for favorable entry or exit.

POCs: POCs are valuable as they denote areas where two-sided trade was most prevalent in a prior day session. Participants will respond to future tests of value as they offer favorable entry and exit.

MCPOCs: POCs are valuable as they denote areas where two-sided trade was most prevalent over numerous day sessions. Participants will respond to future tests of value as they offer favorable entry and exit.

Volume-Weighted Average Prices (VWAPs): A metric highly regarded by chief investment officers, among other participants, for quality of trade. Additionally, liquidity algorithms are benchmarked and programmed to buy and sell around VWAPs.

About

After years of self-education, strategy development, mentorship, and trial-and-error, Renato Leonard Capelj began trading full-time and founded Physik Invest to detail his methods, research, and performance in the markets.

Capelj also develops insights around impactful options market dynamics at SpotGamma and is a Benzinga reporter.

Some of his works include conversations with ARK Invest’s Catherine Wood, investors Kevin O’Leary and John Chambers, FTX’s Sam Bankman-Fried, ex-Bridgewater Associate Andy Constan, Kai Volatility’s Cem Karsan, The Ambrus Group’s Kris Sidial, among many others.

Disclaimer

In no way should the materials herein be construed as advice. Derivatives carry a substantial risk of loss. All content is for informational purposes only.
Categories
Commentary

Daily Brief For July 28, 2022

The daily brief is a free glimpse into the prevailing fundamental and technical drivers of U.S. equity market products. Join the 600+ that read this report daily, below!

Graphic updated 7:00 AM ET. Sentiment Neutral if expected /ES open is inside of the prior day’s range. /ES levels are derived from the profile graphic at the bottom of the following section. Levels may have changed since initially quoted; click here for the latest levels. SqueezeMetrics Dark Pool Index (DIX) and Gamma (GEX) calculations are based on where the prior day’s reading falls with respect to the MAX and MIN of all occurrences available. A higher DIX is bullish. At the same time, the lower the GEX, the more (expected) volatility. Learn the implications of volatility, direction, and moneyness. Breadth reflects a reading of the prior day’s NYSE Advance/Decline indicator. VIX reflects a current reading of the CBOE Volatility Index (INDEX: VIX) from 0-100.

Fundamental

Key, yesterday, was the Federal Reserve’s (Fed) move to rein inflation with another 75 basis point interest rate hike. This lifted the target for the federal funds rate to 2.25-2.5%.

Accordingly, with inflation (which is to be dampened) a negative for stocks, a primary driver behind this year’s de-rate, already, equity markets closed sharply higher.

Graphic: Via Schroders plc (OTC: SHNWF). Taken from the Weekly S&P 500 ChartStorm.

Despite room for higher rates, the Fed explained future decisions would “depend on the data,” and that, per Bloomberg, the economy is likely “to withstand rapid monetary tightening.”

Graphic: Retrieved from Bloomberg. Tighter liquidity and credit bolster demand for money as well as the deflation of risk assets. “There used to be too little demand. Now there’s too little supply. And in a world of too little supply, the country doing the most to generate demand, which is the US, is exporting its problem—its problem being inflation,” per Harvard’s Jason Furman.

Adding, participants are, now, pricing in the potential for a federal funds rate peak in the range of 3.25-3.50% early-to-mid 2023, down from 4.00-4.75% after the last rate hike took place.

Graphic: Via CME Group Inc’s (NASDAQ: CME) FedWatch Tool.

Strategists at the likes of Bank of America Corporation (NYSE: BAC) put forth that it is likely, given an economic slowing, that the Fed, indeed, cuts rates next year and ends quantitative tightening (QT).

“The Fed is likely to stop QT with rate cuts due to the contradictory signal it sends on monetary policy and to simplify policy communications; the Fed will likely not want to be easing with rate cuts but tightening with QT,” the bank’s strategists explained. 

An end to QT would cut the supply that the “Treasury needs to issue to cover Fed redemptions. It also means the Fed may conduct secondary purchases, further limiting the amount of supply the market needs to absorb.”

This is in comparison to the narrative we discussed earlier this week, put forth by Damped Spring Advisors’ Andy Constan.

With “most of [the Fed] balance sheet reduction to be run-off” – non-reinvestment of “proceeds from maturing assets they own” – coupled with the Treasury halving “coupon issuance that the market must absorb,” Constan explained, instead, that the “Fed is done for the summer.”

This is likely to “result in less surprise and falling asset volatility” as investors realize “they are now under-risked,” which may drive a “risk premium contraction” and demand for risk assets.

Positioning

As of 6:50 AM ET, Thursday’s expected volatility, via the Cboe Volatility Index (INDEX: VIX), sits at ~1.22%. Net gamma exposures increasing may promote tighter ranges.

It is often, just after an event, that market movement is the result of inventory rebalances. Per Kai Volatility’s Cem Karsan, the subsequent move is to be “tied to the incremental effects on liquidity (QE/QT).” 

Graphic: Retrieved from MarketWatch.

Rising rates and the withdrawal of liquidity, coupled with the impact of inflation and an economic slowing, could prompt continued pressure on equity markets.

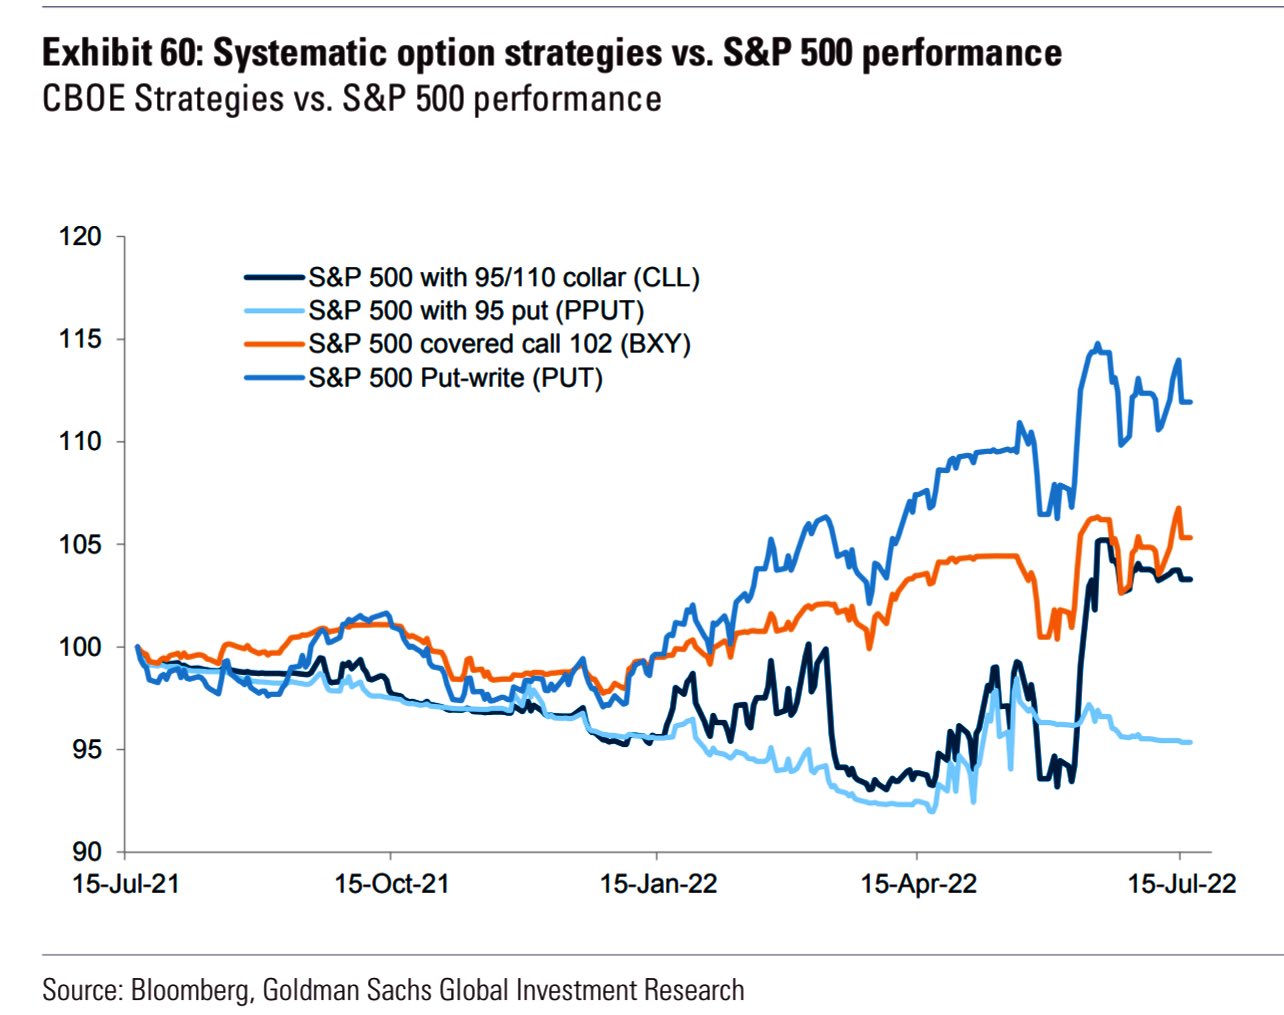
Given the macro risk, and the poor performance of implied volatility (IVOL), relative to that which markets have realized (RVOL), per The Ambrus Group’s Kris Sidial, “if you wanted to go out and hedge, the opportunity is still there in the equity space.”

Graphic: Retrieved from Goldman Sachs Group Inc (NYSE: GS).

Should investors “ditch their [old] hedges in frustration as sentiment improves, because they didn’t work properly in a falling market,” this may set up “the potential for a second-leg-down event,” in the next year, as well explained in the Systemic Individual Investor.

“During the next sell-off, panic put-buying can cause a much more violent downward spiral, because options dealers are forced to sell an increasing amount of S&P futures into an accelerating down move.”

So, what to do? 

With call options outperforming “their delta to the upside,” it continues to make much sense to replace static equity long exposure with that which is dynamic, Karsan explained.

Technical

As of 6:50 AM ET, Thursday’s regular session (9:30 AM – 4:00 PM ET), in the S&P 500, is likely to open in the middle part of a negatively skewed overnight inventory, inside of prior-range and -value, suggesting a limited potential for immediate directional opportunity.

In the best case, the S&P 500 trades higher.

Any activity above the $4,015.75 HVNode puts into play the $4,041.25 HVNode. Initiative trade beyond the $4,041.25 HVNode could reach as high as the $4,071.50 BAL and $4,095.00 VPOC, or higher.

In the worst case, the S&P 500 trades lower.

Any activity below the $4,015.75 HVNode puts into play the $3,971.00 VPOC. Initiative trade beyond the VPOC could reach as low as the $3,943.25 HVNode and $3,921.00 VPOC, or lower.

Click here to load today’s key levels into the web-based TradingView charting platform. Note that all levels are derived using the 65-minute timeframe. New links are produced, daily.
Graphic: 65-minute profile chart of the Micro E-mini S&P 500 Futures.

Definitions

Volume Areas: A structurally sound market will build on areas of high volume (HVNodes). Should the market trend for long periods of time, it will lack sound structure, identified as low volume areas (LVNodes). LVNodes denote directional conviction and ought to offer support on any test. 

If participants were to auction and find acceptance into areas of prior low volume (LVNodes), then future discovery ought to be volatile and quick as participants look to HVNodes for favorable entry or exit.

POCs: POCs are valuable as they denote areas where two-sided trade was most prevalent in a prior day session. Participants will respond to future tests of value as they offer favorable entry and exit.

MCPOCs: POCs are valuable as they denote areas where two-sided trade was most prevalent over numerous day sessions. Participants will respond to future tests of value as they offer favorable entry and exit.

Volume-Weighted Average Prices (VWAPs): A metric highly regarded by chief investment officers, among other participants, for quality of trade. Additionally, liquidity algorithms are benchmarked and programmed to buy and sell around VWAPs.

About

After years of self-education, strategy development, mentorship, and trial-and-error, Renato Leonard Capelj began trading full-time and founded Physik Invest to detail his methods, research, and performance in the markets.

Capelj also develops insights around impactful options market dynamics at SpotGamma and is a Benzinga reporter.

Some of his works include conversations with ARK Invest’s Catherine Wood, investors Kevin O’Leary and John Chambers, FTX’s Sam Bankman-Fried, ex-Bridgewater Associate Andy Constan, Kai Volatility’s Cem Karsan, The Ambrus Group’s Kris Sidial, among many others.

Disclaimer

In no way should the materials herein be construed as advice. Derivatives carry a substantial risk of loss. All content is for informational purposes only.
Categories
Commentary

Daily Brief For July 27, 2022

The daily brief is a free glimpse into the prevailing fundamental and technical drivers of U.S. equity market products. Join the 600+ that read this report daily, below!

Graphic updated 6:55 AM ET. Sentiment Risk-On if expected /ES open is above the prior day’s range. /ES levels are derived from the profile graphic at the bottom of the following section. Levels may have changed since initially quoted; click here for the latest levels. SqueezeMetrics Dark Pool Index (DIX) and Gamma (GEX) calculations are based on where the prior day’s reading falls with respect to the MAX and MIN of all occurrences available. A higher DIX is bullish. At the same time, the lower the GEX, the more (expected) volatility. Learn the implications of volatility, direction, and moneyness. Breadth reflects a reading of the prior day’s NYSE Advance/Decline indicator. VIX reflects a current reading of the CBOE Volatility Index (INDEX: VIX) from 0-100.

Fundamental

We shall unpack details from the Federal Open Market Committee (FOMC) event in the coming sessions, stay tuned.

Positioning

As of 6:40 AM ET, Wednesday’s expected volatility, via the Cboe Volatility Index (INDEX: VIX), sits at ~1.27%. Net gamma exposures lightly decreasing may promote larger trading ranges.

Graphic: Via Physik Invest. Data retrieved from SqueezeMetrics.

Should fears with respect to the Federal Open Market Committee (FOMC) announcement be assuaged, then compression in volatility may do more to support current equity price levels.

Graphic: Updated July 26, 2022. Retrieved from Interactive Brokers Group Inc’s (NASDAQ: IBKR) Trader Workstation. Posted by SpotGamma. Short-dated, pre-FOMC, volatility is sold. Longer-dated, post-FOMC volatility is bid. “Traders have likely shorting implied volatility for pre-FOMC expirations which has been supportive of equities.”

Notwithstanding, let’s unpack some trends and how they may feed into a volatility “untethering.”

In the Daily Brief for March 31, 2022, we discussed participants’ aversion to selling short-term variance. This, which did more to assuage our fear of crash risk, as well explained in the Daily Brief for March 30, 2022, was, in part, the result of COVID-era volatility that forced participants, out on the risk curve, to deleverage en masse.

As stated in March, per Banco Santander SA’s (NYSE: SAN) research, the “supply of volatility remains very subdued in a trend that has continued since the pandemic.”

“We did observe some activity in 4Q21 and 1Q this year, but almost all of that was unwinding of existing positions from earlier, and these were not new trades.”

Graphic: Via Goldman Sachs Group Inc (NYSE: GS).

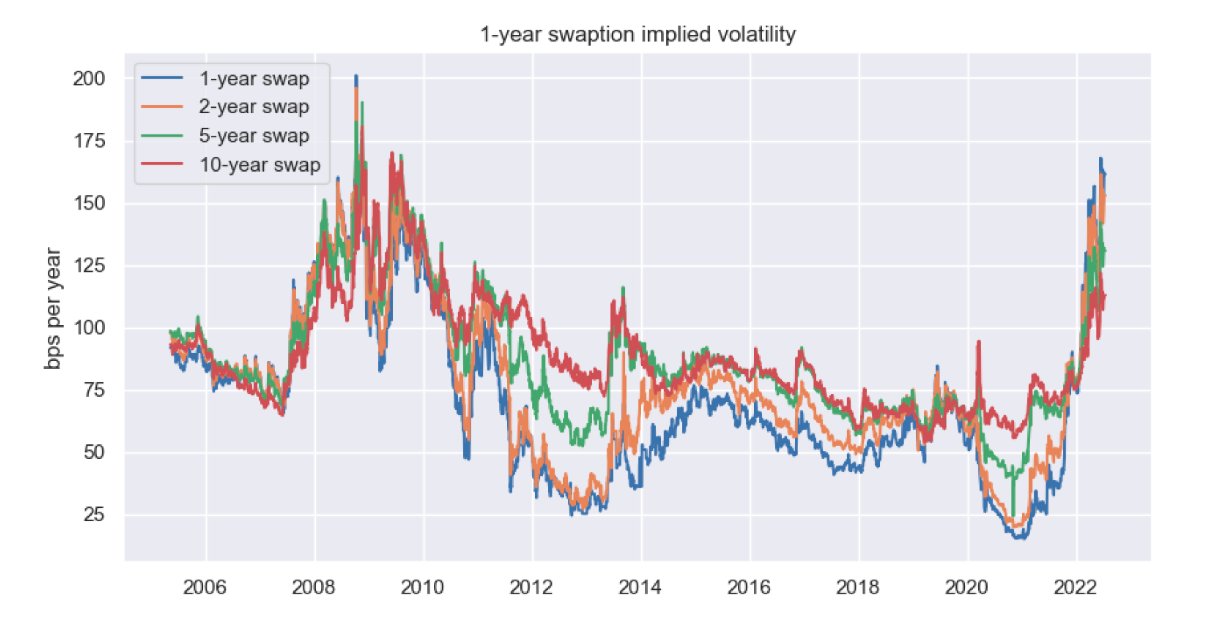
However, despite all of the “uncertainty from geopolitics and central banks,” we still saw broad equity implied volatility (IVOL) measures subdued, relative to those in rates and FX.

Graphic: Retrieved from QVR Advisors’ Benn Eifert.

Let’s unpack that muted response, further.

Well, as explained in the Daily Brief for July 21, 2022, heading into the 2022 decline, institutions repositioned and hedged, even allocating to “commodity trend following,” per our Daily Brief for July 15, 2022, which worked well the first two quarters.

The monetization and counterparty hedging of existing customer hedges, as well as the sale of short-dated volatility, particularly in some of the single names where there was “rich” volatility, into the fall, lent to lackluster performance in implied volatility and index mean reversion.

Graphic: Retrieved from Rob Emrich III. Via Goldman Sachs Group Inc (NYSE: GS).

This trend is set to come to an end as entities are squeezed out of trades that aren’t working (i.e., participants rotate out of volatility and commodities).

Graphic: Retrieved from SpotGamma. S&P 500 $3,500.00 put option values. “Like with the Boy Who Cried Wolf, people grew tired of false alarms. This year put buyers have been waiting for the wolf, but after June OPEX the villagers stopped listening.”

Per Kai Volatility’s Cem Karsan, as “volatility itself, on the equity side, becomes less and less hedged on the customer level, … [the] market can really begin to respond to the core macro factors.”

Should markets experience a shock, or trade substantially lower, the demand for hedges may result in an “untethering” in implied volatility, which was “one of the most supportive things into the decline,” Karsan said, adding that now is the best time to rotate into call options which are outperforming “their delta to the upside.”

Graphic: Time-lapse skew on the S&P 500 (INDEX: SPX) for July 25 and July 26, 2022. Retrieved from Interactive Brokers Group Inc’s (NASDAQ: IBKR) Trader Workstation.

Accordingly, given the macro risk, IVOL is likely at a lower bound and, per The Ambrus Group’s Kris Sidial, “if you wanted to go out and hedge, the opportunity is still there in the equity space.”

Technical

As of 6:30 AM ET, Wednesday’s regular session (9:30 AM – 4:00 PM ET), in the S&P 500, is likely to open in the upper part of a positively skewed overnight inventory, just outside of prior-range and -value, suggesting a potential for immediate directional opportunity.

In the best case, the S&P 500 trades higher.

Any activity above the $3,961.25 MCPOC puts into play the $3,997.00 VPOC. Initiative trade beyond the VPOC could reach as high as the $4,016.25 HVNode and $4,055.25 LVNode, or higher.

In the worst case, the S&P 500 trades lower.

Any activity below the $3,961.25 MCPOC puts into play the $3,921.00 VPOC. Initiative trade beyond the VPOC could reach as low as the $3,909.25 MCPOC and $3,867.25 LVNode, or lower.

Click here to load today’s key levels into the web-based TradingView charting platform. Note that all levels are derived using the 65-minute timeframe. New links are produced, daily.
Graphic: 65-minute profile chart of the Micro E-mini S&P 500 Futures.

Definitions

Volume Areas: A structurally sound market will build on areas of high volume (HVNodes). Should the market trend for long periods of time, it will lack sound structure, identified as low volume areas (LVNodes). LVNodes denote directional conviction and ought to offer support on any test. 

If participants were to auction and find acceptance into areas of prior low volume (LVNodes), then future discovery ought to be volatile and quick as participants look to HVNodes for favorable entry or exit.

POCs: POCs are valuable as they denote areas where two-sided trade was most prevalent in a prior day session. Participants will respond to future tests of value as they offer favorable entry and exit.

MCPOCs: POCs are valuable as they denote areas where two-sided trade was most prevalent over numerous day sessions. Participants will respond to future tests of value as they offer favorable entry and exit.

Volume-Weighted Average Prices (VWAPs): A metric highly regarded by chief investment officers, among other participants, for quality of trade. Additionally, liquidity algorithms are benchmarked and programmed to buy and sell around VWAPs.

About

After years of self-education, strategy development, mentorship, and trial-and-error, Renato Leonard Capelj began trading full-time and founded Physik Invest to detail his methods, research, and performance in the markets.

Capelj also develops insights around impactful options market dynamics at SpotGamma and is a Benzinga reporter.

Some of his works include conversations with ARK Invest’s Catherine Wood, investors Kevin O’Leary and John Chambers, FTX’s Sam Bankman-Fried, ex-Bridgewater Associate Andy Constan, Kai Volatility’s Cem Karsan, The Ambrus Group’s Kris Sidial, among many others. 

Disclaimer

In no way should the materials herein be construed as advice. Derivatives carry a substantial risk of loss. All content is for informational purposes only.
Categories
Commentary

Daily Brief For July 26, 2022

The daily brief is a free glimpse into the prevailing fundamental and technical drivers of U.S. equity market products. Join the 300+ that read this report daily, below!

Graphic updated 5:00 AM ET. Sentiment Neutral if expected /ES open is inside of the prior day’s range. /ES levels are derived from the profile graphic at the bottom of the following section. Levels may have changed since initially quoted; click here for the latest levels. SqueezeMetrics Dark Pool Index (DIX) and Gamma (GEX) calculations are based on where the prior day’s reading falls with respect to the MAX and MIN of all occurrences available. A higher DIX is bullish. At the same time, the lower the GEX, the more (expected) volatility. Learn the implications of volatility, direction, and moneyness. Breadth reflects a reading of the prior day’s NYSE Advance/Decline indicator. VIX reflects a current reading of the CBOE Volatility Index (INDEX: VIX) from 0-100.

Fundamental

What’s the theme?

It’s that policymakers are seeking to curb further escalation in inflation expectations so, per Bloomberg, “companies and workers [don’t] act in ways that would push prices ever higher.”

Graphic: Retrieved from Bloomberg.

Adding, despite the potential that the economy is already in recession (bolstered by supply chokepoints, which are “not in the central banking playbook”), per Damped Spring’s Andy Constan, risk premiums, which are the return on investments in excess of the risk-free rate, have expanded substantially on the anticipation of tightening.

Interest rates have risen and are expected to continue rising. Quantitative tightening (QT), which is more of a direct flow of capital to capital markets, on the other hand, just began.

Graphic: Retrieved from the Federal Reserve Bank of Atlanta.

In a write-up, Constan puts forth that “the obvious question is whether the frontrunning of QT has fully priced in?” 

“When looking at the sheer magnitude of the balance sheet reduction both in total reduction amounts and pace the immediate answer and one that we believe is consensus is [NO].” 

Further risk premium expansion is inevitable and, with inflation entrenched, the odds are against central banks. Notwithstanding, with the Fed planning “most of its balance sheet reduction to be run-off,” which is opting to “not reinvest the proceeds from maturing assets they own,” as well as the Treasury’s halving of “the amount of coupon issuance that the market must absorb,” Constan puts forth that the “Fed is done for the summer.”

“Our expectation is that the Fed will continue to validate the current path. That will result in less surprise and falling asset volatility” as investors realize “they are now under-risked,” which may drive a “risk premium contraction over the near term.”

Adding, on the topic of earnings, operating leverage may “provide some buffer for input costs to inflate more than revenue without hitting margin growth.” This factors into Constan’s optimism.

Positioning

As of 5:00 AM ET, Tuesday’s expected volatility, via the Cboe Volatility Index (INDEX: VIX), sits at ~1.25%. Net gamma exposures remain positive and may continue to promote tighter ranges.

Given where realized (RVOL) and implied (IVOL) volatility measures are, as well as skew, it is beneficial to be a buyer of short-dated complex options structures (e.g., low-cost call ratios).

Graphic: Retrieved from Goldman Sachs Group Inc (NYSE: GS).

The reason why? 

In short, per Kai Volatility’s Cem Karsan, the “tail risks are building” and no longer is volatility likely to be pinned by sentiment and positioning, as well as the hedging on the equity volatility.

For more, the very detailed Daily Brief for July 21, 2022, explained it best. Check that out, here.

Graphic: Retrieved from Interactive Brokers Group Inc’s (NASDAQ: IBKR) Trader Workstation. Posted by SpotGamma. Short-dated, pre-FOMC, volatility is sold. Longer-dated, post-FOMC volatility is bid. “The IV decline likely stalls ahead of Wednesday FOMC, which stalls equities.”

Technical

As of 5:00 AM ET, Tuesday’s regular session (9:30 AM – 4:00 PM ET), in the S&P 500, is likely to open in the middle part of a balanced overnight inventory, inside of prior-range and -value, suggesting a limited potential for immediate directional opportunity.

In the best case, the S&P 500 trades higher.

Any activity above the $3,965.00 VPOC puts into play the $3,997.00 VPOC. Initiative trade beyond the $3,997.00 VPOC could reach as high as the $4,016.25 HVNode and $4,055.25 LVNode, or higher.

In the worst case, the S&P 500 trades lower.

Any activity below the $3,965.00 VPOC puts into play the $3,943.25 HVNode. Initiative trade beyond the HVNode could reach as low as the $3,909.25 MCPOC and $3,867.25 LVNode, or lower.

Click here to load today’s key levels into the web-based TradingView charting platform. Note that all levels are derived using the 65-minute timeframe. New links are produced, daily.
Graphic: 65-minute profile chart of the Micro E-mini S&P 500 Futures.

Considerations: The market is in balance.

This is rotational trade that denotes current prices offer favorable entry and exit. Balance areas make it easy to spot a change in the market (i.e., the transition from two-time frame trade, or balance, to one-time frame trade, or trend). 

Modus operandi is responsive trade (i.e., fade the edges), rather than initiative trade (i.e., play the break).

Definitions

Volume Areas: A structurally sound market will build on areas of high volume (HVNodes). Should the market trend for long periods of time, it will lack sound structure, identified as low volume areas (LVNodes). LVNodes denote directional conviction and ought to offer support on any test. 

If participants were to auction and find acceptance into areas of prior low volume (LVNodes), then future discovery ought to be volatile and quick as participants look to HVNodes for favorable entry or exit.

POCs: POCs are valuable as they denote areas where two-sided trade was most prevalent in a prior day session. Participants will respond to future tests of value as they offer favorable entry and exit.

MCPOCs: POCs are valuable as they denote areas where two-sided trade was most prevalent over numerous day sessions. Participants will respond to future tests of value as they offer favorable entry and exit.

Volume-Weighted Average Prices (VWAPs): A metric highly regarded by chief investment officers, among other participants, for quality of trade. Additionally, liquidity algorithms are benchmarked and programmed to buy and sell around VWAPs.

About

After years of self-education, strategy development, mentorship, and trial-and-error, Renato Leonard Capelj began trading full-time and founded Physik Invest to detail his methods, research, and performance in the markets.

Capelj also develops insights around impactful options market dynamics at SpotGamma and is a Benzinga reporter.

Some of his works include conversations with ARK Invest’s Catherine Wood, investors Kevin O’Leary and John Chambers, FTX’s Sam Bankman-Fried, ex-Bridgewater Associate Andy Constan, Kai Volatility’s Cem Karsan, The Ambrus Group’s Kris Sidial, among many others.

Disclaimer

In no way should the materials herein be construed as advice. Derivatives carry a substantial risk of loss. All content is for informational purposes only.
Categories
Commentary

Daily Brief For July 21, 2022

The daily brief is a free glimpse into the prevailing fundamental and technical drivers of U.S. equity market products. Join the 300+ that read this report daily, below!

Graphic updated 6:30 AM ET. Sentiment Neutral if expected /ES open is inside of the prior day’s range. /ES levels are derived from the profile graphic at the bottom of the following section. Levels may have changed since initially quoted; click here for the latest levels. SqueezeMetrics Dark Pool Index (DIX) and Gamma (GEX) calculations are based on where the prior day’s reading falls with respect to the MAX and MIN of all occurrences available. A higher DIX is bullish. At the same time, the lower the GEX, the more (expected) volatility. Learn the implications of volatility, direction, and moneyness. Breadth reflects a reading of the prior day’s NYSE Advance/Decline indicator. VIX reflects a current reading of the CBOE Volatility Index (INDEX: VIX) from 0-100.

Note: Looking back, yesterday’s letter was “eh” to put it simply.

So, here’s a discussion in the positioning section that tidies up some of the past analyses we’ve made. Also, I will be off Friday, July 22, 2022, through to Tuesday, July 26, 2022. 

Thank you for all the support and I look forward to hitting next week, hard, with you! Take care!

Positioning

As of 6:30 AM ET, Thursday’s expected volatility, via the Cboe Volatility Index (INDEX: VIX), sits at ~1.25%. Net gamma exposures increasing may help tighten equity index ranges.

Graphic: Via Physik Invest. Data retrieved from SqueezeMetrics.

Given where realized (RVOL) and implied (IVOL) volatility measures are, as well as skew, it is beneficial to be a buyer of short-dated complex options structures (e.g., low-cost call ratios) that are short those options that have the most to lose in an SPX up, VIX down environment.

Graphic: Via Physik Invest. Data retrieved from the Cboe and TradingView.

The reason why? 

Kai Volatility’s Cem Karsan explained it well in a conversation he had with the Charles Schwab Inc-owned (NYSE: SCHW) TD Ameritrade Network.

Heading into the 2022 decline, institutions were well hedged. Their monetization of hedges, as well as the demand for certain equity options structures (and the hedging of them) into the fall, lent to supply and compressed volatility on a fixed strike basis, relative to that in other markets.

Graphic: Retrieved from QVR Advisors’ Benn Eifert.

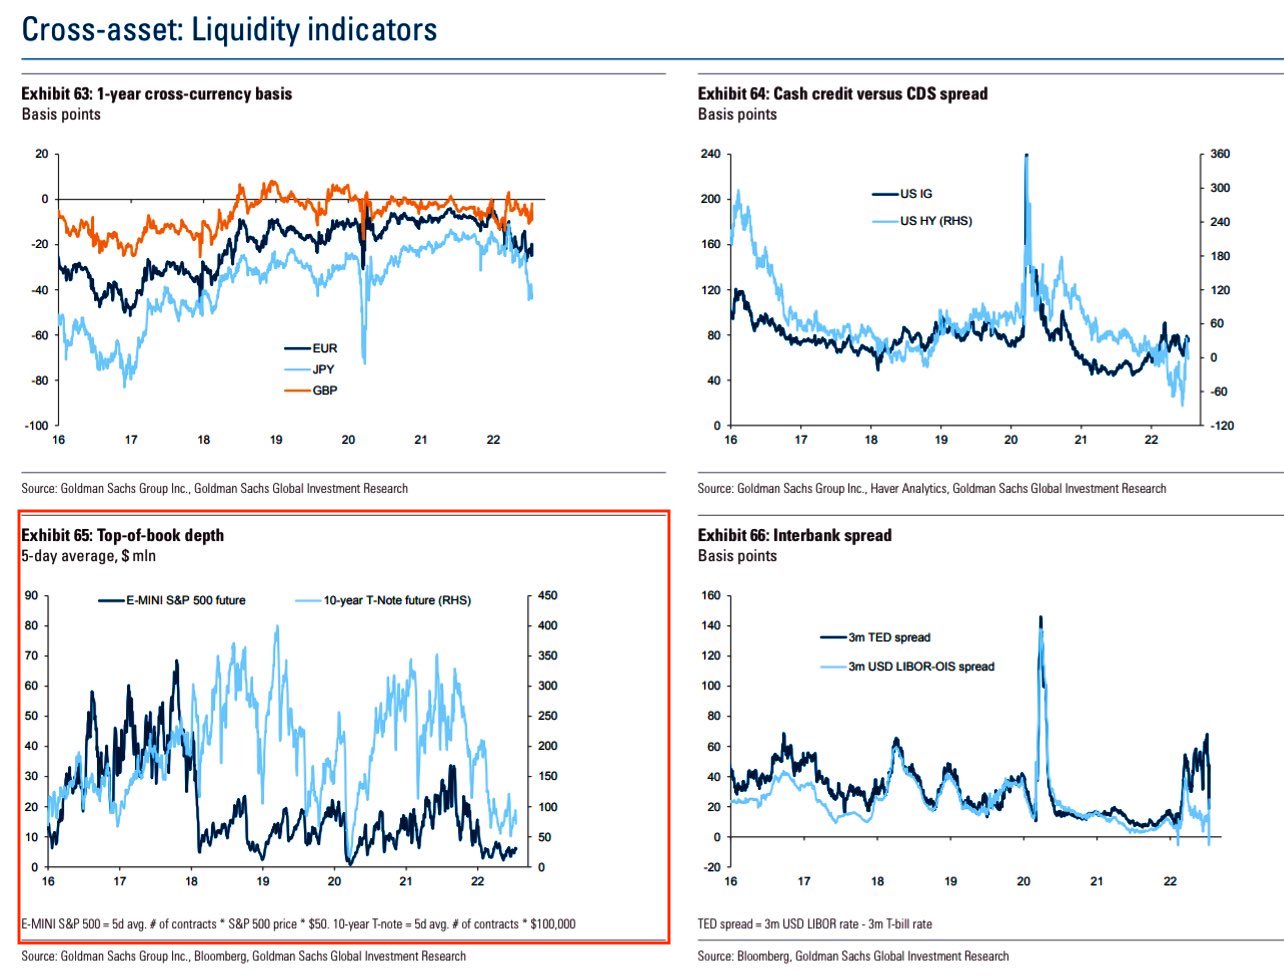
Volatility supply, coupled with the lower liquidity environment, results in hedging pressures that (matter more) and lend to index mean reversion which Karsan posits may be coming to an end.

Graphic: Retrieved from Goldman Sachs Group Inc (NYSE: GS).

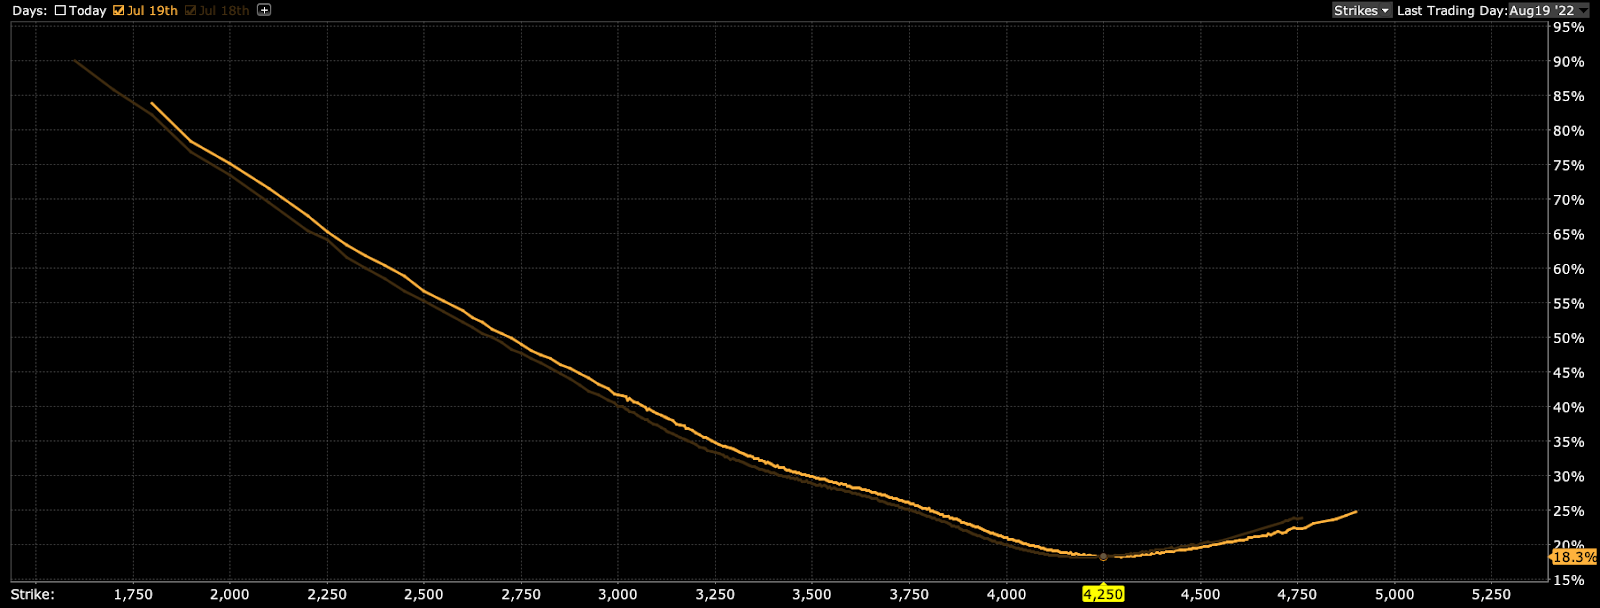
In validating his thesis, Karsan pointed to fixed strike volatility jumping in spite of the equity rally.

Graphic: Time-lapse skew on the S&P 500 (INDEX: SPX) for July 18 and July 19, 2022. Retrieved from Interactive Brokers Group Inc’s (NASDAQ: IBKR) Trader Workstation.

“This is the beginning of an untethering,” he explained. “If we see a rally here, IVOL will likely increase on a fixed strike basis. If that does, that will continue to untether index volatility which has been one of the most supportive things into the decline.”

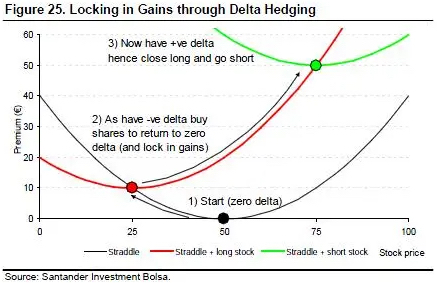
For context, on the latter remark, when volatility is supplied by the customer, the counterparty, which is on the other side, has exposure to long volatility. All else equal, on directional moves, long volatility positions will reprice for the counterparty favorably.

To re-hedge, the counterparty will buy weakness (against increased negative delta) and sell strength (against increased positive delta). Below is a naive example of the effects of delta hedging a straddle on profit and loss.

Graphic: Retrieved from Banco Santander SA (NYSE: SAN).

Moreover, these shifts are suggestive of weakening market support, in the face of a macro and geopolitical environment that’s not improving. Quantitative tightening (QT), which is “the direct input of capital to capital markets” is set to double on September 1, 2022, all the while there is likely to be compression on earnings, and a break up in risk premiums across markets.

The “tail risks are building” and no longer is volatility likely to be pinned by (1) sentiment and positioning, as well as (2) hedging on the equity volatility side, Karsan added.

Graphic: Shared by Benn Eifert of QVR Advisors.

“As you squeeze entities out on the upside of that short positioning, and volatility itself, on the equity side, becomes less and less hedged on the customer level, which we’re beginning to see, the market can really begin to respond to the core macro factors.”

With a more volatile second leg down in play, Karsan says higher prices, in spite of small blips in IVOL on a fixed strike basis, will offer participants an opportunity to “add to volatility hedges.”

Likewise, with call options outperforming “their delta to the upside,” it makes much sense to replace static equity long exposure with that which is dynamic.

“The bare minimum, if you’re long equities, is to be expressing that in calls,” Karsan ends. S&P 500 calls are at a “17.5 and 18 volatility. If we continue to slide, the VIX [likely won’t] slide below 20 in this environment, given the macro risk.”

Technical

As of 6:30 AM ET, Thursday’s regular session (9:30 AM – 4:00 PM ET), in the S&P 500, is likely to open in the middle part of a balanced overnight inventory, inside of prior-range and -value, suggesting a limited potential for immediate directional opportunity.

In the best case, the S&P 500 trades higher.

Any activity above the $3,943.25 HVNode puts into play the $3,982.75 LVNode. Initiative trade beyond the LVNode could reach as high as the $4,016.25 HVNode and $4,055.25 LVNode, or higher.

In the worst case, the S&P 500 trades lower.

Any activity below the $3,943.25 HVNode puts into play the $3,909.25 MCPOC. Initiative trade beyond the MCPOC could reach as low as the $3,867.25 LVNode and $3,829.75 MCPOC, or lower.

Click here to load today’s key levels into the web-based TradingView charting platform. Note that all levels are derived using the 65-minute timeframe. New links are produced, daily.
Graphic: Updated July 20, 2022. 65-minute profile chart of the Micro E-mini S&P 500 Futures.

Definitions

Volume Areas: A structurally sound market will build on areas of high volume (HVNodes). Should the market trend for long periods of time, it will lack sound structure, identified as low volume areas (LVNodes). LVNodes denote directional conviction and ought to offer support on any test. 

If participants were to auction and find acceptance into areas of prior low volume (LVNodes), then future discovery ought to be volatile and quick as participants look to HVNodes for favorable entry or exit.

POCs: POCs are valuable as they denote areas where two-sided trade was most prevalent in a prior day session. Participants will respond to future tests of value as they offer favorable entry and exit.

MCPOCs: POCs are valuable as they denote areas where two-sided trade was most prevalent over numerous day sessions. Participants will respond to future tests of value as they offer favorable entry and exit.

Volume-Weighted Average Prices (VWAPs): A metric highly regarded by chief investment officers, among other participants, for quality of trade. Additionally, liquidity algorithms are benchmarked and programmed to buy and sell around VWAPs.

About

After years of self-education, strategy development, mentorship, and trial-and-error, Renato Leonard Capelj began trading full-time and founded Physik Invest to detail his methods, research, and performance in the markets.

Capelj also develops insights around impactful options market dynamics at SpotGamma and is a Benzinga reporter.

Some of his works include conversations with ARK Invest’s Catherine Wood, investors Kevin O’Leary and John Chambers, FTX’s Sam Bankman-Fried, ex-Bridgewater Associate Andy Constan, Kai Volatility’s Cem Karsan, The Ambrus Group’s Kris Sidial, among many others.

Disclaimer

In no way should the materials herein be construed as advice. Derivatives carry a substantial risk of loss. All content is for informational purposes only.
Categories
Commentary

Daily Brief For July 18, 2022

The daily brief is a free glimpse into the prevailing fundamental and technical drivers of U.S. equity market products. Join the 300+ that read this report daily, below!

Graphic updated 6:30 AM ET. Sentiment Risk-On if expected /ES open is above the prior day’s range. /ES levels are derived from the profile graphic at the bottom of the following section. Levels may have changed since initially quoted; click here for the latest levels. SqueezeMetrics Dark Pool Index (DIX) and Gamma (GEX) calculations are based on where the prior day’s reading falls with respect to the MAX and MIN of all occurrences available. A higher DIX is bullish. At the same time, the lower the GEX, the more (expected) volatility. Learn the implications of volatility, direction, and moneyness. Breadth reflects a reading of the prior day’s NYSE Advance/Decline indicator. VIX reflects a current reading of the CBOE Volatility Index (INDEX: VIX) from 0-100.

Fundamental

Positivity across most products we monitor in this letter. This is alongside participants’ paring of bets on more aggressive Federal Reserve (Fed) action. It was just last week, right after the CPI dump, that participants were pricing a near-50% chance of a 100 basis point rate hike in July.

That is no longer the case. The odds are 60-40 in favor of a 50 to 75 basis point hike.

Graphic: Via CME Group Inc’s (NASDAQ: CME) FedWatch Tool.

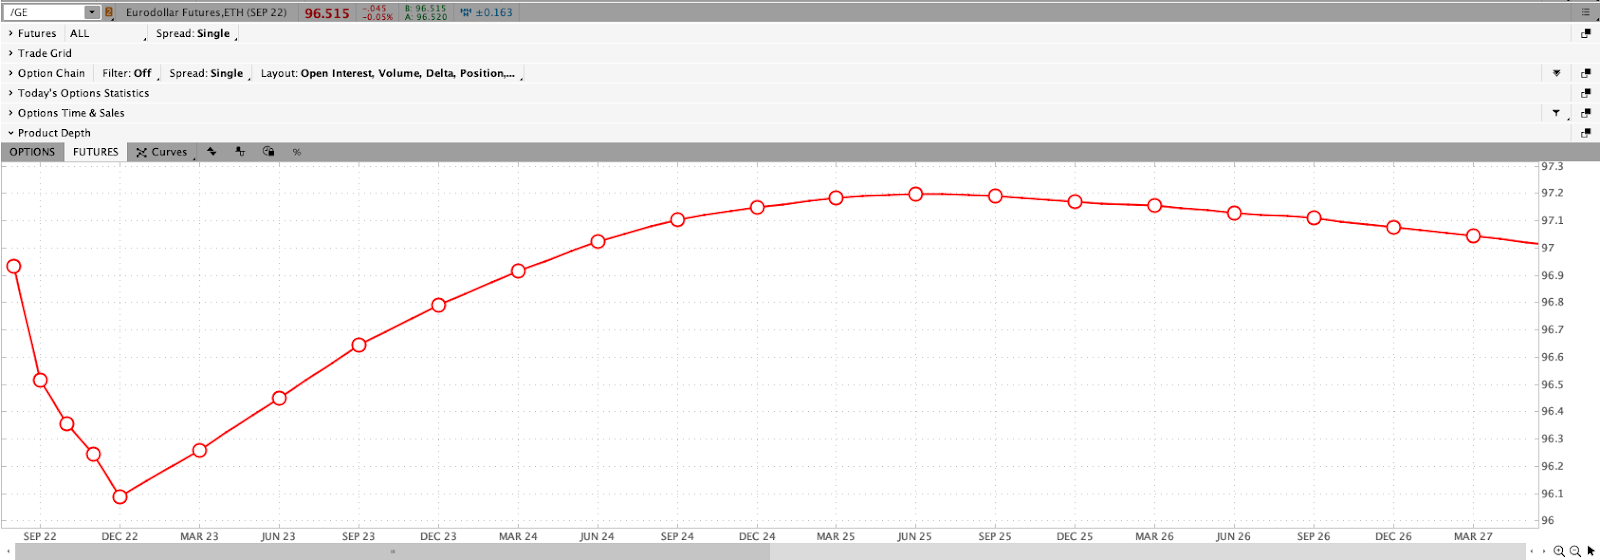
A quick check of the Eurodollar (FUTURE: /GE) curve, a reflection of participants’ outlook on interest rates, we see a peak of the Fed-rate-hike cycle – the terminal rate – near DEC 2022.

Below, we see the overnight rate expected to peak near 3.915% by late 2022.

Graphic: Via Charles Schwab Corporation-owned (NYSE: SCHW) TD Ameritrade’s Thinkorswim.

For context, the price of /GE reflects the interest offered on U.S. dollar-denominated deposits at banks outside of the U.S. With that, they’re “expressed numerically using 100 minus the implied 3-month U.S. dollar LIBOR interest rate,” per Investopedia. This means that at current DEC 2022 prices (96.085), this reflects an implied interest rate settlement rate of 3.915%.

Read: The shift from the Eurodollar to SOFR is accelerating as “SOFR adoption cracked 50%.”

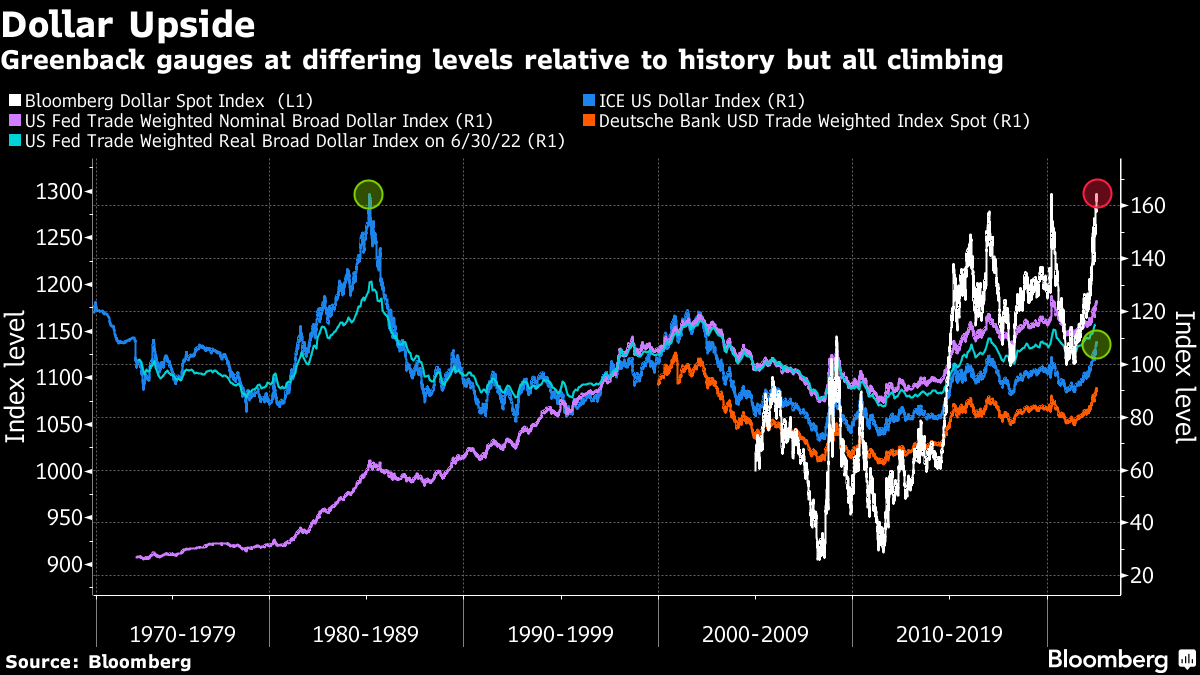
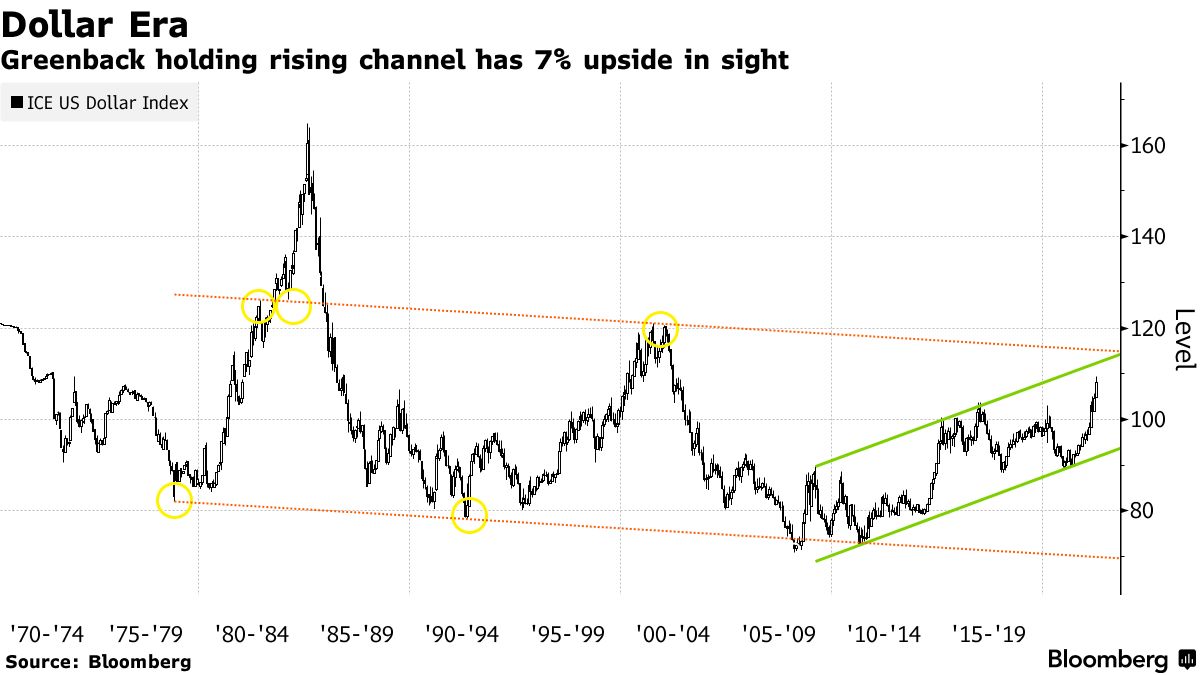
The U.S. Dollar (INDEX: DXY), though it is generally far stronger on pressures (e.g., recession, geopolitics) elsewhere, eased.

Read: Why the U.S. Dollar is booming and creating a possible doom loop and Sunak takes the lead in the voting for U.K. Prime Minister, as well as China weighs mortgage grace period to appease angry home buyers and the ECB case for a half-point rate hike just won’t go away.
Graphic: Via Bloomberg.

Further, it is policy adjustments that are inflicting damage on some inflated areas of the market like crypto and private equity.

Recall that prevailing monetary policies made it easier to borrow and make longer-duration bets on ideas with a lot of promise in the future. Central banks, too, underwrote losses of this regime and encouraged continued growth. This had consequences on the real economy and asset prices which rose and kept deflationary pressures at bay.

As well put forth in our May 18, 2022 commentary, the recent market rout is a recession and the direct reflection of the unwind of carry. Capital was “misallocated” and the Fed’s move to control price stability is “completely unreasonable” as they’re not in a position to do it “without bringing down the markets,” per Kai Volatility’s Cem Karsan.

Read: Kris Abdelmessih’s Moontower #148 on prevailing macroeconomic perspectives.

A prospective hit in demand is in the context of improvement among supply chains, as Citigroup Inc (NYSE: C) economists explain

Graphic: Via Bloomberg.

“The bad news is that this looks to be occurring on the back of a slowing in the global consumer’s demand for goods, especially discretionary goods, and thus may also signal rising recession risks.”

Graphic: Via Bloomberg. “Carmakers registered the fewest new vehicles in the European Union since 1996 as persistent supply chain snarls and record inflation afflict the industry. New-car sales in the EU and four other states tracked by the European Automobile Manufacturers’ Association fell 17% to 1.07 million last month, according to a statement. Volkswagen AG was the hardest-hit major carmaker, with registrations dropping 24% from a year ago.”

It is the case that as the “Fed is pursuing demand destruction through negative wealth effects,” it will, ultimately, pivot because “central banks can only deal with nominal [and] not real chokepoints,” according to Credit Suisse Group AG’s (NYSE: CS) Zoltan Pozsar.

Read: Despite stronger than expected retail sales, inflation adjustments point to a leveling-off.

The “risk of recession, whether it is real or merely implied by an inversion of the yield curve, won’t deter the Fed from hiking rates higher faster or from injecting more volatility to build up negative wealth effects.” 

“Rallies could beget more forceful pushback from the Fed – the new game.”

Watch: Quantitative Tightening is the direct flow of capital to capital markets.

Positioning

Please check out the Daily Brief for July 15, 2022. There we summarized, well, the implication of the macro landscape and options positioning.

The summary was that with commodities not offering protection, one has to be concerned if “the flock move[s],” per The Ambrus Group’s Kris Sidial and, ultimately, “if you wanted to go out and hedge, the opportunity is still there in the equity space.”

This is as markets are in a window of “non-strength,” says Karsan in the video below.

Technical

As of 6:30 AM ET, Monday’s regular session (9:30 AM – 4:00 PM ET), in the S&P 500, is likely to open in the upper part of a positively skewed overnight inventory, outside of prior-range and -value, suggesting a potential for immediate directional opportunity.

In the best case, the S&P 500 trades higher.

Any activity above the $3,909.25 MCPOC puts into play the $3,943.25 HVNode. Initiative trade beyond the HVNode could reach as high as the $3,982.75 LVNode and $4,016.25 HVNode, or higher.

In the worst case, the S&P 500 trades lower.

Any activity below the $3,909.25 MCPOC puts into play the $3,857.00 VPOC. Initiative trade beyond the VPOC could reach as low as the $3,829.75 MCPOC and $3,800.75 LVNode, or lower.

Click here to load today’s key levels into the web-based TradingView charting platform. Note that all levels are derived using the 65-minute timeframe. New links are produced, daily.
Graphic: 65-minute profile chart of the Micro E-mini S&P 500 Futures.

Considerations: Responsiveness near key-technical areas (that are discernable visually on a chart), suggests technically-driven traders with short time horizons are very active. 

Such traders often lack the wherewithal to defend retests and, additionally, the type of trade may be indicative of the other time frame participants waiting for more information to initiate trades.

Definitions

Volume Areas: A structurally sound market will build on areas of high volume (HVNodes). Should the market trend for long periods of time, it will lack sound structure, identified as low volume areas (LVNodes). LVNodes denote directional conviction and ought to offer support on any test. 

If participants were to auction and find acceptance into areas of prior low volume (LVNodes), then future discovery ought to be volatile and quick as participants look to HVNodes for favorable entry or exit.

POCs: POCs are valuable as they denote areas where two-sided trade was most prevalent in a prior day session. Participants will respond to future tests of value as they offer favorable entry and exit.

MCPOCs: POCs are valuable as they denote areas where two-sided trade was most prevalent over numerous day sessions. Participants will respond to future tests of value as they offer favorable entry and exit.

Volume-Weighted Average Prices (VWAPs): A metric highly regarded by chief investment officers, among other participants, for quality of trade. Additionally, liquidity algorithms are benchmarked and programmed to buy and sell around VWAPs.

About

After years of self-education, strategy development, mentorship, and trial-and-error, Renato Leonard Capelj began trading full-time and founded Physik Invest to detail his methods, research, and performance in the markets.

Capelj also develops insights around impactful options market dynamics at SpotGamma and is a Benzinga reporter.

Some of his works include conversations with ARK Invest’s Catherine Wood, investors Kevin O’Leary and John Chambers, FTX’s Sam Bankman-Fried, former Bridgewater Associate Andy Constan, Kai Volatility’s Cem Karsan, The Ambrus Group’s Kris Sidial, among many others.

Disclaimer

In no way should the materials herein be construed as advice. Derivatives carry a substantial risk of loss. All content is for informational purposes only.