The daily brief is a free glimpse into the prevailing fundamental and technical drivers of U.S. equity market products. Join the 1,190+ that read this report daily, below!
Administrative
After a one-month hiatus, the Daily Brief by Physik Invest is back, albeit with new inspiration and direction.
Previously, the letter was focused on analyses of secondary and tertiary sources. New for the letter will be the inclusion of primary source information. It will be some time before these changes are most noticeable but that’s the general direction.
For instance, interviewing a country’s economic minister on policy and discussing how that policy impacts markets, at the end of it all, is on the table.
That said, apologies for not being there for the past month. I found a lot happened and I could not rid myself of the desire to unpack. This letter helps me structure trades through which real capital is at risk.
Not having the full picture did me a disservice, in short.
Going forward, I will try to feature a good mix of detail and pointedness. Take care and I look forward to learning and earning together!
Fundamental
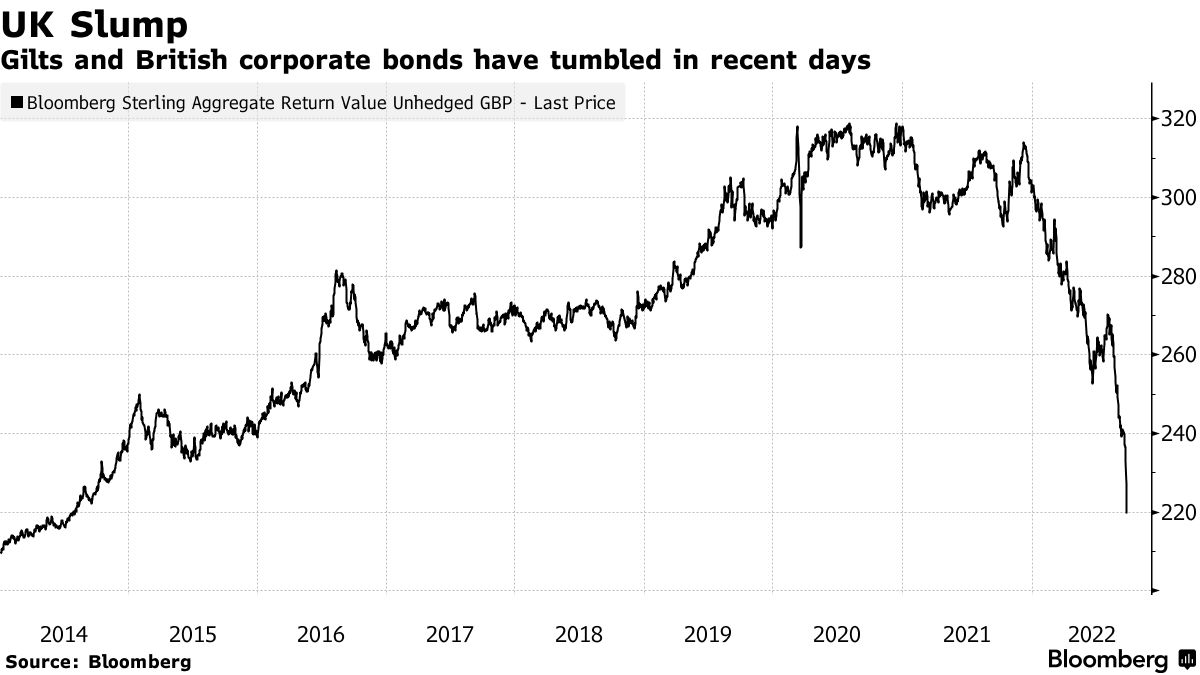
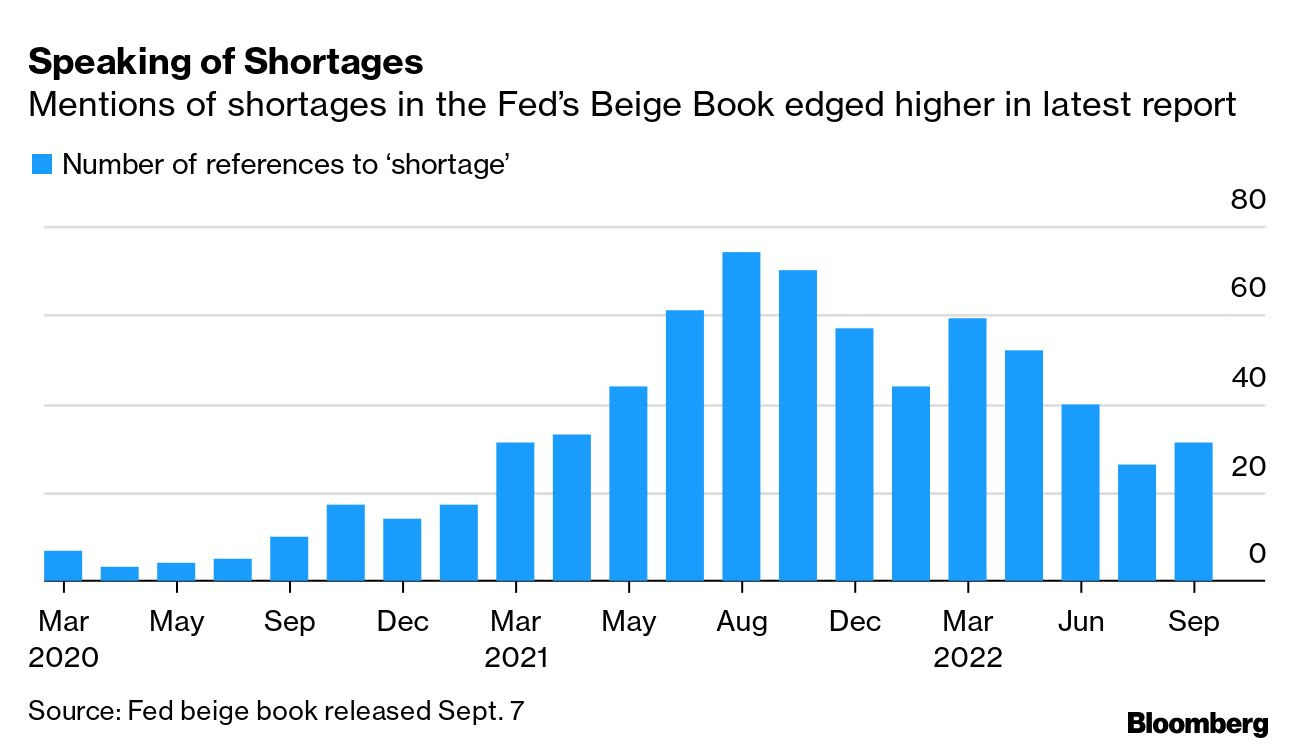
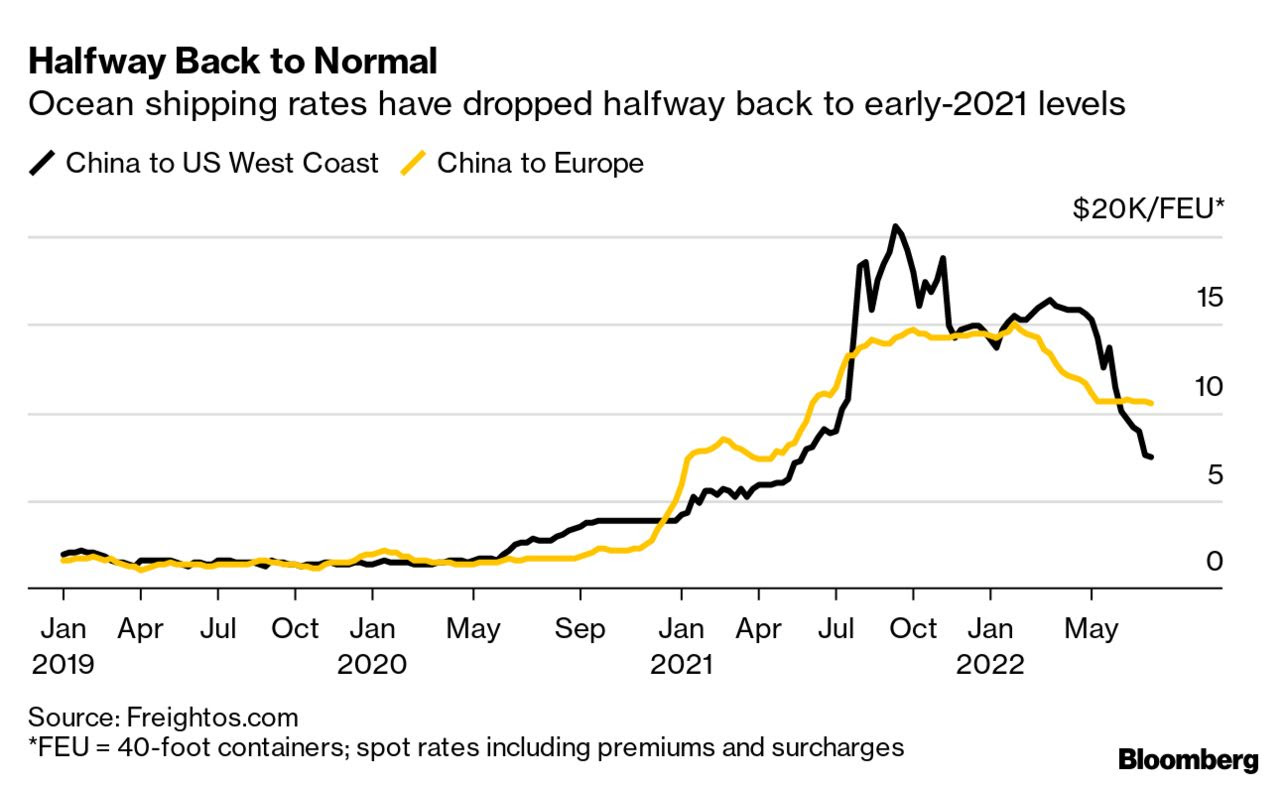
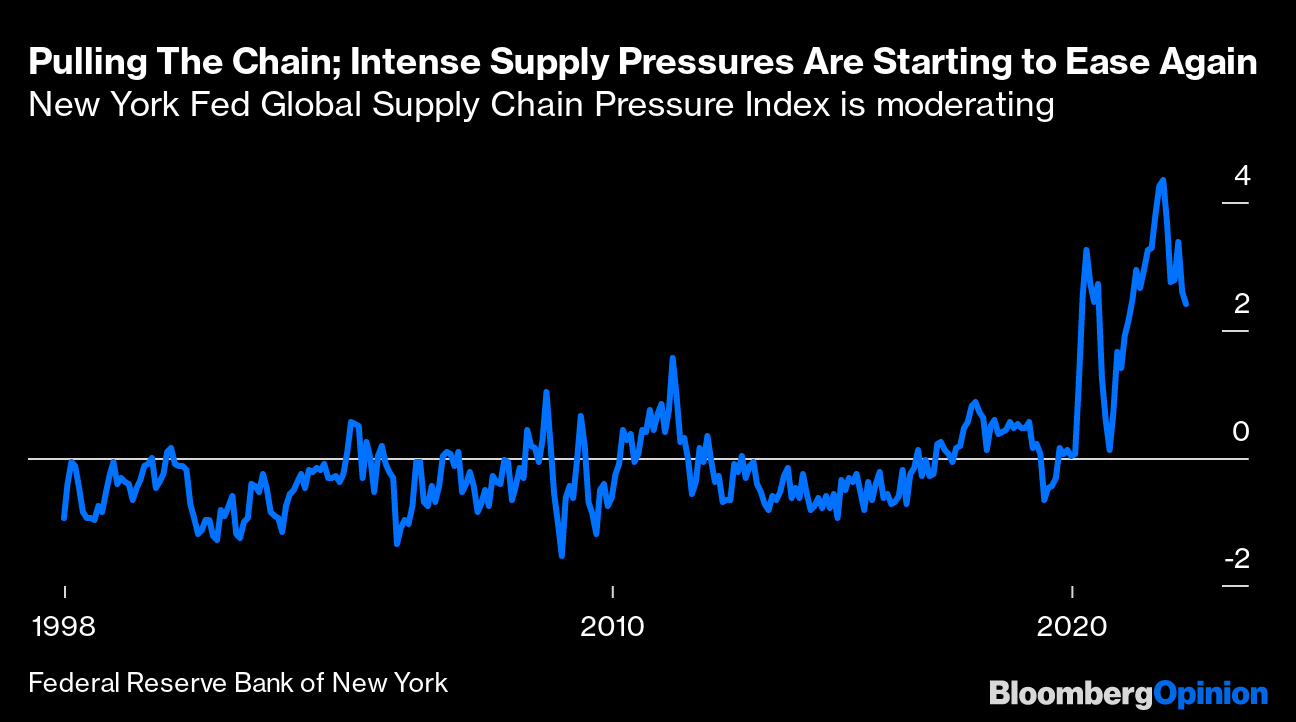
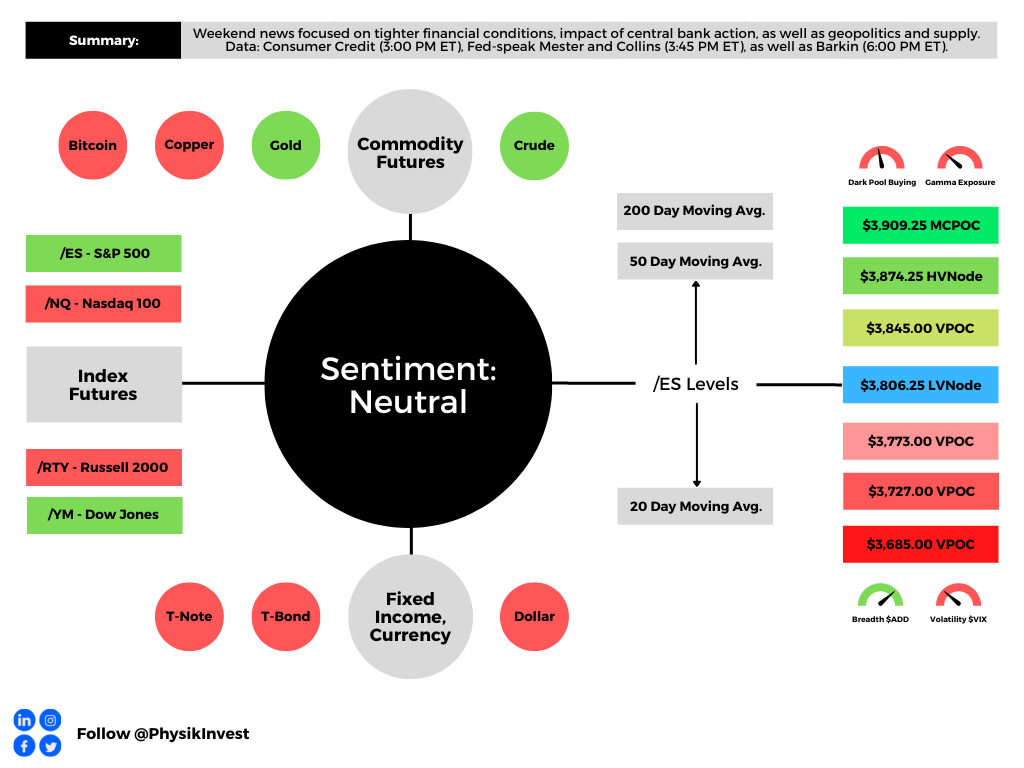
Weekend news was centered around the tightening of financial conditions, the impact of central bank action, as well as geopolitics (e.g., Lithuania opening a trade office in Taiwan), and supply chokepoints.
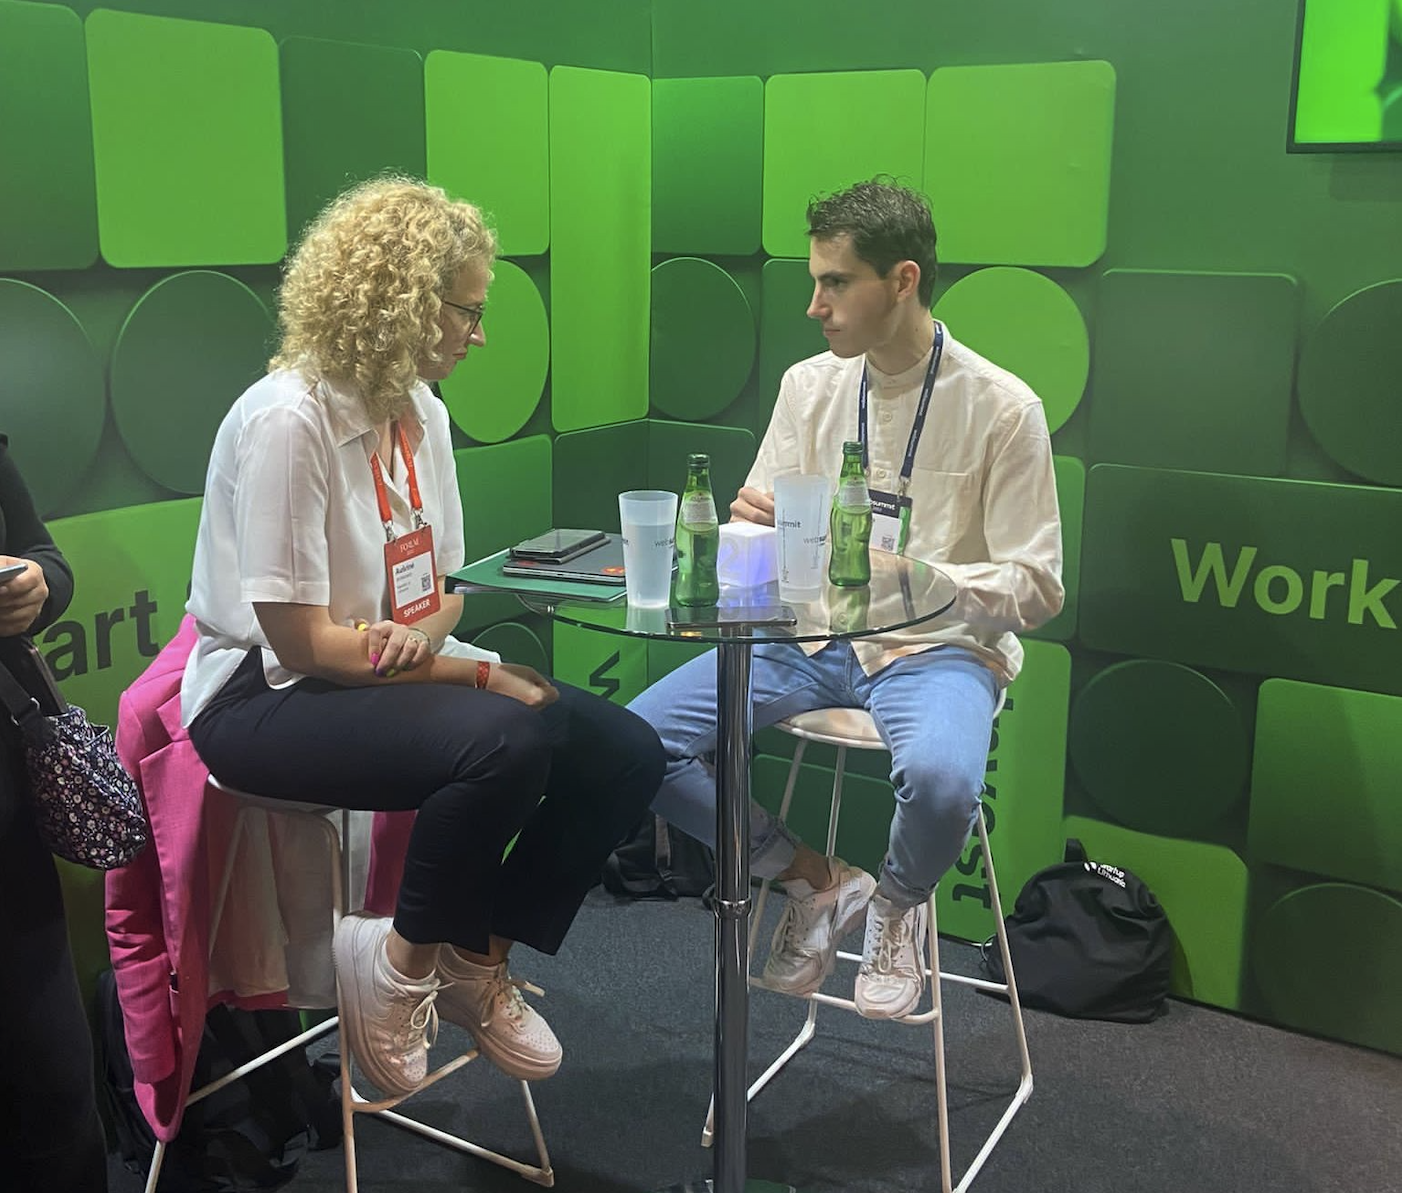
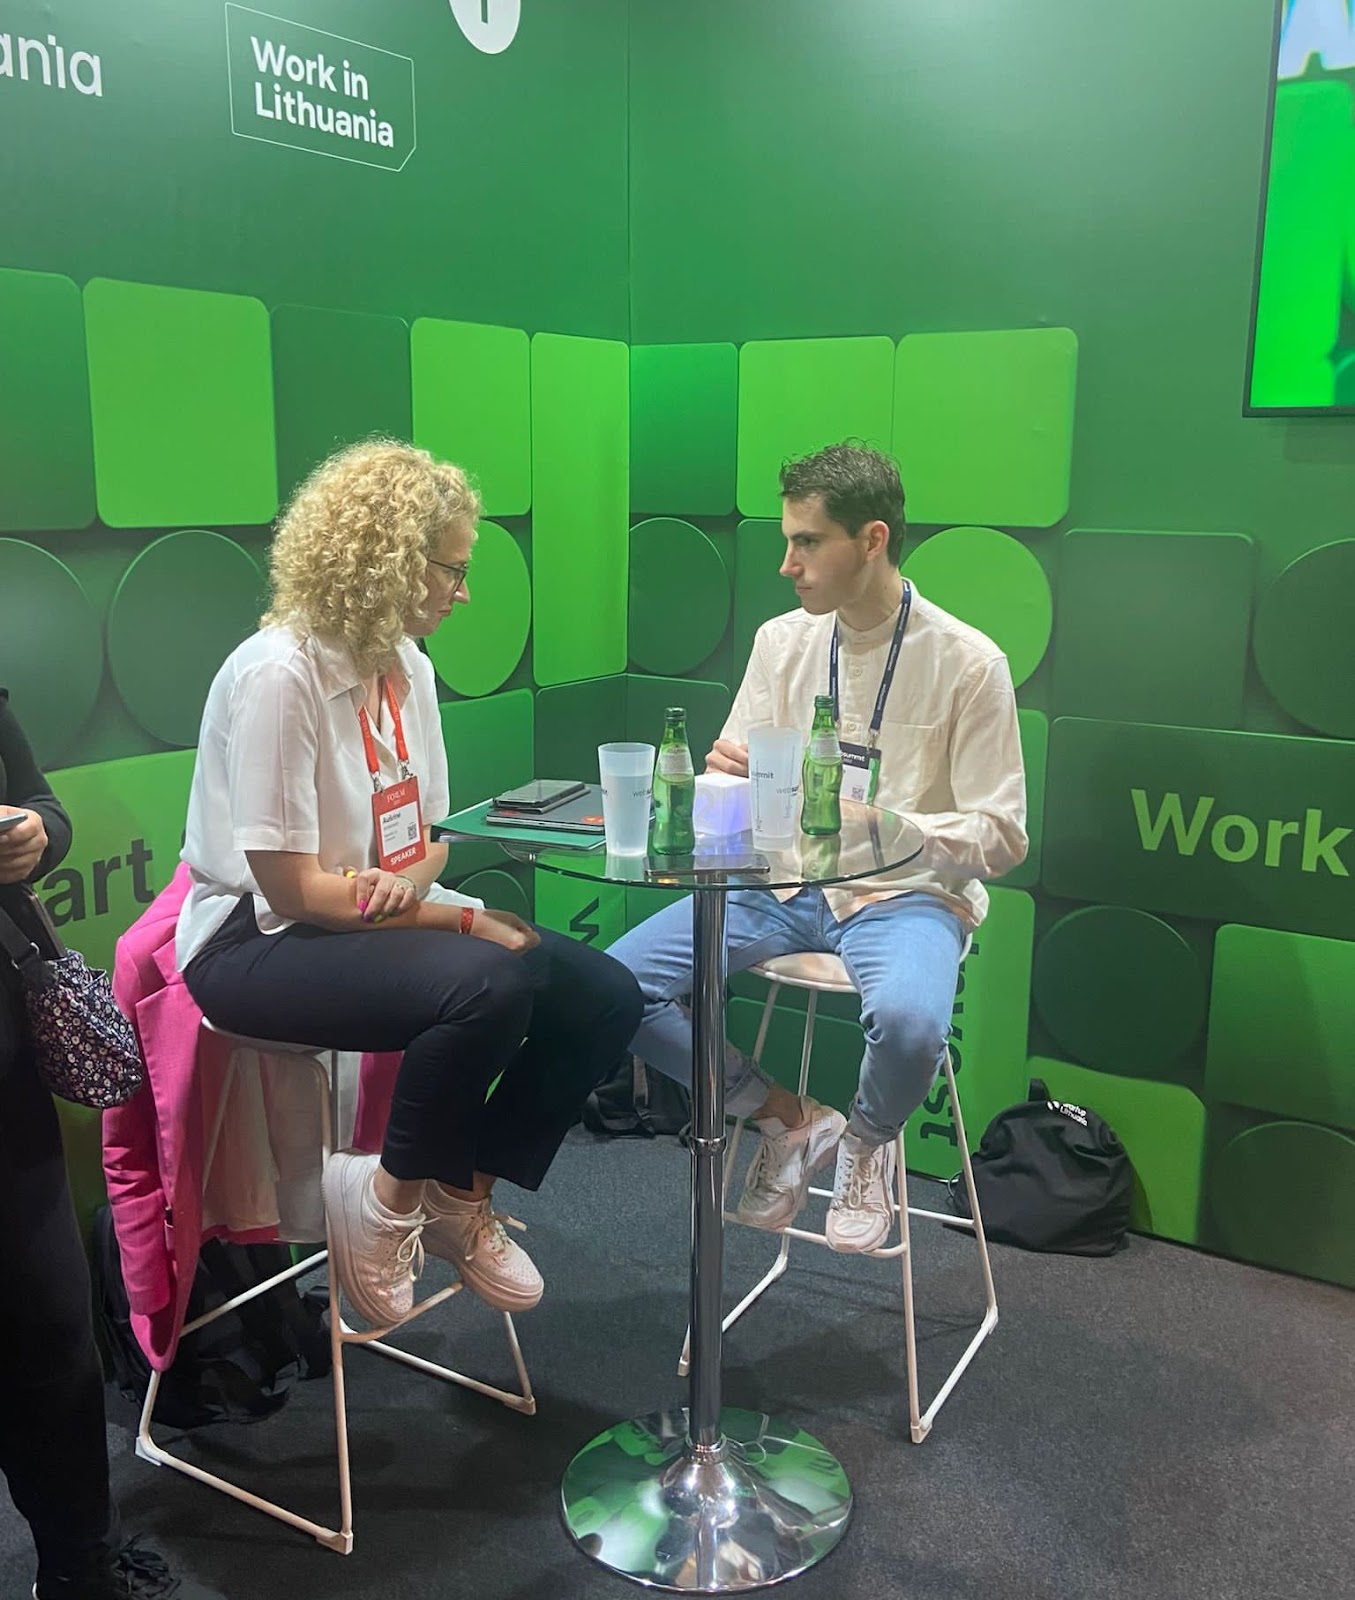
By happenstance, I interviewed the Lithuanian Economy Minister Ausrine Armonaite, quoted by Bloomberg in the above story, last week in Lisbon. More on this, later.
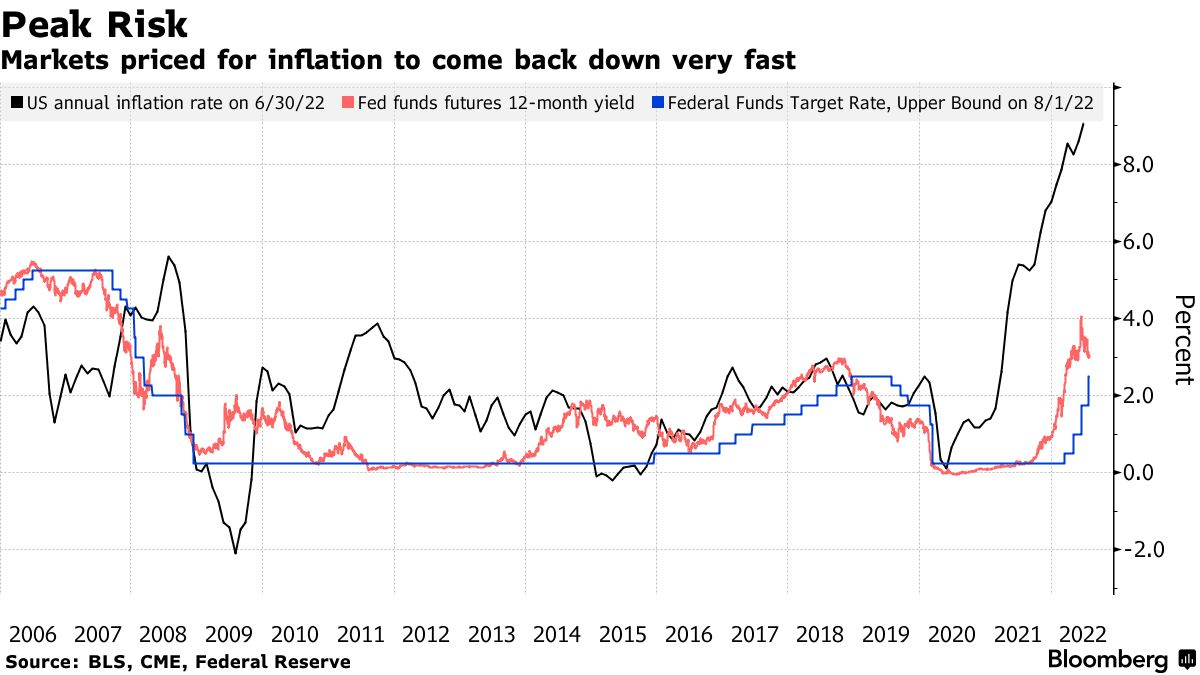
The One Big Thing:
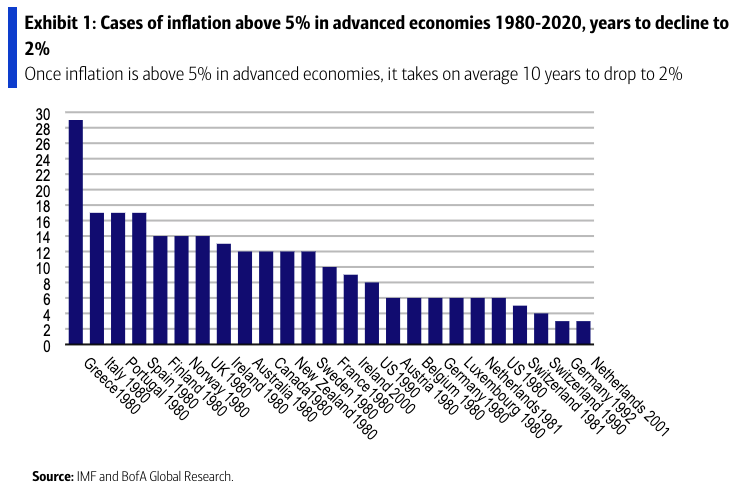
With labor still tight, former New York Fed President Bill Dudley commented that “there’s a lot of work to do … [so] inflation expectations don’t become unanchored” and force “something really, really harsh later.”
Unfortunately, the impact of actions here, in the US, is not isolated.
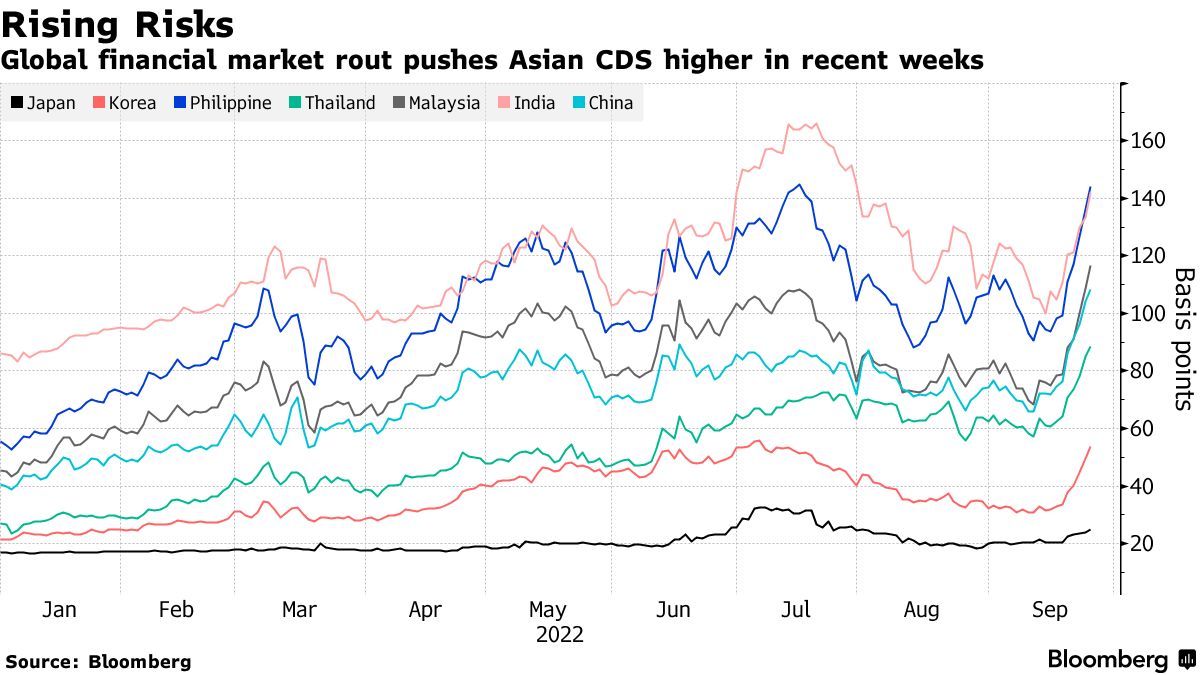
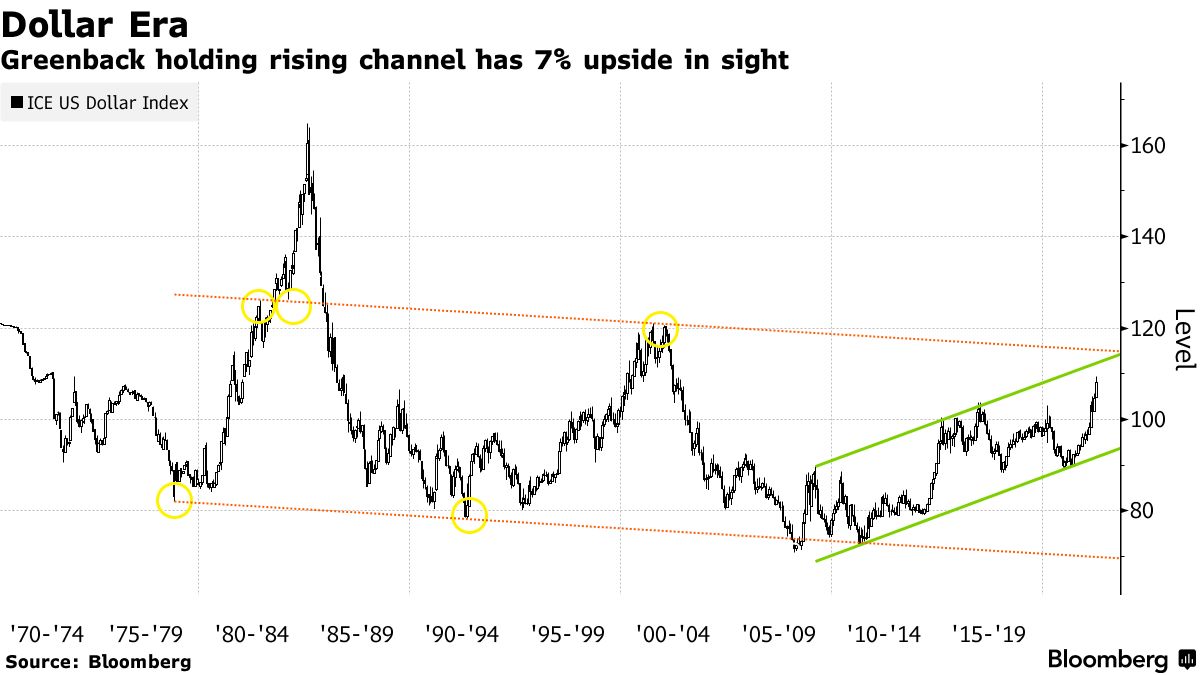
US tightening pains the rest of the world, too. Stronger dollars pressure emerging-market economies with dollar-denominated debts. This, ultimately, works to upend the dollar’s role as a reserve.
Margin Compression, Dollar Debt:
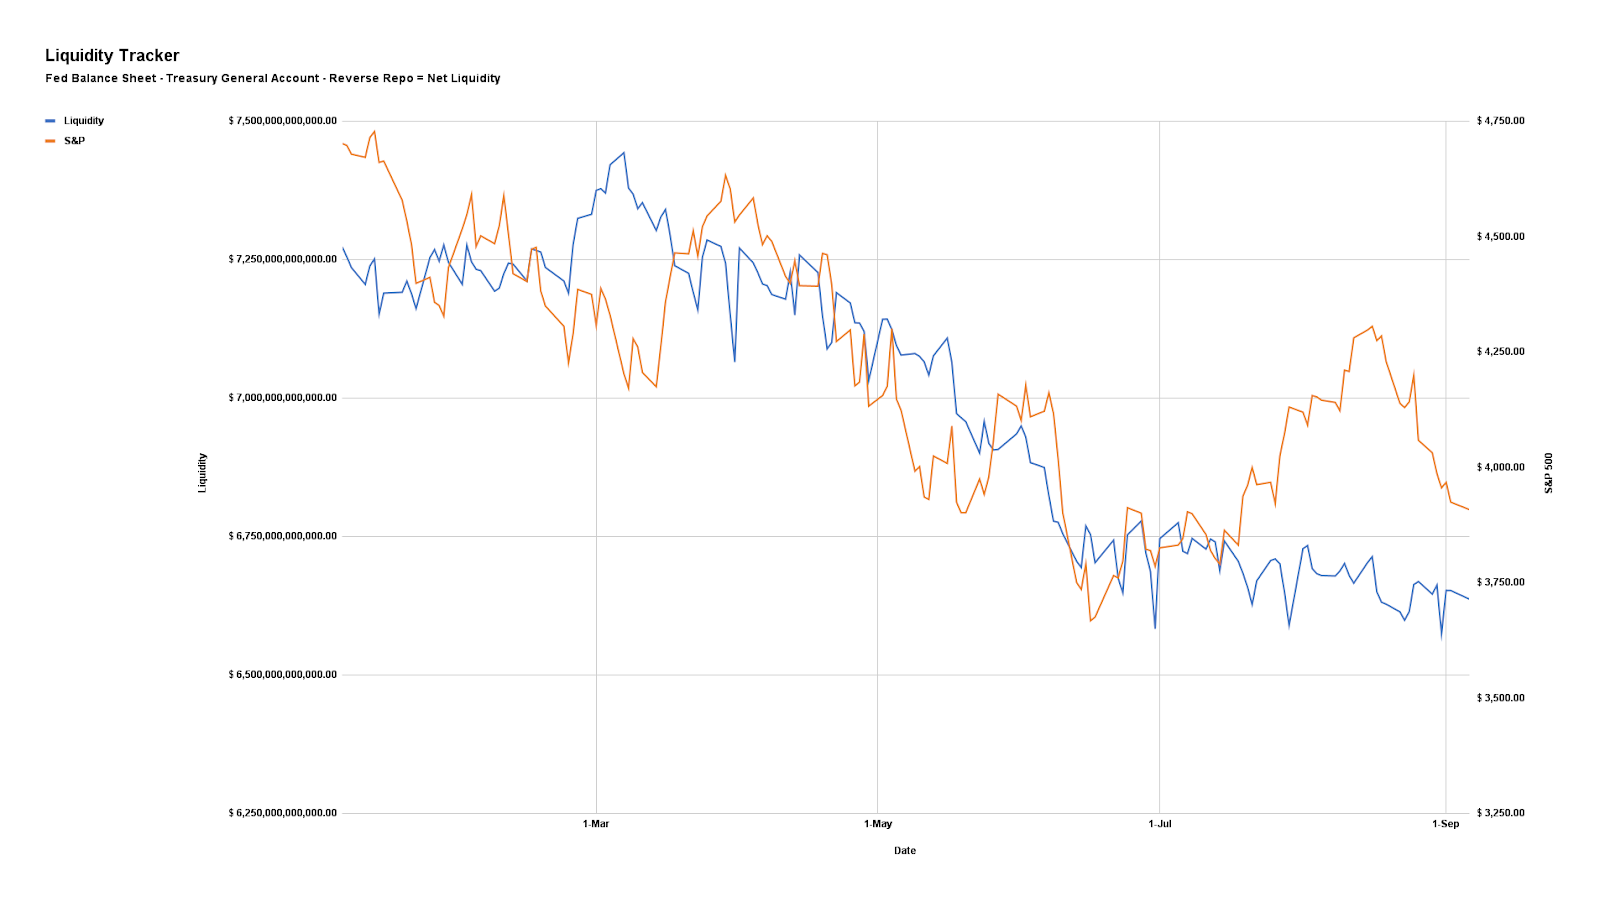
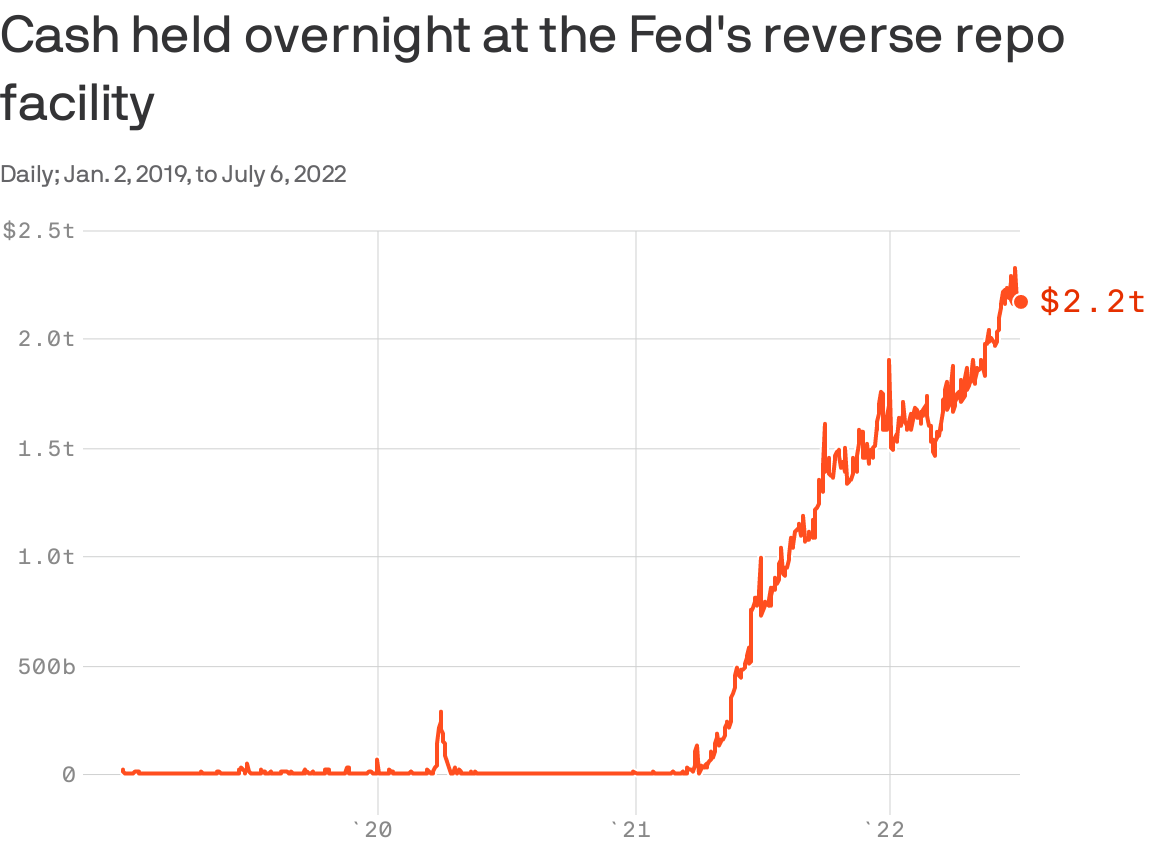
Dollar strength feeds margin compression (just now filtering through, according to Kai Volatility’s Cem Karsan, and impacting dollar-denominated debt), adding to the “billion[s] less in demand for assets per day” via quantitative tightening (QT).
As a refresher, quantitative easing (QE) lowers interest rates and makes investments in financial assets more attractive. This bolsters asset inflation and deflation in the real economy.
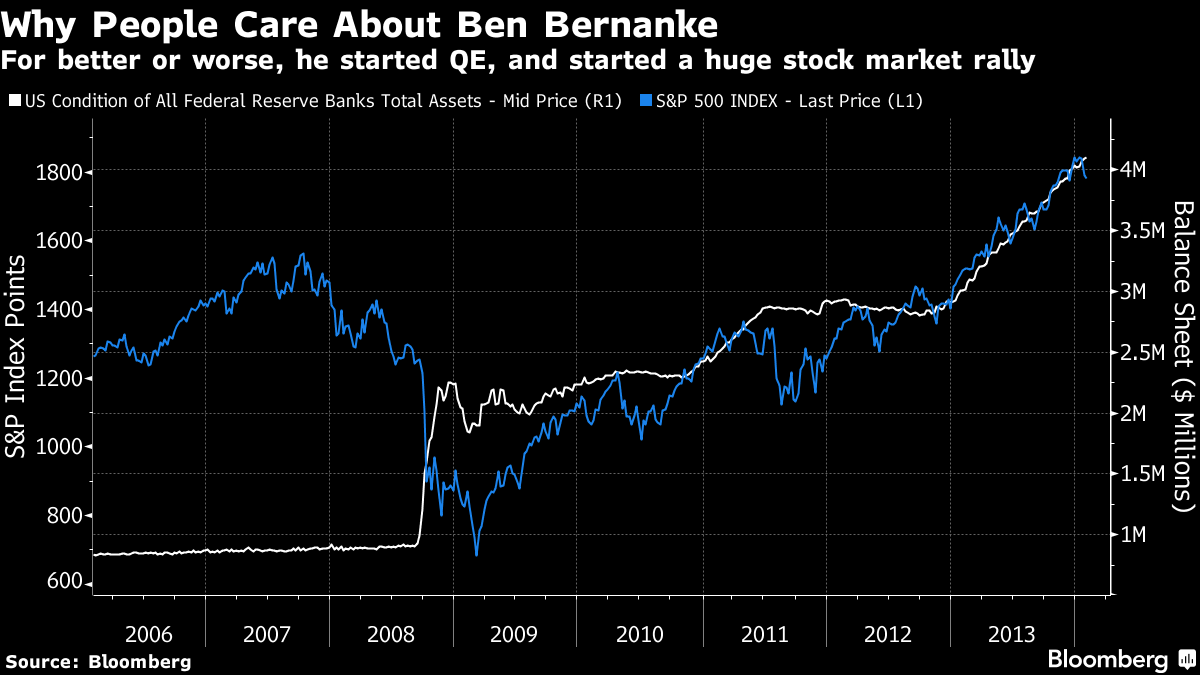
QT Compounds Rising Rate Impact:
Moreover, in 2020, policymakers embarked on historic interventions.
Monetary authorities cut interest rates and bought bonds, all the while money was sent to people. Risk assets were the first to respond. Then, as the economy reopened, demand picked up, supply chains (that were slowed) tightened, and prices in the real economy inflated.
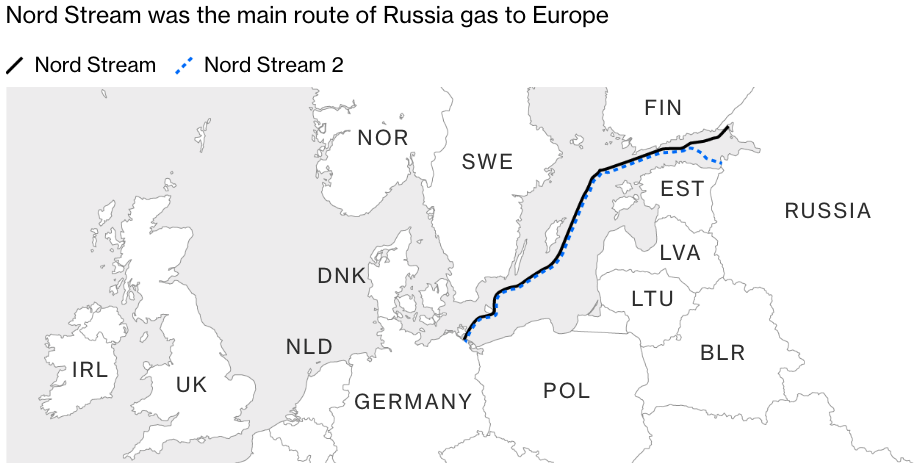
Threats to globalization and persistent supply chokepoints (e.g., Ukraine and Russia) have done little to help. Inflation remains a problem and investors are seeking safety amid Fed intervention.
Financial assets are in less demand while real assets are in more demand; sticky inflation and the policymaker reactions are putting in jeopardy dollar carry (mentioned above) and the S&P 500, a focus point for this letter and a center of the global carry regime, among other things.
Responses Invoke Collateral Damage:
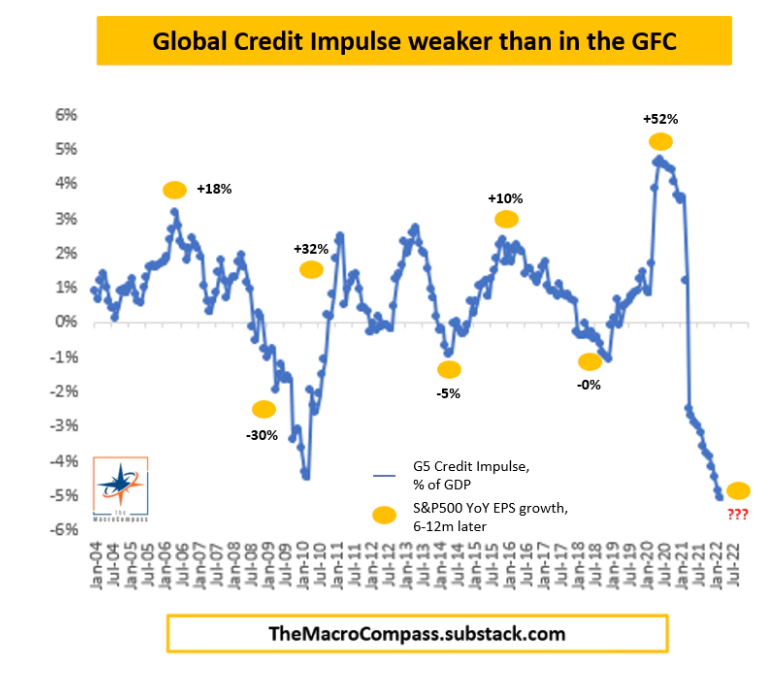
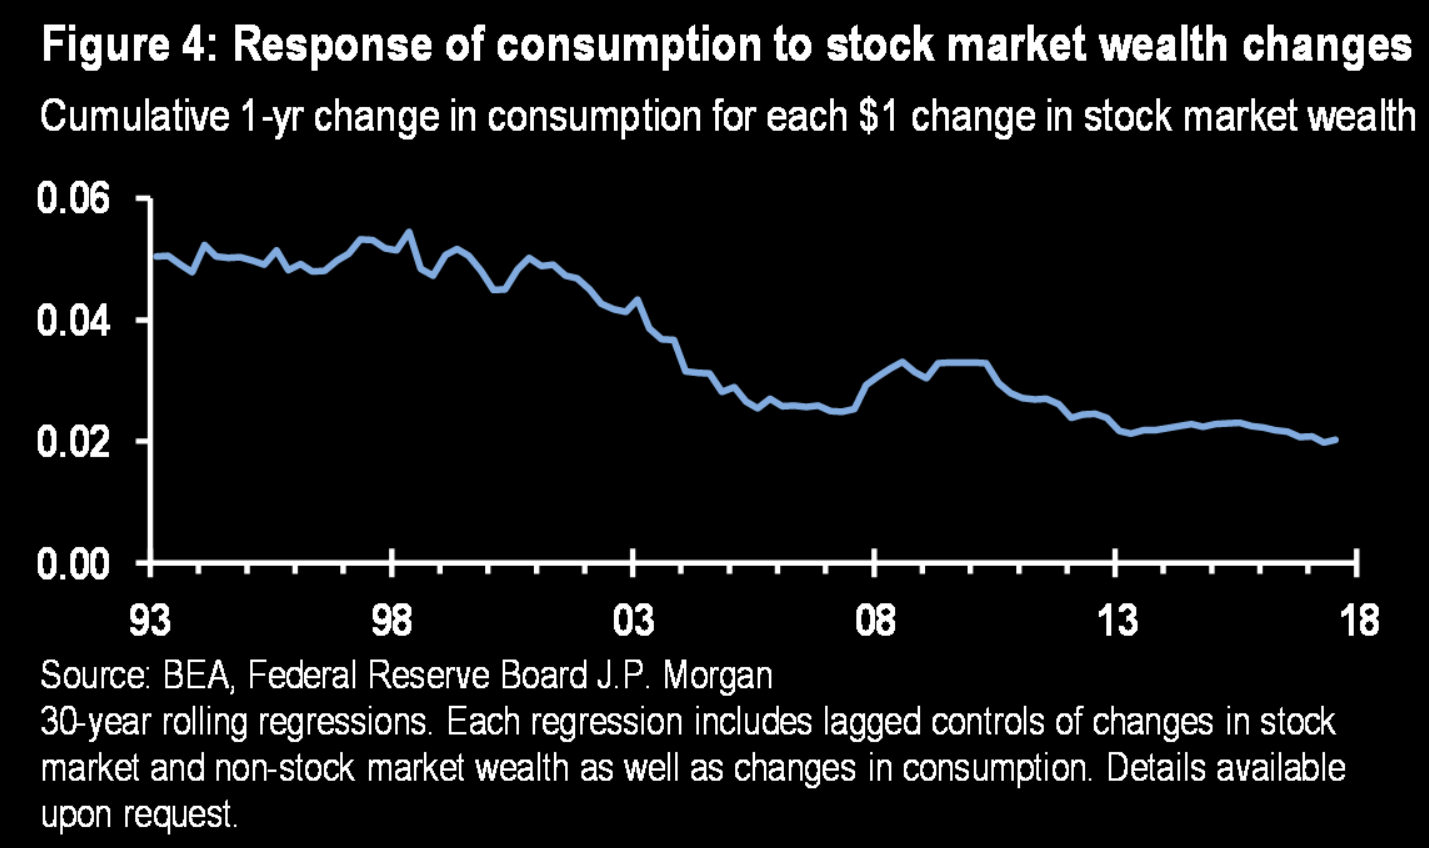
As Credit Suisse Group AG’s Zoltan Pozsar summarizes, inflation is a structural issue, and “we [have] to generate a round of negative wealth effects to lower demand such that it becomes more in line with the new realities of supply.”
That invokes “collateral damage to the US economy,” S&P Global Inc (NYSE: SPGI) economists have put forth “as households and businesses pull back spending and investment.”
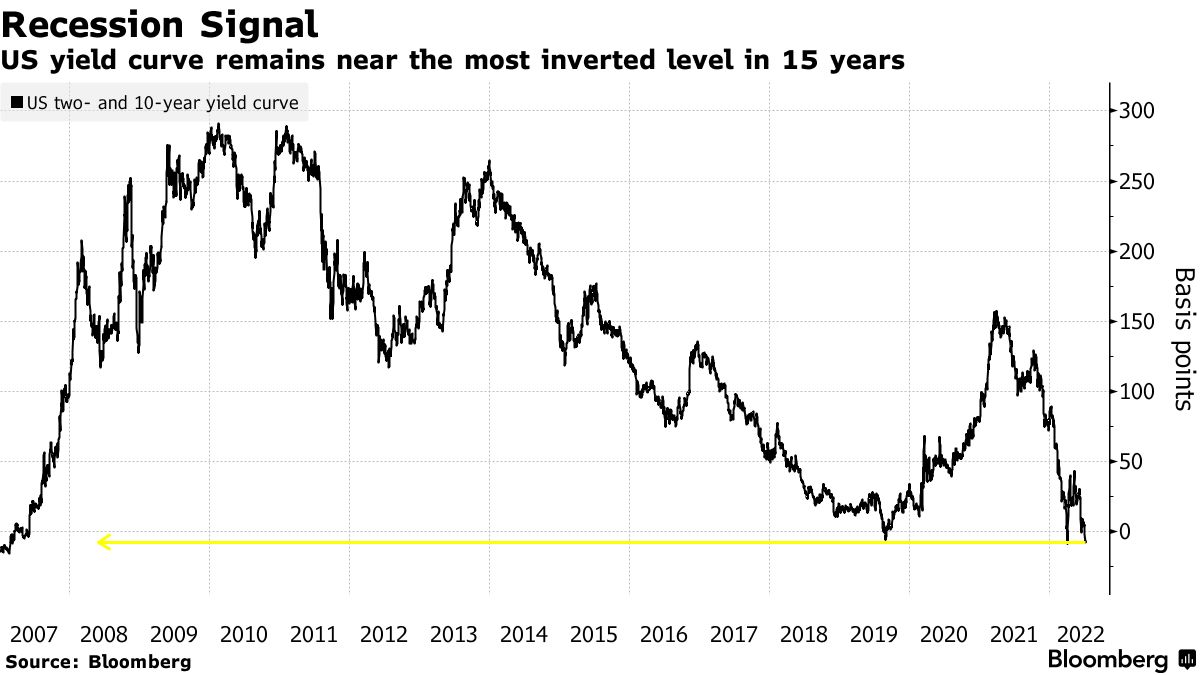
Ultimately, “[a]s demand erodes, businesses that changed inventory strategy to ‘just-in-case’ from ‘just-in-time’ are left with full shelves to unwind at a loss and less need for workers that were in high demand just a few months ago.” That’s a recession.
Positioning
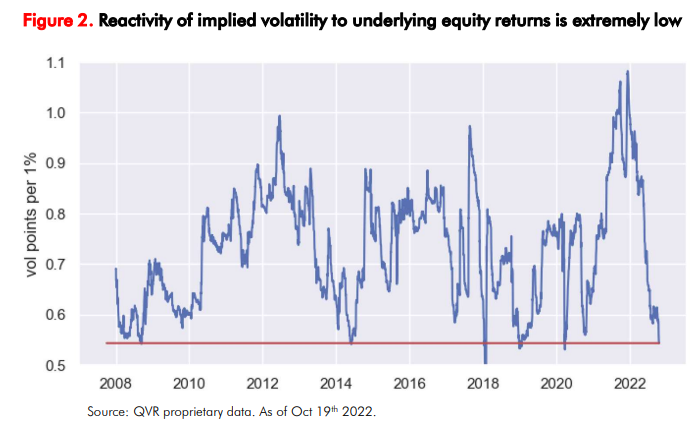
Equity market implied volatility (IVOL) remains subdued and part of the blame rests on the (1) growth of derivatives and …
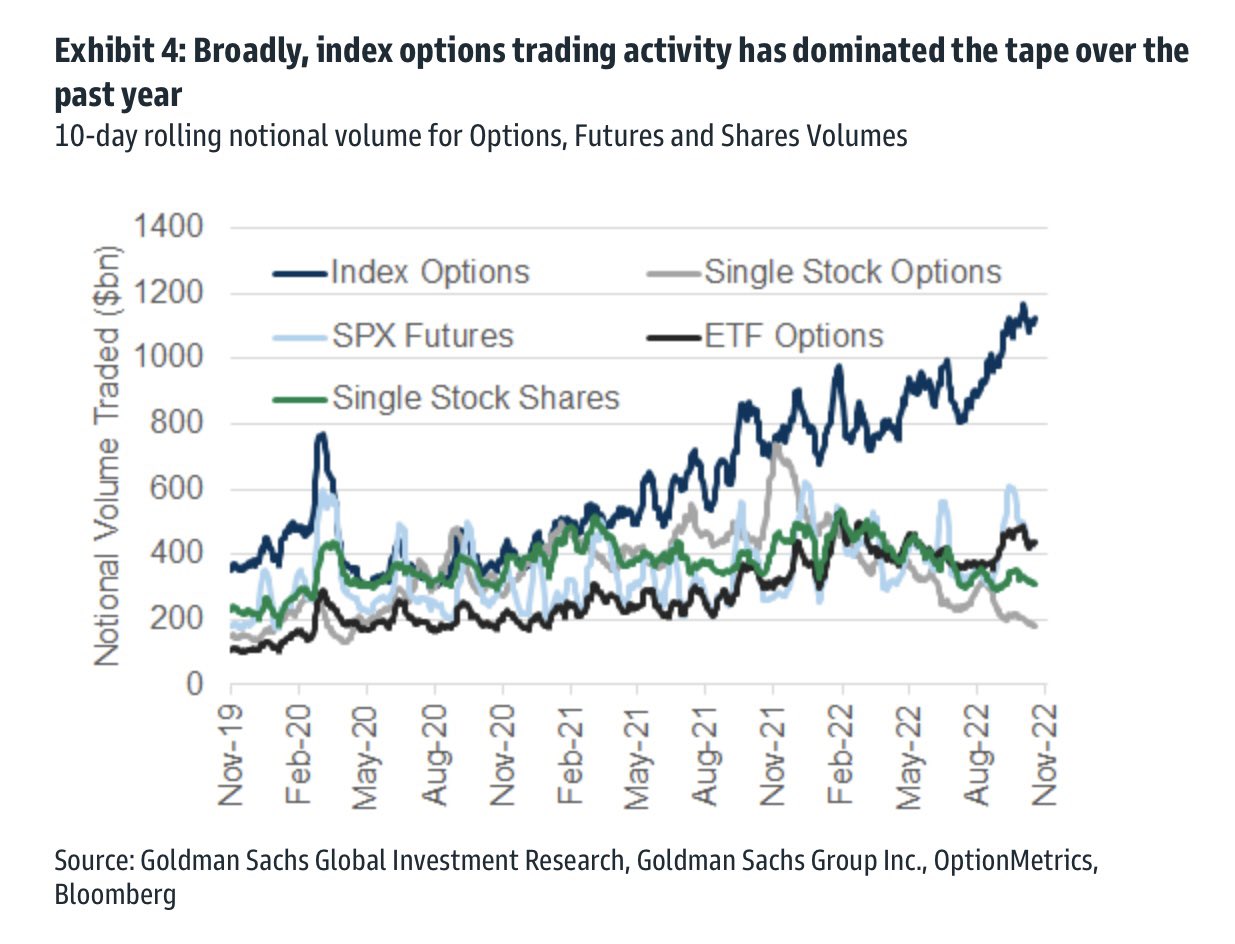
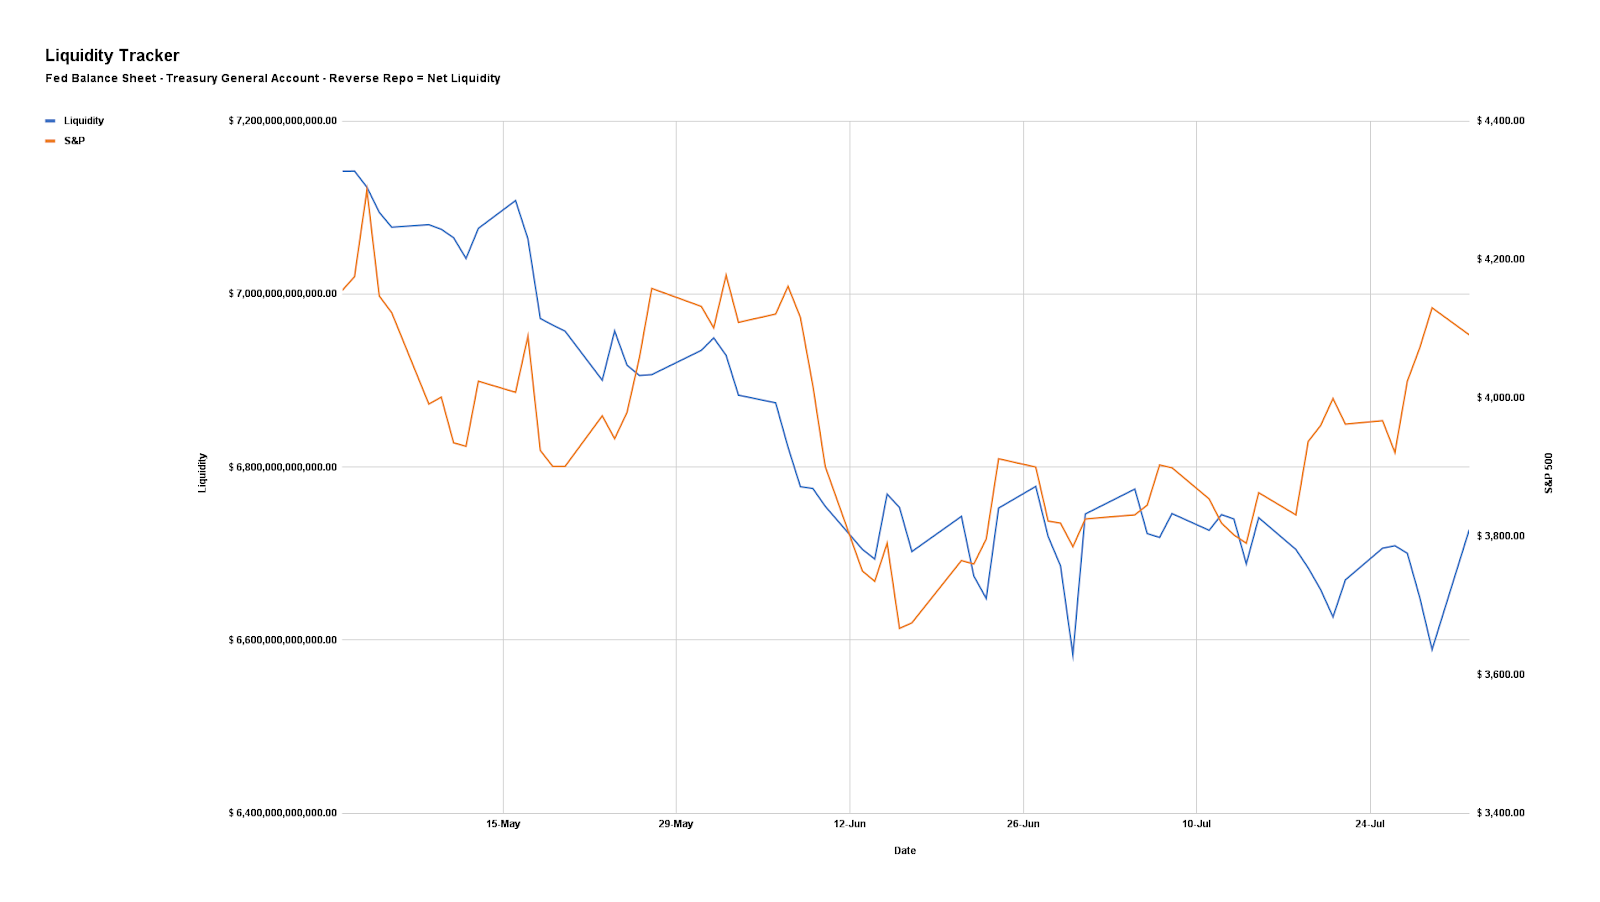
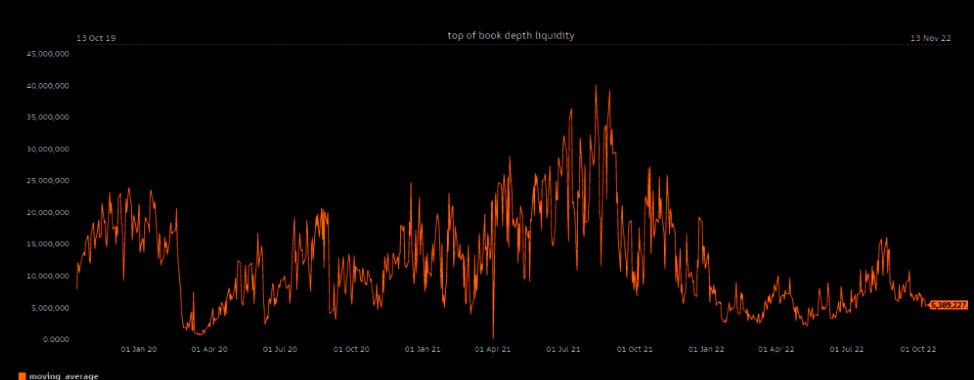
(2) a lower liquidity environment in which the hedging of these derivatives matters more.
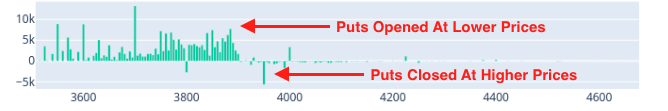
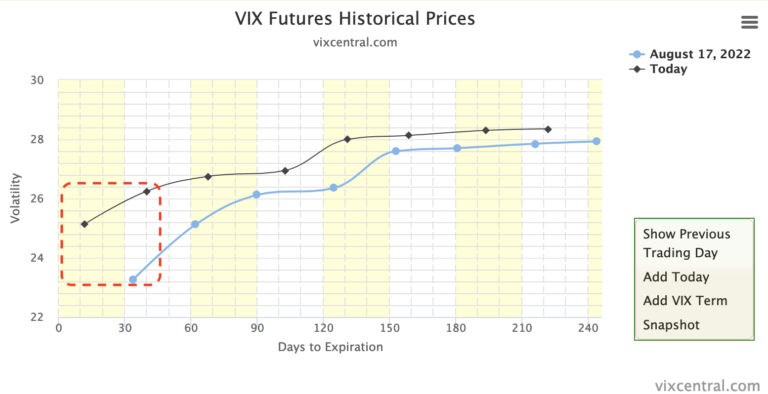
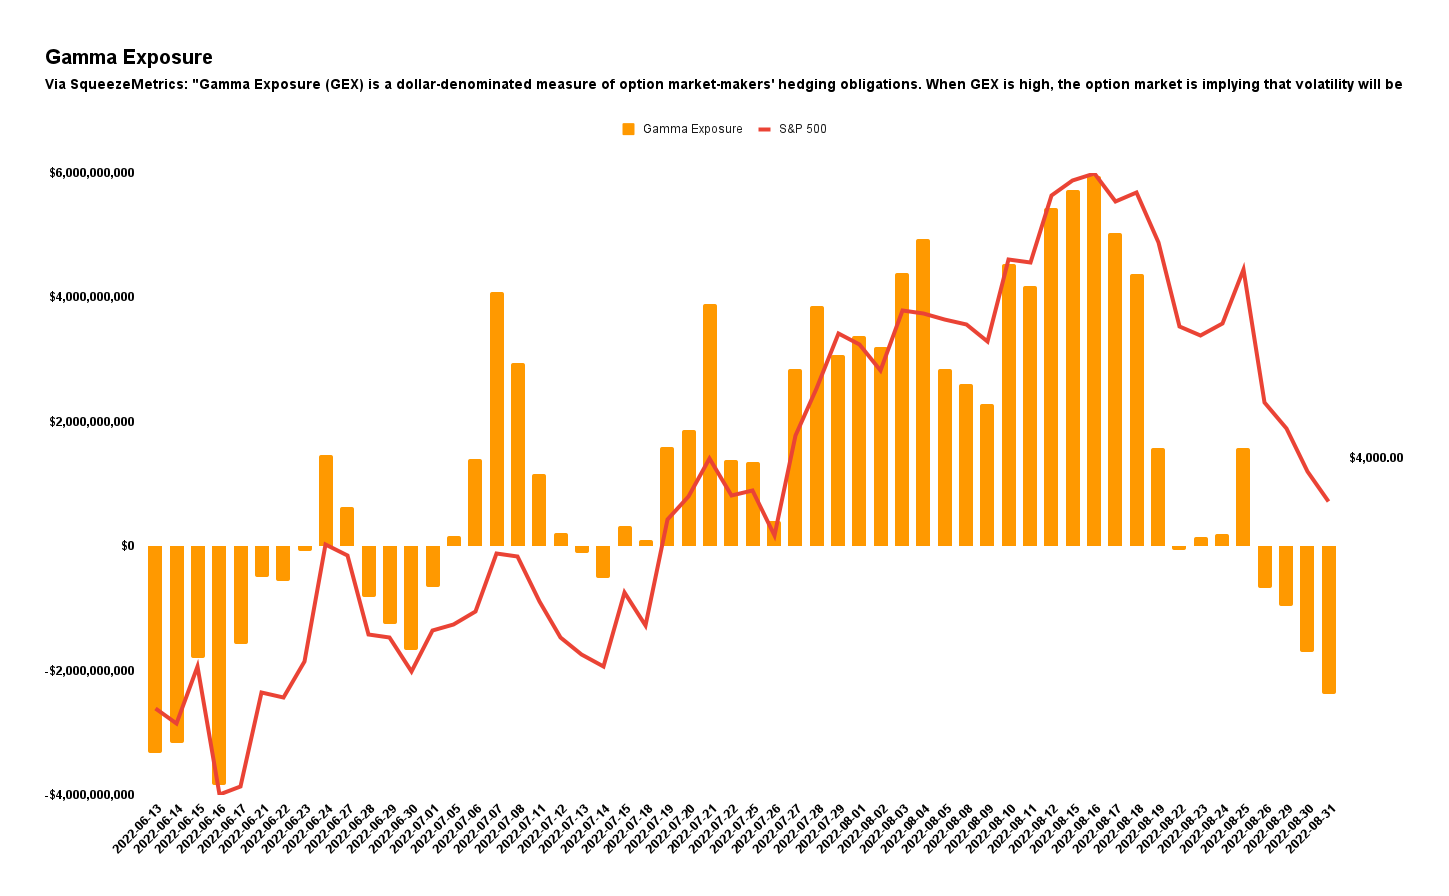
To recap, equity IVOL remains subdued, in part, because traders hedged into the 2022 decline.
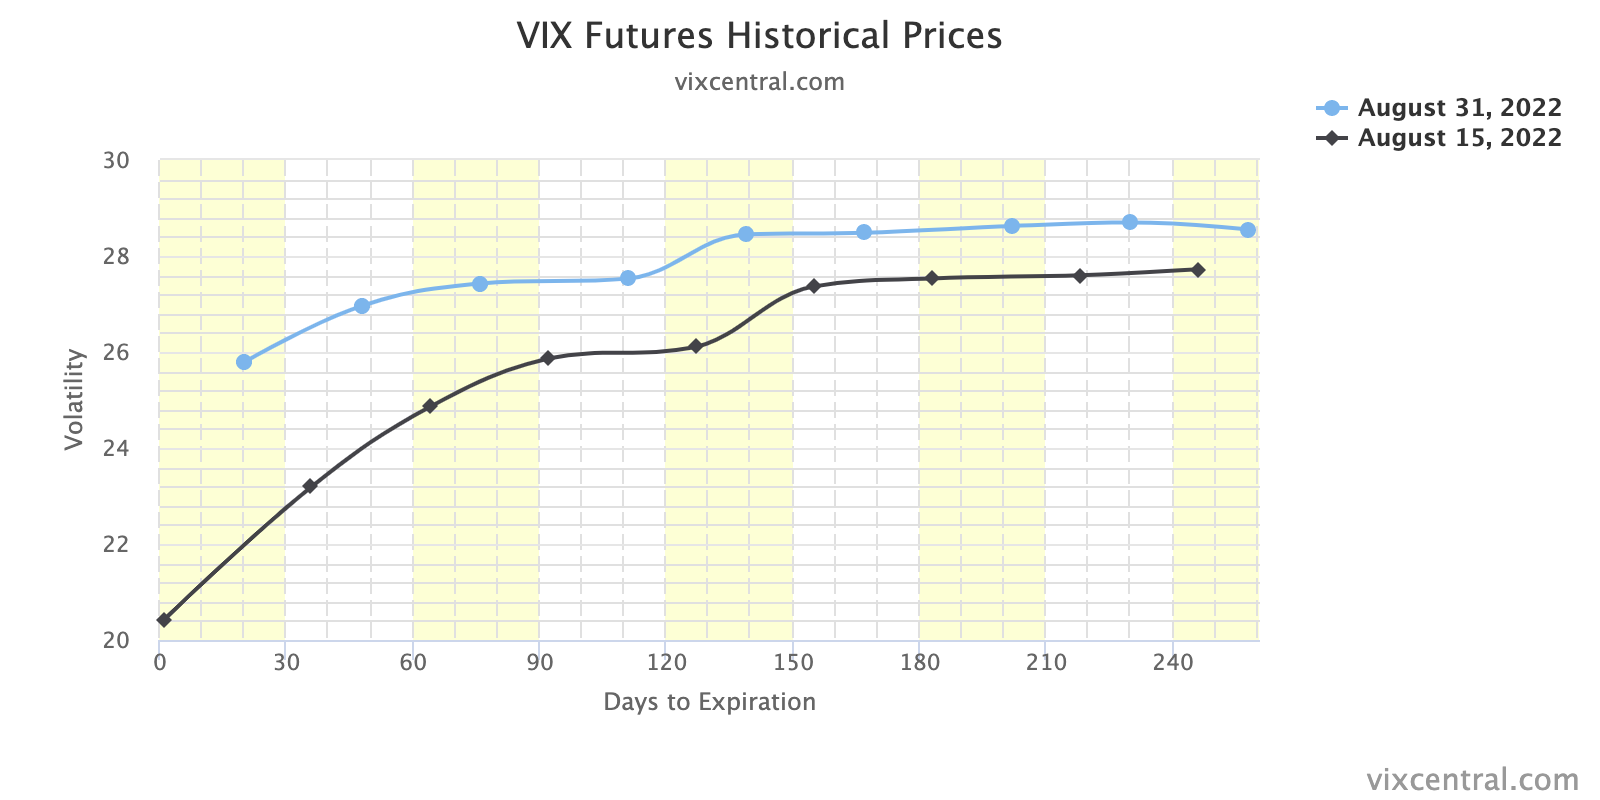
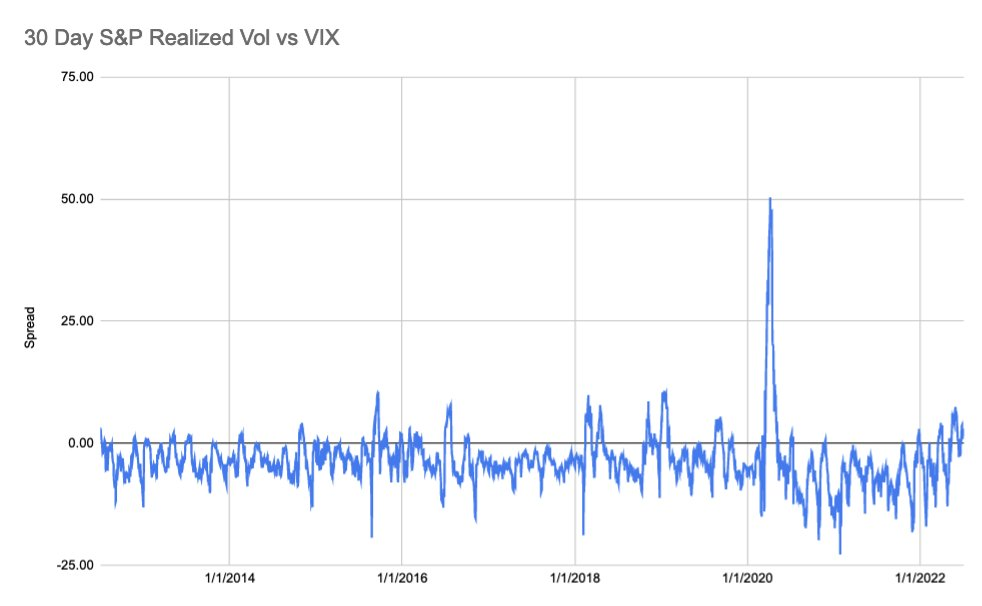
The liquidity providers’ response to the monetization of protection (i.e., trader sell put → liquidity provider buy put and stock and/or futures to hedge), as well as decreases in demand for equity exposure (and new protection), is keeping the Cboe Volatility Index (INDEX: VIX) tame while measures such as the Merrill Lynch Options Volatility Estimate (INDEX: MOVE) are surging.
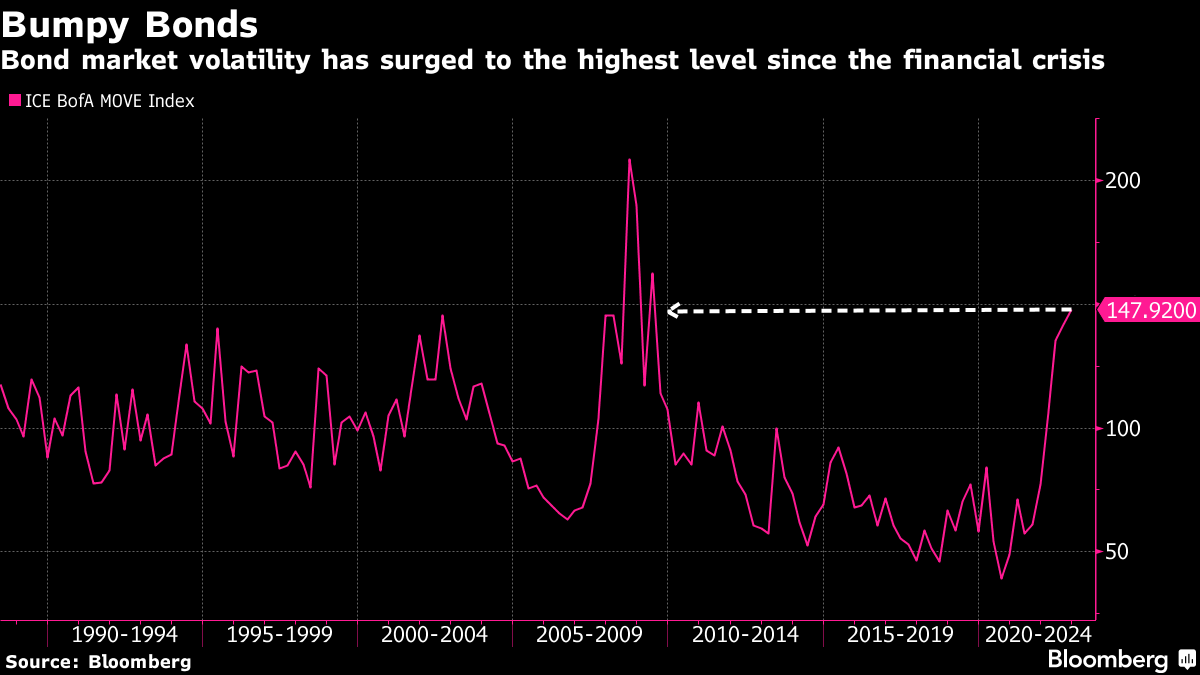
As well put in a recent Bloomberg article quoting QVR Advisors’ Benn Eifert, “[e]veryone was prepared for another jarring market crash, and that, in essence, is why certain categories of protective options have failed to pay off this year.”
In support, IPS Strategic Capital’s Pat Hennessy puts forth that equity positioning is light and, “[I]f you have little to no equity exposure to hedge, why would you be buying puts?” That is all the while “[t]he last 5 years is still fresh in PMs heads though. This means that they have been quick to buy calls on any sign of a market bounce.”
The first takeaways are that the above forces discussed have made for an orderly sell-off and the occasional quick reversal, particularly with more options activity spread across shorter-dated contracts where options (and hedging) are more sensitive.
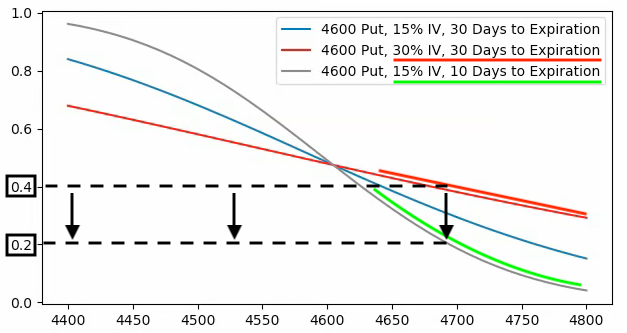
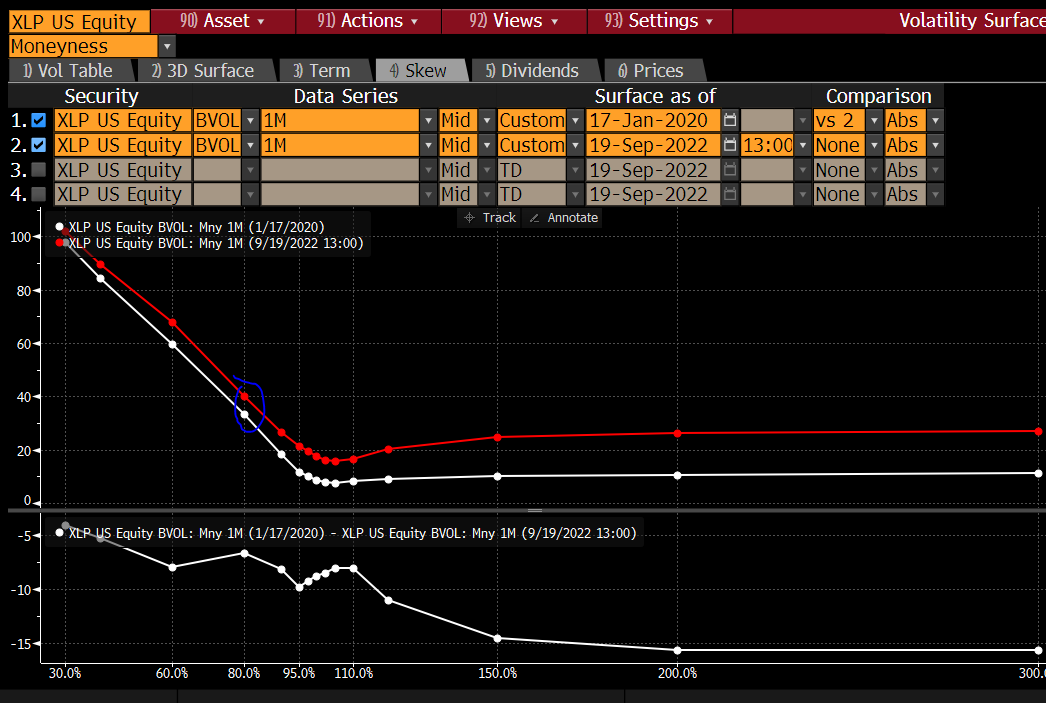
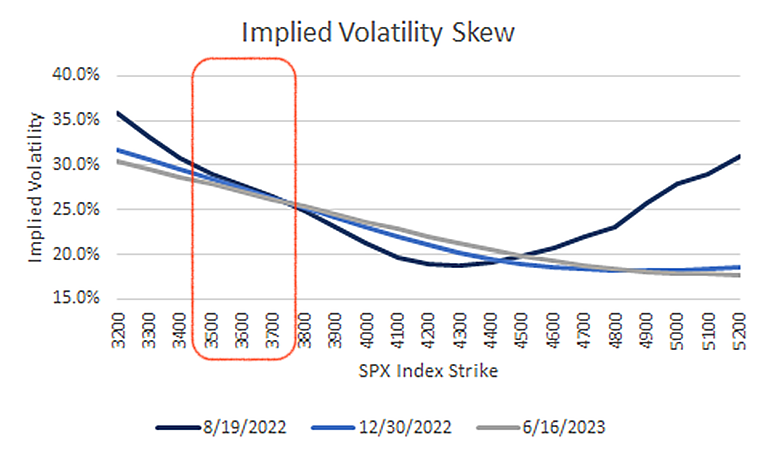
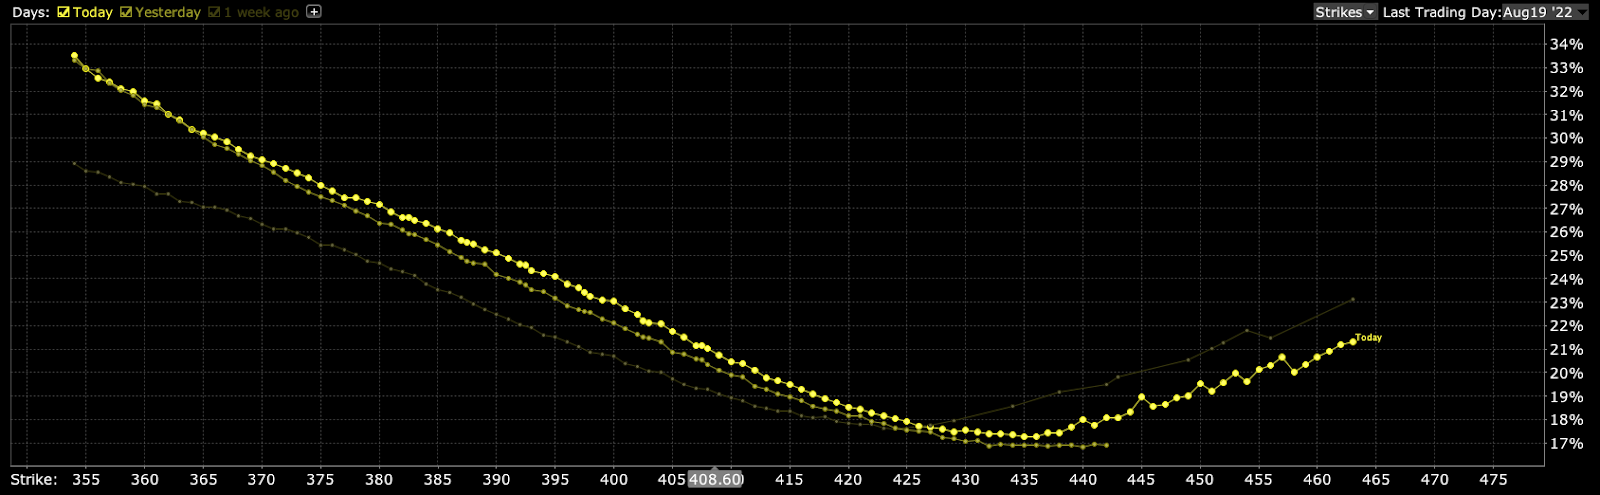
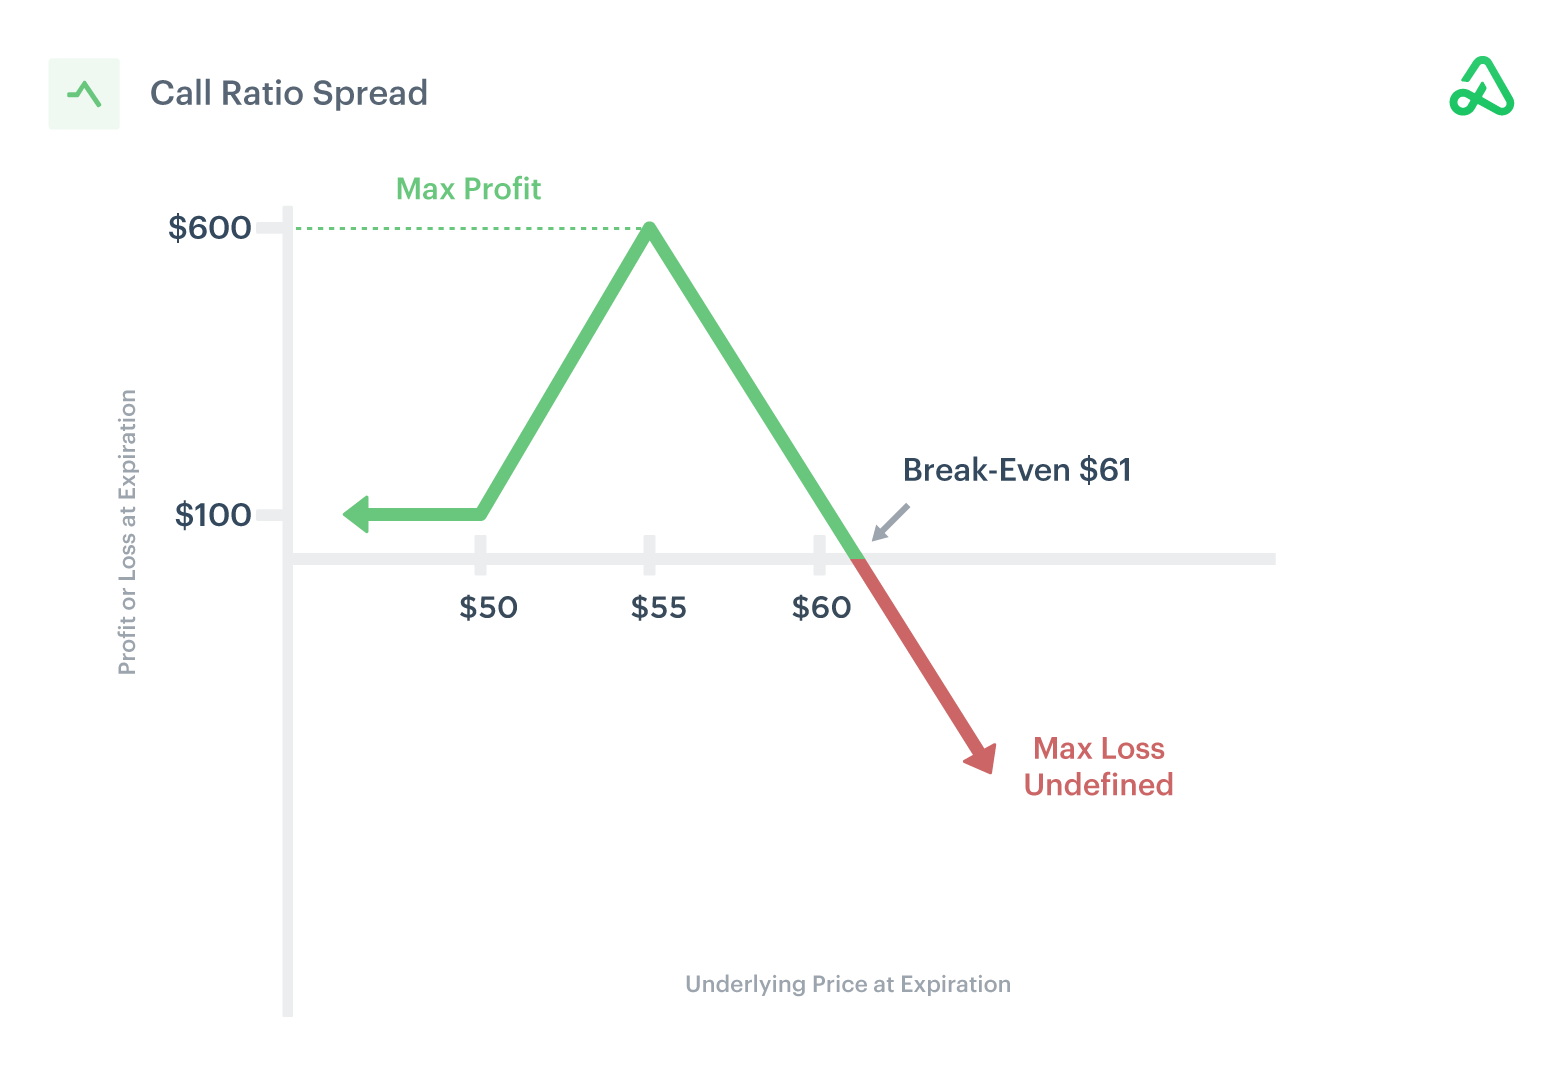
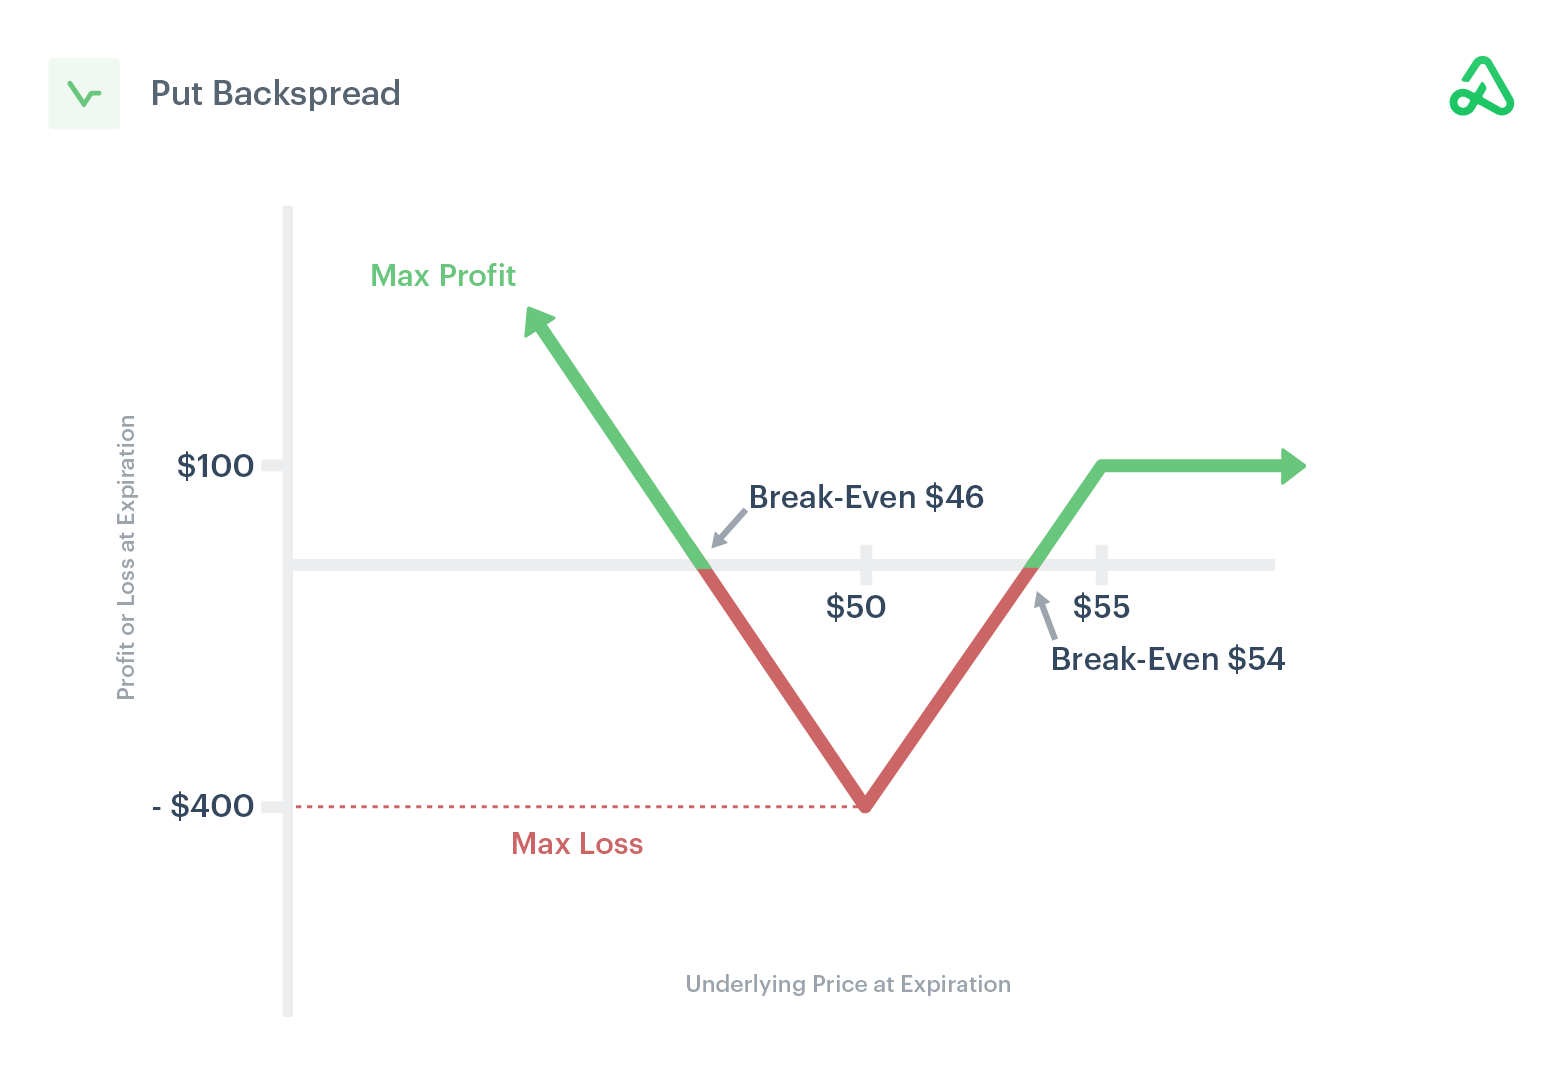
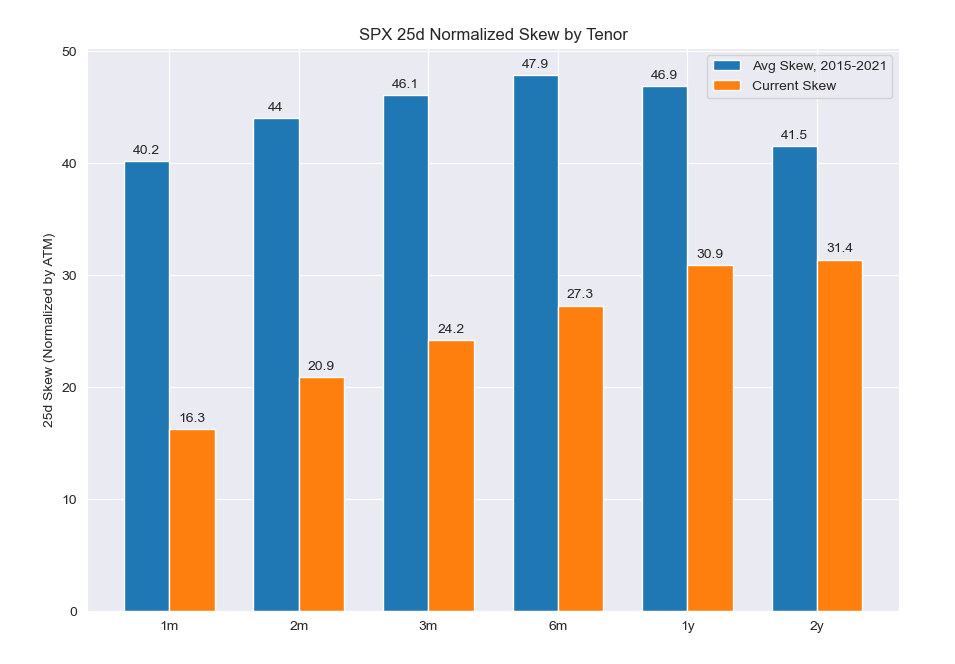
Another takeaway is that with skew at “near all-time lows, … [and] the highest rates we’ve seen in 15 years, [] longer dated collars [are] an attractive trade for those who are worried about the performance of stocks over the next year but do not want to sell or try timing the market.”
A last big takeaway includes some loss of structural support from hedging flows.
To explain, often, traders hedge into impactful events such as elections and Fed rate decisions. The demand for protection will pressure markets indirectly. After, however, the decay, as well as the removal of that protection, indirectly supports the market.

As it sits, traders are hedged into events such as the elections. Per SpotGamma, “[i]f nothing bad happens, and traders close those puts, that would likely bolster a rally.”
This coincides with the market’s entry into a period of lower liquidity (i.e., the holiday season). It’s during this period the effects of decay accelerate and a lack of liquidity, per Karsan, makes markets sensitive to those positive positioning flows.
Ultimately, the very poor hedging that’s going on, heading into the next rally, is going to set the stage for a large tail, Karsan adds. Traders, who aren’t as well hedged, will seek protection and this will pressure markets, adding to any macro-type selling.
More explanation in the coming letters.
Technical
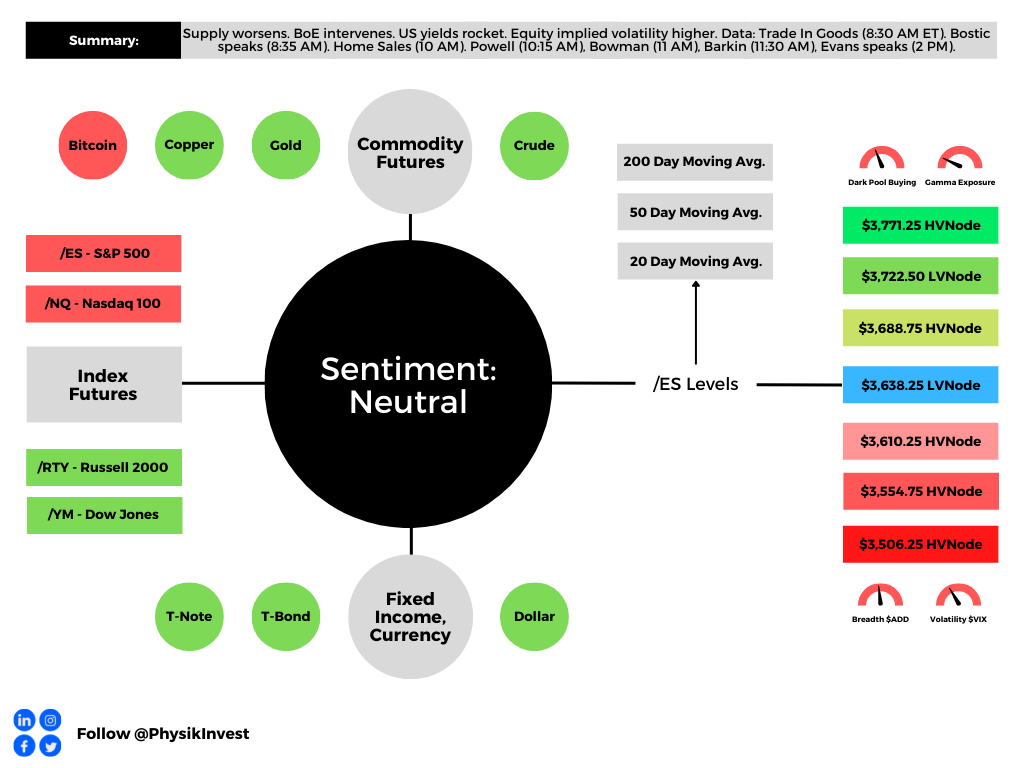
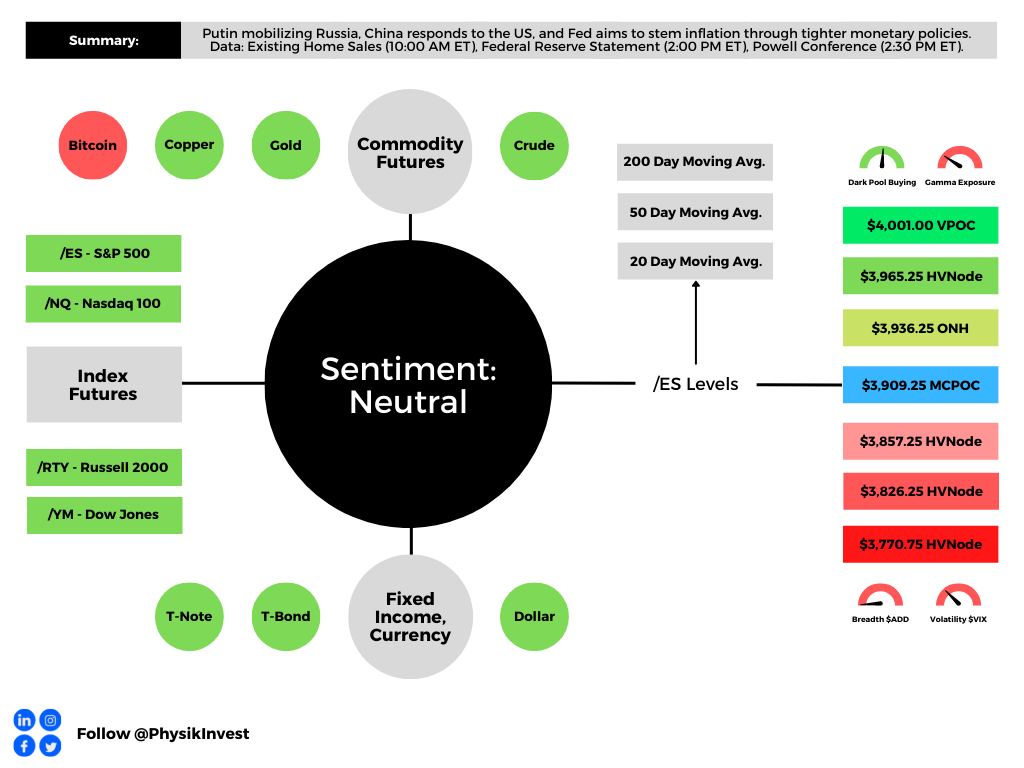
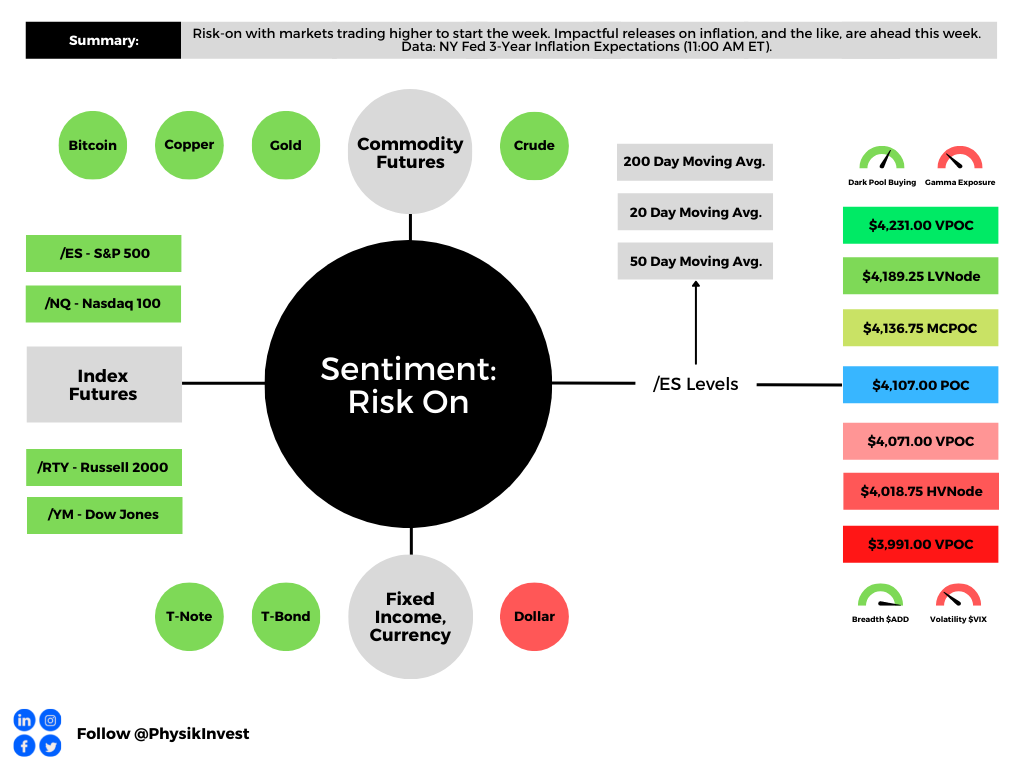
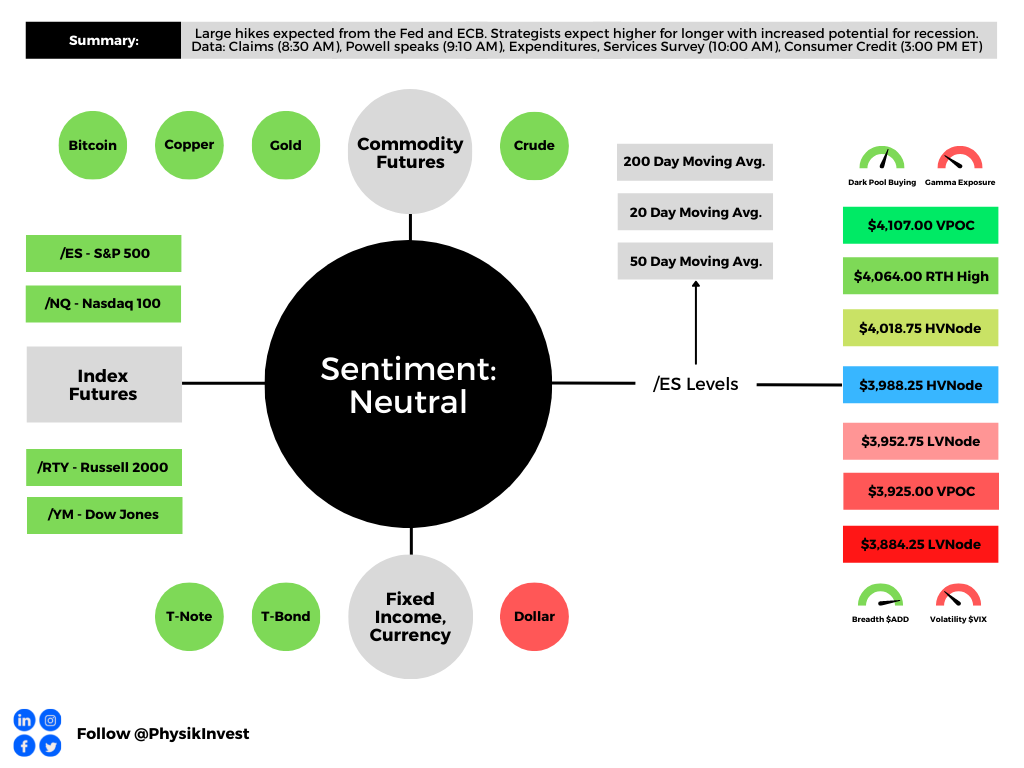
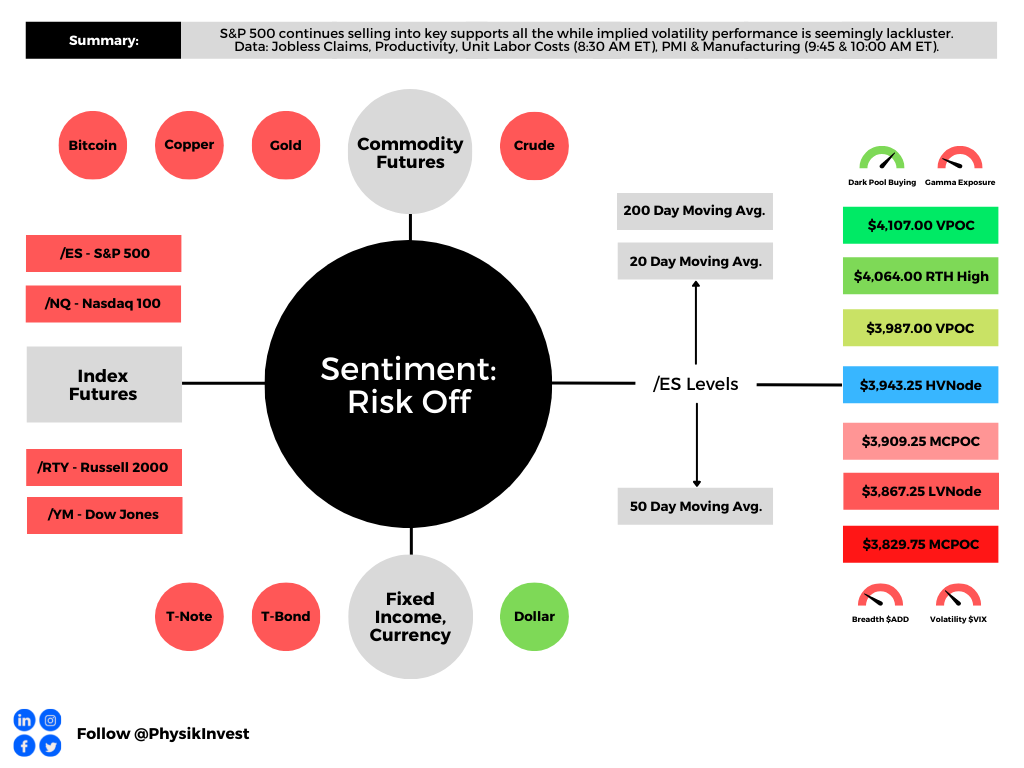
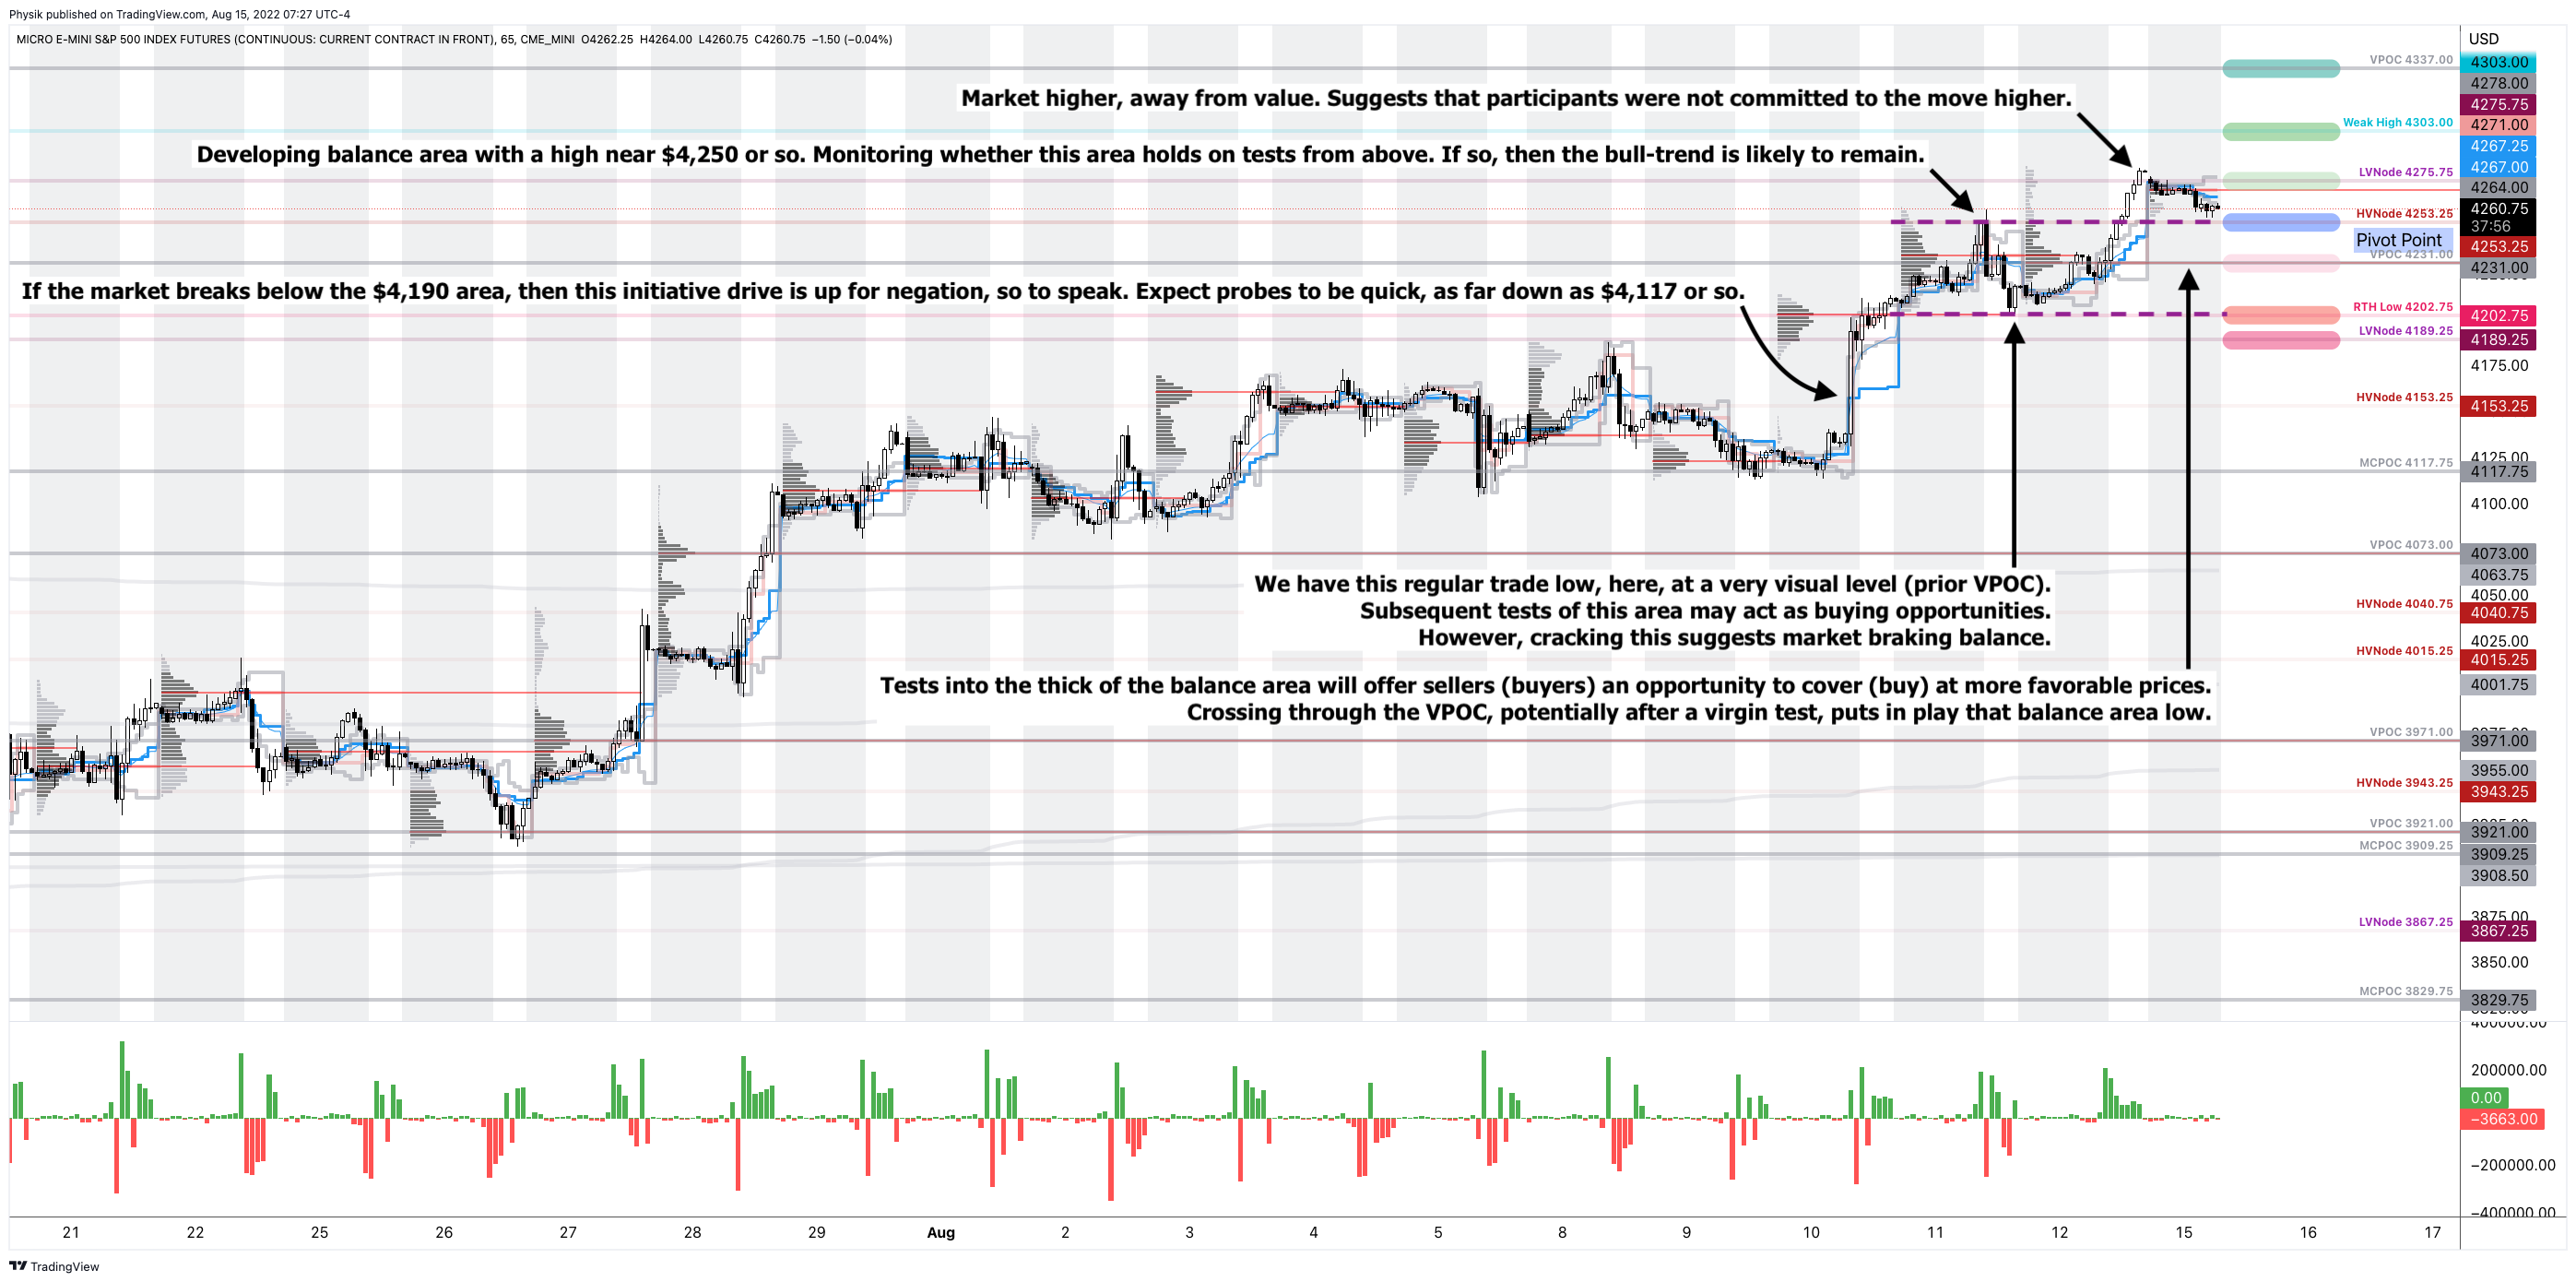
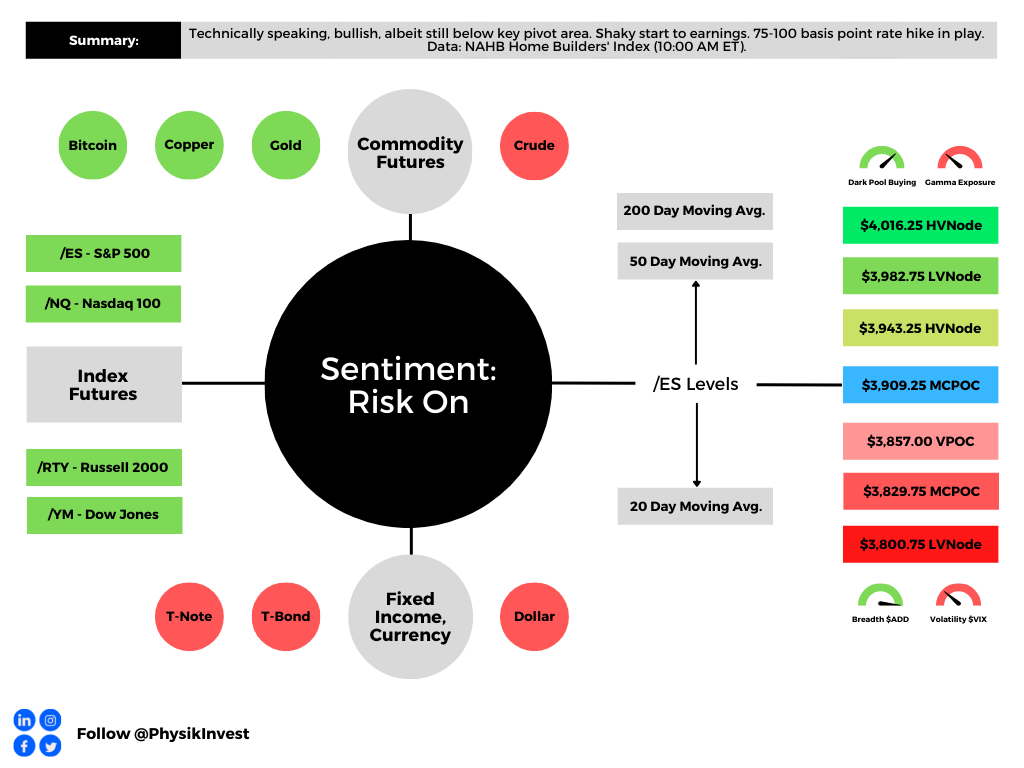
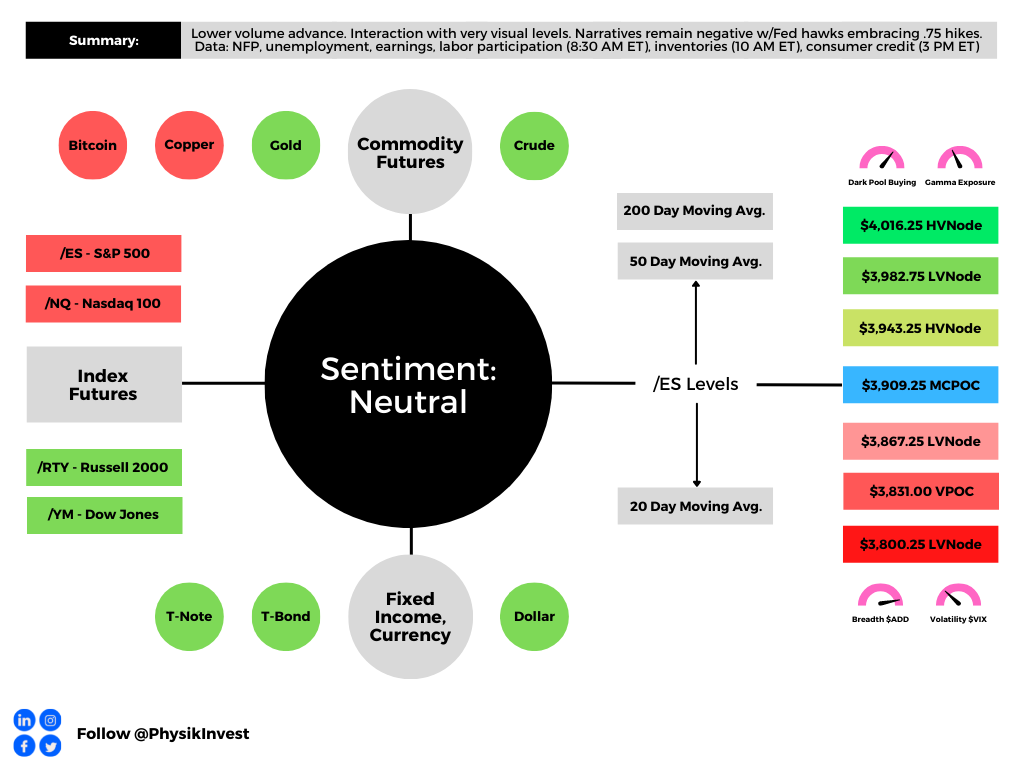
As of 6:30 AM ET, Monday’s regular session (9:30 AM – 4:00 PM ET), in the S&P 500, is likely to open in the upper part of a positively skewed overnight inventory, inside of prior-range and -value, suggesting a limited potential for immediate directional opportunity.
In the best case, the S&P 500 trades higher.
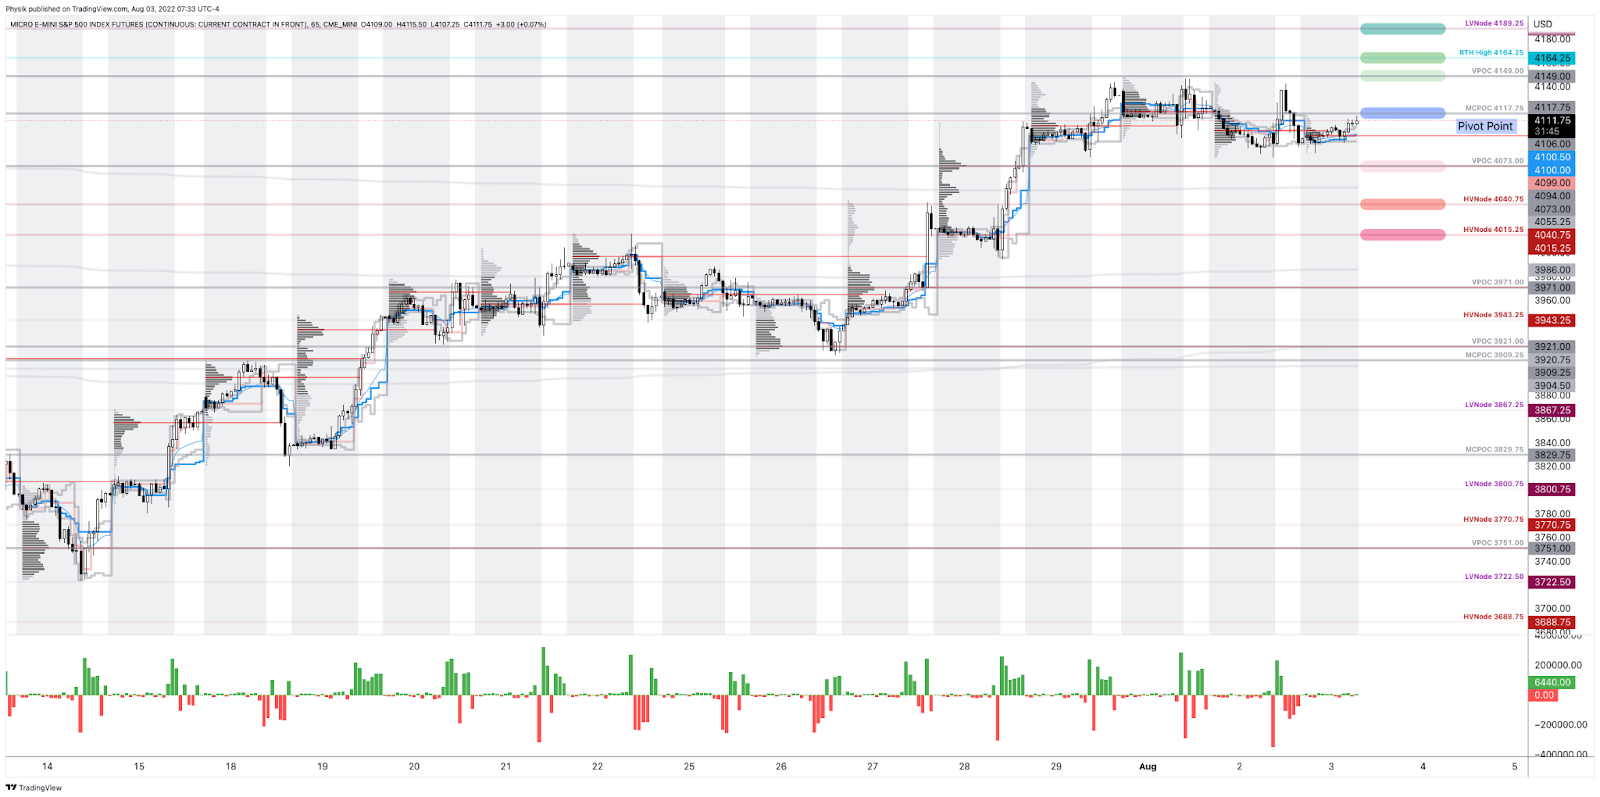
Any activity above the $3,806.25 LVNode puts into play the $3,845.00 VPOC. Initiative trade beyond the VPOC could reach as high as the $3,874.25 HVNode and $3,909.25 MCPOC, or higher.
In the worst case, the S&P 500 trades lower.
Any activity below the $3,806.25 LVNode puts into play the $3,773.00 VPOC. Initiative trade beyond the VPOC could reach as low as the $3,727.00 and $3,685.00 VPOC, or lower.
Click here to load today’s key levels into the web-based TradingView charting platform. Note that all levels are derived using the 65-minute timeframe. New links are produced, daily.

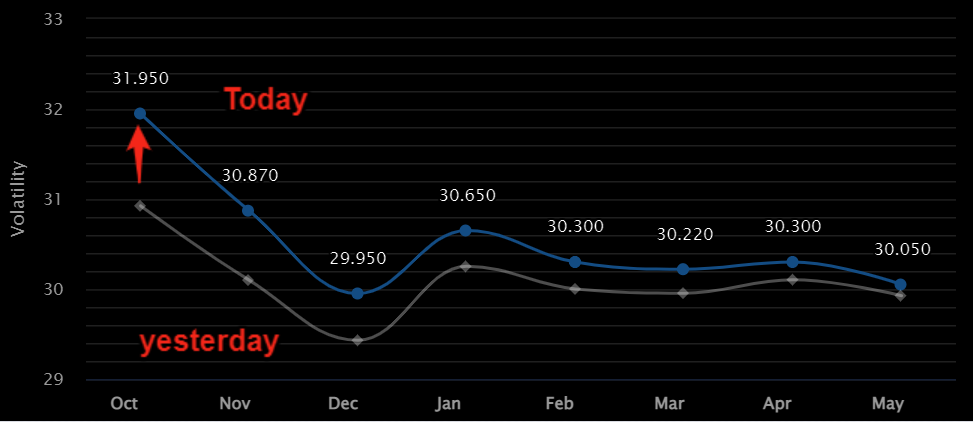
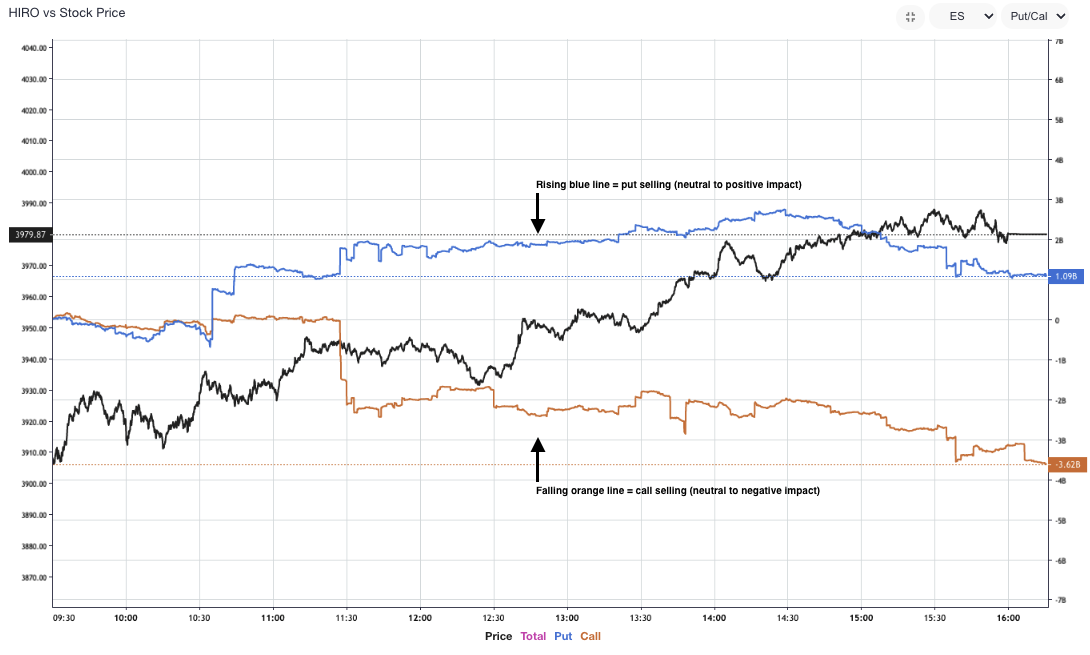
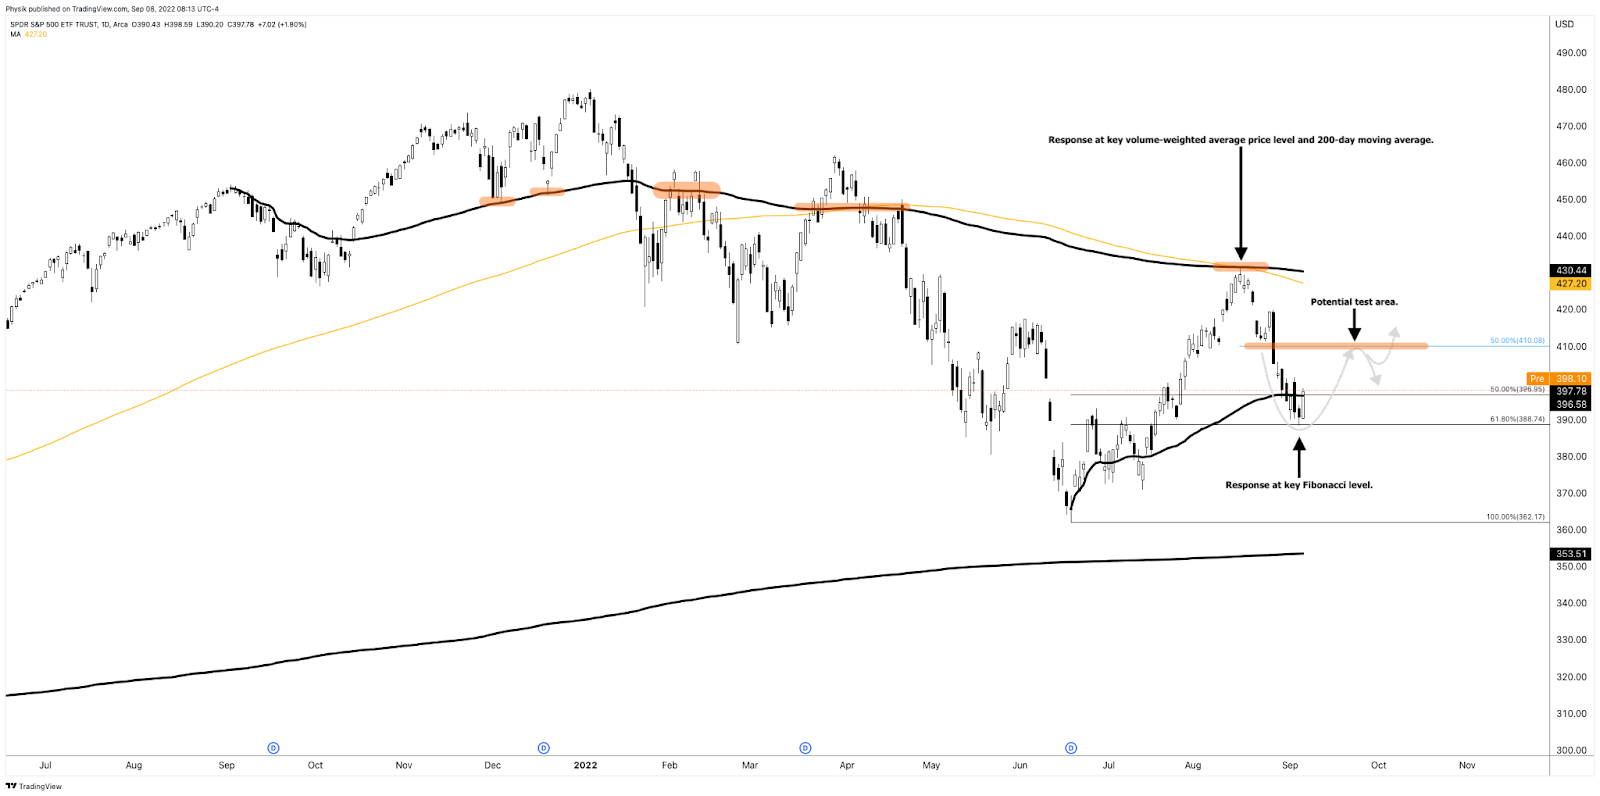
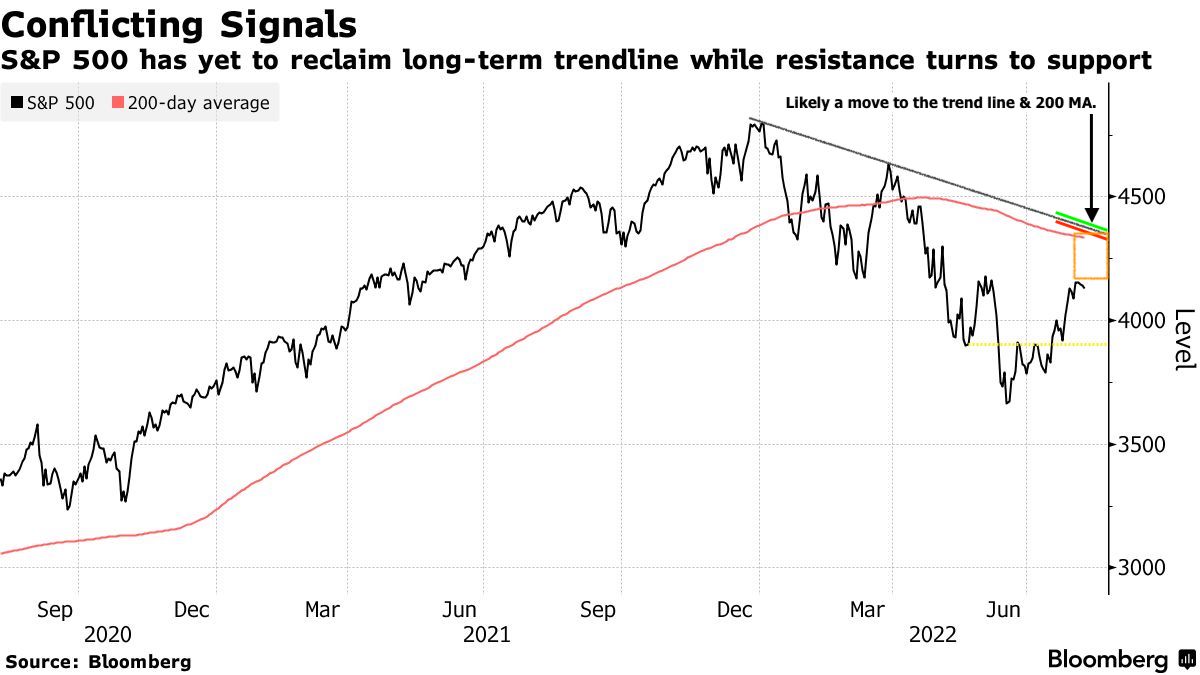
Considerations: Futures tied to the S&P 500 are trading within close proximity to a blue line in the above graphic. This blue line depicts a volume-weighted average price (VWAP) anchored to price action following the release of consumer price data on September 13, 2022.
The VWAP metric is highly regarded by chief investment officers, among other participants, for the quality of trade. Additionally, liquidity algorithms are benchmarked and programmed to buy and sell around VWAPs.
Should the S&P 500 auction away from this level, and come back to it, a prudent response is to fade. If the price is above the VWAP, and it auctions lower, into the VWAP, traders would buy. On the other hand, if the price is below the VWAP, and it auctions higher, into the VWAP, sell.
At this time, S&P 500 prices are near VWAP offering traders lower (directional) opportunities.
Definitions
Volume Areas: A structurally sound market will build on areas of high volume (HVNodes). Should the market trend for long periods of time, it will lack sound structure, identified as low volume areas (LVNodes). LVNodes denote directional conviction and ought to offer support on any test.
If participants were to auction and find acceptance into areas of prior low volume (LVNodes), then future discovery ought to be volatile and quick as participants look to HVNodes for favorable entry or exit.
POCs: POCs are valuable as they denote areas where two-sided trade was most prevalent in a prior day session. Participants will respond to future tests of value as they offer favorable entry and exit.
MCPOCs: POCs are valuable as they denote areas where two-sided trade was most prevalent over numerous day sessions. Participants will respond to future tests of value as they offer favorable entry and exit.