Categories
Commentary

Daily Brief For February 24, 2022

Editor’s Note: The Daily Brief is a free glimpse into the prevailing fundamental and technical drivers of U.S. equity market products. Join the 200+ that read this report daily, below!

What Happened

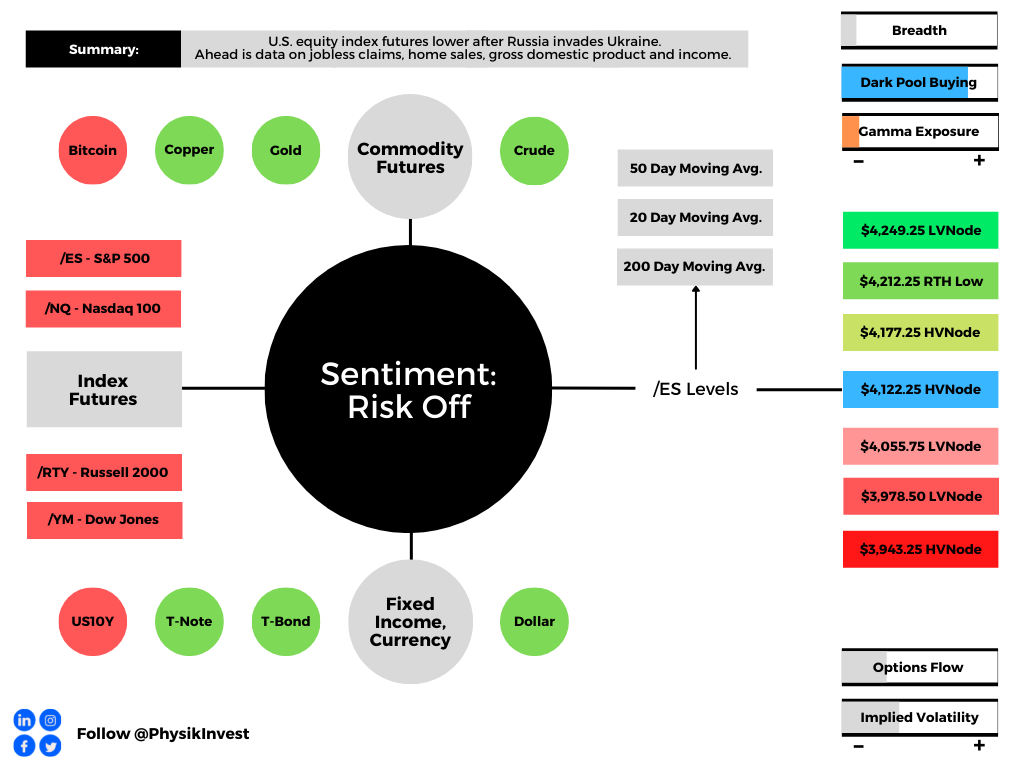
Overnight, equity index futures added to losses after news that Russia invaded Ukraine

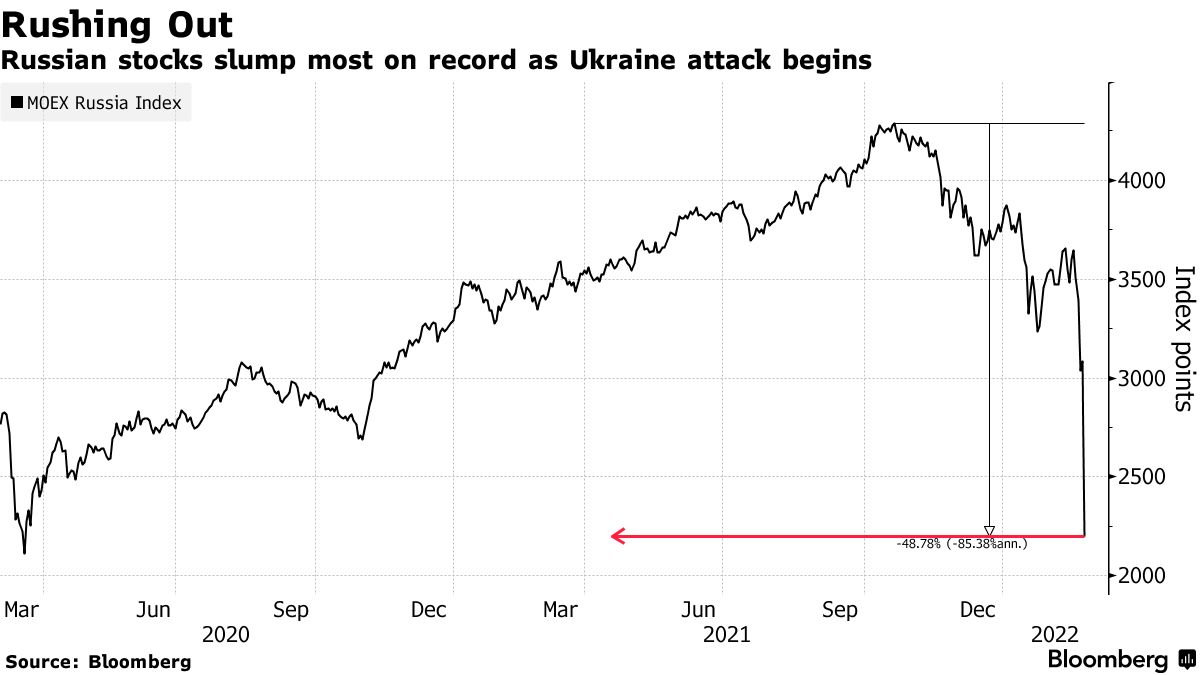
The MOEX Russia Index fell nearly 50% while, at home in the U.S., equity index futures were off about 3%. Bonds rose with commodities which were led by crude oil (up ~9%). 

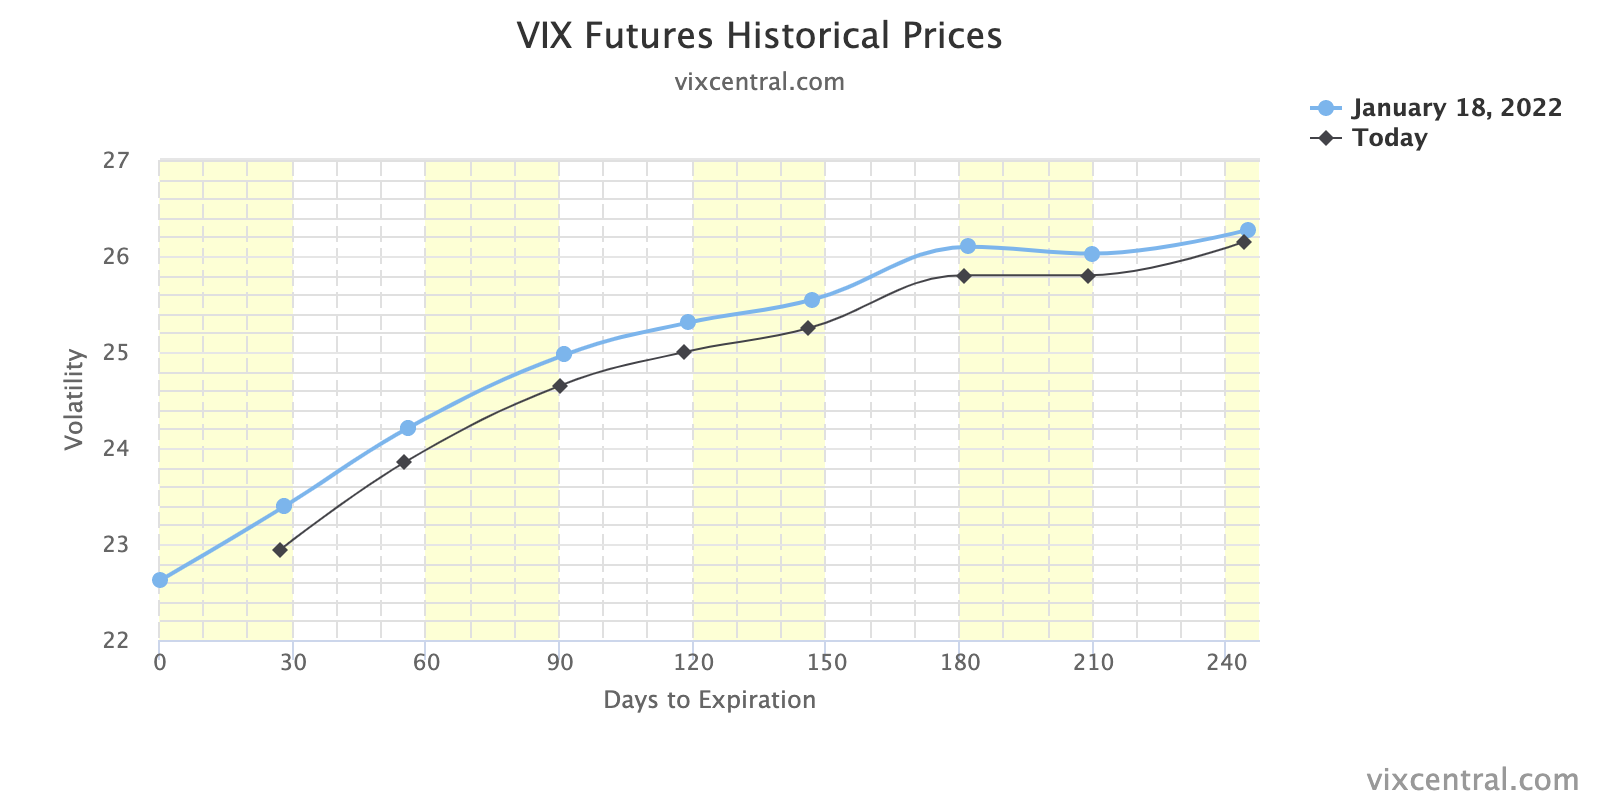
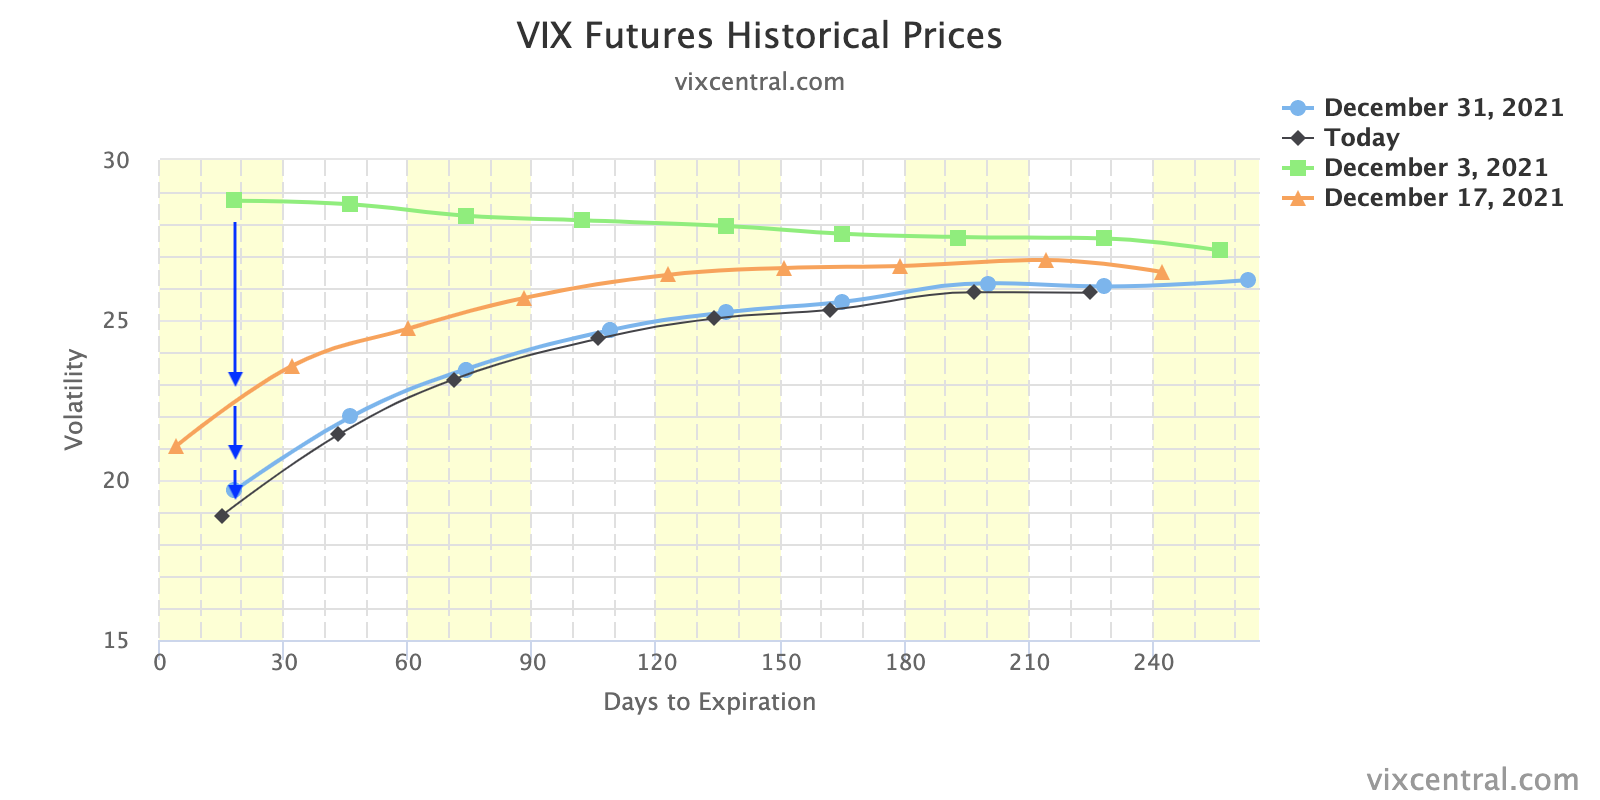
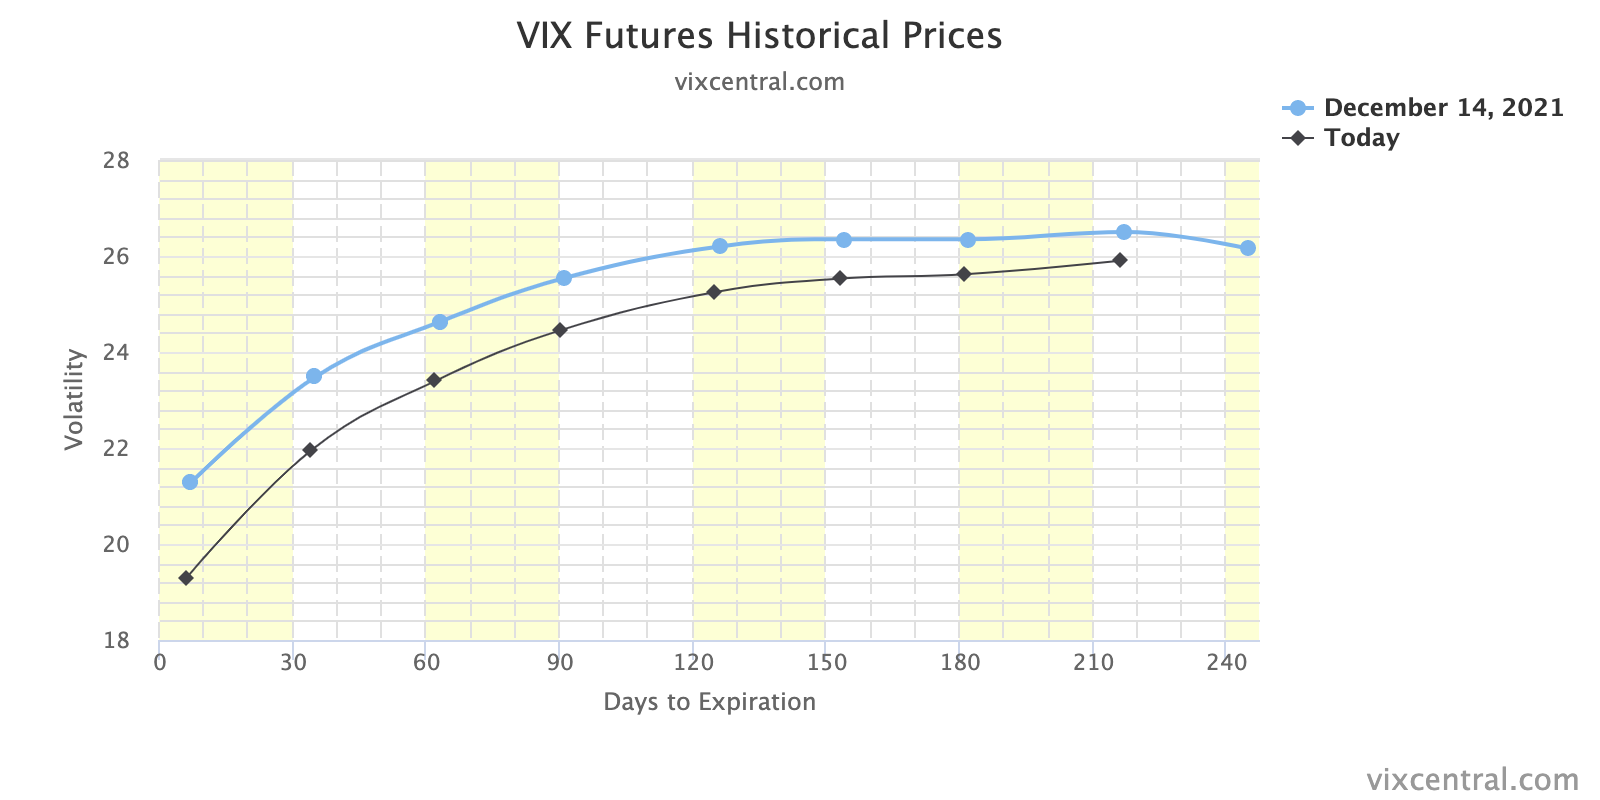
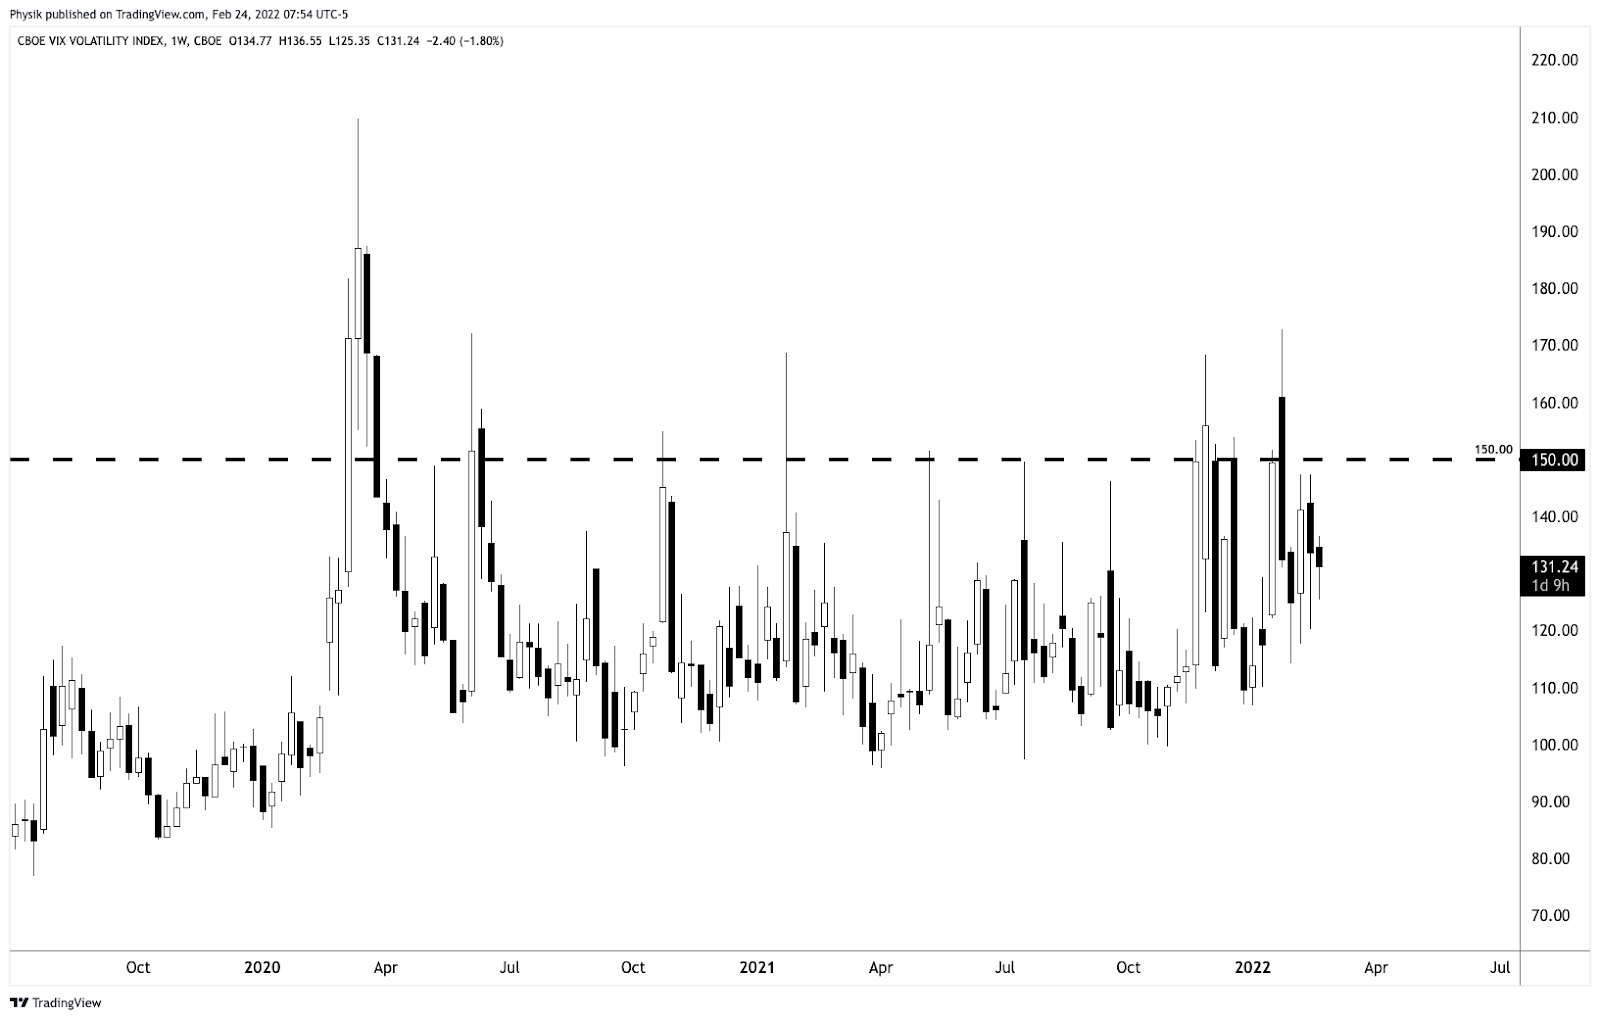
The CBOE Volatility Index (INDEX: VIX), a measure of implied volatility or participants’ forecast of likely movement in prices, printed 37.79 a ~7.00 jump from Wednesday.

This high-level context suggests to us the need for patience. Ranges will be wide. Positioning will compound headline-driven moves. Technical analyses will fail. Caution.

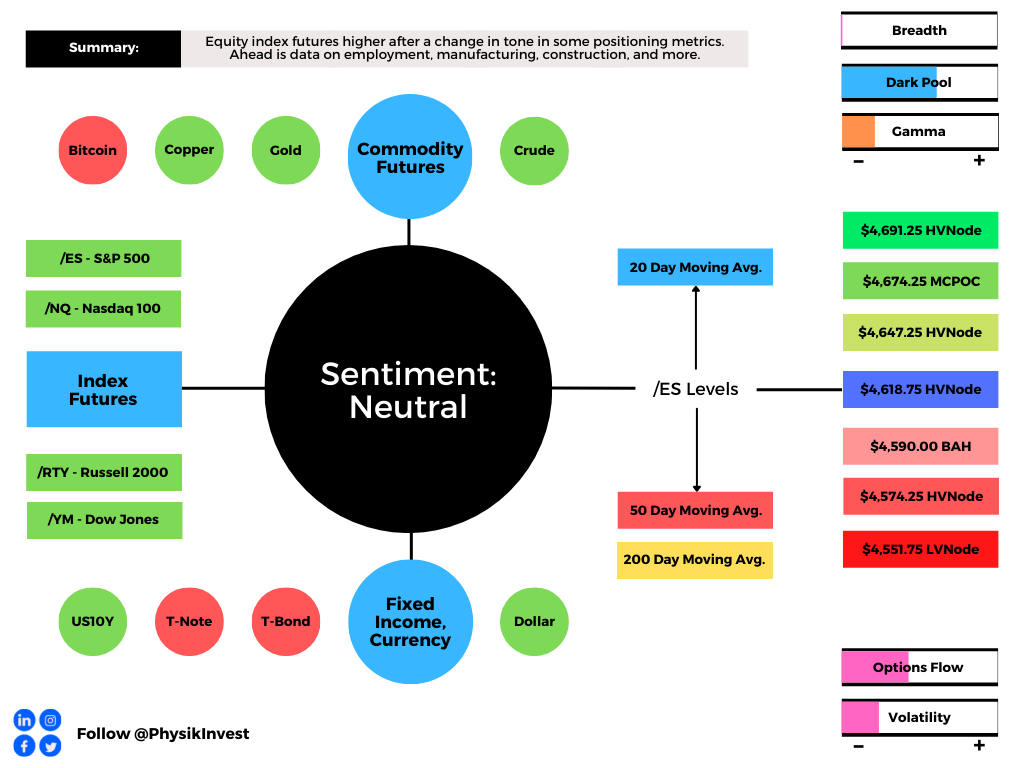
Ahead is data on jobless claims, gross domestic product, gross domestic income (8:30 AM ET), as well as new home sales (10:00 AM ET).

Graphic updated 6:45 AM ET. Risk-Off if expected /ES open is below the prior day’s range. /ES levels are derived from the profile graphic at the bottom of the following section. Levels may have changed since initially quoted; click here for the latest levels. SqueezeMetrics Dark Pool Index (DIX) and Gamma (GEX) calculations are based on where the prior day’s reading falls with respect to the MAX and MIN of all occurrences available. A higher DIX is bullish. At the same time, the lower the GEX, the more (expected) volatility. Learn the implications of volatility, direction, and moneyness. SHIFT data used for S&P 500 (INDEX: SPX) options activity. Note that options flow is sorted by the call premium spent; if more positive, then more was spent on call options. Breadth reflects a reading of the prior day’s NYSE Advance/Decline indicator. VIX reflects a current reading of the CBOE Volatility Index (INDEX: VIX) from 0-100.

What To Expect

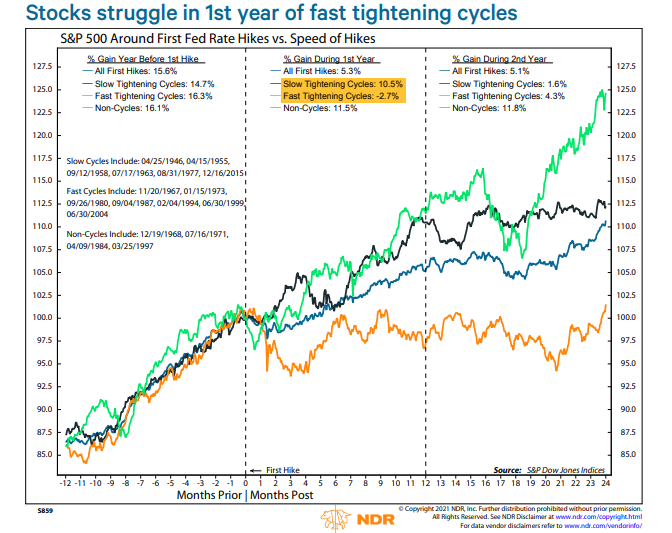
Fundamental: “The ‘bad news = good news’ narrative for markets doesn’t work if the Fed is tightening amidst a slowdown and a military escalation risk. In this case, bad news = bad news.”

Pursuant to this remark by Alfonso Peccatiello, Russian equities fell the most on record (nearly 50%) after President Vladimir Putin ordered the demilitarization of Ukraine. 

Graphic: Via Bloomberg.

According to Bloomberg, this crisis comes “after the U.S. and its allies crossed Russia’s ‘red lines’ by expanding the NATO alliance.”

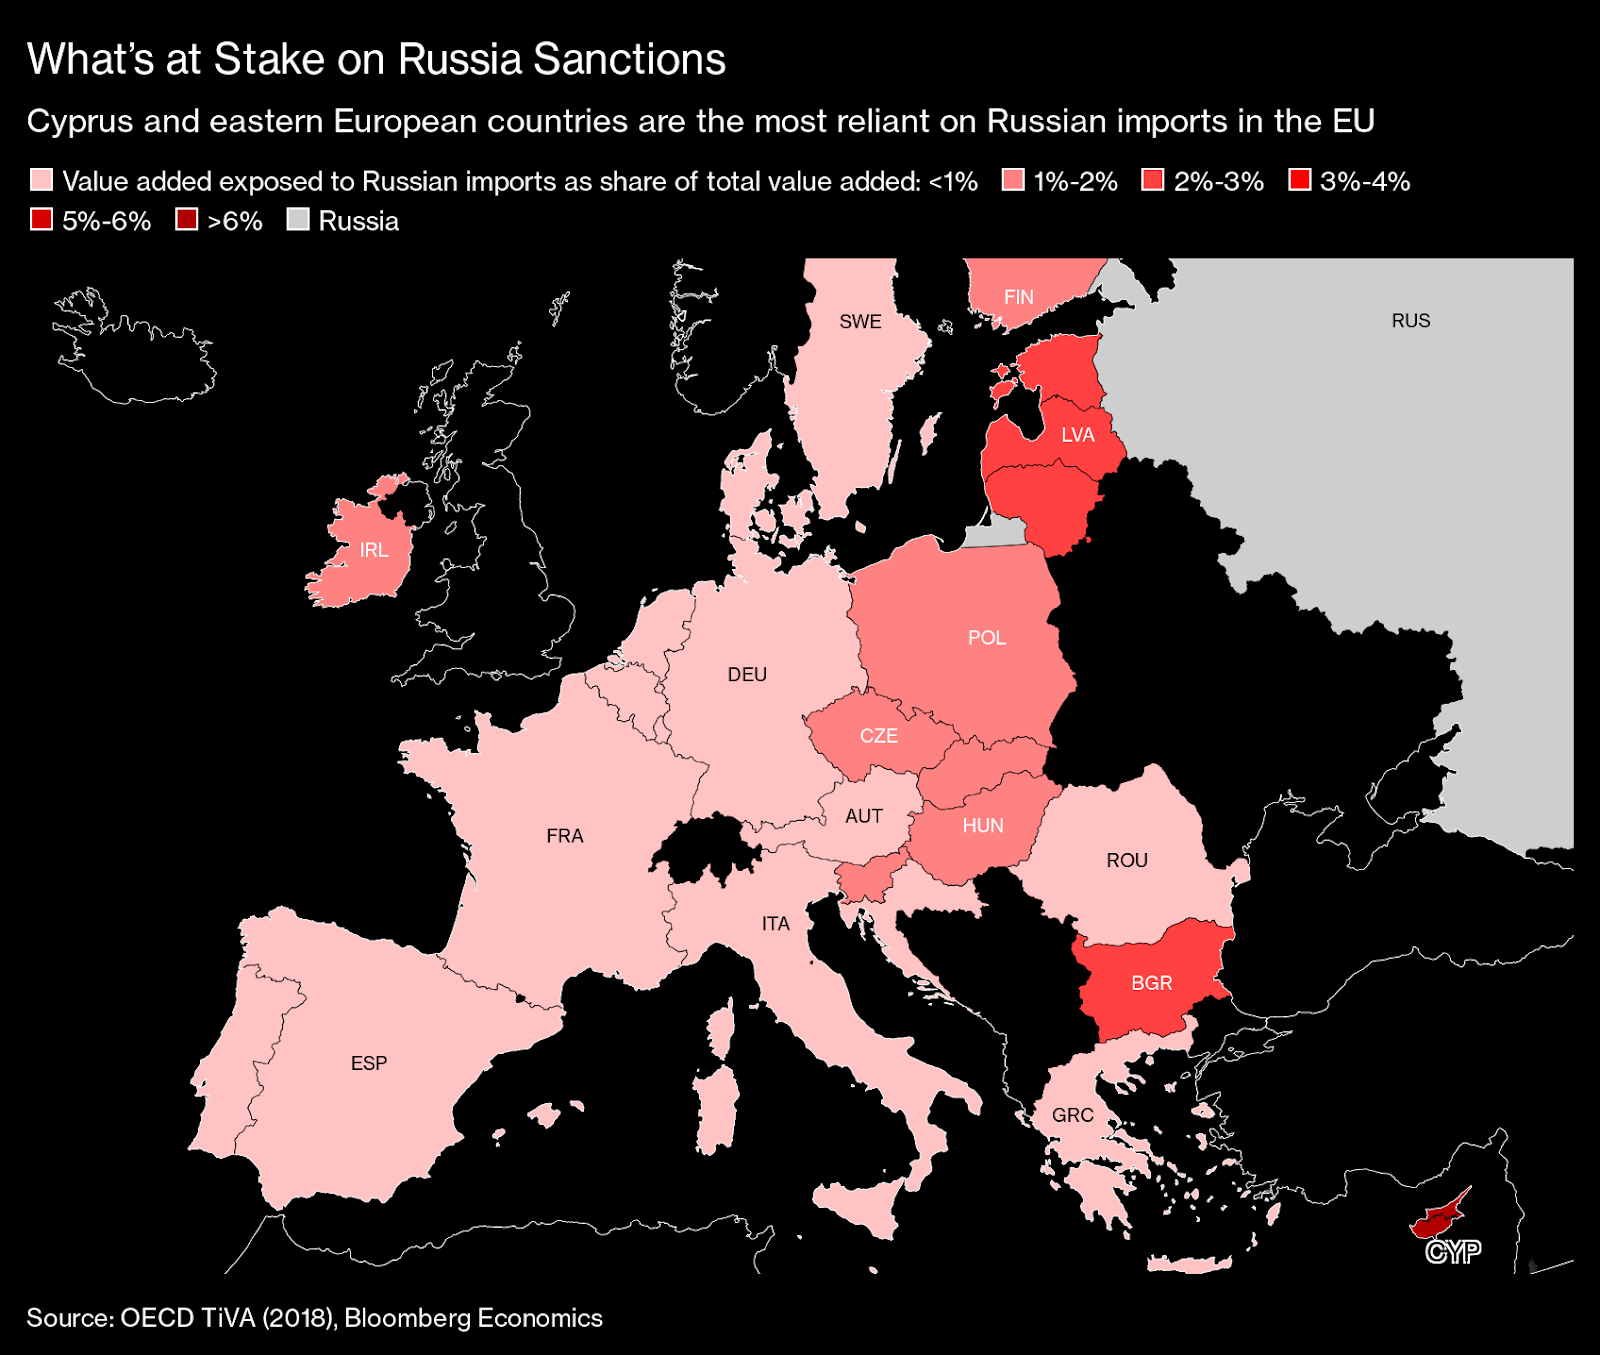
In terms of the economic implications of Russia sanctions, it is “Cyprus and eastern European countries [that] are the most reliant on Russian imports in the EU.” 

Ukraine’s crisis also throws a wrench at monetary tightening initiatives, abroad; “the European Central Bank will put even greater emphasis on its flexibility and options as it exits stimulus measures and shifts toward raising rates,” Governing Council member Francois Villeroy de Galhau said.

Graphic: Via Bloomberg.

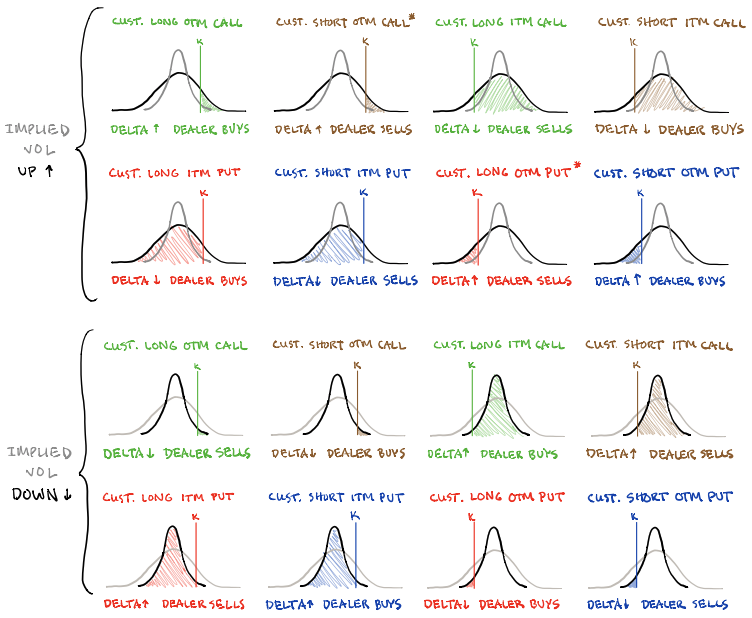
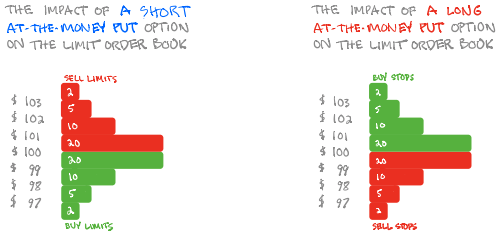
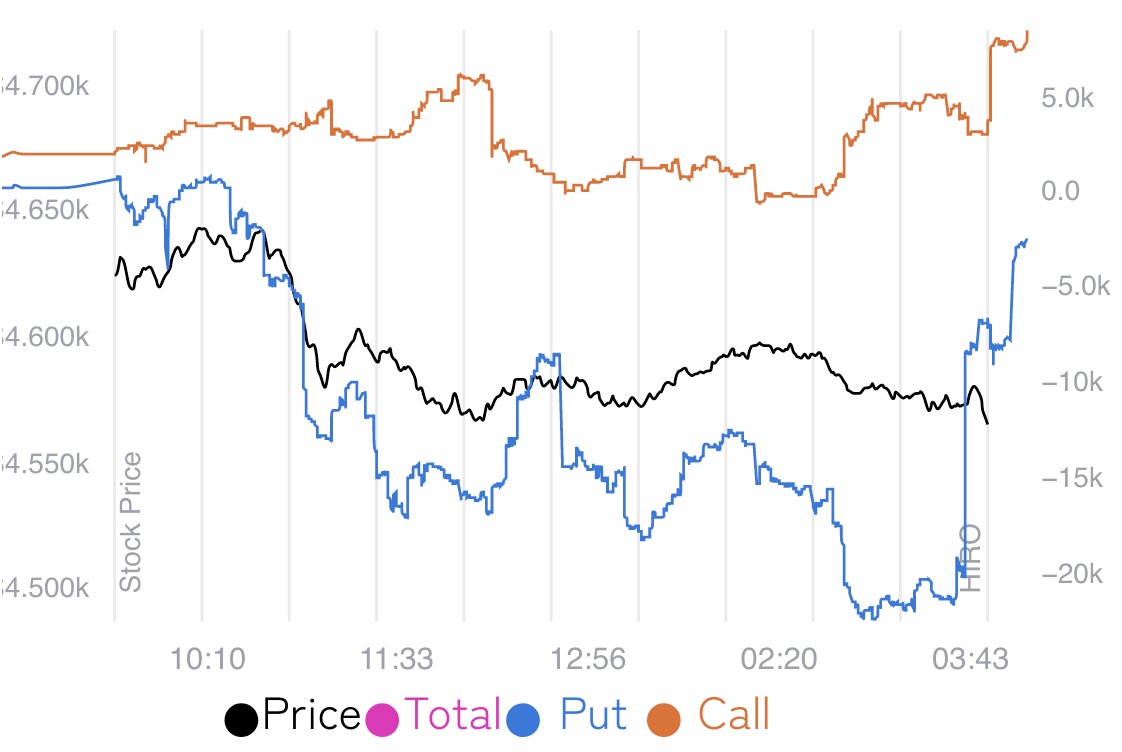
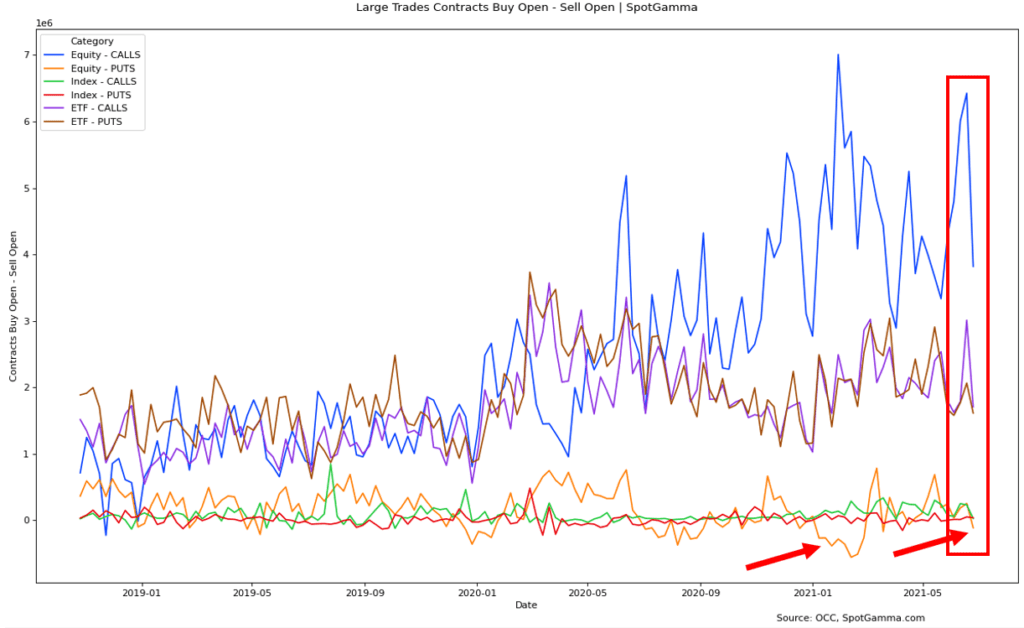
Positioning: Implied volatility expands as heightened demand for protection is priced in.

Graphic: VIX term structure shifts higher, especially at the front-end. This denotes the heightened potential for instability.

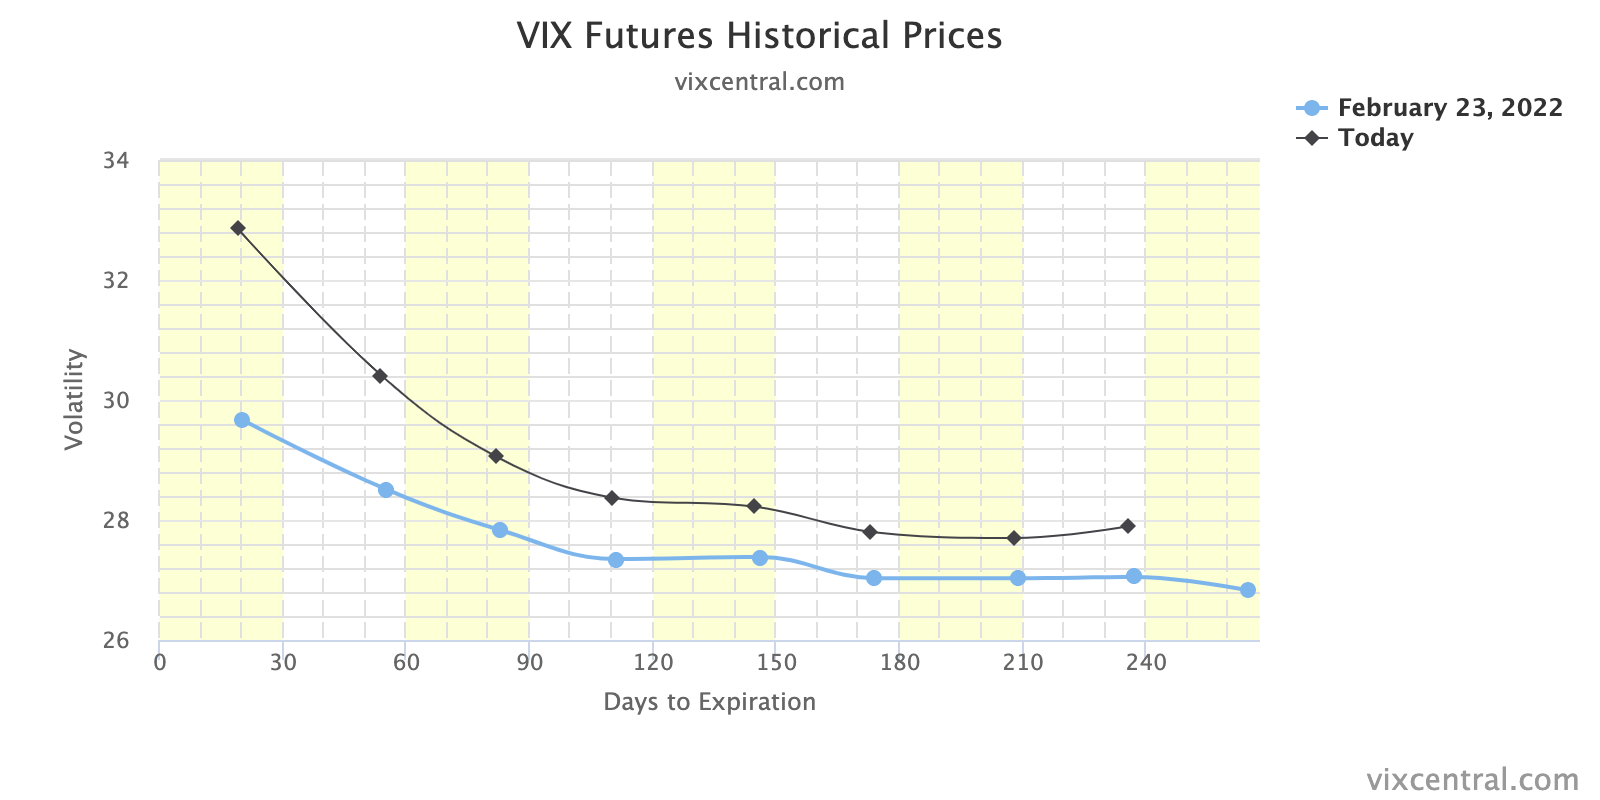
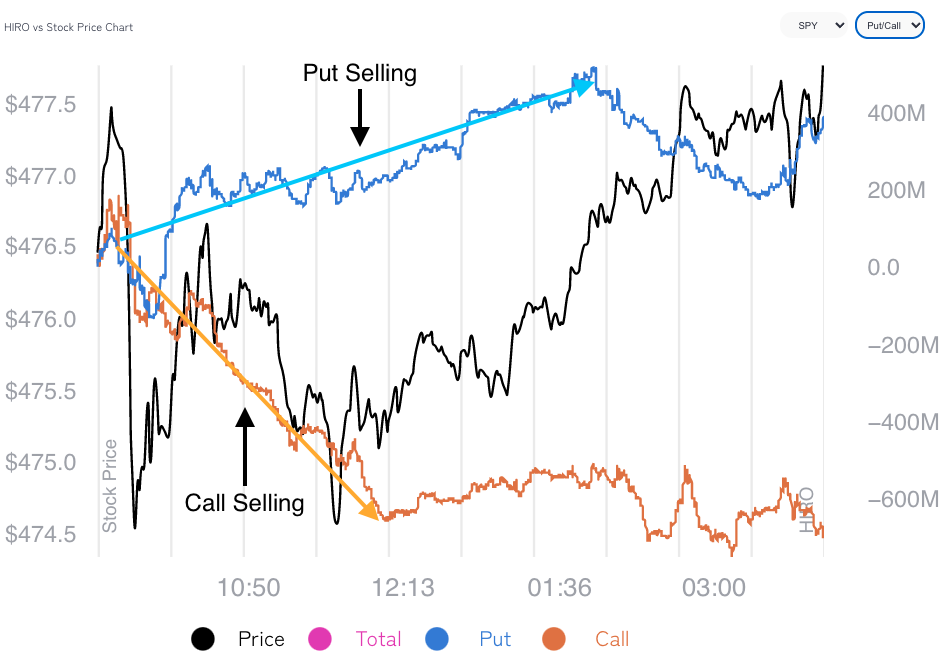
This comes after, according to views expressed by The Ambrus Group’s Kris Sidial, “we saw larger inflow[s] into equity funds, outflow[s] out of money markets, larger buying in the ATSs, with no real put buying.”

Graphic: Via EPFR, Barclays, and Bloomberg. Taken from The Market Ear.

In other words, measures of implied volatility were not performing; participants opportunistically buying the dip witnessed an SPX down, VIX down environment in which hedges were not being marked up accordingly.

Graphic: Per Tier1Alpha, “In the past, when the $SPX/ $VIX correlation goes back to negative, there have been some pretty memorable volatility events. Worth keeping in mind.”

The implications of this action are staggering. 

As stated yesterday, as most participants, at least at the index level, own protection, the counterparties to this trade are short protection. 

These counterparties, therefore, have positive exposure to delta (i.e., as index falls [rises], position loses [makes] money) and negative exposure to gamma, or delta (directional) sensitivity to underlying price changes (i.e., as the index moves against short option exposure, losses are multiplied). 

With measures of implied volatility expanding, as is the case when there is heightened demand for downside put protection, protection is bid and the dealer’s exposure to positive delta rises, which solicits more selling in the underlying (addition of short-delta hedges).

Graphic: SqueezeMetrics details the implications of customer activity in the options market, on the underlying’s order book. For instance, in selling a put, customers add liquidity and stabilize the market. How? The market maker long the put will buy (sell) the underlying to neutralize directional risk as price falls (rises).

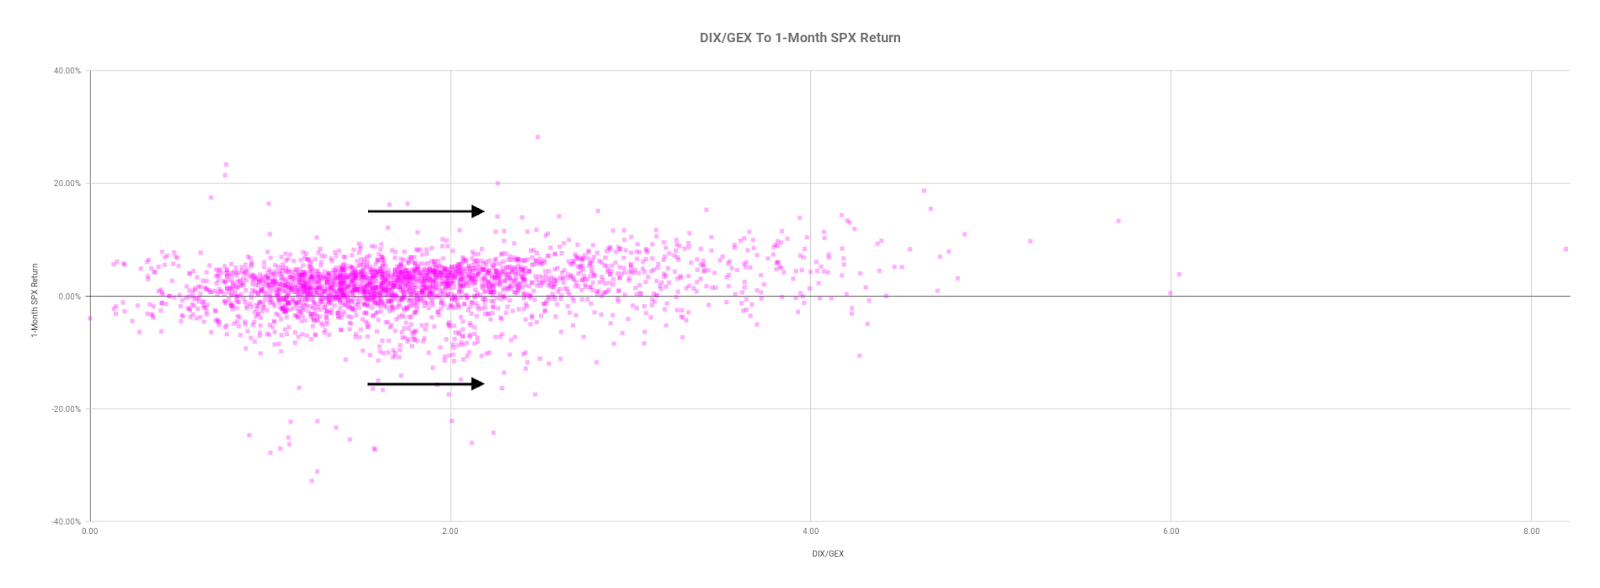
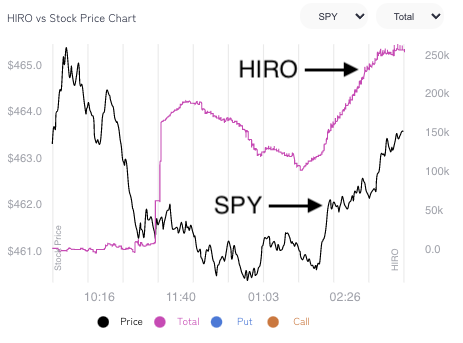
To monitor for capitulation, we may look for when the volatility expectations of implied volatility metrics rise to extremes. Learn more about VVIX, here.

Graphic: Charting the CBOE Volatility-Of-Volatility Index (INDEX: VVIX). In that reach for highly “convex” options, counterparties react in a manner that exacerbates underlying price movement.

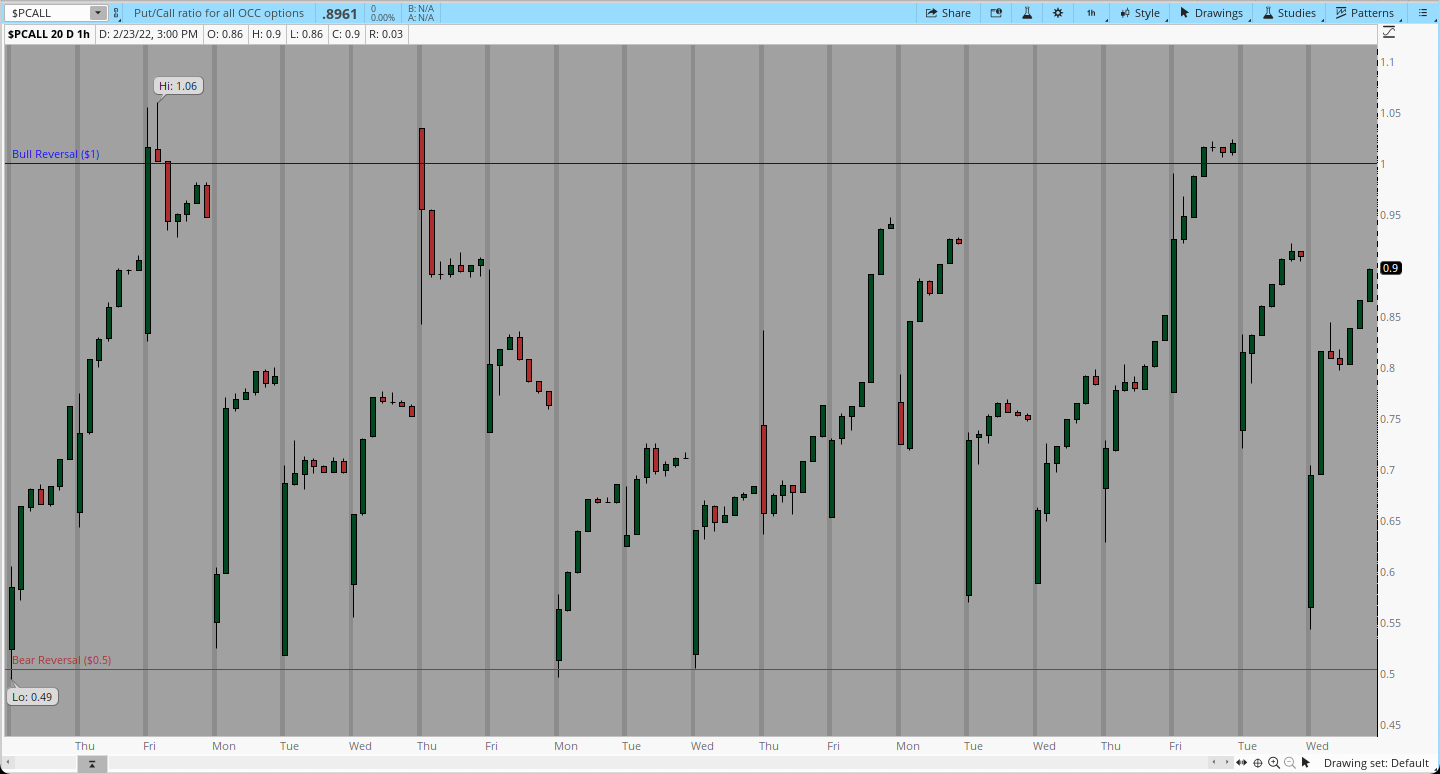
We may also measure for one-sidedness in sentiment by looking to naive metrics like the put/call ratio. Learn more about PCALL, here.

Graphic: Using the put/call ratio to gauge sentiment.

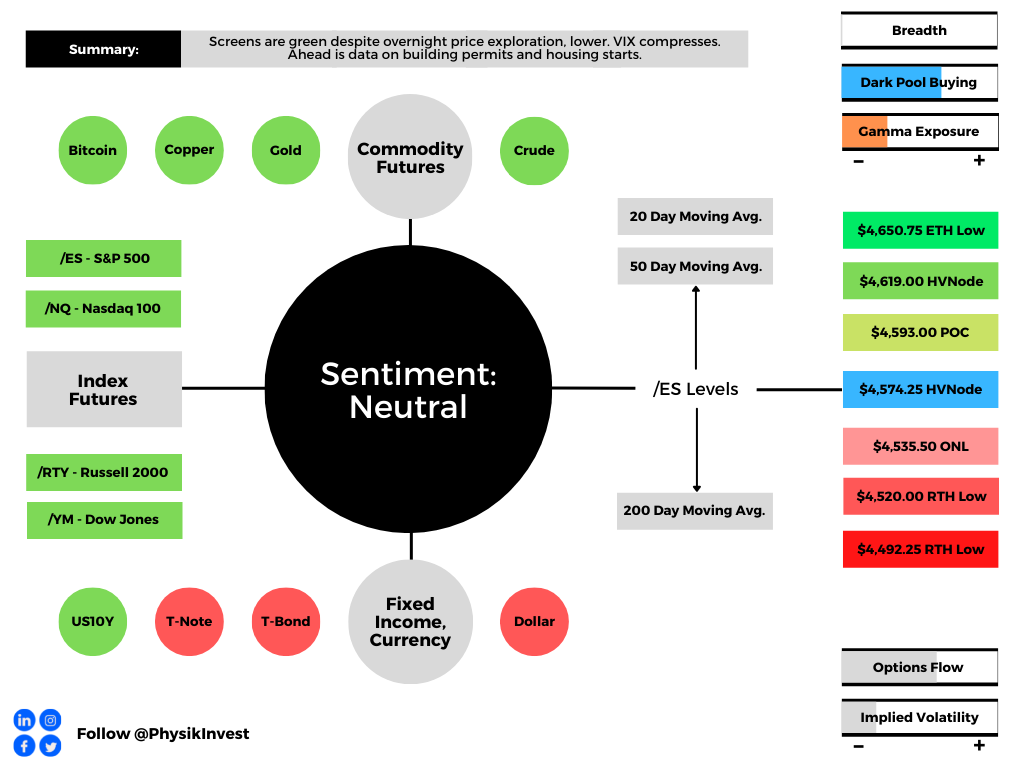
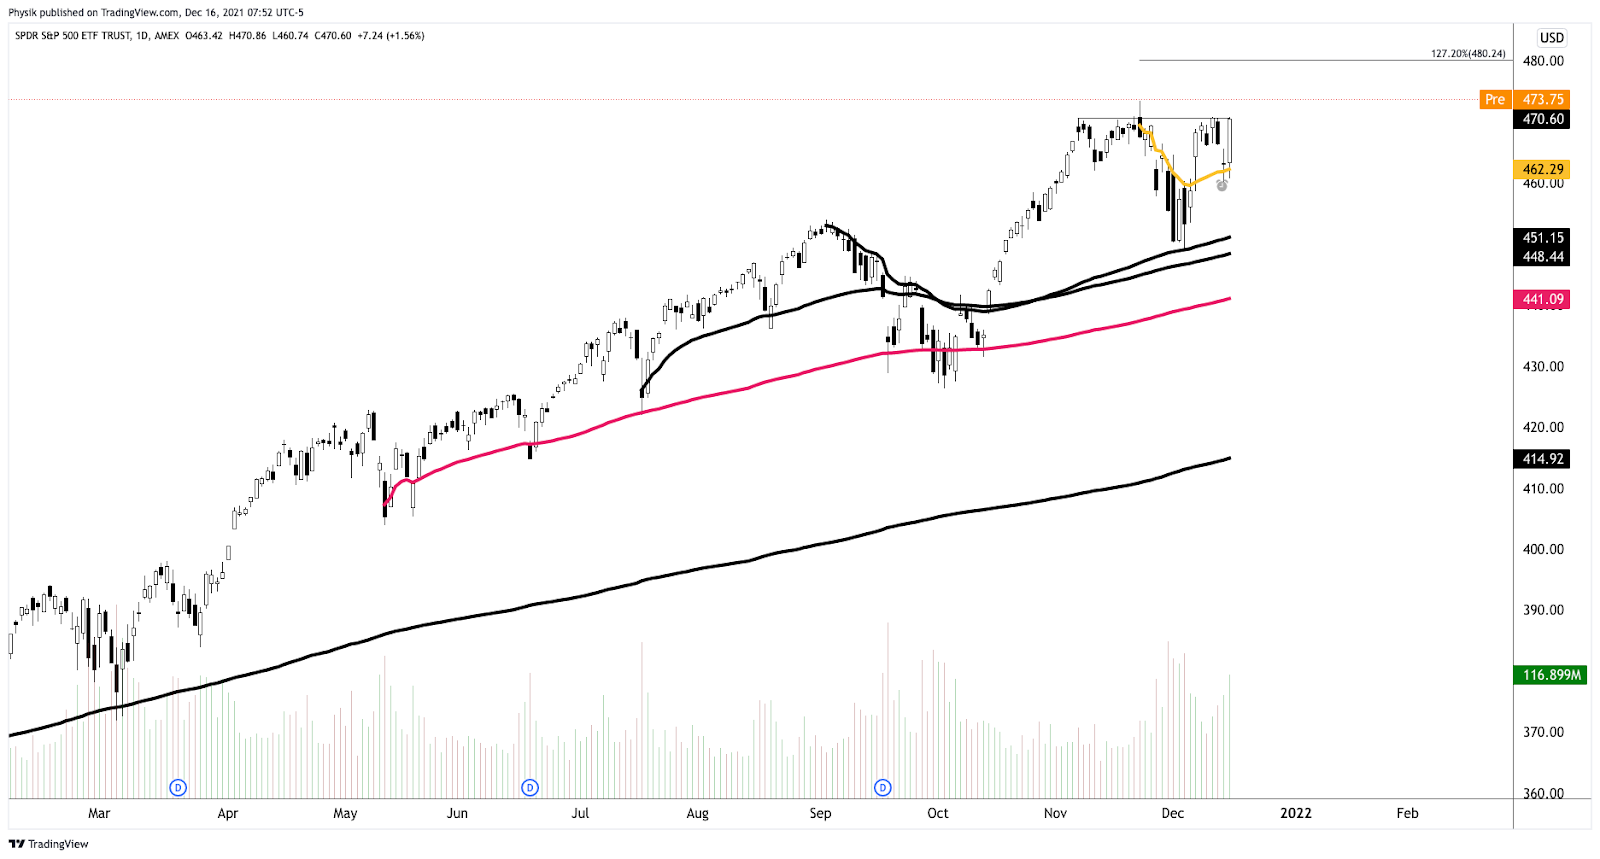
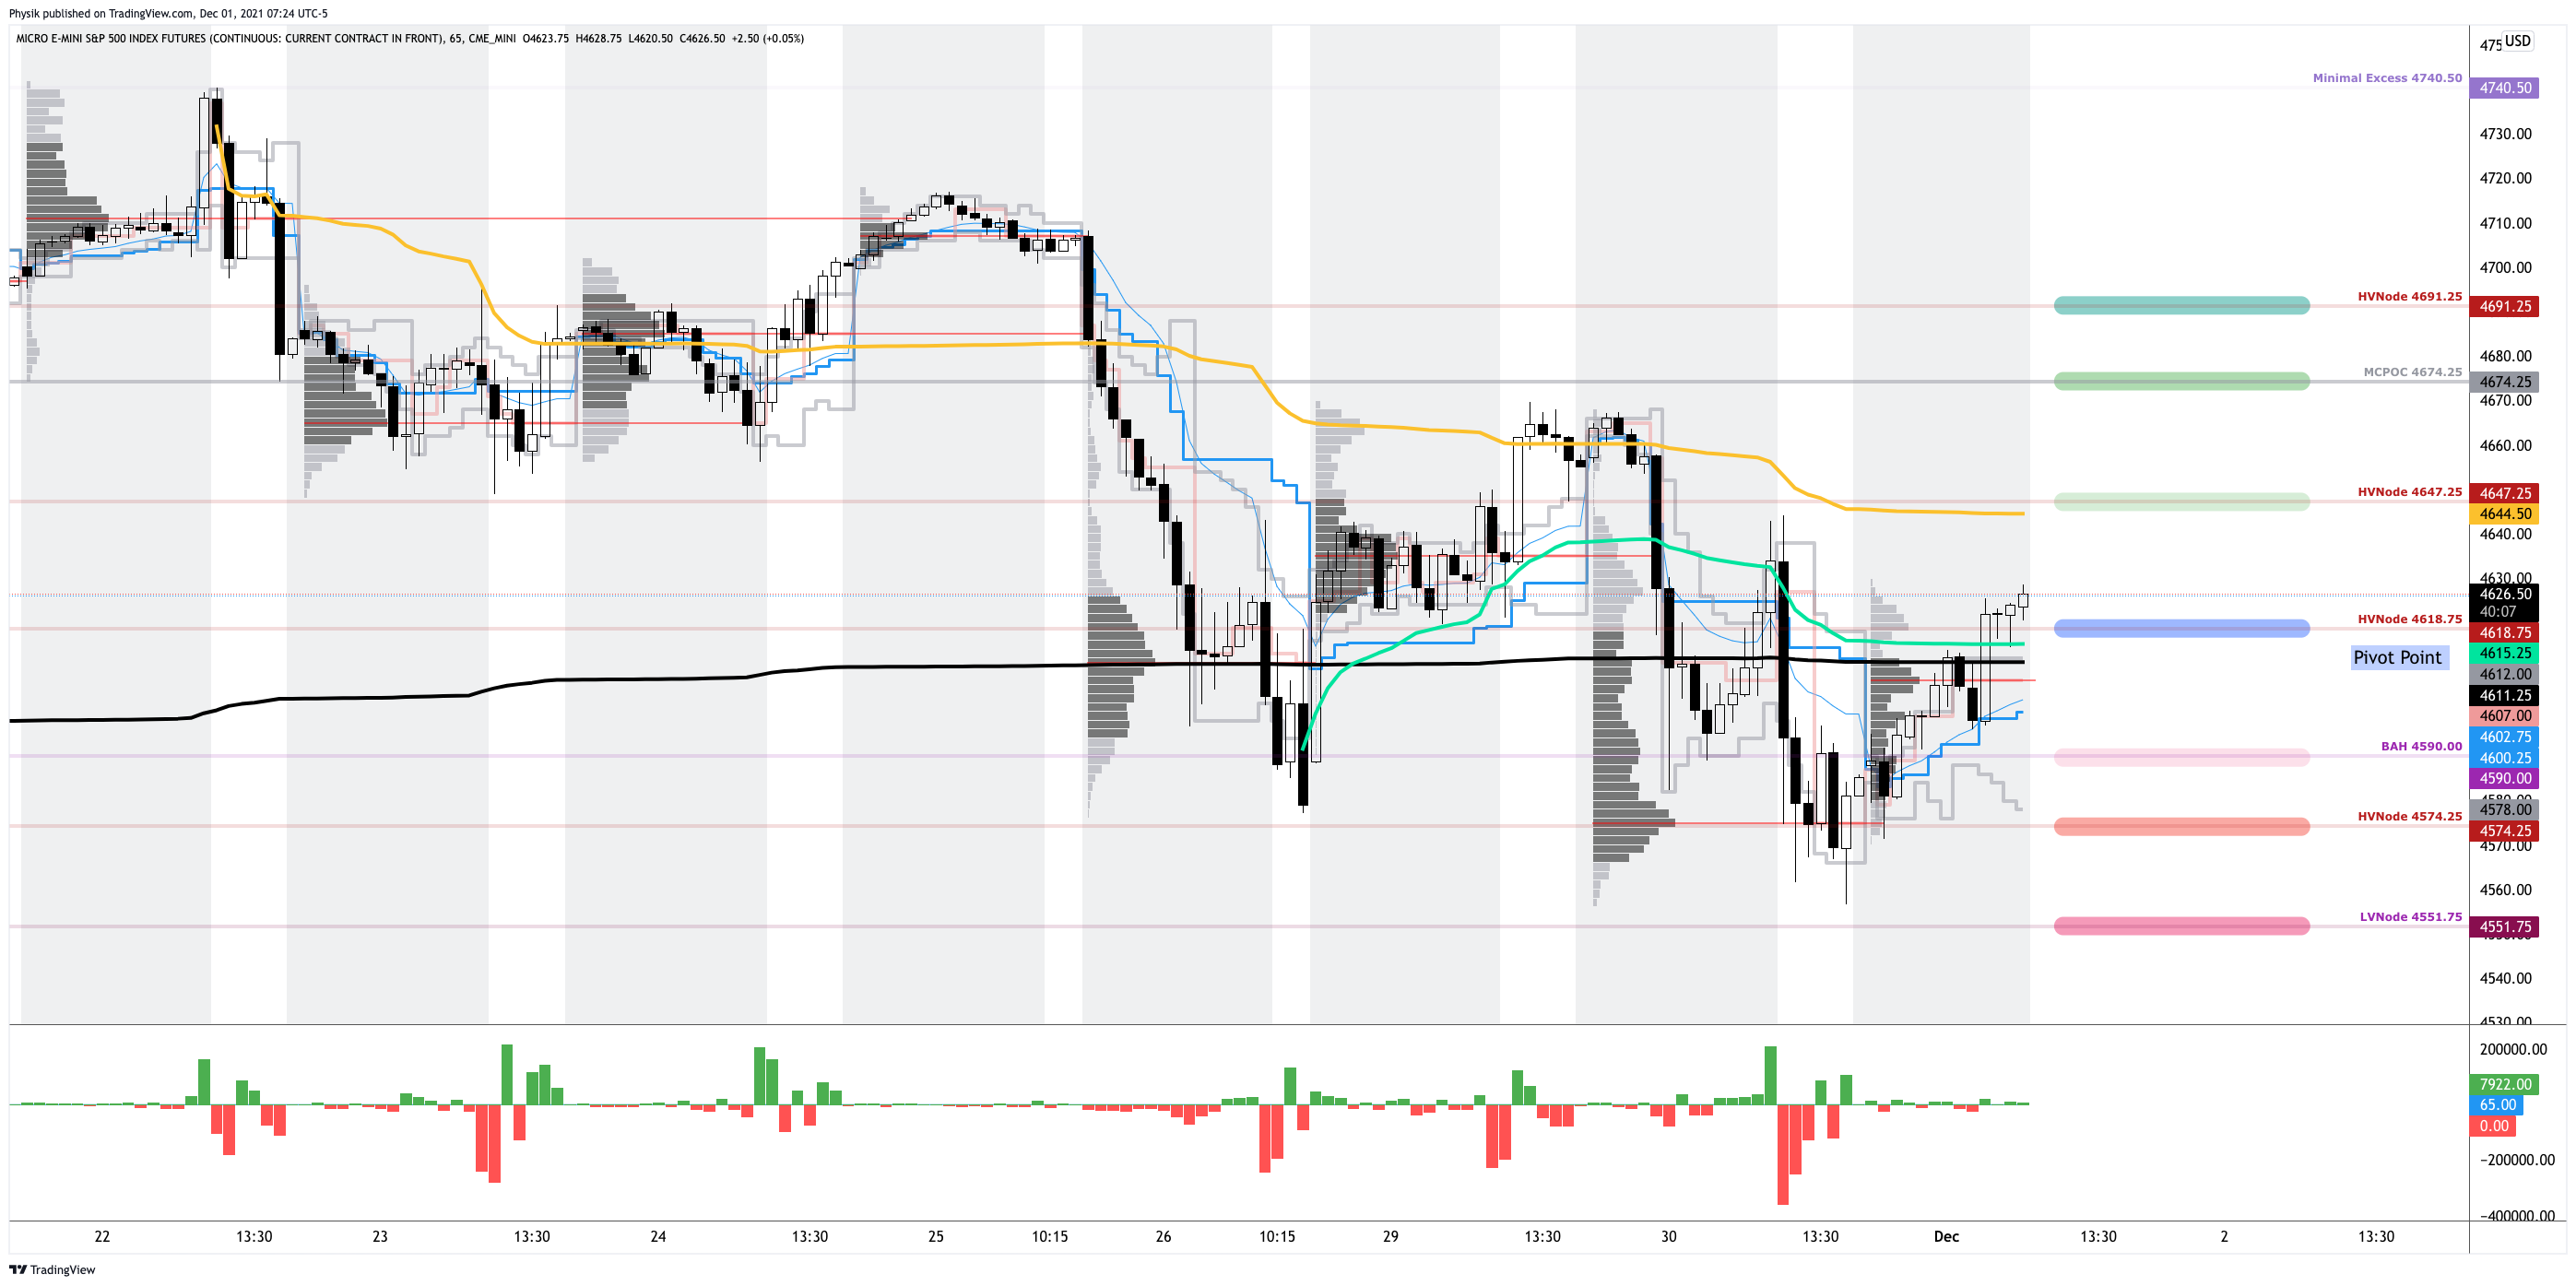
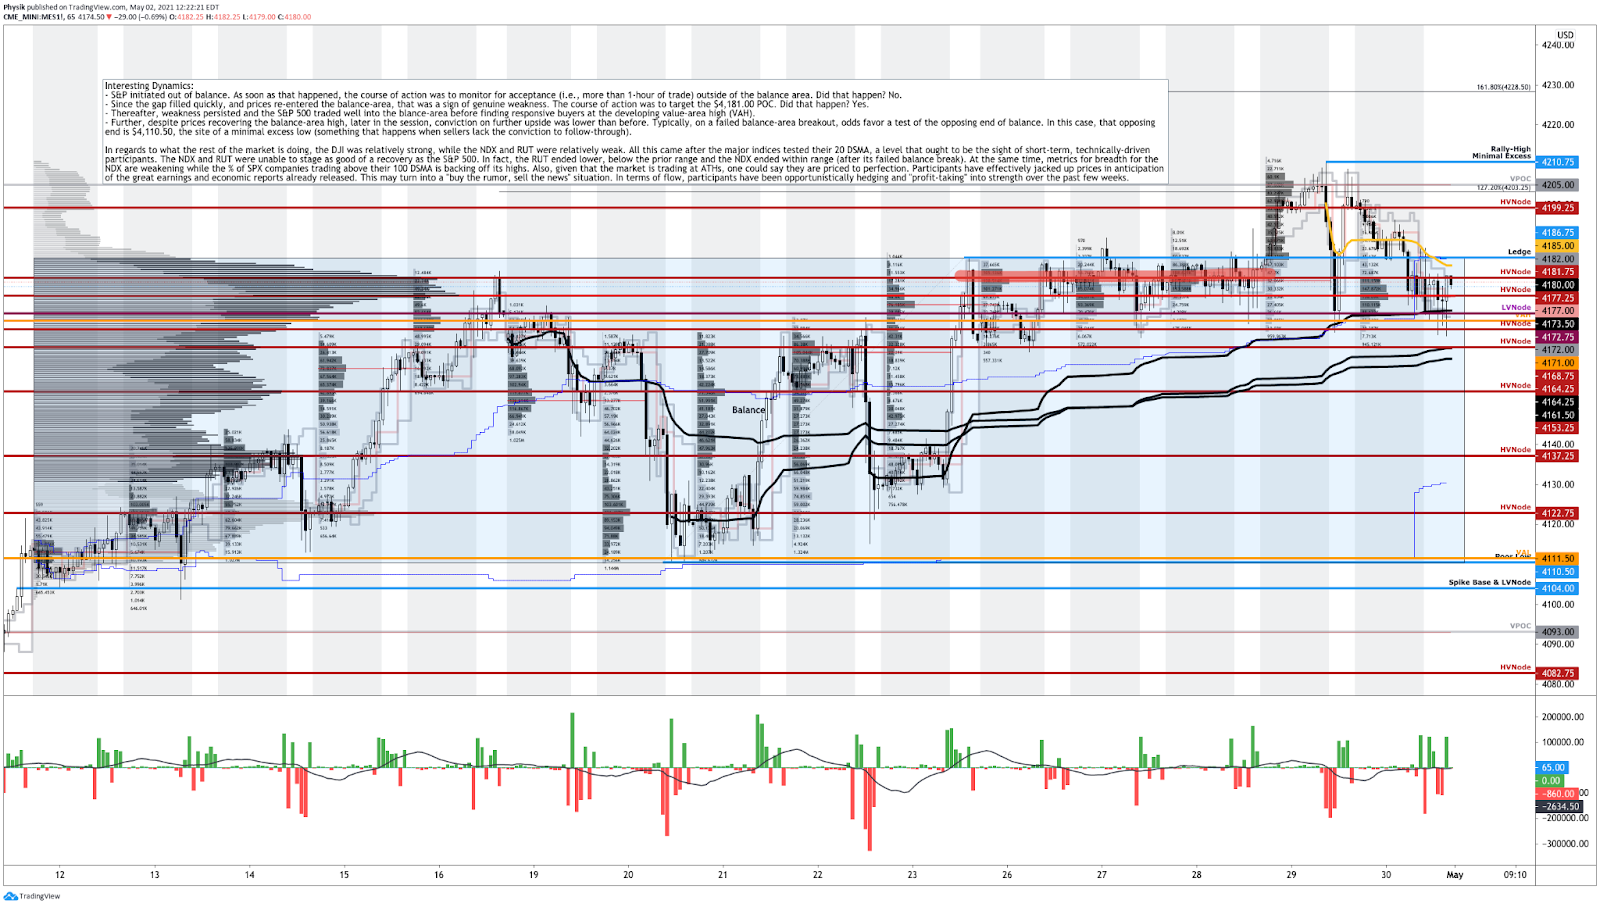
Technical: As of 6:30 AM ET, Thursday’s regular session (9:30 AM – 4:00 PM ET), in the S&P 500, will likely open in the lower part of a negatively skewed overnight inventory, outside of prior-range and -value, suggesting a potential for immediate directional opportunity.

Gap Scenarios: Gaps ought to fill quickly. Should they not, that’s a signal of strength; do not fade. Leaving value behind on a gap-fill or failing to fill a gap (i.e., remaining outside of the prior session’s range) is a go-with indicator.

Auctioning and spending at least 1-hour of trade back in the prior range suggests a lack of conviction; in such a case, do not follow the direction of the most recent initiative activity.

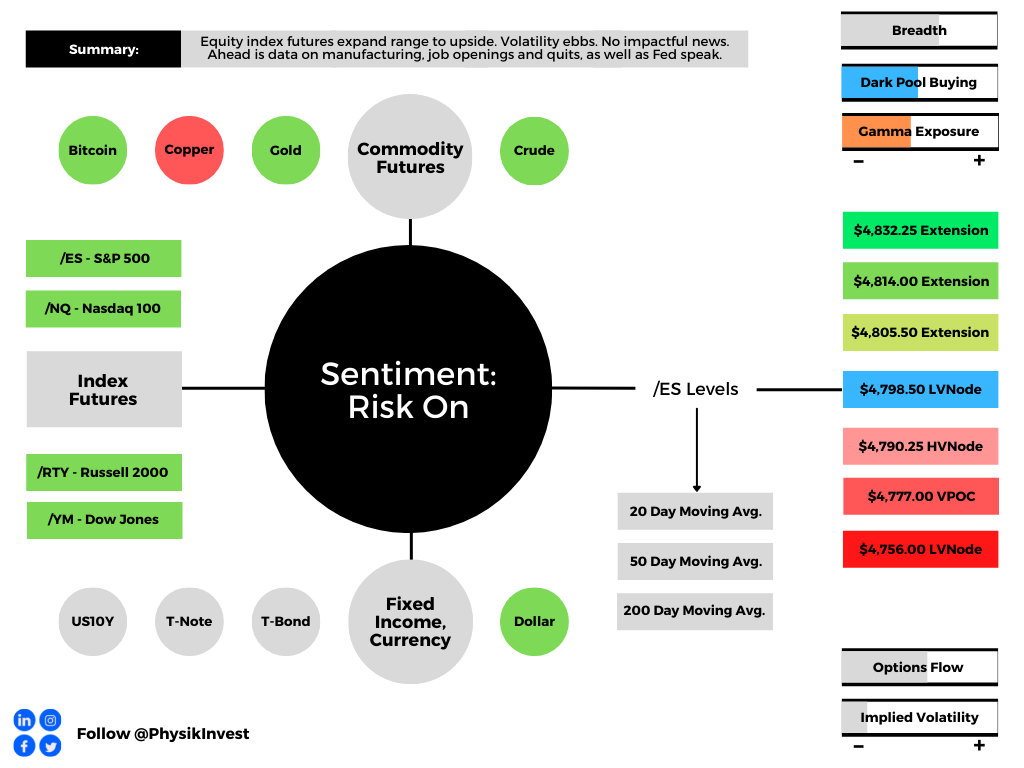
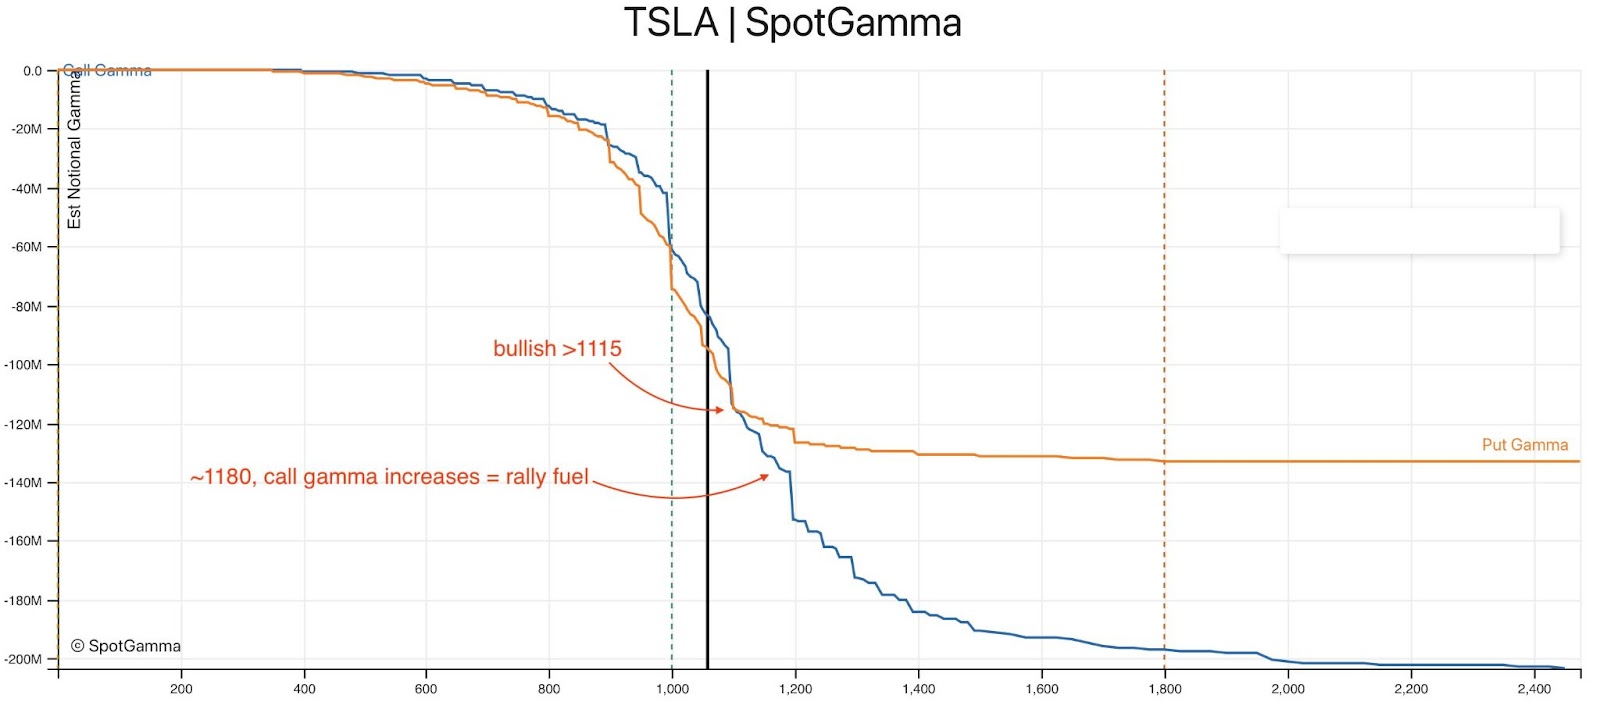
In the best case, the S&P 500 trades higher; activity above the $4,122.25 high volume area (HVNode) puts in play the $4,177.25 HVNode. Initiative trade beyond the HVNodes could reach as high as the $4,212.25 regular trade low (RTH Low) and $4,249.25 low volume area (LVNode), or higher.

In the worst case, the S&P 500 trades lower; activity below the $4,122.25 HVNode puts in play the $4,055.75 LVNode. Initiative trade beyond the latter could reach as low as the $3,978.50 LVNode and $3,943.25 HVNode, or lower.

Considerations: If you are not well-versed in navigating trade at heightened levels of volatility, it is best to sit on your hands (SOH) or trade with a smaller size. Often, on large gaps, indexes may move sideways (and not up or down). This can be frustrating. 

Also, in high volatility, negative-gamma environments, headlines matter, and technical analyses often fail. Do not think “this time is as others” and let this event lead to your demise. Caution.

Click here to load today’s key levels into the web-based TradingView charting platform. Note that all levels are derived using the 65-minute timeframe. New links are produced, daily.
Graphic: 65-minute profile chart of the Micro E-mini S&P 500 Futures.

What People Are Saying

Definitions

Volume Areas: A structurally sound market will build on areas of high volume (HVNodes). Should the market trend for long periods of time, it will lack sound structure, identified as low volume areas (LVNodes). LVNodes denote directional conviction and ought to offer support on any test. 

If participants were to auction and find acceptance into areas of prior low volume (LVNodes), then future discovery ought to be volatile and quick as participants look to HVNodes for favorable entry or exit.

About

After years of self-education, strategy development, mentorship, and trial-and-error, Renato Leonard Capelj began trading full-time and founded Physik Invest to detail his methods, research, and performance in the markets.

Capelj is also a Benzinga finance and technology reporter interviewing the likes of Shark Tank’s Kevin O’Leary, JC2 Ventures’ John Chambers, FTX’s Sam Bankman-Fried, and ARK Invest’s Catherine Wood, as well as a SpotGamma contributor developing insights around impactful options market dynamics.

Disclaimer

Physik Invest does not carry the right to provide advice.

In no way should the materials herein be construed as advice. Derivatives carry a substantial risk of loss. All content is for informational purposes only.

Categories
Commentary

Daily Brief For February 18, 2022

Editor’s Note: The Daily Brief is a free glimpse into the prevailing fundamental and technical drivers of U.S. equity market products. Join the 200+ that read this report daily, below!

What Happened

Overnight, equity index futures auctioned back up into range after a spike lower from multi-day balance. The overnight response, higher, happened after Russian Foreign Minister Sergei Lavrov agreed to meet U.S. Secretary of State Antony Blinken for talks in Europe next week.

Ahead is data on existing home sales and leading economic indicators (10:00 AM ET), as well as Fed-speak by Christopher Waller (10:15 AM ET), John Williams (11:00 AM ET), and Lael Brainard (1:30 PM ET).

In observance of Washington’s Birthday, markets are closed Monday, February 21, 2022.

Graphic updated 6:45 AM ET. Sentiment Neutral if expected /ES open is inside of the prior day’s range. /ES levels are derived from the profile graphic at the bottom of the following section. Levels may have changed since initially quoted; click here for the latest levels. SqueezeMetrics Dark Pool Index (DIX) and Gamma (GEX) calculations are based on where the prior day’s reading falls with respect to the MAX and MIN of all occurrences available. A higher DIX is bullish. At the same time, the lower the GEX, the more (expected) volatility. Learn the implications of volatility, direction, and moneyness. SHIFT data used for S&P 500 (INDEX: SPX) options activity. Note that options flow is sorted by the call premium spent; if more positive, then more was spent on call options. Breadth reflects a reading of the prior day’s NYSE Advance/Decline indicator. VIX reflects a current reading of the CBOE Volatility Index (INDEX: VIX) from 0-100.

What To Expect

Fundamental: Given the persistence of mechanical responses to key levels, visually-driven, weaker-handed participants (which seldom bear the wherewithal to defend retests) carry a heavier hand in recent price discovery.

The takeaway is that the larger, other time frame (OTF) participants are waiting for more information before committing to substantial expansion of range via large sales or buys.

Information the OTFs are seeking to process and position themselves in accordance with are (but not limited to) geopolitical tensions and contractionary monetary policy.

Thursday’s commentary went in-depth on the implications of more severe Fed-action. Mainly, to slow inflation and rid the market of excesses, “a Volcker moment” is needed a strategist said.

Graphic: Via MacroTrends & Cboe Options Institute. “Value stocks started to outperform when the Federal Reserve (under Greenspan) communicated their intent to tighten policy. Value fell out of favor in the middle of 2007 following a UST yield curve inversion and looser monetary policy (under Bernanke).”

The Ambrus Group’s Kris Sidial, and others, expressed their differing sentiments on the issue, given that equities are so intertwined with consumer savings.

“There is no way the fed looks to use additional volatility as a policeman,” he explained. “It’s one of those things that sounds ok in theory but will not work in real-world applications.”

As Moody’s Corporation (NYSE: MCO) puts well, “This cycle is unlike any recent one and, while there are a ton of reasons to be optimistic about the U.S. economy’s near-term prospects, there are also reasons to worry that a recession isn’t far off on the horizon.”

Graphic: Via St. Louis Fed. Taken from Cboe Global Markets Inc (BATS: CBOE). “In fact, a dynamic where short-dated bond yields are higher than longer-dated bonds can reinforce an economic slowdown. The cost of capital is perhaps the most important component for evaluating so many other market relationships. Any investment that involves borrowed money becomes more expensive when the cost of capital increases. More is spent on interest payments. Higher rates incentivize saving (as opposed to consumption) which impacts businesses and the economy as a whole.”

“If the Fed is forced to raise the fed funds rate above its neutral rate to tame inflation, the stage will be set for recession. Also, some Fed officials believe they are falling further behind the curve, which could lead to a more aggressive tightening cycle, a recipe for an economic downturn in 2023 or 2024.”

Based on this sentiment, investors have already bet – via the eurodollar futures contract – on the Fed reversing its tightening course in late 2023. The current baseline calls for four 25-basis point rate hikes this year.

Graphic: Via Bloomberg. “In the eurodollar futures markets, the spread between the December 2023 and December 2025 contracts has dropped further into negative territory on Monday — implying a near-25 basis point cut in the federal funds benchmark over this 24-month timeframe.”

“We, therefore, think that the more likely path is a longer series of 25-basis point increases in the target range for the fed funds rate and we may need to add an additional rate hike to our baseline forecast in March,” Moody’s says in response to more hawkish pricings as a result of market focus on comments by hawkish regional Fed presidents.

Graphic: Via TS Lombard. Taken from The Market Ear. “Flattening is normal when the Fed is tightening. Looking at the past eight hiking cycles, almost every segment of the curve has flattened on average without immediately triggering a recession.”

On that note, Mark Haefele, chief investment officer at UBS Group AG’s (NYSE: UBS) Global Wealth Management arm says that “Despite the recent volatility, it’s important to remember that we are still in an environment of robust economic and earnings growth.”

Graphic: Via Bloomberg. “If market dysfunction is reflected in tighter conditions, then this chart shows we’re nowhere near stressed levels — after all, central bank policy globally is historically loose.”

“Our base case we expect upside for equity markets over the balance of the year.”

Positioning: Passive buying flows persist alongside a drop in bearish sentiment readings.

Graphic: Via EPFR, Barclays PLC (NYSE: BCS), and Bloomberg. Taken from The Market Ear

This action is in the face of a collapse in margin debt.

Graphic: Via Tier1Alpha. Taken from The Market Ear. “Margin debt is a big part of the puzzle, but even more important is the “delta” of the margin debt. The YoY % change of FINRA margin debt looks slightly scary.”

In the credit markets, investment-grade spreads are at some of their widest levels since 2020. Per Bloomberg, put option (bets on the downside) open interest in corporate bond ETFs is at an all-time high.

“Rotate into credit now,” Chris Sheldon, the co-head of credit and markets at KKR, explained, taking a contrarian view. “As the rate volatility plays through the market segment, we think high yield could become more attractive very quickly.”

On the single-stock and index-level, options positioning suggests participants should continue to brace for volatility. Participants’ demand for protection (negative delta exposure) has left counterparties (dealers taking the other side and warehousing risk) adding negative delta exposure linearly (via stock and futures sales) to hedge.

To note, owning an option offers someone positive exposure to gamma or convexity (to have profits multiplied if the direction is correct, all else equal). On the other side, though, participants who are short gamma or convexity may have their losses multiplied if incorrect.

Making some naive assumptions on the build-in interest in options strikes at lower prices, we may surmise that dealers are exposed to increased negative gamma exposure. 

To hedge this, if volatility were to remain unchanged, dealers must sell (buy) into weakness (strength) to hedge increasing (decreasing) negative gamma exposure. If volatility rises (drops), then more stock and futures must be sold (bought/covered).

Pictured: SqueezeMetrics highlights implications of volatility, direction, and moneyness.

The monthly options expiration (OPEX) will coincide with the removal of lots of put-heavy exposures. This will decrease the dealers’ positive exposure to delta and make gamma exposures less negative. 

Therefore, absent some exogenous event that increases demand for protection, again, there is the potential for strength, post-OPEX. That’s when that real-money buying, alluded to above, may resolve in higher prices.

Technical: As of 6:30 AM ET, Friday’s regular session (9:30 AM – 4:00 PM ET), in the S&P 500, will likely open in the middle part of a positively skewed overnight inventory, inside of prior-range and -value, suggesting a limited potential for immediate directional opportunity.

Spikes: Spikes mark the beginning of a break from value. Spikes higher (lower) are validated by trade at or above (below) the spike base (i.e., the origin of the spike).

In the best case, the S&P 500 trades higher; activity above the $4,415.00 untested point of control (VPOC) puts in play the $4,438.00 key response area (balance boundary and high volume area). Initiative trade beyond the key response area could reach as high as the $4,464.75 low volume area (LVNode) and $4,485.00 regular trade high (RTH High), or higher.

In the worst case, the S&P 500 trades lower; activity below the $4,415.00 VPOC puts in play the $4,401.50 spike base. Initiative trade beyond the spike base could reach as low as the $4,367.25 regular trade low (RTH Low) and $4,332.75 high volume area (HVNode), or lower.

Click here to load today’s key levels into the web-based TradingView charting platform. Note that all levels are derived using the 65-minute timeframe. New links are produced, daily.
Graphic: 65-minute profile chart of the Micro E-mini S&P 500 Futures.

Definitions

Overnight Rally Highs (Lows): Typically, there is a low historical probability associated with overnight rally-highs (lows) ending the upside (downside) discovery process.

Volume Areas: A structurally sound market will build on areas of high volume (HVNodes). Should the market trend for long periods of time, it will lack sound structure, identified as low volume areas (LVNodes). LVNodes denote directional conviction and ought to offer support on any test. 

If participants were to auction and find acceptance into areas of prior low volume (LVNodes), then future discovery ought to be volatile and quick as participants look to HVNodes for favorable entry or exit.

POCs: POCs are valuable as they denote areas where two-sided trade was most prevalent in a prior day session. Participants will respond to future tests of value as they offer favorable entry and exit.

Options Expiration (OPEX): Traditionally, option expiries mark an end to pinning (i.e, the theory that market makers and institutions short options move stocks to the point where the greatest dollar value of contracts will expire) and the reduction dealer gamma exposure. In recent history, this reset in dealer positioning has been front-run; prior, there was an increase in volatility after the removal of large options positions and associated hedging.

Balance (Two-Timeframe Or Bracket): Rotational trade that denotes current prices offer favorable entry and exit. Balance-areas make it easy to spot a change in the market (i.e., the transition from two-time frame trade, or balance, to one-time frame trade, or trend). 

Modus operandi is responsive trade (i.e., fade the edges), rather than initiative trade (i.e., play the break).

Volume-Weighted Average Prices (VWAPs): A metric highly regarded by chief investment officers, among other participants, for quality of trade. Additionally, liquidity algorithms are benchmarked and programmed to buy and sell around VWAPs.

About

After years of self-education, strategy development, mentorship, and trial-and-error, Renato Leonard Capelj began trading full-time and founded Physik Invest to detail his methods, research, and performance in the markets.

Capelj is also a Benzinga finance and technology reporter interviewing the likes of Shark Tank’s Kevin O’Leary, JC2 Ventures’ John Chambers, FTX’s Sam Bankman-Fried, and ARK Invest’s Catherine Wood, as well as a SpotGamma contributor developing insights around impactful options market dynamics.

Disclaimer

Physik Invest does not carry the right to provide advice.

In no way should the materials herein be construed as advice. Derivatives carry a substantial risk of loss. All content is for informational purposes only.

Categories
Commentary

Daily Brief For January 24, 2022

The Daily Brief is a free glimpse into the prevailing fundamental and technical drivers of U.S. equity market products. Join the 200+ that read this report daily, below!

What Happened

Overnight, equity index futures auctioned sideways to lower while measures of implied volatility expanded, which suggests increased fear and demand for protection.

This is in the context of an environment wherein the equity market, in particular, is positioned for heightened volatility, albeit potential strength, after Friday’s large monthly options expiration.

Ahead is data on Markit Manufacturing and Services PMI (9:45 AM ET).

Graphic updated 6:15 AM ET. Sentiment Risk-Off if expected /ES open is below the prior day’s range. /ES levels are derived from the profile graphic at the bottom of the following section. Levels may have changed since initially quoted; click here for the latest levels. SqueezeMetrics Dark Pool Index (DIX) and Gamma (GEX) calculations are based on where the prior day’s reading falls with respect to the MAX and MIN of all occurrences available. A higher DIX is bullish. At the same time, the lower the GEX, the more (expected) volatility. Learn the implications of volatility, direction, and moneyness. SHIFT data used for S&P 500 (INDEX: SPX) options activity. Note that options flow is sorted by the call premium spent; if more positive, then more was spent on call options. Breadth reflects a reading of the prior day’s NYSE Advance/Decline indicator. VIX reflects a current reading of the CBOE Volatility Index (INDEX: VIX) from 0-100.

What To Expect

Fundamental: “The ratio of stocks hitting 52-week lows is at the highest since March 2020,” according to The Market Ear

In fact, in the face of a traditionally bullish period, seasonally, this is the worst January on record for the Nasdaq.

Graphic: Per Bloomberg, “Down almost 12% in January, the Nasdaq 100 is on course for its worst month since the 2008 global financial crisis. On any four-day basis, the current streak of 1% drops was the first since 2018.”

This weakness is in the context of months of divergent breadth by lesser weighted index constituents, geopolitical tensions, the prospects of reduced stimulus to combat high inflation, poor responses to earnings results, and disappointments in real demand and growth.

Graphic: @MacroAlf plots credit impulse as a percent of GDP and SPX year-over-year earnings.

The tone amongst retail participants is changing, too, with outflows starting for the first time since a major rush in account openings. When asked whether the selling is over, JPMorgan Chase & Co’s (NYSE: JPM) prime brokerage data suggests no.

This is in opposition to the typical trend into the start of the Federal Reserve (Fed) hiking cycles.

“U.S. equities have stumbled significantly on their way toward the first hike of this cycle, which is not the norm,” Jefferies Financial Group (NYSE: JEF) explained. “Performance tends to be poor immediately after the first hike, and can be worse if stocks are weakly into the first hike.”

Notwithstanding, Jefferies adds, “the SPX was higher in the 12 months that followed the start of each of the last 7 hike cycles.”

Graphic: S&P 500 performance before and after rate hikes.

With some of that context in mind, what is there to look forward to? The corporate buyback blackout window ended after the close of business, Friday, and equity inflows remain robust.

What is there to be wary of? 

Well, given that “risk is being repriced to fit the world where real rates are a lot higher, and the Fed put [is] much lower thanks to the Fed’s need to fight inflation,” this week’s Federal Open Market Committee (FOMC) meeting shall provide market participants more context as to the “timing and pace of QT” which may assuage fears unless the Fed is all out to “drop QE next week itself.”

The odds of that happening are low.

Graphic: Per Bloomberg, “As Savita Subramanian of Bank of America Corporation (NYSE: BAC) shows in the following chart, expected earnings are far less helpful in explaining market outcomes since 2010 than they were before. Meanwhile, changes in the Fed’s balance sheet, the amount of money it’s making available to markets, have become hugely important.”

As Bloomberg’s John Authers puts it well: “Despite many scares, money has stayed plentiful for the last decade, rates have fallen, and anyone who did much to protect themselves against the risk of a decline would have done badly by it.”

Graphic: As Goldman Sachs Group Inc (NYSE: GS) “shows in this chart, companies are becoming ever more profitable in a way that seems to be sustained.”

Positioning: The major broad market indices – the S&P 500, Nasdaq 100, and Russell 2000 – are in an environment characterized by negative gamma and heightened volumes. 

Graphic: Per Tom McClellan, “Persistently high volume late in QQQ is a sign of overly bearish sentiment worthy of a bottom. Key caveat: just because one notices a sentiment indication which should matter does not mean it has to matter right away.”

The negative gamma – in reference to the options counterparties reaction “when a position’s delta falls (rises) with stock or index price rises (falls)” – is what compounds the selling. 

With measures of implied volatility expanding, as is the case when there is heightened demand for downside put protection (a positive-delta trade for the dealers), protection is bid and the dealer’s exposure to positive delta rises, which solicits more selling in the underlying (addition of short-delta hedges).

Graphic: SqueezeMetrics details the implications of customer activity in the options market, on the underlying’s order book. For instance, in selling a put, customers add liquidity and stabilize the market. How? The market maker long the put will buy (sell) the underlying to neutralize directional risk as price falls (rises).

Moreover, in negative-gamma, dealers are selling weakness and buying strength, taking liquidity. 

That’s destabilizing but it appears that “Friday in the markets did not have abnormal liquidity across S&P500 stocks.”

Graphic: Per @HalfersPower on Twitter, liquidity rankings for S&P 500 components. 

High readings in indicators like the put/call volume ratio, which denotes heightened trade of puts, relative to calls, as well as how calm equity market volatility is relative to rate volatility, could be the result of adequate hedging into the monthly options expiration (OPEX) and this week’s FOMC meeting.

“A very nasty flush out on a key polarized psychological level (S&P 500 $4,500.00) on the highest negative gamma day on an OPEX,” said Kris Sidial of The Ambrus Group on the increased potential for relief as a result of aggressive dip-buying. 

“Aggressive shorts piling in on an already dismantled tech selloff, leading into FOMC meeting after an 8% decline in the market, and Apple Inc (NASDAQ: AAPL) reporting earnings.”

Sidial’s opinion that the market is due for a counter-trend rally, in the face of an environment in which “there does not seem to be a direct hazard,” is aligned with the expectation that removal of put-heavy exposure, post-OPEX, and a reduction in embedded event premiums tied to the approaching FOMC, opens up a window of strength, wherein dealers have less positive delta exposure to sell against.

Technical: As of 6:15 AM ET, Monday’s regular session (9:30 AM – 4:00 PM ET), in the S&P 500, will likely open in the lower part of a balanced skewed overnight inventory, outside of prior-range and -value, suggesting a potential for immediate directional opportunity.

Gap Scenarios: Gaps ought to fill quickly. Should they not, that’s a signal of strength; do not fade. Leaving value behind on a gap-fill or failing to fill a gap (i.e., remaining outside of the prior session’s range) is a go-with indicator.

Auctioning and spending at least 1-hour of trade back in the prior range suggests a lack of conviction; in such a case, do not follow the direction of the most recent initiative activity.

In the best case, the S&P 500 trades higher; activity above the $4,381.50 regular trade low (RTH Low) puts in play the $4,449.00 untested point of control (VPOC). Initiative trade beyond the VPOC could reach as high as the $4,486.75 RTH High and $4,526.25 high volume area (HVNode), or higher.

In the worst case, the S&P 500 trades lower; activity below the $4,381.50 RTH Low puts in play the $4,349.00 VPOC. Initiative trade beyond the $4,349.00 VPOC could reach as low as the $4,299.00 and $4,233.00 VPOC, or lower.

Considerations: The daily, weekly, and monthly charts are in alignment. 

The loss of trend across higher timeframes suggests a clear change in tone. This does not discount the potential for fast, but short-lived counter-trend rallies.

Click here to load today’s key levels into the web-based TradingView charting platform. Note that all levels are derived using the 65-minute timeframe. New links are produced, daily.
Graphic: 65-minute profile chart of the Micro E-mini S&P 500 Futures.

Definitions

Volume Areas: A structurally sound market will build on areas of high volume (HVNodes). Should the market trend for long periods of time, it will lack sound structure, identified as low volume areas (LVNodes). LVNodes denote directional conviction and ought to offer support on any test. 

If participants were to auction and find acceptance into areas of prior low volume (LVNodes), then future discovery ought to be volatile and quick as participants look to HVNodes for favorable entry or exit.

POCs: POCs are valuable as they denote areas where two-sided trade was most prevalent in a prior day session. Participants will respond to future tests of value as they offer favorable entry and exit.

Options Expiration (OPEX): Traditionally, option expiries mark an end to pinning (i.e, the theory that market makers and institutions short options move stocks to the point where the greatest dollar value of contracts will expire) and the reduction dealer gamma exposure.

About

After years of self-education, strategy development, mentorship, and trial-and-error, Renato Leonard Capelj began trading full-time and founded Physik Invest to detail his methods, research, and performance in the markets.

Capelj is also a Benzinga finance and technology reporter interviewing the likes of Shark Tank’s Kevin O’Leary, JC2 Ventures’ John Chambers, FTX’s Sam Bankman-Fried, and ARK Invest’s Catherine Wood, as well as a SpotGamma contributor developing insights around impactful options market dynamics.

Disclaimer

Physik Invest does not carry the right to provide advice.

In no way should the materials herein be construed as advice. Derivatives carry a substantial risk of loss. All content is for informational purposes only.

Categories
Commentary

Daily Brief For January 19, 2022

The Daily Brief is a free glimpse into the prevailing fundamental and technical drivers of U.S. equity market products. Join the 200+ that read this report daily, below!

What Happened

Overnight, equity index futures explored lower and hammered out a low. On that recovery, measures of implied volatility fell, and most commodity products and yields moved higher.

Ahead is data on Building Permits and Housing Starts (8:30 AM ET).

Graphic updated 6:30 AM ET. Sentiment Neutral if expected /ES open is inside of the prior day’s range. /ES levels are derived from the profile graphic at the bottom of the following section. Levels may have changed since initially quoted; click here for the latest levels. SqueezeMetrics Dark Pool Index (DIX) and Gamma (GEX) calculations are based on where the prior day’s reading falls with respect to the MAX and MIN of all occurrences available. A higher DIX is bullish. At the same time, the lower the GEX, the more (expected) volatility. Learn the implications of volatility, direction, and moneyness. SHIFT data used for S&P 500 (INDEX: SPX) options activity. Note that options flow is sorted by the call premium spent; if more positive, then more was spent on call options. Breadth reflects a reading of the prior day’s NYSE Advance/Decline indicator. VIX reflects a current reading of the CBOE Volatility Index (INDEX: VIX) from 0-100.

What To Expect

Fundamental: Narratives discussed, before, remain valid. 

Mainly, expected is strong economic and earnings growth, as well as cooling inflation.

However, according to a note published by Andy Constan of Damped Spring Advisors, “The lack of additional liquidity provided by Fed purchase will also remove a damper for the market and the economy keeping asset volatility well bid, while also causing asset diversification benefit to fall, generating rising portfolio volatility and the risk demanded to hold assets.”

Graphic: From Goldman Sachs (NYSE: GS). The Market Ear recaps: “Bigger moves in yields eventually spill over to SPX. We basically had the 2 sigma move in rates…and equities are behaving as they should.”

The Ambrus Group’s Kris Sidial made a great point, yesterday, too.

Basically, despite that the market is off about 5% from its highs, the go-to 60/40 portfolio and “diversified funds” are in turmoil.

This newsletter has touched on the “bonds down, equities down” dynamic in the past. 

In short, over the past 40 or so years, monetary policy was used as a crutch to support the economy. This promoted deflation, innovation, and the subsequent rise in valuations.

With rates near zero and lifting, that’s a headwind; coupled with participants’ increased exposure to rate and equity market risk, which can play into cross-market hedging and de-leveraging cascades, 60/40 turns into somewhat of a poor hedge.

Why? Higher rates have the potential to decrease the present value of future earnings, making stocks, especially those that are high growth, less attractive.

Putting it all together, per Constan, “If current, priced in, inflation and growth expectations are exactly realized we predict that risk premiums on 30-year yields will increase by 15bp and equity risk premium by 30bp,” Constan adds. 

“These risk premium expansions will generate a 2% headwind on long bond prices and a 10% headwind for equity prices.”

Morgan Stanley (NYSE: MS) strategists are in agreement.

“With our economic team’s new Fed forecast for the end of QE, 4 rate hikes, and the beginning of balance sheet normalization this year, our call for falling valuations is likely to happen faster and more broadly than our prior forecast.”

Also: “Companies have expedited supplies, they’ve hired a bunch of labor at higher prices and if there’s excess supply now in the first or second quarter, potentially temporarily that could lead to margin compressions.”

Graphic: Via comments made by Morgan Stanley’s (NYSE: MS) U.S. equity strategist Michael Wilson, “Our new Fed forecast simply brings forward our call for lower equity valuations and raises the risk in the first half of the year. The median stock remains expensive even though the most egregiously priced stocks have corrected.”

It’s looking like Ark Invest’s Catherine Wood hit the nail on the head with respect to her comments on inventory build-ups. 

Early in November, as this newsletter highlighted, the CIO said inflation was likely on its way out due to (1) productivity increases, (2) China housing and financial sector turmoil depressing commodity prices, (3) inventory build-ups, and (4) disruptive innovation.

“This is unsustainable,” she had said. “I’m wondering if even the housing market inflation is going to give way, here.”

Positioning: Despite elevated measures of implied volatility like the Cboe Volatility Index (INDEX: VIX) marking higher, the VIX term structure remains upward sloping. 

Graphic: VIX term structure via Vix Central. 

All that means is that we have yet to similar levels of destabilizing demand for protection. 

Graphic: SqueezeMetrics details the implications of customer activity in the options market, on the underlying’s order book. In buying a put, customers indirectly take liquidity as dealers, short the put, sell underlying to hedge. With higher levels of implied volatility, dealers’ exposure to direction increases. They hedge by selling more underlying.

Though conditions could worsen, taking into account options positioning, versus buying pressure (measured via short sales or liquidity provision on the market-making side), metrics remain positively skewed, more so than before.

Graphic: Data SqueezeMetrics. Graph via Physik Invest.

Any expansion in volatility, however, likely coincides with further weakness.

As a result, this, coupled with data that suggests “OPEX week returns peaked in 2016 and have trended lower since,” cautions us on trade into and after this week’s expiration of options on the VIX and equity products.

Technical: As of 6:30 AM ET, Wednesday’s regular session (9:30 AM – 4:00 PM ET), in the S&P 500, will likely open in the upper part of a negatively skewed overnight inventory, inside of prior-range and -value, suggesting a limited potential for immediate directional opportunity.

In the best case, the S&P 500 trades higher; activity above the $4,574.25 high volume area (HVNode) puts in play the $4,593.00 point of control (POC). Initiative trade beyond the POC could reach as high as the $4,619.00 HVNode and $4,650.75 extended trading hours low (ETH Low), or higher.

In the worst case, the S&P 500 trades lower; activity below the $4,574.25 HVNode puts in play the $4,535.50 overnight low (ONL). Initiative trade beyond the ONL could reach as low as the $4,520.00 and $4,492.00 regular trade low (RTH Low), or lower.

Click here to load today’s key levels into the web-based TradingView charting platform. Note that all levels are derived using the 65-minute timeframe. New links are produced, daily.
Graphic: 65-minute profile chart of the Micro E-mini S&P 500 Futures.

Definitions

Overnight Rally Highs (Lows): Typically, there is a low historical probability associated with overnight rally-highs (lows) ending the upside (downside) discovery process.

Volume Areas: A structurally sound market will build on areas of high volume (HVNodes). Should the market trend for long periods of time, it will lack sound structure, identified as low volume areas (LVNodes). LVNodes denote directional conviction and ought to offer support on any test. 

If participants were to auction and find acceptance into areas of prior low volume (LVNodes), then future discovery ought to be volatile and quick as participants look to HVNodes for favorable entry or exit.

DIX: For every buyer is a seller (usually a market maker). Using DIX — which is derived from short sales (i.e., liquidity provision on the market-making side) — we can measure buying pressure.

Vanna: The rate at which the delta of an option changes with respect to volatility.

Charm: The rate at which the delta of an option changes with respect to time.

POCs: POCs are valuable as they denote areas where two-sided trade was most prevalent in a prior day session. Participants will respond to future tests of value as they offer favorable entry and exit.

MCPOCs: POCs are valuable as they denote areas where two-sided trade was most prevalent over numerous day sessions. Participants will respond to future tests of value as they offer favorable entry and exit.

Options Expiration (OPEX): Traditionally, option expiries mark an end to pinning (i.e, the theory that market makers and institutions short options move stocks to the point where the greatest dollar value of contracts will expire) and the reduction dealer gamma exposure.

Inversion Of VIX Futures Term Structure: Longer-dated VIX expiries are less expensive; is a warning of elevated near-term risks for equity market stability.

About

After years of self-education, strategy development, mentorship, and trial-and-error, Renato Leonard Capelj began trading full-time and founded Physik Invest to detail his methods, research, and performance in the markets.

Capelj is also a Benzinga finance and technology reporter interviewing the likes of Shark Tank’s Kevin O’Leary, JC2 Ventures’ John Chambers, FTX’s Sam Bankman-Fried, and ARK Invest’s Catherine Wood, as well as a SpotGamma contributor developing insights around impactful options market dynamics.

Disclaimer

Physik Invest does not carry the right to provide advice.

In no way should the materials herein be construed as advice. Derivatives carry a substantial risk of loss. All content is for informational purposes only.

Categories
Commentary

Daily Brief For January 4, 2022

What Happened

Overnight, equity index futures auctioned higher alongside most commodities and volatility fell.

This is as investors await data on manufacturing and job openings/quits (10:00 AM ET).

Graphic updated 6:30 AM ET. Sentiment Risk-On if expected /ES open is above the prior day’s range. /ES levels are derived from the profile graphic at the bottom of the following section. Levels may have changed since initially quoted; click here for the latest levels. SqueezeMetrics Dark Pool Index (DIX) and Gamma (GEX) calculations are based on where the prior day’s reading falls with respect to the MAX and MIN of all occurrences available. A higher DIX is bullish. At the same time, the lower the GEX, the more (expected) volatility. Learn the implications of volatility, direction, and moneyness. SHIFT data used for S&P 500 (INDEX: SPX) options activity. Note that options flow is sorted by the call premium spent; if more positive then more was spent on call options. Breadth reflects a reading of the prior day’s NYSE Advance/Decline indicator. VIX reflects a current reading of the CBOE Volatility Index (INDEX: VIX) from 0-100.

What To Expect

Fundamental: The aforementioned trade is happening in the context of a resurgence in the coronavirus, as well as the Federal Reserve’s intent to moderate stimulus, among other things. 

“We expect 2022 to be far more challenging from an investment perspective,” Heather Wald, vice president at Bel Air Investment Advisors, said

“Rarely has a market delivered three consecutive years of double-digit returns, as we have seen from 2019-2021. With the Federal Reserve set to accelerate tightening and a fairly valued stock market, we anticipate more muted returns for the S&P next year but still expect equities to remain attractive versus other liquid asset classes.” 

Wald’s comments align with some metrics posted by LPL Financial’s Ryan Detrick. 

“The bad news is when the S&P 500 gains more than 25% in a year, it has never gained more the following year,” Detrick said. “The good news? That next year can still be pretty darn good. Higher 85% of the time and up a solid 11% on average.”

Graphic: S&P 500 returns via Ryan Detrick. 

This is as the S&P 500 sticks to its seasonal script; in the face of light positioning metrics, expected are massive inflows in the first few months of this year. 

Graphic: Per The Market Ear, “January typically sees 134% of inflows (the rest of the 11 months -34%). And with every private wealth manager in the world right now pitching increased allocations into equities (out of cash and out of bonds), Goldman calculates that keeping 2021 pace, This would be $125BN worth of inflows quickly in January.”

This year is likely to be “dominated by continued knife-edge judgments by the Fed,” and inflation proving better than the most pessimistic forecasts, potentially. 

The prospects of a rally into the first rate hike are emboldened. Thereafter, the market may decline through the rest of 2022.

Positioning: Interesting Twitter thread by Kris Sidial on the transfer of risk in different areas of the volatility term structure. 

“You are seeing institutions aim to harvest the VRP in single stock land by hammering away at the front of the term structure. Especially the exotics desks that are notorious for carrying this inherent short calendar profile.”

What Sidial is talking about is most easily visualized by the compression and expansion of the VIX term structure in the graphic below. Notice the front move, relative to the back, below.

Graphic: VIX term shifts inward; as mostly short-dated protection is monetized or expired, volatility collapses and dealers’ exposure to the positive delta (via short puts) declines which meant they would cover their short futures hedges. This “vanna” flow bolsters SPX rallies.

The implications of this are staggering.

Participants, having been pushed out the risk curve, are using leverage to juice returns; option volumes are comparable to stock volumes.

As a result, related hedging flows represent an increased share of volume. 

As I once wrote in a Benzinga article: “The reflexive response by the opposing side of options trades — a result of regulatory frameworks, the low-interest-rate environment, as well as growth of the derivatives complex — causes a cascading reaction that exacerbates underlying price movements.”

Sidial adds: “[T]his short gamma profile with more and more people using derivatives will make way for the rapid moves in shorter time frames.”

That explains a lot!

Moreover, if we zoom in more narrow, today, though implied volatility “is well above its pre-COVID level across the term structure,” it is being sold at the front end.

SpotGamma data confirms this. Via the graphic below, the compression of volatility coincides with call and put selling at the index level; note, though, the increased put selling (more bullish).

Graphic: SpotGamma’s Hedging Impact of Real-Time Options (HIRO) indicator.

Participants’ activity in shorter-dated tenors (as evidenced by the compression of VIX term structure mainly at the front-end) where options are more so sensitive to changes in the underlying price, time, and volatility, is promoting choppy (but bullish) price action, for now.

With bullish activity in single stocks like Tesla Inc (which was primed for an options-driven squeeze heading into Monday) feeding into S&P positioning, alongside the removal of hedges to positioning that was pressuring stocks and indices heading into Friday OPEX, and passive buying support, there’s potentially more room for higher, to put it simply.

Graphic: SpotGamma posts on TSLA’s options positioning, Monday.

In the end, the concern is whether this bullishness leaves participants reaching for downside (put) protection, later. This would have destabilizing implications, as Sidial alluded to earlier.

Graphic: The “Biggest tail risk to SPX isn’t any macro data/virus/war but its own options market.”

Expectations: As of 6:30 AM ET, Tuesday’s regular session (9:30 AM – 4:00 PM ET), in the S&P 500, will likely open in the upper part of a positively skewed overnight inventory, outside of prior-range and -value, suggesting a potential for immediate directional opportunity.

Balance-Break + Gap Scenarios: A change in the market (i.e., the transition from two-time frame trade, or balance, to one-time frame trade, or trend) is occurring.

Monitor for acceptance (i.e., more than 1-hour of trade) outside of the balance area. 

Leaving value behind on a gap-fill or failing to fill a gap (i.e., remaining outside of the prior session’s range) is a go-with indicator. 

Rejection (i.e., return inside of balance) portends a move to the opposite end of the balance.

In the best case, the S&P 500 trades higher; activity above the $4,798.50 low volume area (LVNode) puts in play the $4,805.50 extension. Initiative trade beyond the $4,805.50 could reach as high as the $4,814.00 and $4,832.25 extension, or higher.

In the worst case, the S&P 500 trades lower; activity below the $4,798.50 LVNode puts in play the $4,790.25 high volume area (HVNode). Initiative trade beyond the HVNode could reach as low as the $4,777.00 untested point of control (VPOC) and $4,756.00 LVNode, or lower.

Click here to load today’s key levels into the web-based TradingView charting platform. Note that all levels are derived using the 65-minute timeframe. New links are produced, daily.
Graphic: 65-minute profile chart of the Micro E-mini S&P 500 Futures.

Definitions

Volume Areas: A structurally sound market will build on areas of high volume (HVNodes). Should the market trend for long periods of time, it will lack sound structure, identified as low volume areas (LVNodes). LVNodes denote directional conviction and ought to offer support on any test. 

If participants were to auction and find acceptance into areas of prior low volume (LVNodes), then future discovery ought to be volatile and quick as participants look to HVNodes for favorable entry or exit.

Gamma: Gamma is the sensitivity of an option to changes in the underlying price. Dealers that take the other side of options trades hedge their exposure to risk by buying and selling the underlying. When dealers are short-gamma, they hedge by buying into strength and selling into weakness. When dealers are long-gamma, they hedge by selling into strength and buying into weakness. The former exacerbates volatility. The latter calms volatility.

Vanna: The rate at which the delta of an option changes with respect to volatility.

Charm: The rate at which the delta of an option changes with respect to time.

POCs: POCs are valuable as they denote areas where two-sided trade was most prevalent in a prior day session. Participants will respond to future tests of value as they offer favorable entry and exit.

Options Expiration (OPEX): Traditionally, option expiries mark an end to pinning (i.e, the theory that market makers and institutions short options move stocks to the point where the greatest dollar value of contracts will expire) and the reduction dealer gamma exposure.

Volume-Weighted Average Prices (VWAPs): A metric highly regarded by chief investment officers, among other participants, for quality of trade. Additionally, liquidity algorithms are benchmarked and programmed to buy and sell around VWAPs.

Rates: Low rates have to potential to increase the present value of future earnings making stocks, especially those that are high growth, more attractive. To note, inflation and rates move inversely to each other. Low rates stimulate demand for loans (i.e., borrowing money is more attractive).

About

After years of self-education, strategy development, mentorship, and trial-and-error, Renato Leonard Capelj began trading full-time and founded Physik Invest to detail his methods, research, and performance in the markets.

Capelj is also a Benzinga finance and technology reporter interviewing the likes of Shark Tank’s Kevin O’Leary, JC2 Ventures’ John Chambers, FTX’s Sam Bankman-Fried, and ARK Invest’s Catherine Wood, as well as a SpotGamma contributor developing insights around impactful options market dynamics.

Disclaimer

At this time, Physik Invest does not carry the right to provide advice. 

In no way should the materials herein be construed as advice. Derivatives carry a substantial risk of loss. All content is for informational purposes only.

Categories
Methodology

Theory Applied: Contextualizing Recent Market Volatility

With SpotGamma, Physik Invest’s Renato Leonard Capelj unpacks recent market movements from an options positioning perspective.

Coverage includes the following:

  • Definition and application of first and second order options greeks.
  • Implications of the November and December options expirations.
  • How current positioning may dictate trade in Q1 2022 and beyond.
  • Expert commentary and much more!

Click below to learn more!

Categories
Commentary

Daily Brief For December 16, 2021

What Happened

After the Federal Reserve (Fed) announced it would accelerate its taper to bond-buying, clearing the way for interest-rate hikes, the equity market rallied, broadly. 

With all major U.S. equity index futures trading higher, overnight, it appears that participants’ fears regarding monetary policy have been assuaged

As forecasted, a collapse in event-related implied volatility brought in positive flows that ought to support the market into this week’s weighty “quad-witching” derivatives expiry.

Ahead is data on jobless claims, building permits, housing starts, and manufacturing (8:30 AM ET). Then, there are releases on industrial production, capacity utilization (9:15 AM ET), as well as Markit manufacturing and services PMI (9:45 AM ET). 

Graphic updated 6:15 AM ET. Sentiment Risk-On if expected /ES open is above the prior day’s range. /ES levels are derived from the profile graphic at the bottom of the following section. Levels may have changed since initially quoted; click here for the latest levels. SqueezeMetrics Dark Pool Index (DIX) and Gamma (GEX) calculations are based on where the prior day’s reading falls with respect to the MAX and MIN of all occurrences available. A higher DIX is bullish. At the same time, the lower the GEX, the more (expected) volatility. Learn the implications of volatility, direction, and moneyness. SHIFT data used for S&P 500 (INDEX: SPX) options activity. Note that options flow is sorted by the call premium spent; if more positive then more was spent on call options. Breadth reflects a reading of the prior day’s NYSE Advance/Decline indicator. VIX reflects a current reading of the CBOE Volatility Index (INDEX: VIX) from 0-100.

What To Expect

Market hammered out a low, yesterday. 

This was after, to start the week, customers had been increasing their exposure to short-delta (call selling and put buying). The counterparty inventorying the opposite (long-delta) exposure sold (bought) futures into price discovery higher (lower).

Graphic: Customers increased their exposure to short-delta call exposure. “Last week was about selling index calls,” SpotGamma’s Brent Kochuba said on Twitter. “This is likely why the $SPX stopped at $4,700.00.”

This dynamic had the effect of pinning the market; was the S&P 500 to remain in consolidation, customers’ (dealers’) short-delta (long-delta) would have risen which would have made for even more pinning.

That didn’t happen, though.

Into Wednesday’s FOMC event, demand for protection expanded (as evidenced by a higher CBOE Volatility Index reading). That knocked most of the major indexes out of sideways trade.

However, as revealed Tuesday by SpotGamma’s (beta) Hedging Impact of Real-Time Options (HIRO) indicator, “participants saw lower prices as an opportunity to express their opinion of lower volatility into Wednesday’s Federal Open Market Committee (FOMC) update.”

From there on, as Ambrus Group’s Kris Sidial best explained, “vols were static in anticipation of the fed talk,” taking away from supportive flows (as a result of options sliding down their term structure [vanna]) and promoting sideways trade.

Graphic: SpotGamma’s Hedging Impact of Real-Time Options (HIRO) indicator, which is pink in color, was sideways to higher. This suggests positive options delta trades likely had dealers buying stock/futures into the close.

Context: Wednesday’s commentary really hit the nail on the head, so to speak. 

Therefore, I offer some light updates.

As expected, per Nordea, the Fed will “accelerate its tapering process, and is now set to conclude net purchases already by mid-March vs mid-June with the earlier pace.”

“The dot plot was revised significantly higher, and the plot now shows three hikes for next year, a further three for 2023 and another two for 2024.”

Graphic: “[T]he terminal rate being priced in by financial markets is closer to 1.5% vs. 2.5% for the Fed,” Nordea explained. “The market is now pricing that rate hikes could start already in the mid-March 2022 meeting.”

That said, today’s rates support validations better than in the ‘90s.

At the same time, equity markets tend to rally into the first hike; Moody’s Corporation’s (NYSE: MCO) forecast aligns with that – “the Dow Jones Industrial Average increases this quarter and peaks in early 2022, … [followed by] steady decline through 2022.”

Graphic: S&P 500 performance before and after rate hikes.

This positive take is in the face of what has been markedly divergent breadth and extreme relative weakness, especially in rate-sensitive names. 

Why? Rising rates, among other factors, have the potential to decrease the present value of future earnings, thereby making stocks, especially those that are high growth, less attractive. 

Graphic: As U.S. stocks’ inflation-adjusted earnings yield turns negative, as seen near the peak of the tech bubble, via Bloomberg, “Investors in the Nasdaq increasingly seem to think that only a few companies have much of a chance. With a growing possibility of more aggressive attempts to prosecute antitrust issues, that’s a riskier position than it appears.”

With the equity market moving higher, here, into the end of the week, we ought to not discount participants’ increasing exposure to leveraged products.

This increases the speed with which volatility is realized and was cited as a risk in one of Moody’s recent commentaries.

So, despite having seasonally-aligned “passive buying support” and supportive positioning metrics, as well as expectations of “the strongest quarterly nominal [economic] growth in more than three decades,” offsides positioning ought to exacerbate underlying price movements.

So what? As stated, yesterday, the market is in a positive-gamma environment wherein the counterparties to customer options trades add market liquidity and temper realized volatility.

With participants’ fears surrounding monetary policy assuaged, there are positive flows that ought to support the market into this week’s weighty “quad-witching” derivatives expiry.

Graphic: VIX term shifts inward; as short-dated protection quickly was monetized or expired, volatility collapsed and dealers’ exposure to positive delta declined which meant they would cover their short futures hedges. This “vanna” flow bolstered an SPX rally into the end-of-day.

Into the end of the week, the expectation is that participants continue to step in and commit increased capital on lower directional volatility (as they had into this week).

With activity concentrated in shorter-dated tenors, counterparties will take on more exposure to positive gamma which they will offset by supplying the market with more liquidity, thereby pressuring the price discovery process.

Graphic: Via SpotGamma data, the above model’s tilt suggests dealers will increasingly sell into strength and buy into weakness, pressuring any price discovery into the end of this week.

Moreover, the decrease in dealer supply (short delta) post-OPEX, via the covering of short stock/futures hedges to put-heavy positioning, ought to bolster any attempt higher.

Below: Though book depth “in isolation is not the correct method to gauge liquidity,” it can help in assessing participants’ demand/supply as volatility (and stress, by that token) increases.

Graphic: Analysis of book depth for the E-mini S&P 500 futures contract, via CME Group Inc’s (NASDAQ: CME) Liquidity Tool. For more on the implications of participants’ options positioning and dealer hedging, read here.

In anticipation of higher prices, low cost, complex options structures like call-side calendars, butterflies, and ratio spreads are top of mind.

Graphic: Via Banco Santander SA (NYSE: SAN) research, the return profile, at expiry, of a classic 1×2 (long 1, short 2 further away) ratio spread.

Expectations: As of 6:15 AM ET, Thursday’s regular session (9:30 AM – 4:00 PM ET), in the S&P 500, will likely open in the upper part of a positively skewed overnight inventory, outside of prior-range and -value, suggesting a potential for immediate directional opportunity.

Balance-Break + Gap Scenarios: A change in the market (i.e., the transition from two-time frame trade, or balance, to one-time frame trade, or trend) is occurring.

Monitor for acceptance (i.e., more than 1-hour of trade) outside of the balance area. 

Leaving value behind on a gap-fill or failing to fill a gap (i.e., remaining outside of the prior session’s range) is a go-with indicator. 

Rejection (i.e., return inside of balance) portends a move to the opposite end of the balance.

In the best case, the S&P 500 trades sideways or higher; activity above the $4,712.00 balance area boundary (BAH) puts in play the $4,732.50 high volume area (HVNode). Initiative trade beyond the HVNode could reach as high as the $4,740.50 minimal excess high and $4,767.00 extension, or higher.

In the worst case, the S&P 500 trades lower; activity below the $4,712.00 BAH puts in play the $4,690.25 micro composite point of control (MCPOC). Initiative trade beyond the MCPOC could reach as low as the $4,674.25 HVNode and $4,657.00 balance low (BAL), or lower.

Click here to load today’s key levels into the web-based TradingView charting platform. Note that all levels are derived using the 65-minute timeframe. New links are produced, daily.
Graphic: 65-minute profile chart of the Micro E-mini S&P 500 Futures. Learn about the profile.
Graphic: V-pattern recovery in SPDR S&P 500 ETF Trust (NYSE: SPY), one of the largest ETFs that track the S&P 500 index, portends continuation. The red, black, and yellow-colored lines are anchored volume-weighted average price levels (VWAPs), metric highly regarded by chief investment officers, among other participants, for quality of trade. Additionally, liquidity algorithms are benchmarked and programmed to buy and sell around VWAPs.

Definitions

V-Pattern: A pattern that forms after a market establishes a high, retests some support, and then breaks above said high. In most cases, this pattern portends continuation.

Volume Areas: A structurally sound market will build on areas of high volume (HVNodes). Should the market trend for long periods of time, it will lack sound structure, identified as low volume areas (LVNodes). LVNodes denote directional conviction and ought to offer support on any test. 

If participants were to auction and find acceptance into areas of prior low volume (LVNodes), then future discovery ought to be volatile and quick as participants look to HVNodes for favorable entry or exit.

Gamma: Gamma is the sensitivity of an option to changes in the underlying price. Dealers that take the other side of options trades hedge their exposure to risk by buying and selling the underlying. When dealers are short-gamma, they hedge by buying into strength and selling into weakness. When dealers are long-gamma, they hedge by selling into strength and buying into weakness. The former exacerbates volatility. The latter calms volatility.

Vanna: The rate at which the delta of an option changes with respect to volatility.

Charm: The rate at which the delta of an option changes with respect to time.

MCPOCs: POCs are valuable as they denote areas where two-sided trade was most prevalent over numerous day sessions. Participants will respond to future tests of value as they offer favorable entry and exit.

Price Discovery (One-Timeframe Or Trend): Elongation and range expansion denotes a market seeking new prices to establish value, or acceptance (i.e., more than 30-minutes of trade at a particular price level). 

Excess: A proper end to price discovery; the market travels too far while advertising prices. Responsive, other-timeframe (OTF) participants aggressively enter the market, leaving tails or gaps which denote unfair prices.

About

After years of self-education, strategy development, and trial-and-error, Renato Leonard Capelj began trading full-time and founded Physik Invest to detail his methods, research, and performance in the markets.

Additionally, Capelj is a Benzinga finance and technology reporter interviewing the likes of Shark Tank’s Kevin O’Leary, JC2 Ventures’ John Chambers, and ARK Invest’s Catherine Wood, as well as a SpotGamma contributor, helping develop insights around impactful options market dynamics.

Disclaimer

At this time, Physik Invest does not carry the right to provide advice. In no way should the materials herein be construed as advice. Derivatives carry a substantial risk of loss. All content is for informational purposes only.

Categories
Commentary

Daily Brief For December 1, 2021

What Happened

Overnight, equity index futures traded sideways to higher, led by the once-weak Russell 2000. 

The shift in relative strength is one obvious change in tone in the face of hawkish news from the Federal Reserve (Fed) and COVID-19 uncertainty. 

Ahead is data on ADP employment (8:15 AM ET), Markit manufacturing PMI (9:45 AM ET), ISM manufacturing index, construction spending, as well as testimony by Federal Reserve’s Jerome Powell and Treasury Secretary Janet Yellen (10:00 AM ET). 

Later is a release of the Beige Book (2:00 PM ET).

Graphic updated 6:30 AM ET. Sentiment Neutral if expected /ES open is inside of the prior day’s range. /ES levels are derived from the profile graphic at the bottom of the following section. Levels may have changed since initially quoted; click here for the latest levels. SqueezeMetrics Dark Pool Index (DIX) and Gamma (GEX) calculations are based on where the prior day’s reading falls with respect to the MAX and MIN of all occurrences available. A higher DIX is bullish. At the same time, the lower the GEX, the more (expected) volatility. Learn the implications of volatility, direction, and moneyness. SHIFT data used for S&P 500 (INDEX: SPX) options activity. Note that options flow is sorted by the call premium spent; if more positive then more was spent on call options. Breadth reflects a reading of the prior day’s NYSE Advance/Decline indicator. VIX reflects a current reading of the CBOE Volatility Index (INDEX: VIX) from 0-100.

What To Expect

On lackluster breadth and supportive market liquidity metrics, the worst-case outcome occurred, evidenced by an expansion of the S&P 500’s range, as well as increased participation at lower prices, as evidenced by lower value (i.e., the prices at which 70% of the day’s volume occurred).

Though yesterday marked a willingness to continue the trend lower, there are some caveats.

The first of which comes back to simple market profile principles. Value ended on the day overlapping lower. This suggests balance and an unchanged perception of value from Friday. 

This dynamic ties into what was discussed yesterday. Given a push-pull environment between the big indices (i.e., strength in Nasdaq 100 versus weakness in Russell 2000), in the face of lackluster breadth and market liquidity metrics, there were increased odds of sideways trade; “participants were likely to base for a directional move in anticipation of new information.”

Second, according to SpotGamma, “in the face of a massive -$8bn market-on-close order, dealers likely were covering their hedges to customers’ short-delta options exposure.”

The implications of the latter are staggering. Let’s unpack, below.

Graphic: SpotGamma’s Hedging Impact of Real-Time Options (HIRO) indicator shows positive options delta trades firing off, which likely had dealers buying stock/futures into the close.

Context: The Fed’s Powell changed his tone around inflation, yesterday, becoming more open to a faster taper in bond-buying and rate hikes. 

As Bloomberg’s John Authers put it: “This looks like inconsistency, and it also looks to some as if Powell has lost his nerve — just as he did three years ago, when the stock market’s horrified reaction to his statement that the Fed’s balance sheet would be reduced ‘on autopilot,’ meaning ever tighter money, prompted a U-turn. In market lore, the ‘Christmas Eve Massacre’ of a cathartic stock sell-off was followed by the ‘Powell Pivot.’”

Graphic: S&P 500 performance in tightening cycles via Ned Davis Research. 

Stocks have recovered markedly, since the news. 

At the outset, as we typically see with news, selling appeared knee-jerk; a b-shaped profile distribution suggested long liquidation (i.e., [1] participants who bought the dip, Friday, were unable to gather the financial and/or emotional wherewithal to defend a retest of local lows and [2] capitulation on the part of larger other time frame participants, potentially).

In regards to the latter, if funds were to sell the market, they would do so methodically, into strength, throughout a session.

Couple the aforementioned with a decline in volatility (despite S&P 500 prices reaching lower lows), it’s clear as to why I started off the commentary suggesting an “obvious change in tone.”

Last week, we saw the market enter into a destabilizing environment characterized by counterparties to options trades selling into weakness and buying into strength. 

Note: Options are so important. Volatility is a growing asset class. Its implications can’t be discounted (e.g., index pinned in the face of single-stock volatility and declining correlations).

After a brief exit from that environment, on Tuesday the market made another attempt lower. With options activity most concentrated in shorter-dated tenors where the sensitivity of options to direction is higher, then the expectation was that we would realize more volatility. 

That happened.

However, volatility, despite spiking, failed to breach Friday levels; in such a case, the short-dated, out-of-the-money protection participants were initially demanding bled.

Given decreased exposure to risk, at least for those participants (e.g., dealers) warehousing this risk, associated hedging flows (i.e., the buy-back of short stock/futures hedges) came onto the market. 

This is clearly visualized by SpotGamma’s HIRO indicator, above. 

In conclusion, should participants continue to markdown volatility, as well as commit more capital to the call side, fears will have been assuaged.

In such a case, the odds of a seasonally-aligned rally, into Christmas, are supported.

Expectations: As of 6:30 AM ET, Wednesday’s regular session (9:30 AM – 4:00 PM ET), in the S&P 500, will likely open in the upper part of a positively skewed overnight inventory, inside of prior-range and -value, suggesting a limited potential for immediate directional opportunity.

Developing Balance Scenario: Rotational trade that denotes current prices offer favorable entry and exit. Balance-areas make it easy to spot a change in the market (i.e., the transition from two-time frame trade, or balance, to one-time frame trade, or trend). 

Modus operandi is responsive trade (i.e., fade the edges), rather than initiative trade (i.e., play the break).

In the best case, the S&P 500 trades sideways or higher; activity above the $4,618.75 high volume area (HVNode) puts in play the $4,647.25 HVNode. Initiative trade beyond the latter HVNode could reach as high as the $4,674.25 micro composite point of control (MCPOC) and $4,691.25 HVNode, or higher.

In the worst case, the S&P 500 trades lower; activity below the $4,618.75 HVNode puts in play the $4,590.00 balance boundary (BAH). Initiative trade beyond the BAH could reach as low as the $4,574.25 HVNode and $4,551.75 LVNode, or lower.

Click here to load today’s updated key levels into the web-based TradingView charting platform. Note that all levels are derived using the 65-minute timeframe. New links are produced, daily.
Graphic: 65-minute profile chart of the Micro E-mini S&P 500 Futures. Learn about the profile.

Charts To Watch

Graphic: (NYSE: SPY). (S~$454, R~$463). S is for support. R is for resistance.

What People Are Saying

Volume Areas: A structurally sound market will build on areas of high volume (HVNodes). Should the market trend for long periods of time, it will lack sound structure, identified as low volume areas (LVNodes). LVNodes denote directional conviction and ought to offer support on any test. 

If participants were to auction and find acceptance into areas of prior low volume (LVNodes), then future discovery ought to be volatile and quick as participants look to HVNodes for favorable entry or exit.

MCPOCs: POCs are valuable as they denote areas where two-sided trade was most prevalent over numerous day sessions. Participants will respond to future tests of value as they offer favorable entry and exit.

Definitions

About

After years of self-education, strategy development, and trial-and-error, Renato Leonard Capelj began trading full-time and founded Physik Invest to detail his methods, research, and performance in the markets.

Additionally, Capelj is a Benzinga finance and technology reporter interviewing the likes of Shark Tank’s Kevin O’Leary, JC2 Ventures’ John Chambers, and ARK Invest’s Catherine Wood, as well as a SpotGamma contributor, developing insights around impactful options market dynamics.

Disclaimer

At this time, Physik Invest does not manage outside capital and is not licensed. In no way should the materials herein be construed as advice. Derivatives carry a substantial risk of loss. All content is for informational purposes only.

Categories
Commentary

Weekly Brief For July 3, 2021

Market Commentary

Key Takeaways: U.S. equity index futures diverge in their attempt to discover fair prices for two-sided trade.

  • Economy is set for sustained boom.
  • Ahead is a light economic calendar.
  • SPX, NDX, DJI higher. RUT coiling.

Summary: Last week, U.S. stock index futures auctioned sideways to higher into Friday’s employment report. The release showed an addition of 850,000 jobs in June, the strongest employment gain since last summer. 

The S&P 500 and Nasdaq 100 led the week-long rally, while the Dow Jones Industrial Average followed closely behind. Though the Russell 2000 did end lower, it has been building energy for a break.

Considerations: It was the beginning of April JPMorgan Chase & Co’s (NYSE: JPM) Jamie Dimon wrote strong consumer savings, an increased pace in COVID-19 coronavirus vaccinations, and unprecedented efforts to spur economic activity could mean that a boom lasts as long as 2023.

Dimon’s comments remain valid. Months after, officials are hard at work in helping the U.S. reach herd immunity with vaccines that produce antibodies for the most well-known variants of COVID-19. Additionally, the economy is making progress toward meeting the Federal Reserve’s objectives for employment and inflation; just a couple of weeks ago the institution brought forward the time frame on when it will raise interest rates. 

In a statement, BlackRock strategists noted: “We believe the Fed’s new outlook will not translate into significantly higher policy rates any time soon. This, combined with the powerful restart, underpins our pro-risk stance.”

Alongside that news, the equity market sold violently, into Quadruple Witching, or the large expiry of futures and options. Thereafter, indexes staged a massive reversal, and the CBOE Volatility Index (INDEX: VIX), a measure of the stock market’s expectation of volatility, traded to its lowest level since February 2020.

According to SpotGamma models, up to 50% of the gamma in and across the S&P 500 complex was taken off the table that expiry.

This, as SpotGamma has said in the past, “creates volatility because, as large options positions expire[], are closed and/or rolled, dealers have large hedges they need to adjust.”

Put more simply, the initial action, into the expiry, may have been attributable to the sale of long stock that hedged expiring short exposure above the market (i.e., call side).

After that exposure was cleared, the prospects for a rally improved, boosted by the buying back of short put hedges as volatility imploded.

Last week, though, things became a tad frothy with the number of put options sold-to-open seeing heightened levels.

Graphic: SpotGamma’s analysis suggests equity put options were sold-to-open (red arrow). 

Put sales, which can be part of sophisticated volatility-based trading strategies, often suggest increased confidence as market participants look to options for income, and not insurance.

Historically, the returns after such developments are mixed; more often the appearance of strong initiative buying surfaces (e.g., August and January 2020) before a liquidation helps correct excess inventory, and bring sense back into the market. 

Kris Sidial – co-chief investment officer at The Ambrus Group, a volatility arbitrage fund – and I recently held a conversation regarding meme stock volatility, market structure, and regulation. He noted that ongoing risk-on dynamics can be traced back to factors like Federal Reserve stabilization efforts, and low rates, which incentivize risk-taking.

“The growth of structured products, passive investing, the regulatory standpoint that’s been implemented with Dodd-Frank and dealers needing to hedge off their risk more frequently, than not,” are all part of a regime change that’s affected the stability of markets, Sidial notes. “These dislocations happen quite frequently in small windows, and it offers the potential for large outlier events,” like the equity bust and boom during 2020. “Strength and fragility are two completely different components. The market could be strong, but fragile.”

That dynamic is playing out as Cem Karsan, founder at Kai Volatility, notes volatility is dramatically oversupplied. As a result, as implied volatility drops, options gamma – an option delta’s sensitivity to market price changes – rises. Associated hedging forces make it so there’s more liquidity and less movement. In other words, the market tends to pin.

Still, in line with Sidial’s comments, Karsan believes expected distributions are fat-tailed, given “fragility.” In other words, it’s hard for the market to unpin. Should it unpin, however, there’s “not enough liquidity” to absorb leverage on the tails.

Given this, Karsan finds it interesting to sell at-the-money option structures to fund out-of-the-money structures. Alternatively, knowing what forces – e.g., charm or the rate at which the delta of an option changes with respect to time – decay poses on so-called “dealer positioning,” going into the July option expirations (OPEX), one could look into long calendar put spreads on the S&P 500.

In such a case, traders are short puts in July and long puts on forward. This way, you’re collecting decay as a result of realized pinning. Here’s Karsan’s full take, from the source.

Graphic: The risk profile of a long put calendar spread, via Fidelity.

After mid-July, though, the window for fundamental dynamics (e.g., a shift in preferences from saving and investing to spending, monetary tightening, seasonality, or a COVID-19 resurgence) to take over is opened. 

In a note on COVID resurgence, to not venture too far off into the abyss, I cite strategists led by JPMorgan Chase & Co’s (NYSE: JPM) Marko Kolanovic who last year correctly suggested equities would continue rallying on the basis of low rates, improved fundamentals, buybacks, as well as systematic and hedge fund strategies. 

“The delta variant should not have significant repercussions for the pandemic situation in developed markets (e.g. Europe and North America, which have [made] strong progress in vaccinations) due to the level of population immunity.”

What To Expect: In the coming sessions, participants will want to focus their attention on where the S&P 500 trades in relation to Friday’s $4,323.00 untested Point of Control (POC).

POCs: POCs are valuable as they denote areas where two-sided trade was most prevalent. Participants will respond to future tests of value as they offer favorable entry and exit.

That said, participants can trade from the following frameworks.

In the best case, the index trades sideways or higher; activity above the $4,323.00 POC puts in play the $4,347.00 excess high. Initiative trade beyond the excess high could reach as high as the $4,357.50 Fibonacci-derived price target.

Excess: A proper end to price discovery; the market travels too far while advertising prices. Responsive, other-timeframe (OTF) participants aggressively enter the market, leaving tails or gaps which denote unfair prices.

In the worst case, the index trades lower; activity below the $4,323.00 POC puts in play the untested POC at $4,299.00, as well as the POC and micro-composite HVNode at $4,285.00. Thereafter, if lower, participants may look for responses at the $4,263.25 LVNode, $4,247.75 LVNode, as well as the $4239.25 HVNode and $4,229.00 POC.

Volume Areas: A structurally sound market will build on past areas of high volume. Should the market trend for long periods of time, it will lack sound structure (identified as a low volume area which denotes directional conviction and ought to offer support on any test). 

If participants were to auction and find acceptance into areas of prior low volume, then future discovery ought to be volatile and quick as participants look to areas of high volume for favorable entry or exit.

For a full list of important levels, see the 65-minute profile and candlestick chart, below.

Graphic: 65-minute profile chart of the Micro E-mini S&P 500 Futures.
Graphic: Weekly candlestick charts of the S&P 500 (top left), Nasdaq 100 (top right), Russell 2000 (bottom left), and Dow Jones Industrial Average (bottom right).
Graphic: SHIFT search suggests participants were committing the most capital to call strikes at and below current prices in the cash-settled S&P 500 Index (INDEX: SPX) and Nasdaq 100 (INDEX: NDX), last week. This activity denotes (1) stock replacement, (2) hedges for underlying short positions, or (3) speculation on the upside. Also, there was a meaningful bid in September puts on the S&P 500 and Nasdaq 100. This dynamic suggests participants, despite their commitment to higher prices, are hedging against near-term risks, like the Jackson Hole Economic Symposium.

News And Analysis

Markets | The premium Elon Musk adds to Tesla, other ventures. (Kyla)

Markets | Forward-looking indicators point to improving credit trends. (S&P)

Travel | TSA screenings surpassed 2019 levels in a pandemic first. (CNBC)

Energy | WH is worried about high oil prices, sees enough supply. (REU)

Energy | An overview of data from IEA’s Energy prices database. (IEA)

Energy | OPEC ends Friday’s meeting without a deal for agreement. (CNBC)

Agriculture | Dry weather damage spells trouble for U.S. spring crops. (S&P)

Economy | States ending jobless benefits early hit labor milestones. (REU)

Markets | Spotlight turning to mergers, acquisition for fintech SPACs. (S&P)

Economy | Jobs gain largest in 10 months; employers up wages. (REU)

Energy | Cal-ISO, utilities ask consumers to conserve amid heatwave. (S&P)

Economy | Economic growth hiccup to derail credit spread stability. (BBG)

Markets | Record S&P 500 masks fear trade gripping stock market. (BBG)

Innovation And Emerging Trends

FinTech | BTC mining now easier, more profitable after crackdowns. (CNBC)

FinTech | ‘Flight to quality’ as private insurtechs draw big investments. (S&P)

FinTech | Bank customers cement relationships with digital channels. (S&P)

Markets | Money-losing companies sell record stock, flashing signal. (CNBC)

Markets | Wall Street rebels warning of ‘disastrous’ $11T index boom. (BBG)

Mobility | When do electric vehicles become cleaner than gas cars? (REU)

About

Renato founded Physik Invest after going through years of self-education, strategy development, and trial-and-error. His work reporting in the finance and technology space, interviewing leaders such as John Chambers, founder, and CEO, JC2 Ventures, Kevin O’Leary, businessman and Shark Tank host, Catherine Wood, CEO and CIO, ARK Invest, among others, afforded him the perspective and know-how very few come by.

Having worked in engineering and majored in economics, Renato is very detailed and analytical. His approach to the markets isn’t built on hope or guessing. Instead, he leverages the unique dynamics of time and volatility to efficiently act on opportunity.

Disclaimer

At this time, Physik Invest does not manage outside capital and is not licensed. In no way should the materials herein be construed as advice. Derivatives carry a substantial risk of loss. All content is for informational purposes only.

Categories
Commentary

Weekly Brief For May 2, 2021

Happy Sunday! Markets were choppy, ending the week flat-to-down. This came after President Joe Biden’s joint session of Congress, Fed Chair Jerome Powell’s assessment of the economy, and blowout earnings by heavily weighted index constituents.

The following commentary on U.S. broad market equity indices will discuss what happened, why it matters, what to expect, and how participants can position themselves for the coming week.

Market Commentary

What Happened: U.S. broad market indices closed the week out flat-to-down after a failed attempt to break higher on Thursday, April 29. Last week’s action suggests participants are looking for information to initiate a directional move.

  • Policy leaders, creators: Inflation pockets transitory.
  • Ahead: Data on labor, manufacturing, and earnings.
  • Markets balancing, positions for directional resolve.
Updated: 10:00 AM EST Sunday.

Why It Matters: The sideways action during last week’s trade came after a lengthy run, higher. 

The S&P 500, in particular, from its March 2020 low, is up over 90%.

That said, as investors enter into a new month, popular news outlets are beating the drum of an old adage: “Sell in May and go away.”

Is there any truth to this statement? It depends on perspective.

Historically speaking, the period spanning May to October is generally weak. On average, the S&P 500 is up as high as +2% during this six-month period.

“Stocks are up more than 87% from the March lows, suggesting a well-deserved pullback during these troublesome months is quite possible,” LPL Financial Chief Market Strategist Ryan Detrick said in a recent blog post. “But with an accommodative Fed, fiscal and monetary policy, along with an economy that is opening faster than nearly anyone expected, we’d use any weakness as an opportunity to add to positions.”

Adding, trends are changing, though; stocks have been higher during these so-called weak months 8 out of the past 10 years, according to LPL Research. 

Graphic by LPL Research. Data from FactSet. 

So, with that, in maintaining objectivity, we zoom out and ask a few questions.

  1. Where are we in relation to the prior week’s range? Overlapping.
  2. Is the market’s attempt to go in a certain direction supported? No. After a failed balance-area breakout, participants rotated and accepted prices back in the prior range, as evidenced by unchanged value-area placement, the area where 70% of prior trade (i.e., 1 standard deviation) is conducted.
  3. Is the technical and fundamental narrative supportive of current prices? Technically, the market is in an extended uptrend. However, despite value-area placement suggesting a validation of higher prices, market liquidity metrics point to distribution, the opposite of accumulation.

Now, we analyze other factors in play.

  • Real Yields: Alongside April’s FOMC — at which the Federal Reserve left rates unchanged and asset purchases steady — 10-year real yields are on track for their biggest drop since last summer. Low real rates may catalyze risk assets as the present value of their future earnings become more attractive
  • Capital Gains Tax (CGT): The White House expressed its desire to raise the federal CGT rate to 43.4% for wealthy individuals. However, as Goldman Sachs Group (NYSE: GS) sees it, Congress is likely to settle on a more modest increase. Adding, weak S&P 500 returns, historically, going into CGT hikes are short-lived.
  • Low Rates, Debt Expansion: Such dynamics incent market participants to take risks, causing destabilizing factors to brew. As Ambrus Group’s Kris Sidial says, “The growth of structured products, passive investing, the regulatory standpoint that’s been implemented with Dodd-Frank and dealers needing to hedge off their risk more frequently than not” are all part of a regime change that’s affected the stability of markets.
  • Positioning: According to Nomura data presented by The Market Ear, CTAs have taken their positions too far on the long side, reaching levels last seen prior to the 2018 Volmageddon. Additionally, the (1) SPDR S&P 500 ETF Trust (NYSE: SPY) and the (2) Invesco QQQ Trust Series 1 (NASDAQ: QQQ) funds saw some of their biggest outflows. At the same time, certain breadth metrics are diverging from current prices while the SPDR S&P 500 ETF, cash-settled S&P 500 Index, and Invesco QQQ saw sizable call-side bets trade, Friday. 
  • Earnings Reaction: Last week, heavily weighted index constituents reported blowout earnings. The reaction was muted, leaving broad market indices flat-to-down. One explanation is that the expectations, going into the events, were too high. Another is that the equity market is priced to perfection, at this stage of the recovery, and further advances will be supported by the rotation into cyclical parts of the market — financials, energy, and value. 
  • Option Expiration (OPEX): Option expiries mark an end to pinning (i.e, the theory that market makers and institutions short options move stocks to the point where the greatest dollar value of contracts will expire worthless) and the reduction dealer gamma exposure. According to SpotGamma, a provider of actionable options insights, on Friday, up to 30% of the S&P 500 and Nasdaq 100’s gamma rolled off which may allow the indices an opportunity to directionally resolve.

So, in summarizing this section, technically, the market is bullish, supported by the prospects of a healthy rotation. In the coming week, given increased clarity on policy and a sizable derivatives expiry, participants may see directional resolve.

What To Expect: An increased potential to resolve directionally.

In addition, metrics, like price movement, market liquidity, and speculative derivatives activity, confirm participants’ bullishness and opportunistic hedging in light of an acceleration in the global restart and a turn in flows, the result of an apparent shift in consumer preferences, from saving and investing to spending.

Graphic: Physik Invest maps out the purchase of call and put options in the SPDR S&P 500 ETF Trust (NYSE: SPY), for the week ending April 30. Activity in the options market was primarily concentrated in short-dated tenors, in strikes as low as $400.000, which corresponds with $4,000.00 in the cash-settled S&P 500 Index (INDEX: SPX).

What To Do: In the coming sessions, participants will want to pay attention to where the S&P 500 trades in relation to its $4,186.75-$4,110.50 balance area. 

Balance (Two-Timeframe Or Bracket): Rotational trade that denotes current prices offer favorable entry and exit. Balance-areas make it easy to spot change in the market (i.e., the transition from two-time frame trade, or balance, to one-time frame trade, or trend).

Any activity above (below) the balance-area high suggests participants are interested in discovering higher (lower) prices. Any activity within the balance area suggests participants are looking for more information to base their next move; in such case, responsive buying and selling is the course of action. 

Responsive Buying (Selling): Buying (selling) in response to prices below (above) area of recent price acceptance.

Initiative trade below the balance-area low suggests an inclination by participants to revert to the mean and repair some of the poor structure left behind prior discovery. Initiative trade above the balance area puts in play the $4,210.75 minimal excess rally-high, and the cluster of price extensions at and above $4,200.00, typical price targets based on Fibonacci principles.

Initiative Buying (Selling): Buying (selling) within or above (below) previous price acceptance.

Excess: A proper end to price discovery; the market travels too far while advertising prices. Responsive, other-timeframe (OTF) participants aggressively enter the market, leaving tails or gaps which denote unfair prices.

So, in the best case, the S&P 500 makes an attempt to balance or discover prices as high as $4,300.00. In the worst case, participants look to auction the S&P 500 into prior poor structures and low-volume areas (LVNodes) that ought to offer little-to-no support.

More On Volume Areas: A structurally sound market will build on past areas of high-volume (HVNode). Should the market trend for long periods of time, it will lack sound structure (identified as a low-volume area (LVNode) which denotes directional conviction and ought to offer support on any test). 

If participants were to auction and find acceptance into areas of prior low-volume, then future discovery ought to be volatile and quick as participants look to areas of high volume for favorable entry or exit.
Graphic: 65-minute profile chart of the Micro E-mini S&P 500 Futures.

News And Analysis

Markets | U.S. builders produced record share of homes with hot market. (BBG)

Economy | Consumer spending, labor cost data suggests inflation warming up. (REU

Trade | Baltic Dry Index breaks 3,000 points in more than a decade on prices. (TW)

Wealth | Rich Americans fleeing tax hikes may turbocharge the shift to ETFs. (BBG)

Markets | Fed’s Robert Kaplan warns on ‘imbalances,’ wants to talk taper. (REU)

Markets | A volatility quant nets $540 million as momentum trades boom. (BBG)

Lending | States are investigating predatory subprime auto lenders. (Jalopnik)

Markets | Record metals prices catapulted mining profits beyond big oil. (BBG)

Medicine | Biden’s ARPA-H agency to ‘end cancer’ modeled after Darpa. (TC)

Markets | Bond market’s inflation bulls get Powell’s go-ahead to double down. (BBG)

Markets | Bridgewater Co-CIO sees ‘fair amount’ of stock market in bubble. (BBG)

Markets | Retail investors could counter the much-anticipated correction. (SA)

Economy | Warren Buffett denounces SPACs and Robinhood at meeting. (Axios)

Markets | Crypto’s shadow currency surges past deposits of most U.S. banks. (BBG)

Technology | Roku says it may lose YouTube app after Google’s demands. (Axios)

Economy | Ex-Treasury Secretary Summers on scarcity of workers, inflation. (BBG)

Markets | Parametric fund earns ‘Gamma Hammer’ moniker with its bets. (FT)

What People Are Saying

Innovation And Emerging Trends

FinTech | Apex Fintech has blow-out earnings ahead of NYSE listing. (BZ)

FinTech | How to attract large investors to your direct investing platform? (TC)

FinTech | New fintech groups form as industry scrutiny is ramping up. (S&P)

FinTech | Cryptocurrency bank wins OCC approval to form de novo. (S&P)

Markets | CME eyes wider customer base with micro bitcoin futures. (TB)

FinTech | Coinbase plans to acquire data and analytics platform Skew. (TB)

FinTech | How U.K.-based Lendable is powering fintechs across EMs. (TC)

FinTech | Amid the IPO gold rush, how should we value fintech startups? (TC)

FinTech | 10 fintech headhunters you need to know for recruiting to talent. (BI)

FinTech | U.K. banks speed up plans to ax branches, switch to digital focus. (S&P)

Medicine | Kevin O’Leary-backed MindMed has uplisted on the Nasdaq. (BZ)

Media | Creators are making lots of money selling Google spreadsheets. (Mashable)

Media | As newsletter advertising grows, advertisers opting for quality. (ADWK)

About

Renato founded Physik Invest after going through years of self-education, strategy development, and trial-and-error. His work reporting in the finance and technology space, interviewing leaders such as John Chambers, founder, and CEO, JC2 Ventures, Kevin O’Leary, Canadian businessman and Shark Tank host, Catherine Wood, CEO and CIO, ARK Invest, among others, afforded him the perspective and know-how very few come by.

Having worked in engineering and majored in economics, Renato is very detailed and analytical. His approach to the markets isn’t built on hope or guessing. Instead, he leverages the unique dynamics of time and volatility to efficiently act on opportunity.

Disclaimer

At this time, Physik Invest does not manage outside capital and is not licensed. In no way should the materials herein be construed as advice. Derivatives carry a substantial risk of loss. All content is for informational purposes only.