
Happy Sunday! Markets were choppy, ending the week flat-to-down. This came after President Joe Biden’s joint session of Congress, Fed Chair Jerome Powell’s assessment of the economy, and blowout earnings by heavily weighted index constituents.
The following commentary on U.S. broad market equity indices will discuss what happened, why it matters, what to expect, and how participants can position themselves for the coming week.
Market Commentary
What Happened: U.S. broad market indices closed the week out flat-to-down after a failed attempt to break higher on Thursday, April 29. Last week’s action suggests participants are looking for information to initiate a directional move.
- Policy leaders, creators: Inflation pockets transitory.
- Ahead: Data on labor, manufacturing, and earnings.
- Markets balancing, positions for directional resolve.
Why It Matters: The sideways action during last week’s trade came after a lengthy run, higher.
The S&P 500, in particular, from its March 2020 low, is up over 90%.
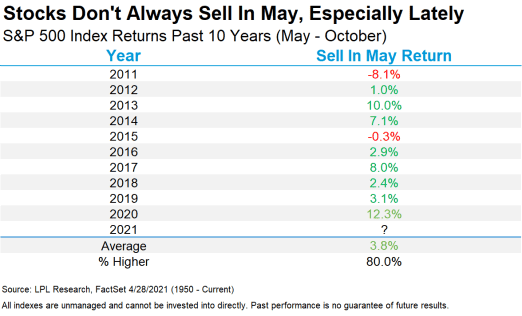
That said, as investors enter into a new month, popular news outlets are beating the drum of an old adage: “Sell in May and go away.”
Is there any truth to this statement? It depends on perspective.
Historically speaking, the period spanning May to October is generally weak. On average, the S&P 500 is up as high as +2% during this six-month period.
“Stocks are up more than 87% from the March lows, suggesting a well-deserved pullback during these troublesome months is quite possible,” LPL Financial Chief Market Strategist Ryan Detrick said in a recent blog post. “But with an accommodative Fed, fiscal and monetary policy, along with an economy that is opening faster than nearly anyone expected, we’d use any weakness as an opportunity to add to positions.”
Adding, trends are changing, though; stocks have been higher during these so-called weak months 8 out of the past 10 years, according to LPL Research.
So, with that, in maintaining objectivity, we zoom out and ask a few questions.
- Where are we in relation to the prior week’s range? Overlapping.
- Is the market’s attempt to go in a certain direction supported? No. After a failed balance-area breakout, participants rotated and accepted prices back in the prior range, as evidenced by unchanged value-area placement, the area where 70% of prior trade (i.e., 1 standard deviation) is conducted.
- Is the technical and fundamental narrative supportive of current prices? Technically, the market is in an extended uptrend. However, despite value-area placement suggesting a validation of higher prices, market liquidity metrics point to distribution, the opposite of accumulation.
Now, we analyze other factors in play.
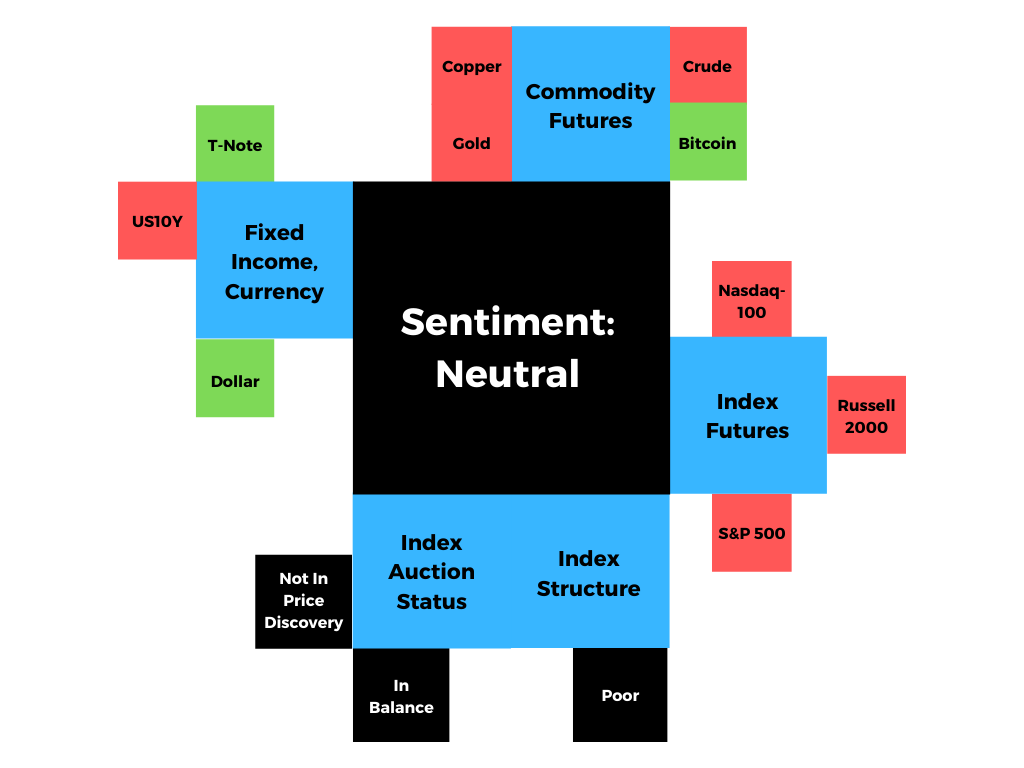
- Real Yields: Alongside April’s FOMC — at which the Federal Reserve left rates unchanged and asset purchases steady — 10-year real yields are on track for their biggest drop since last summer. Low real rates may catalyze risk assets as the present value of their future earnings become more attractive.
- Capital Gains Tax (CGT): The White House expressed its desire to raise the federal CGT rate to 43.4% for wealthy individuals. However, as Goldman Sachs Group (NYSE: GS) sees it, Congress is likely to settle on a more modest increase. Adding, weak S&P 500 returns, historically, going into CGT hikes are short-lived.
- Low Rates, Debt Expansion: Such dynamics incent market participants to take risks, causing destabilizing factors to brew. As Ambrus Group’s Kris Sidial says, “The growth of structured products, passive investing, the regulatory standpoint that’s been implemented with Dodd-Frank and dealers needing to hedge off their risk more frequently than not” are all part of a regime change that’s affected the stability of markets.
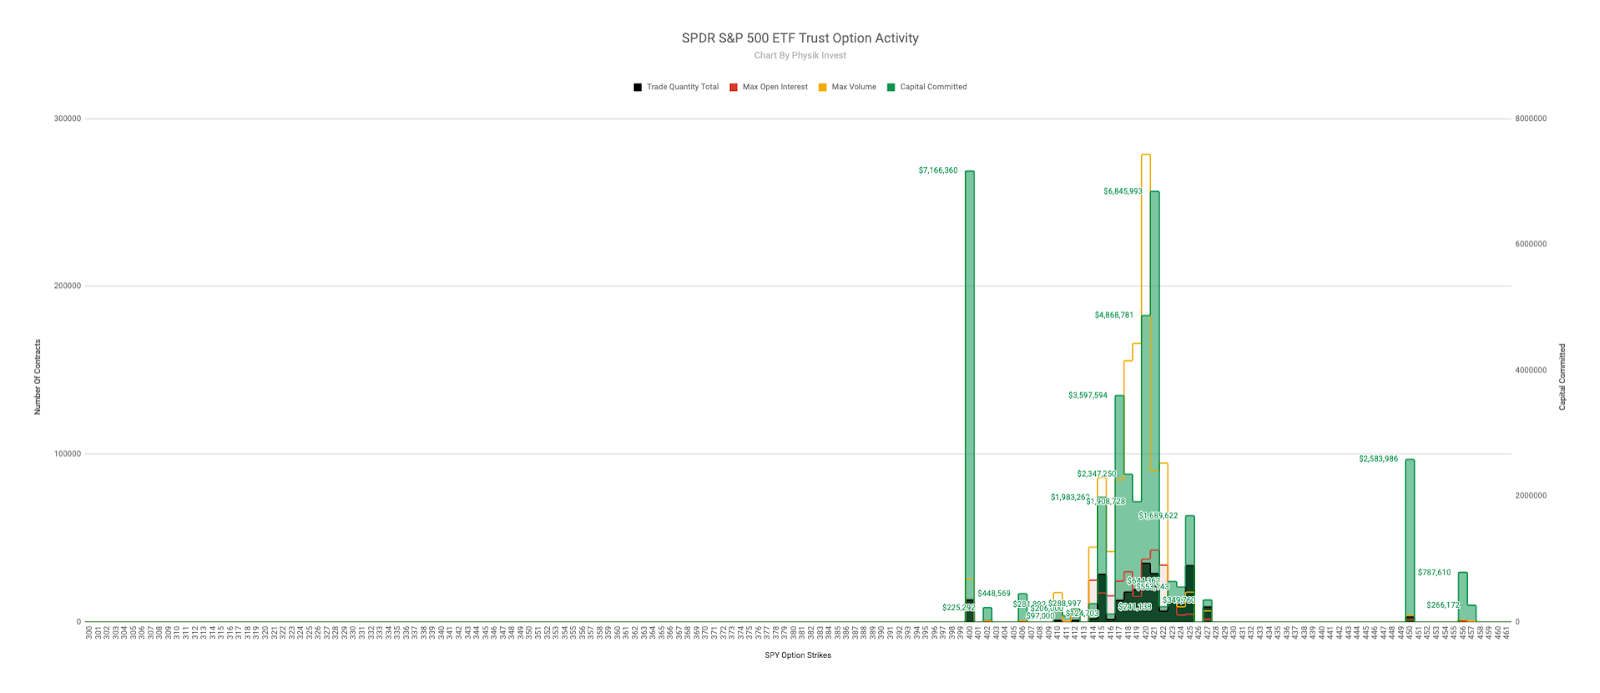
- Positioning: According to Nomura data presented by The Market Ear, CTAs have taken their positions too far on the long side, reaching levels last seen prior to the 2018 Volmageddon. Additionally, the (1) SPDR S&P 500 ETF Trust (NYSE: SPY) and the (2) Invesco QQQ Trust Series 1 (NASDAQ: QQQ) funds saw some of their biggest outflows. At the same time, certain breadth metrics are diverging from current prices while the SPDR S&P 500 ETF, cash-settled S&P 500 Index, and Invesco QQQ saw sizable call-side bets trade, Friday.
- Earnings Reaction: Last week, heavily weighted index constituents reported blowout earnings. The reaction was muted, leaving broad market indices flat-to-down. One explanation is that the expectations, going into the events, were too high. Another is that the equity market is priced to perfection, at this stage of the recovery, and further advances will be supported by the rotation into cyclical parts of the market — financials, energy, and value.
- Option Expiration (OPEX): Option expiries mark an end to pinning (i.e, the theory that market makers and institutions short options move stocks to the point where the greatest dollar value of contracts will expire worthless) and the reduction dealer gamma exposure. According to SpotGamma, a provider of actionable options insights, on Friday, up to 30% of the S&P 500 and Nasdaq 100’s gamma rolled off which may allow the indices an opportunity to directionally resolve.
So, in summarizing this section, technically, the market is bullish, supported by the prospects of a healthy rotation. In the coming week, given increased clarity on policy and a sizable derivatives expiry, participants may see directional resolve.
What To Expect: An increased potential to resolve directionally.
In addition, metrics, like price movement, market liquidity, and speculative derivatives activity, confirm participants’ bullishness and opportunistic hedging in light of an acceleration in the global restart and a turn in flows, the result of an apparent shift in consumer preferences, from saving and investing to spending.
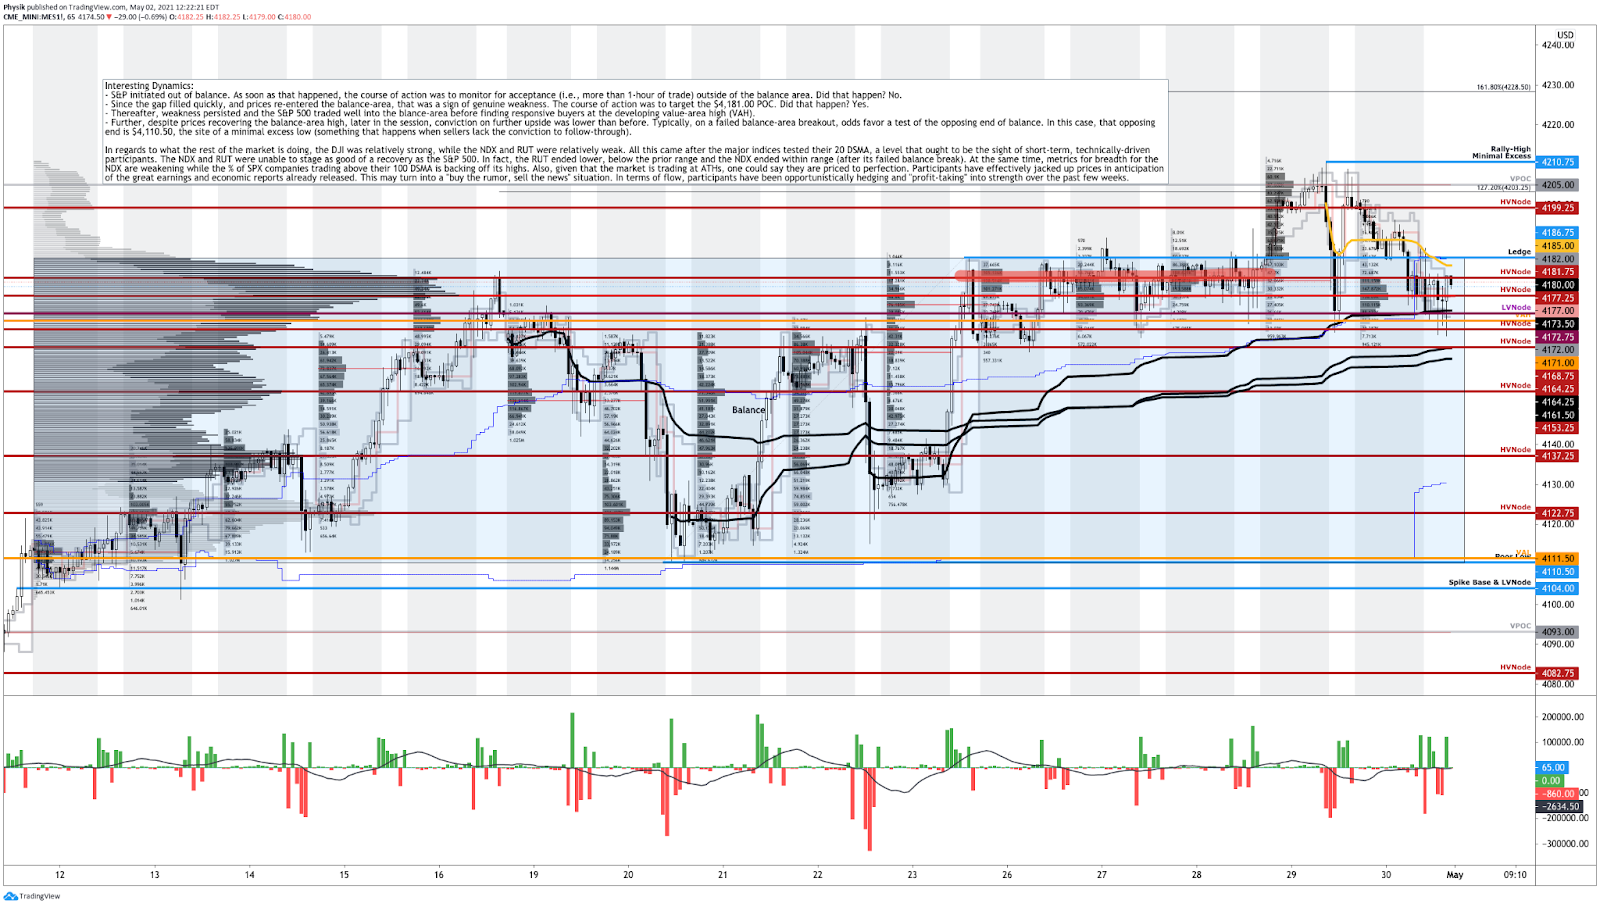
What To Do: In the coming sessions, participants will want to pay attention to where the S&P 500 trades in relation to its $4,186.75-$4,110.50 balance area.
Balance (Two-Timeframe Or Bracket): Rotational trade that denotes current prices offer favorable entry and exit. Balance-areas make it easy to spot change in the market (i.e., the transition from two-time frame trade, or balance, to one-time frame trade, or trend).

Any activity above (below) the balance-area high suggests participants are interested in discovering higher (lower) prices. Any activity within the balance area suggests participants are looking for more information to base their next move; in such case, responsive buying and selling is the course of action.

Responsive Buying (Selling): Buying (selling) in response to prices below (above) area of recent price acceptance.
Initiative trade below the balance-area low suggests an inclination by participants to revert to the mean and repair some of the poor structure left behind prior discovery. Initiative trade above the balance area puts in play the $4,210.75 minimal excess rally-high, and the cluster of price extensions at and above $4,200.00, typical price targets based on Fibonacci principles.
Initiative Buying (Selling): Buying (selling) within or above (below) previous price acceptance.

Excess: A proper end to price discovery; the market travels too far while advertising prices. Responsive, other-timeframe (OTF) participants aggressively enter the market, leaving tails or gaps which denote unfair prices.
So, in the best case, the S&P 500 makes an attempt to balance or discover prices as high as $4,300.00. In the worst case, participants look to auction the S&P 500 into prior poor structures and low-volume areas (LVNodes) that ought to offer little-to-no support.
More On Volume Areas: A structurally sound market will build on past areas of high-volume (HVNode). Should the market trend for long periods of time, it will lack sound structure (identified as a low-volume area (LVNode) which denotes directional conviction and ought to offer support on any test).

If participants were to auction and find acceptance into areas of prior low-volume, then future discovery ought to be volatile and quick as participants look to areas of high volume for favorable entry or exit.
News And Analysis
Markets | U.S. builders produced record share of homes with hot market. (BBG)
Economy | Consumer spending, labor cost data suggests inflation warming up. (REU)
Trade | Baltic Dry Index breaks 3,000 points in more than a decade on prices. (TW)
Wealth | Rich Americans fleeing tax hikes may turbocharge the shift to ETFs. (BBG)
Markets | Fed’s Robert Kaplan warns on ‘imbalances,’ wants to talk taper. (REU)
Markets | A volatility quant nets $540 million as momentum trades boom. (BBG)
Lending | States are investigating predatory subprime auto lenders. (Jalopnik)
Markets | Record metals prices catapulted mining profits beyond big oil. (BBG)
Medicine | Biden’s ARPA-H agency to ‘end cancer’ modeled after Darpa. (TC)
Markets | Bond market’s inflation bulls get Powell’s go-ahead to double down. (BBG)
Markets | Bridgewater Co-CIO sees ‘fair amount’ of stock market in bubble. (BBG)
Markets | Retail investors could counter the much-anticipated correction. (SA)
Economy | Warren Buffett denounces SPACs and Robinhood at meeting. (Axios)
Markets | Crypto’s shadow currency surges past deposits of most U.S. banks. (BBG)
Technology | Roku says it may lose YouTube app after Google’s demands. (Axios)
Economy | Ex-Treasury Secretary Summers on scarcity of workers, inflation. (BBG)
Markets | Parametric fund earns ‘Gamma Hammer’ moniker with its bets. (FT)
What People Are Saying
Innovation And Emerging Trends
FinTech | Apex Fintech has blow-out earnings ahead of NYSE listing. (BZ)
FinTech | How to attract large investors to your direct investing platform? (TC)
FinTech | New fintech groups form as industry scrutiny is ramping up. (S&P)
FinTech | Cryptocurrency bank wins OCC approval to form de novo. (S&P)
Markets | CME eyes wider customer base with micro bitcoin futures. (TB)
FinTech | Coinbase plans to acquire data and analytics platform Skew. (TB)
FinTech | How U.K.-based Lendable is powering fintechs across EMs. (TC)
FinTech | Amid the IPO gold rush, how should we value fintech startups? (TC)
FinTech | 10 fintech headhunters you need to know for recruiting to talent. (BI)
FinTech | U.K. banks speed up plans to ax branches, switch to digital focus. (S&P)
Medicine | Kevin O’Leary-backed MindMed has uplisted on the Nasdaq. (BZ)
Media | Creators are making lots of money selling Google spreadsheets. (Mashable)
Media | As newsletter advertising grows, advertisers opting for quality. (ADWK)
About
Renato founded Physik Invest after going through years of self-education, strategy development, and trial-and-error. His work reporting in the finance and technology space, interviewing leaders such as John Chambers, founder, and CEO, JC2 Ventures, Kevin O’Leary, Canadian businessman and Shark Tank host, Catherine Wood, CEO and CIO, ARK Invest, among others, afforded him the perspective and know-how very few come by.
Having worked in engineering and majored in economics, Renato is very detailed and analytical. His approach to the markets isn’t built on hope or guessing. Instead, he leverages the unique dynamics of time and volatility to efficiently act on opportunity.
Disclaimer
At this time, Physik Invest does not manage outside capital and is not licensed. In no way should the materials herein be construed as advice. Derivatives carry a substantial risk of loss. All content is for informational purposes only.