
The Daily Brief is a free glimpse into the prevailing fundamental and technical drivers of U.S. equity market products. Join the 200+ that read this report daily, below!
What Happened
Overnight, equity index futures explored lower and hammered out a low. On that recovery, measures of implied volatility fell, and most commodity products and yields moved higher.
Ahead is data on Building Permits and Housing Starts (8:30 AM ET).
What To Expect
Fundamental: Narratives discussed, before, remain valid.
Mainly, expected is strong economic and earnings growth, as well as cooling inflation.
However, according to a note published by Andy Constan of Damped Spring Advisors, “The lack of additional liquidity provided by Fed purchase will also remove a damper for the market and the economy keeping asset volatility well bid, while also causing asset diversification benefit to fall, generating rising portfolio volatility and the risk demanded to hold assets.”
The Ambrus Group’s Kris Sidial made a great point, yesterday, too.
Basically, despite that the market is off about 5% from its highs, the go-to 60/40 portfolio and “diversified funds” are in turmoil.
This newsletter has touched on the “bonds down, equities down” dynamic in the past.
In short, over the past 40 or so years, monetary policy was used as a crutch to support the economy. This promoted deflation, innovation, and the subsequent rise in valuations.
With rates near zero and lifting, that’s a headwind; coupled with participants’ increased exposure to rate and equity market risk, which can play into cross-market hedging and de-leveraging cascades, 60/40 turns into somewhat of a poor hedge.
Why? Higher rates have the potential to decrease the present value of future earnings, making stocks, especially those that are high growth, less attractive.
Putting it all together, per Constan, “If current, priced in, inflation and growth expectations are exactly realized we predict that risk premiums on 30-year yields will increase by 15bp and equity risk premium by 30bp,” Constan adds.
“These risk premium expansions will generate a 2% headwind on long bond prices and a 10% headwind for equity prices.”
Morgan Stanley (NYSE: MS) strategists are in agreement.
“With our economic team’s new Fed forecast for the end of QE, 4 rate hikes, and the beginning of balance sheet normalization this year, our call for falling valuations is likely to happen faster and more broadly than our prior forecast.”
Also: “Companies have expedited supplies, they’ve hired a bunch of labor at higher prices and if there’s excess supply now in the first or second quarter, potentially temporarily that could lead to margin compressions.”
It’s looking like Ark Invest’s Catherine Wood hit the nail on the head with respect to her comments on inventory build-ups.
Early in November, as this newsletter highlighted, the CIO said inflation was likely on its way out due to (1) productivity increases, (2) China housing and financial sector turmoil depressing commodity prices, (3) inventory build-ups, and (4) disruptive innovation.
“This is unsustainable,” she had said. “I’m wondering if even the housing market inflation is going to give way, here.”
Positioning: Despite elevated measures of implied volatility like the Cboe Volatility Index (INDEX: VIX) marking higher, the VIX term structure remains upward sloping.
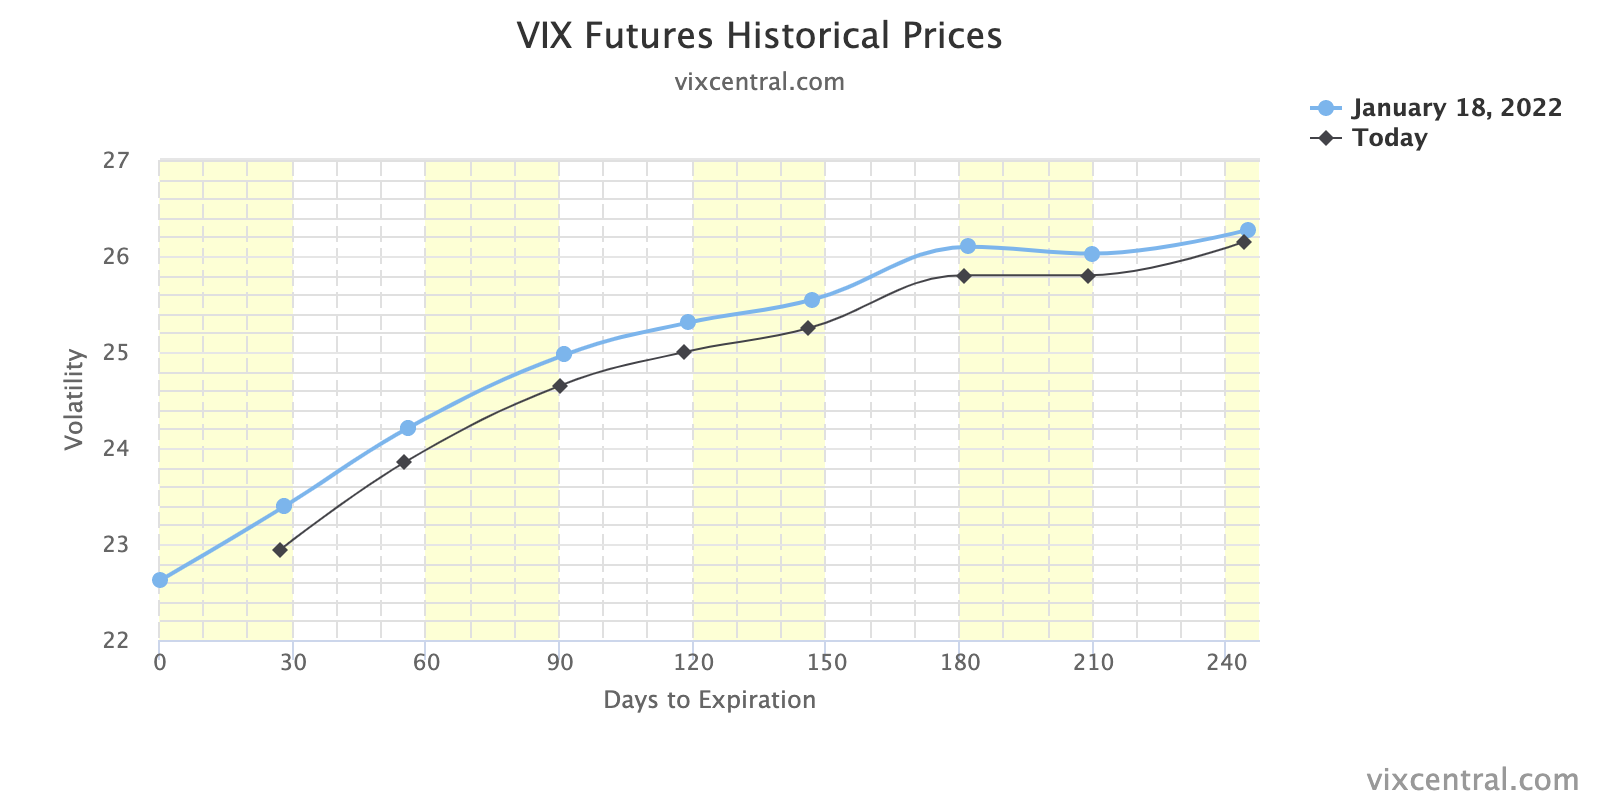
All that means is that we have yet to similar levels of destabilizing demand for protection.
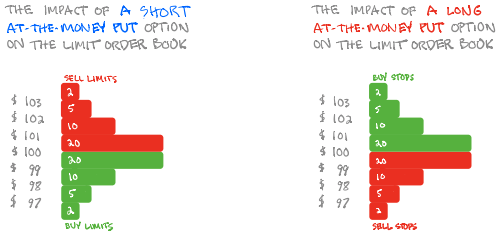
Though conditions could worsen, taking into account options positioning, versus buying pressure (measured via short sales or liquidity provision on the market-making side), metrics remain positively skewed, more so than before.
Any expansion in volatility, however, likely coincides with further weakness.
As a result, this, coupled with data that suggests “OPEX week returns peaked in 2016 and have trended lower since,” cautions us on trade into and after this week’s expiration of options on the VIX and equity products.
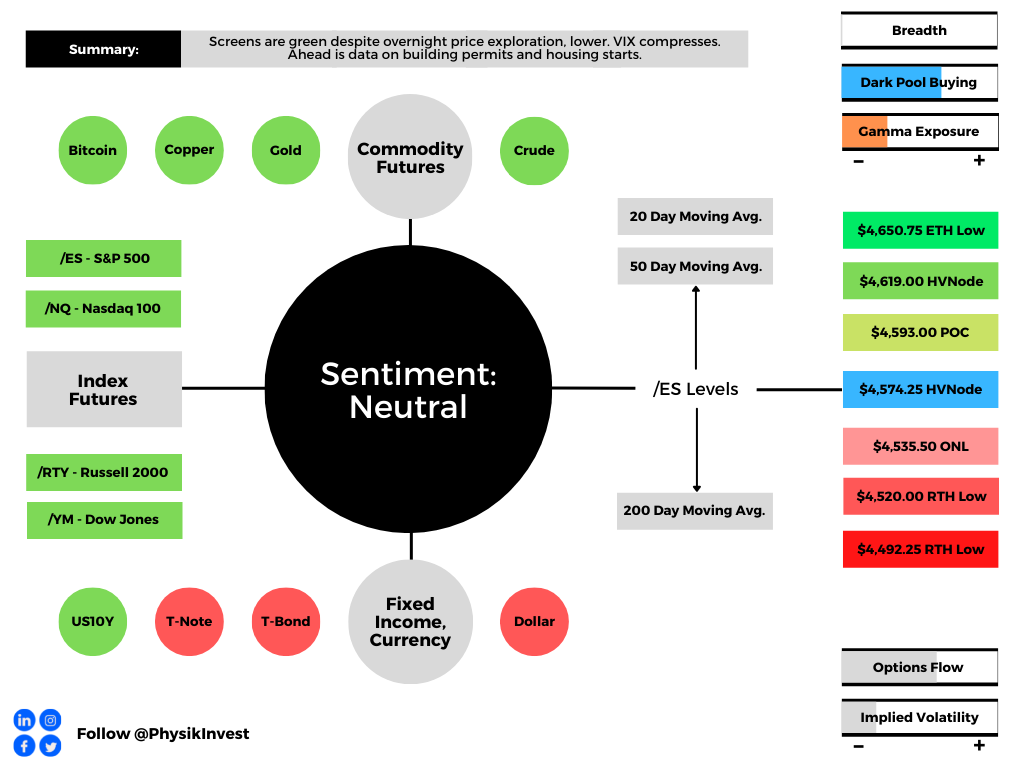
Technical: As of 6:30 AM ET, Wednesday’s regular session (9:30 AM – 4:00 PM ET), in the S&P 500, will likely open in the upper part of a negatively skewed overnight inventory, inside of prior-range and -value, suggesting a limited potential for immediate directional opportunity.
In the best case, the S&P 500 trades higher; activity above the $4,574.25 high volume area (HVNode) puts in play the $4,593.00 point of control (POC). Initiative trade beyond the POC could reach as high as the $4,619.00 HVNode and $4,650.75 extended trading hours low (ETH Low), or higher.
In the worst case, the S&P 500 trades lower; activity below the $4,574.25 HVNode puts in play the $4,535.50 overnight low (ONL). Initiative trade beyond the ONL could reach as low as the $4,520.00 and $4,492.00 regular trade low (RTH Low), or lower.
Click here to load today’s key levels into the web-based TradingView charting platform. Note that all levels are derived using the 65-minute timeframe. New links are produced, daily.

Definitions
Overnight Rally Highs (Lows): Typically, there is a low historical probability associated with overnight rally-highs (lows) ending the upside (downside) discovery process.
Volume Areas: A structurally sound market will build on areas of high volume (HVNodes). Should the market trend for long periods of time, it will lack sound structure, identified as low volume areas (LVNodes). LVNodes denote directional conviction and ought to offer support on any test.
If participants were to auction and find acceptance into areas of prior low volume (LVNodes), then future discovery ought to be volatile and quick as participants look to HVNodes for favorable entry or exit.
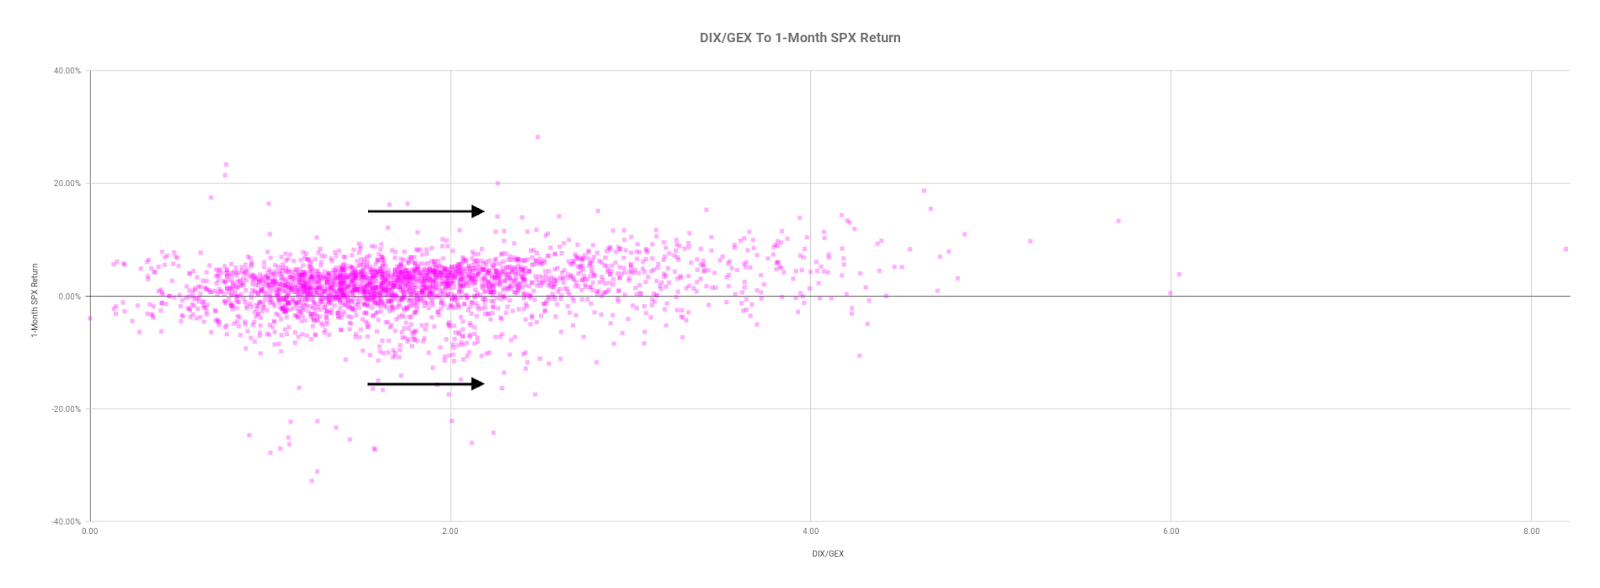
DIX: For every buyer is a seller (usually a market maker). Using DIX — which is derived from short sales (i.e., liquidity provision on the market-making side) — we can measure buying pressure.
Vanna: The rate at which the delta of an option changes with respect to volatility.
Charm: The rate at which the delta of an option changes with respect to time.
POCs: POCs are valuable as they denote areas where two-sided trade was most prevalent in a prior day session. Participants will respond to future tests of value as they offer favorable entry and exit.
MCPOCs: POCs are valuable as they denote areas where two-sided trade was most prevalent over numerous day sessions. Participants will respond to future tests of value as they offer favorable entry and exit.
Options Expiration (OPEX): Traditionally, option expiries mark an end to pinning (i.e, the theory that market makers and institutions short options move stocks to the point where the greatest dollar value of contracts will expire) and the reduction dealer gamma exposure.
Inversion Of VIX Futures Term Structure: Longer-dated VIX expiries are less expensive; is a warning of elevated near-term risks for equity market stability.
About
After years of self-education, strategy development, mentorship, and trial-and-error, Renato Leonard Capelj began trading full-time and founded Physik Invest to detail his methods, research, and performance in the markets.
Capelj is also a Benzinga finance and technology reporter interviewing the likes of Shark Tank’s Kevin O’Leary, JC2 Ventures’ John Chambers, FTX’s Sam Bankman-Fried, and ARK Invest’s Catherine Wood, as well as a SpotGamma contributor developing insights around impactful options market dynamics.
Disclaimer
Physik Invest does not carry the right to provide advice.
In no way should the materials herein be construed as advice. Derivatives carry a substantial risk of loss. All content is for informational purposes only.