
Key Takeaways:
- $1.9T relief package is enacted.
- Inflation to print past Fed goal.
- Policy actions to limit volatility.
- Potential for late-March selling.
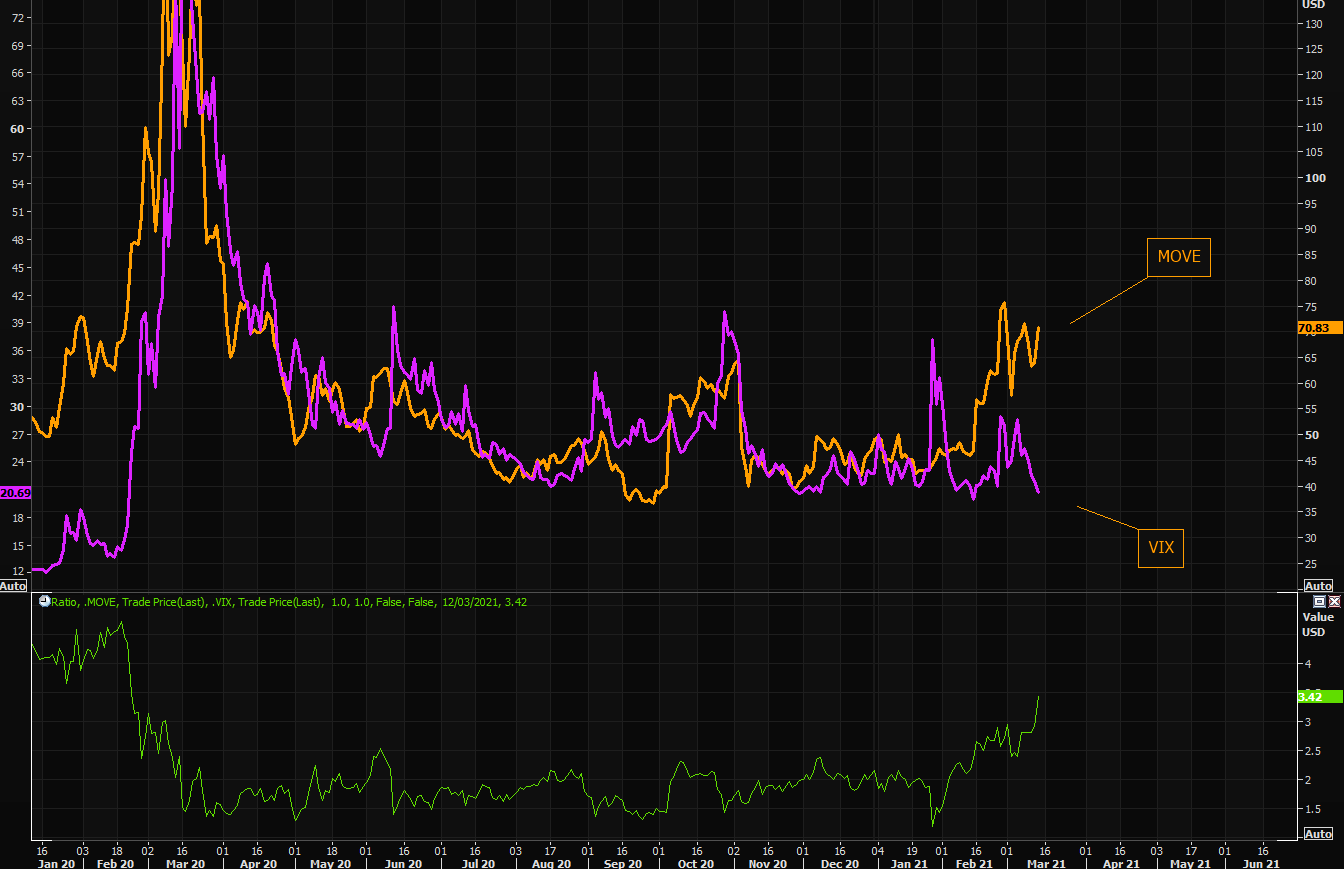
- Bond, equity volatility diverged.
- U.S. to lead economic recovery.
What Happened: U.S. stock index futures closed higher, last week.
This came alongside (1) the enactment of a massive, $1.9 trillion coronavirus relief plan, (2) convergence in the 10-year Treasury rate and S&P 500 dividend yield, as well as (3) a material divergence in bond and equity market volatility.
What Does It Mean: The pandemic disrupted the global economy, hitting the hardest airlines, leisure facilities, energy, manufacturing, and restaurants, among other industries.
The stock market tumbled, as a result, and the subsequent recovery was lead by technology, which delivered its strongest annual average return since the Global Financial Crisis (GFC).
Now, as virus case counts fall, the pace of vaccinations accelerates, and massive coronavirus relief bills are passed, shares of stocks in beaten-down industries are becoming favorites.
This reopening trade, as it’s called, comes alongside projections the U.S. will lead the 2021 global economic recovery.
Amidst the bullishness, the yield on a 10-year Treasury, a risk-free asset, which was — per Axios — “artificially depressed by the flight-to-quality trade during the coronavirus pandemic, as well as by large-scale purchases by the Federal Reserve,” converged with S&P 500’s dividend yield.

Typically, the S&P 500’s dividend yield is less than the risk-free rate because investors expect to earn less in dividends than they would holding the same amount in bonds, absent rising stock prices.
Values are derived using the discounted cash flow calculation; as interest and discount rates go up, the present value of future earnings goes down, which will drag stock prices, especially in growth categories, as evidenced by the Nasdaq-100’s relative weakness.

Still, historically speaking, rising yields aren’t that harmful. Looking as far back as the 1960s, there are 13 periods in which the yield on a 10-year Treasury rose by at least 1.5%.
“In nearly 80% (10 of 13) of the prior periods, the S&P 500 Index posted gains as rates rose, as it has so far in the current rising-rate period,” a statement by LPL Financial said. “In fact, the average yearly gain for the index during the previous rising-rate periods, at 6.4%, is just a little lower than the historical average over the entire period of 7.1%, while rising rates have been particularly bullish for stocks since the mid-1990s.”
Further, despite an attempted pricing in of rising debt levels and inflation, a divergence in bond and equity market volatility persists.
Historically, fear across markets tends to move in tandem. That’s not the case today.
What To Expect: Balance, or two-sided trade as participants look for more information to base their next move on after last week’s rapid recovery.
Coming into the weekend, market liquidity suggested (1) buying pressure was leveling out and/or (2) buyers were absorbing resting liquidity (opportunistic selling or selling into strength), while speculative options activity was concentrated on the put-side.

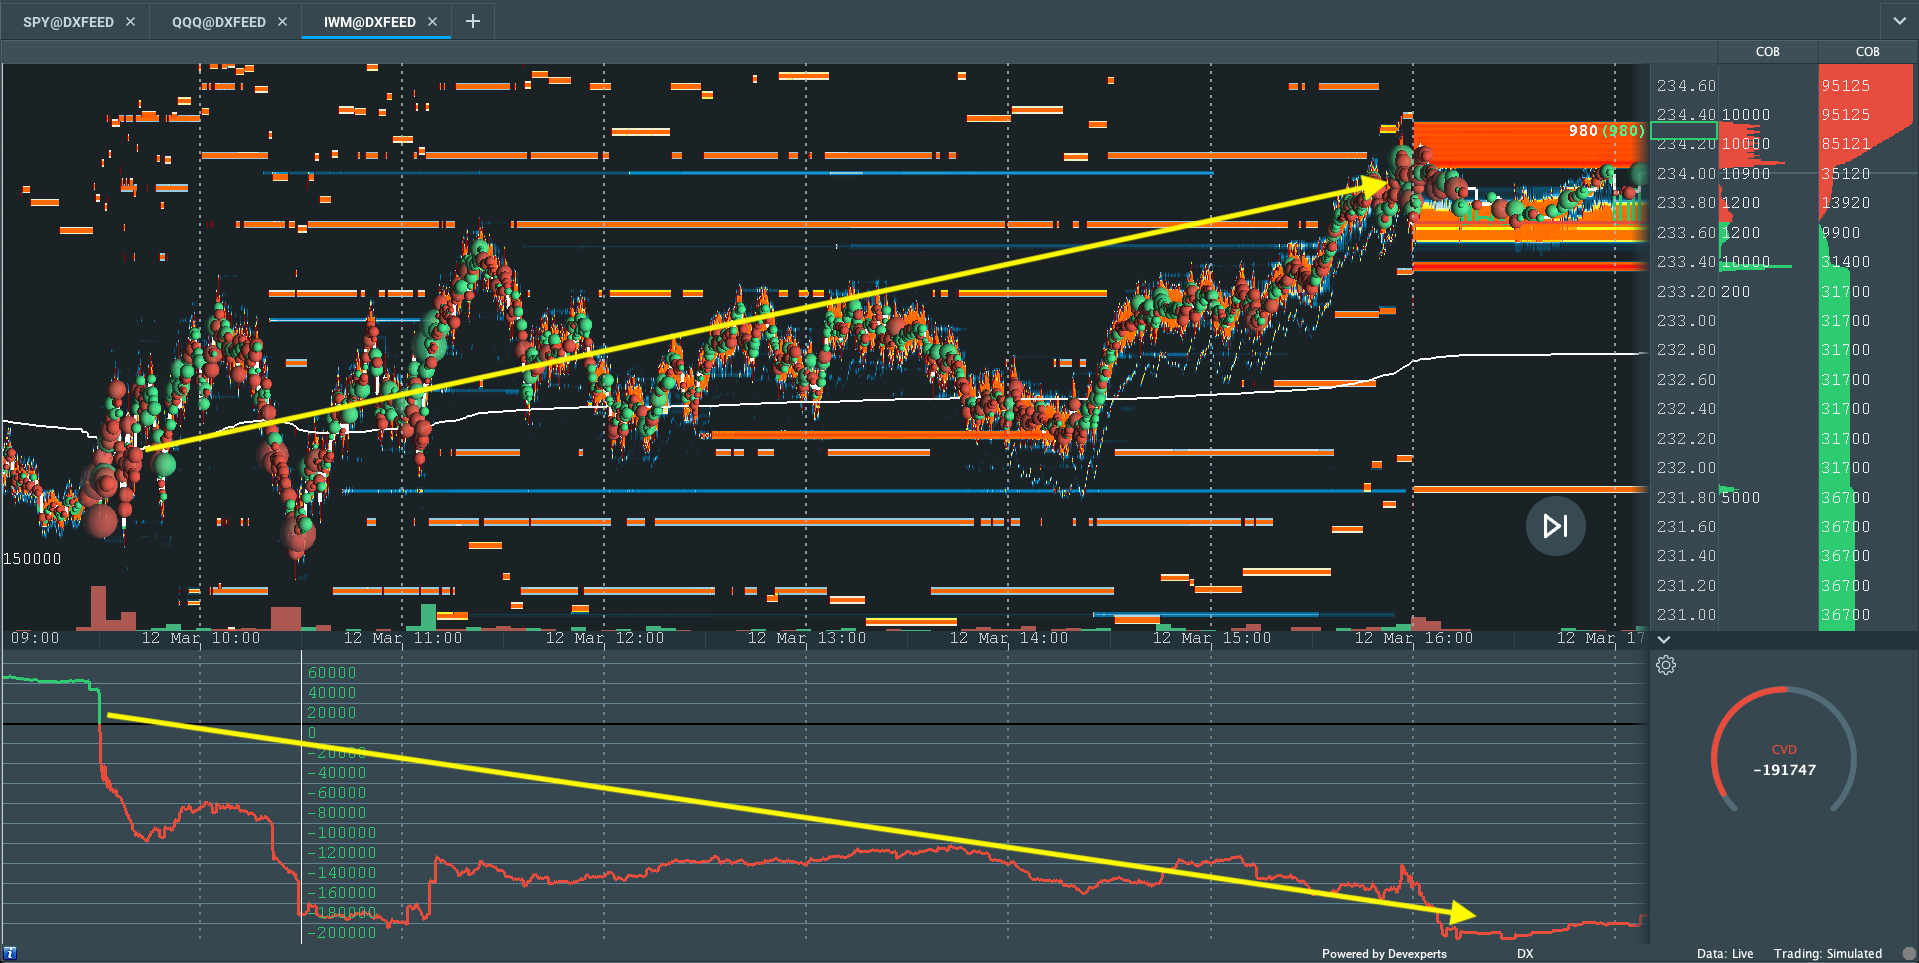
IWM Market Liquidity 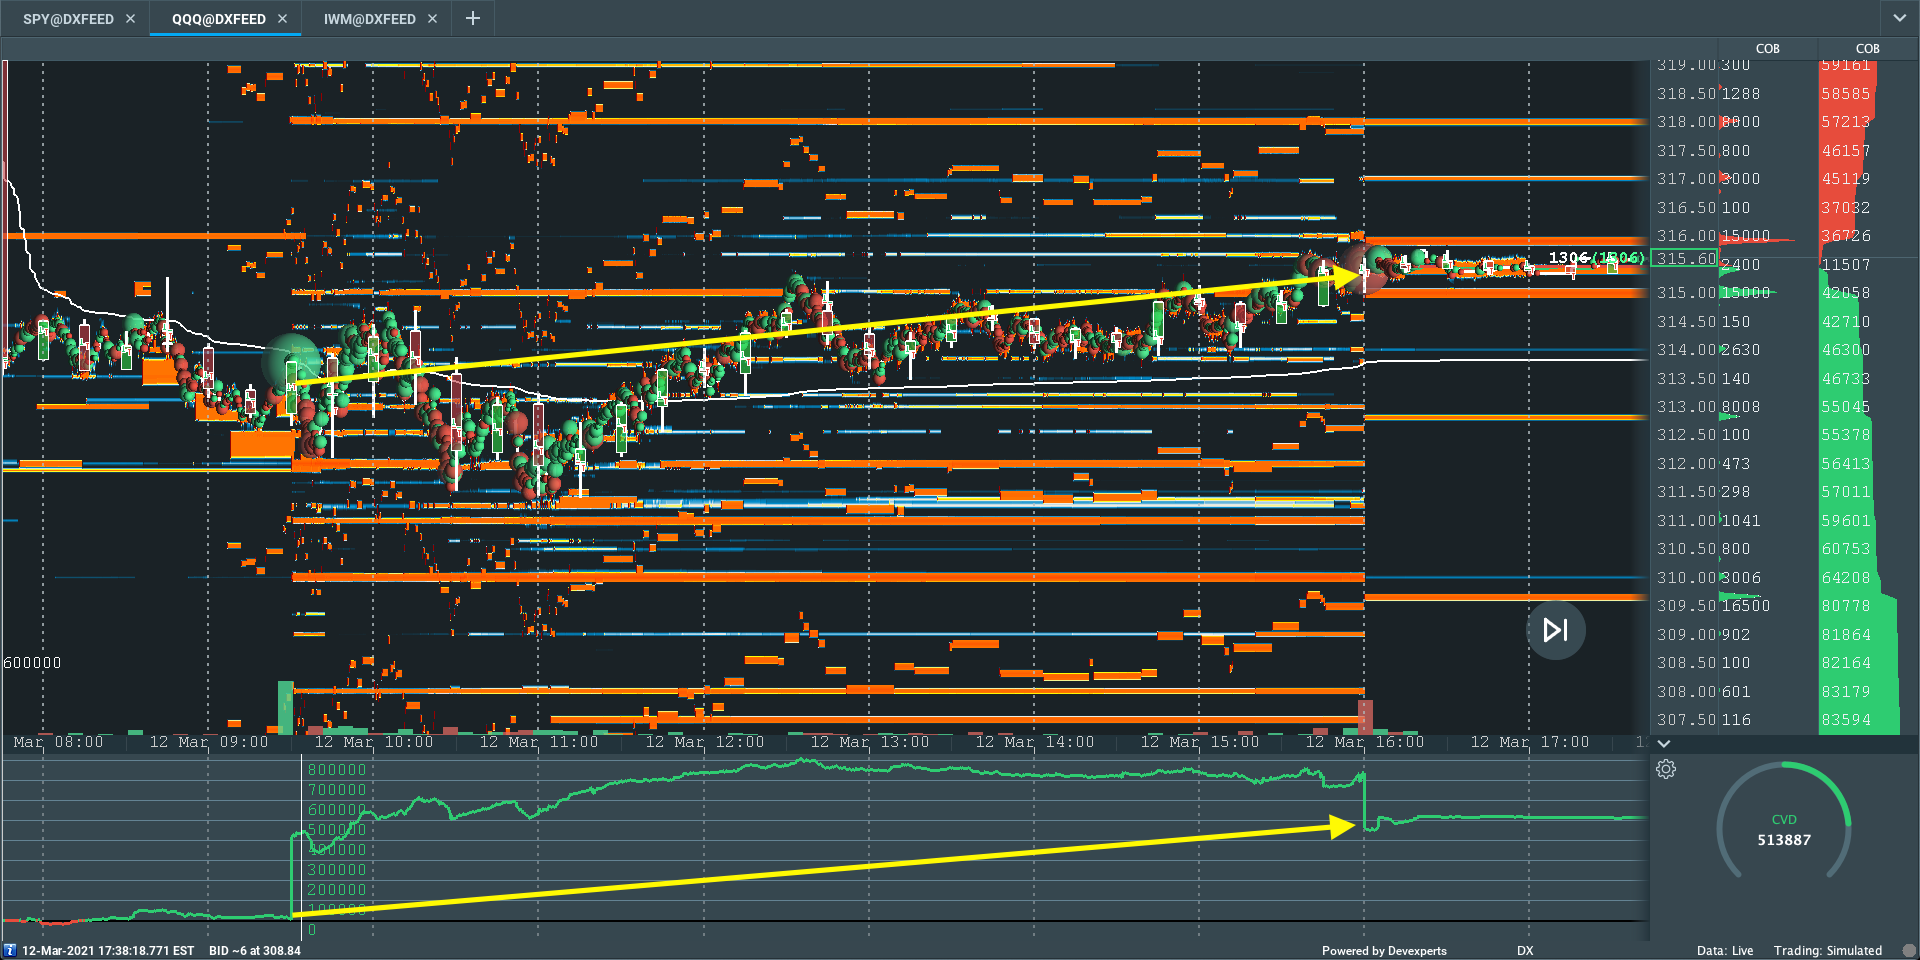
QQQ Market Liquidity 
SPY Market Liquidity
What To Do: In the coming sessions, participants will want to pay attention to the VWAP anchored from the $3,959.25 overnight rally-high, as well as the $3,840.00 high-volume area (HVNode).
Volume-Weighted Average Prices (VWAPs): Metrics highly regarded by chief investment officers, among other participants, for quality of trade. Additionally, liquidity algorithms are benchmarked and programmed to buy and sell around VWAPs.

More On Volume Areas: A structurally sound market will build on past areas of high-volume (HVNode). Should the market trend for long periods of time, it will lack sound structure (identified as a low-volume area (LVNode) which denotes directional conviction and ought to offer support on any test).

If participants were to auction and find acceptance into areas of prior low-volume, then future discovery ought to be volatile and quick as participants look to areas of high-volume for favorable entry or exit.

More On Overnight Rally Highs (Lows): Typically, there is a low historical probability associated with overnight rally-highs (lows) ending the upside (downside) discovery process.
In the best case, the S&P 500 remains above the $3,840.00 volume area, and VWAP anchored from the $3,959.25 peak. This would suggest buyers, on average, are in control and winning since the February 15 rally-high.
Any activity below the VWAP anchored from the $3,959.25 peak may (1) leave the $3,840.00 HVNode as an area of supply, offering initiative sellers favorable entry and responsive buyers favorable exit.


Conclusions: The go/no-go level for next week’s trade is $3,840.00.
Any activity at this level suggests market participants are looking for more information to base their next move. Anything above (below) this level increases the potential for higher (lower).
Levels Of Interest: $3,840.00 HVNode.
Photo by Aleksandar Pasaric from Pexels.
7 replies on “Market Commentary For The Week Ahead: ‘Mostly Sunny’”
[…] Notice: To view this week’s big picture outlook, click here. […]
[…] Notice: To view this week’s big picture outlook, click here. […]
[…] Notice: To view this week’s big picture outlook, click here. […]
[…] Notice: To view this week’s big picture outlook, click here. […]
[…] Notice: To view this week’s big picture outlook, click here. […]
[…] flows turn, it is likely that equity and bond market volatility converge; the ongoing divergence comes alongside an attempt, by market participants, to price in rising debt […]
[…] Real Yields: Alongside April’s FOMC — at which the Federal Reserve left rates unchanged and asset purchases steady — 10-year real yields are on track for their biggest drop since last summer. Low real rates may catalyze risk assets as the present value of their future earnings become more attractive. […]