The Daily Brief is a free glimpse into the prevailing fundamental and technical drivers of U.S. equity market products. Join the 200+ that read this report daily, below!
What Happened
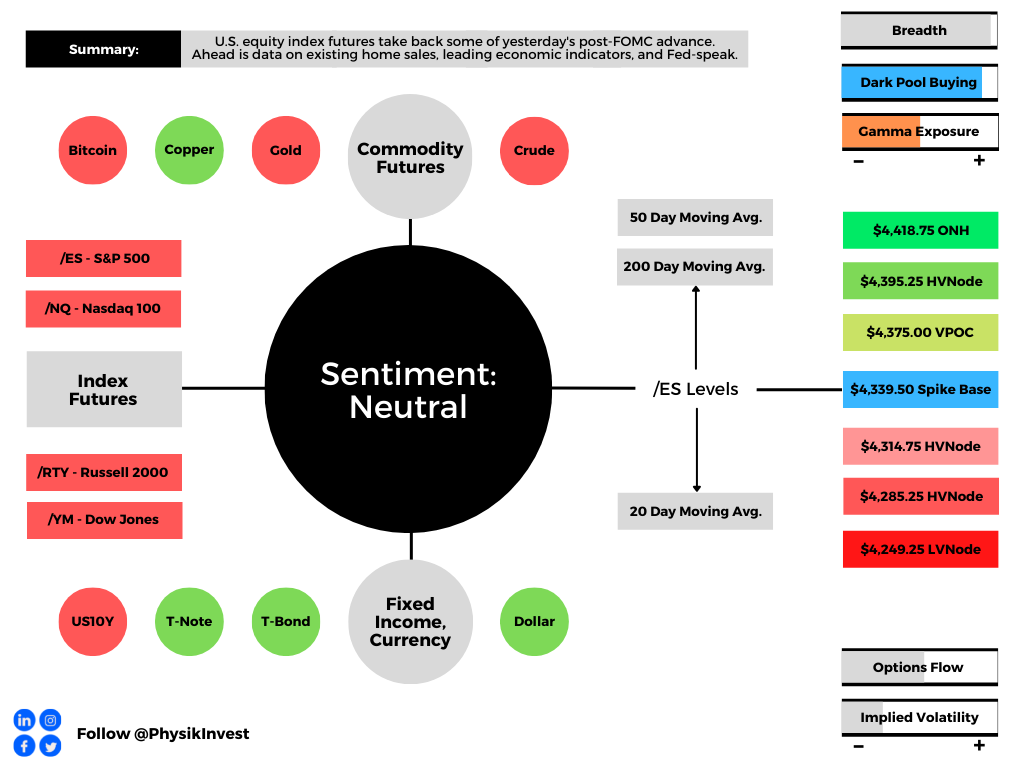
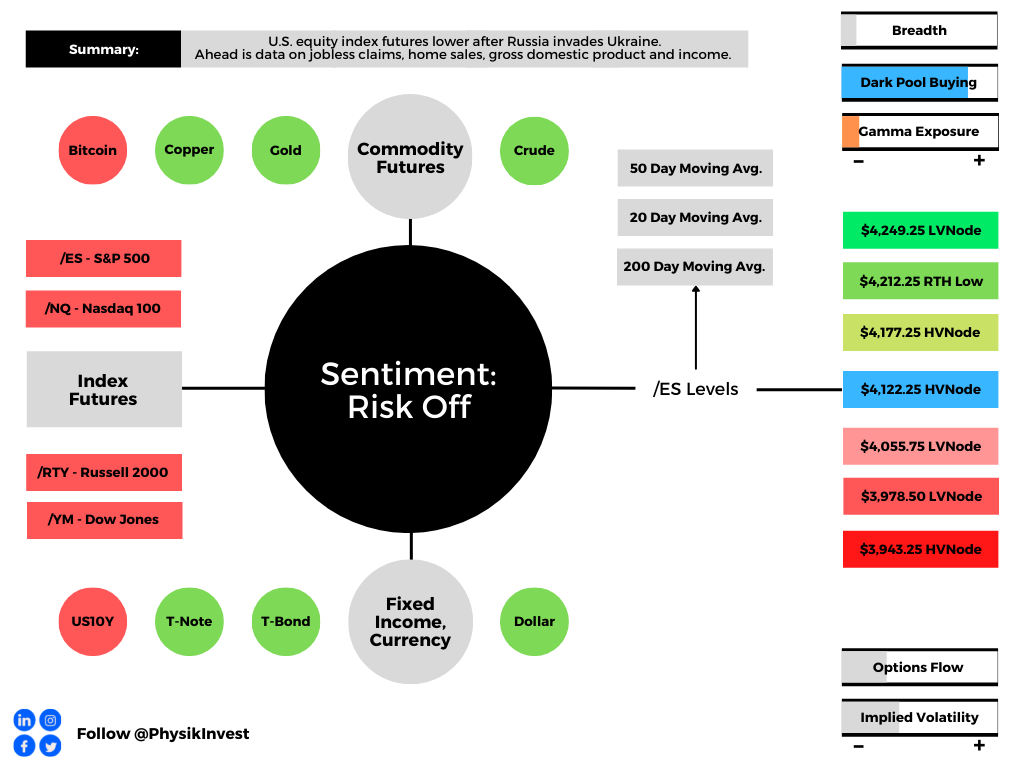
Overnight, equity index futures auctioned off of Friday’s regular trade lows. Yields, the dollar, and implied volatility metrics were bid.
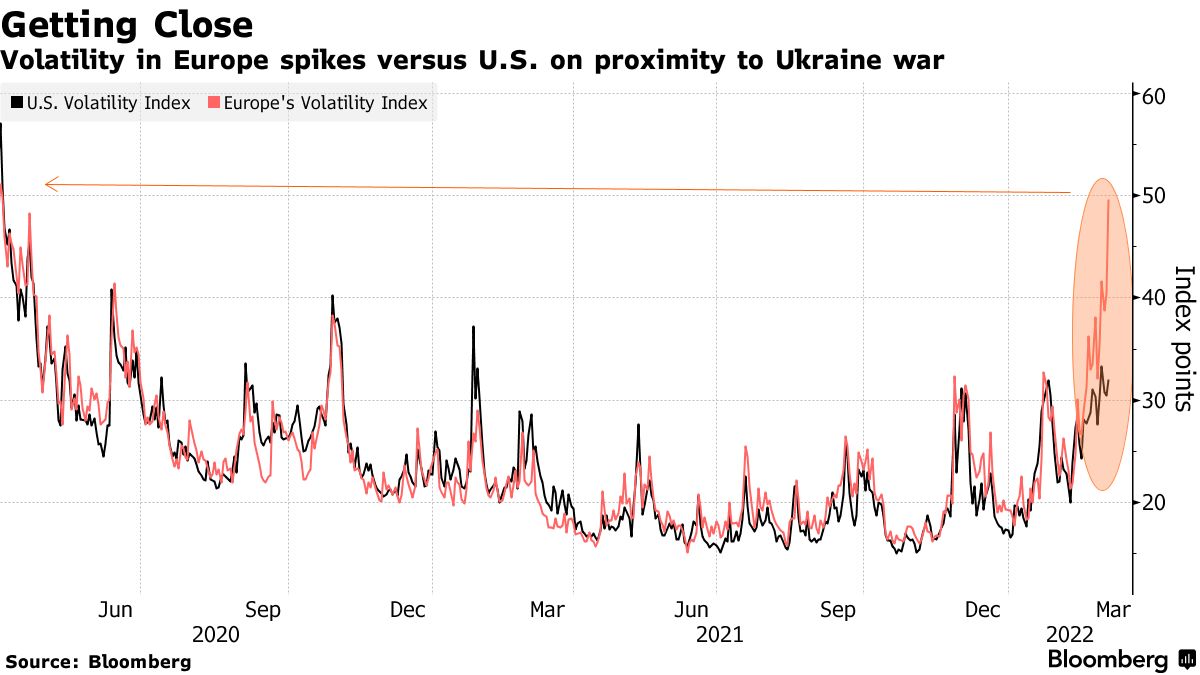
There were no changes in the newsflow’s tone this weekend; investors remain concerned over the implications of monetary policy shifts and inflation, as well as war, COVID, and the supply pressures associated.
Ahead is data on S&P Global Inc’s (NYSE: SPGI) U.S. manufacturing PMI (9:45 AM ET), as well as the ISM manufacturing index and construction spending (10:00 AM ET).
What To Expect
Fundamental: The indexes continue to hold well in the context of severe weaknesses under the hood, so to speak, especially in the high-flying technology and growth of 2020-2021.
Stocks like Zoom Video Communications (NASDAQ: ZM) and Netflix Inc (NASDAQ: NFLX), the beneficiaries of the work-from-home trends, have de-rated substantially since the start of 2022.
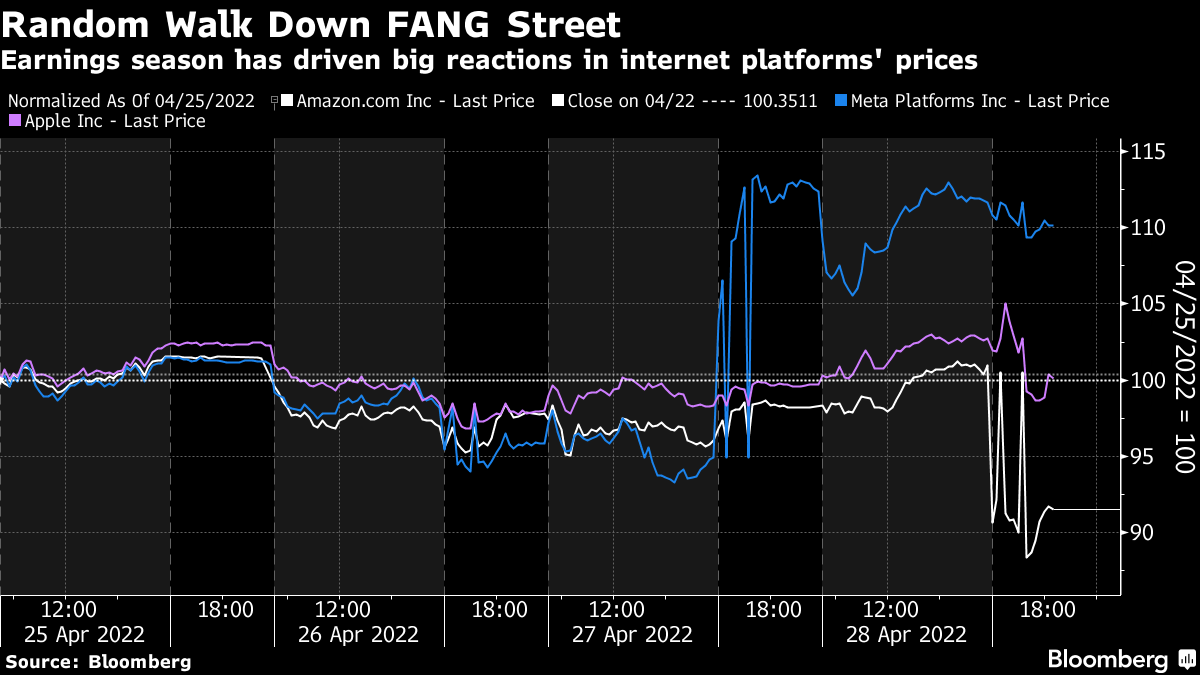
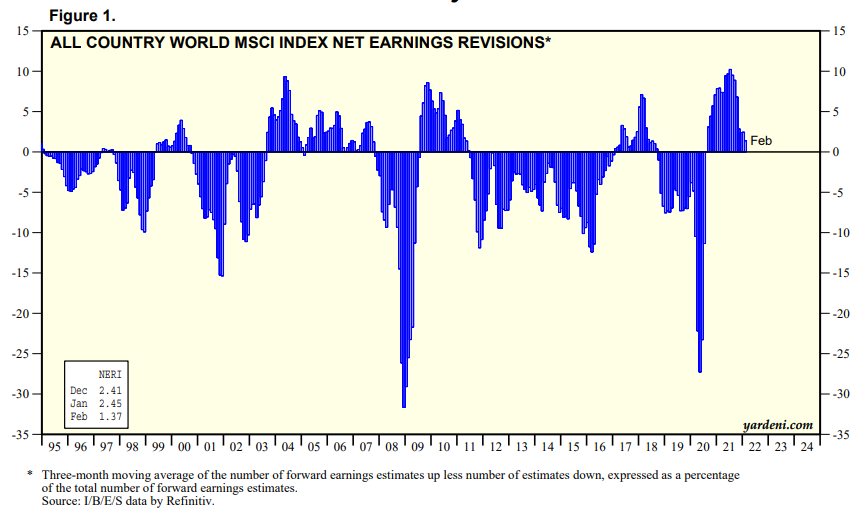
In spite of earnings growth (~10% for S&P 500 companies that have reported, per Bloomberg), “the reaction to earnings surprises in April was asymmetric,” and a display of “the outsized role played by outliers.”
For context, “Mega-cap growth (MCG) & Tech earnings are missing by -6.0% at the aggregate level [while] the median company [is] beating by 5.7%.”
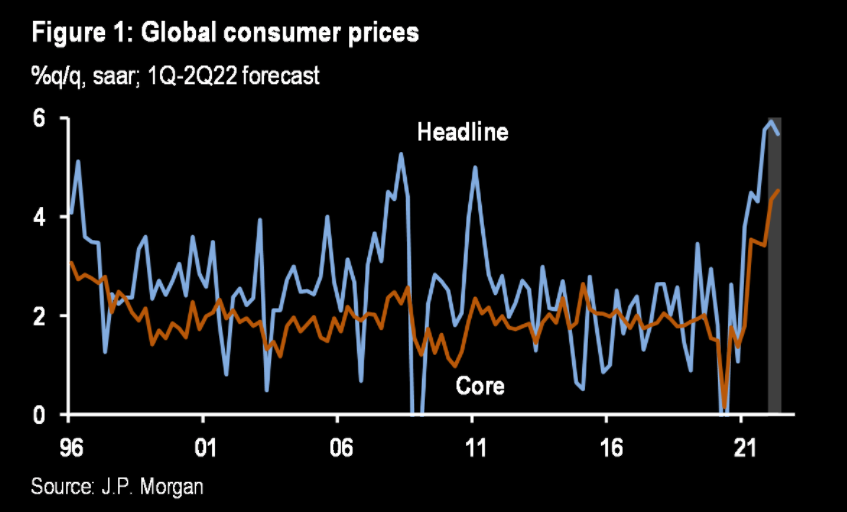
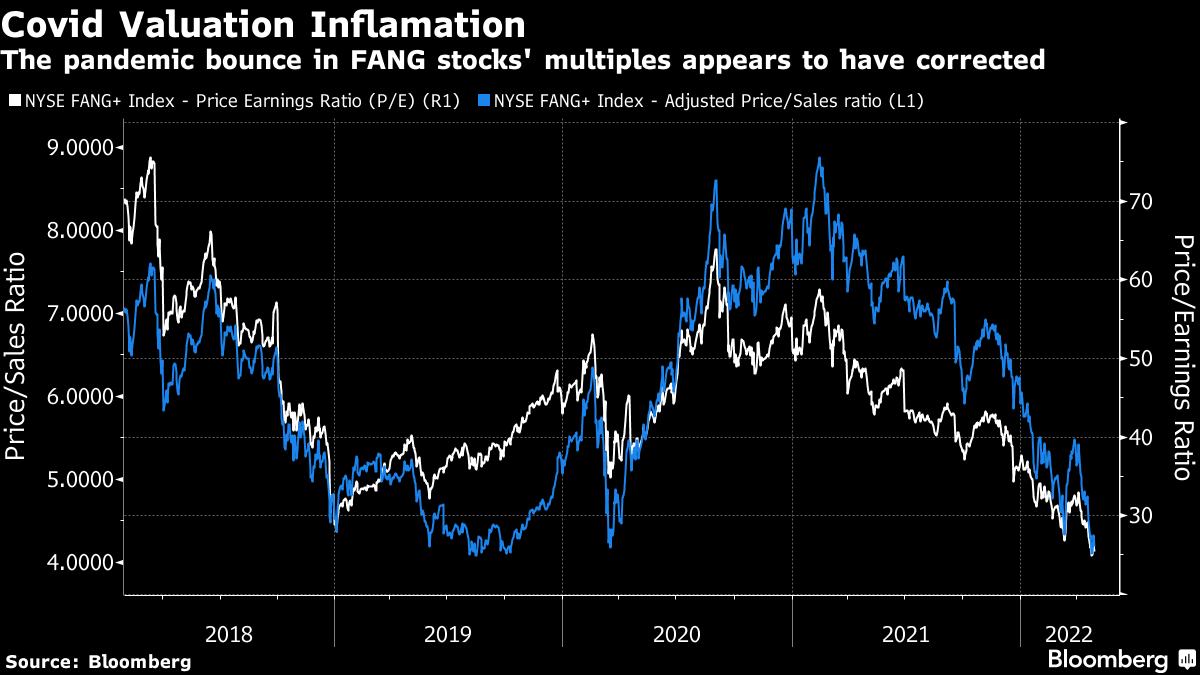
This is as inflation, among other factors, continues to bite into the “over-optimistic multiples driven by the assumption that pandemic-era performance could continue in perpetuity.”
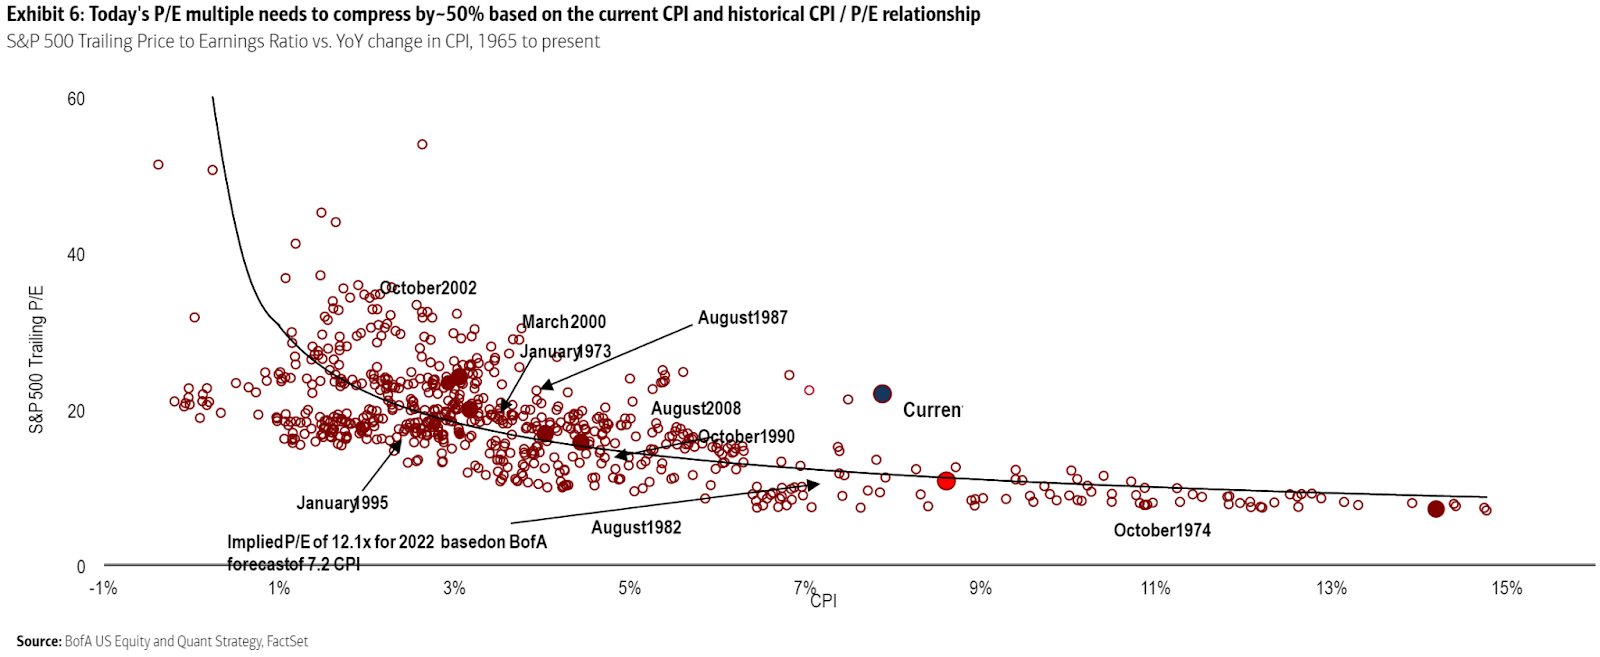
Per Bank of America Corporation (NYSE: BAC), the S&P’s current P/E is way too high, given the current CPI.
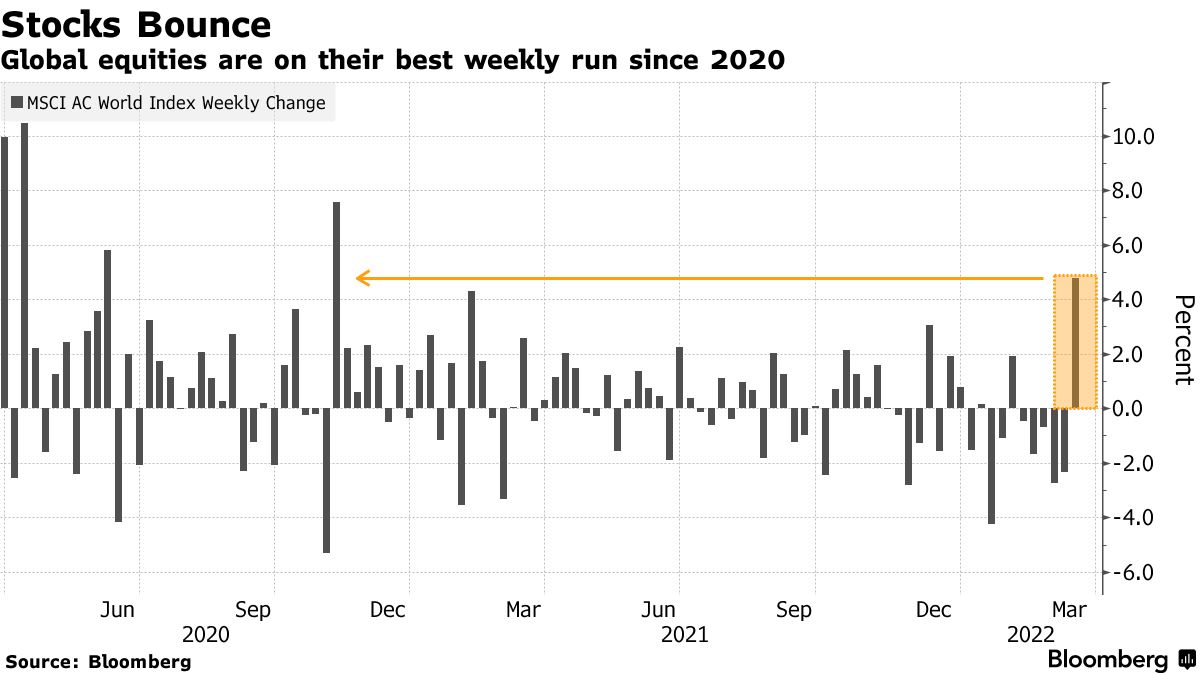
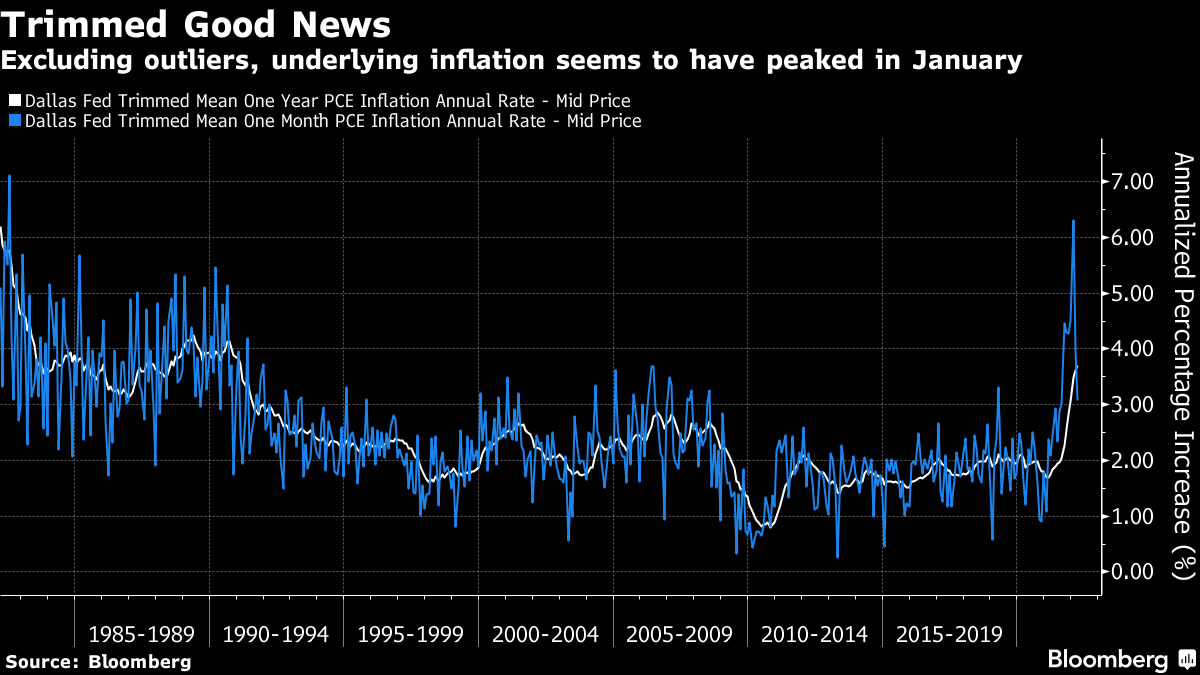
Notwithstanding, trimming outliers, inflation may have peaked and that is a positive for those equity investors who think “inflation is high, but they’re confident that it’s transitory,” therefore current valuations are just.
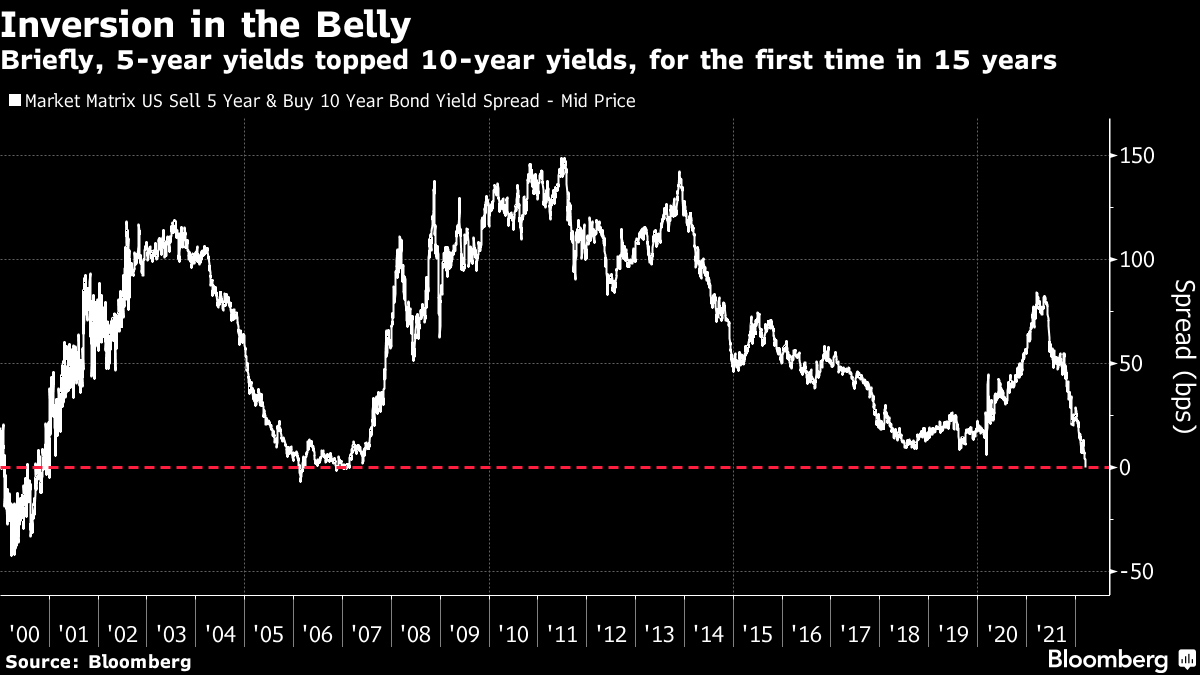
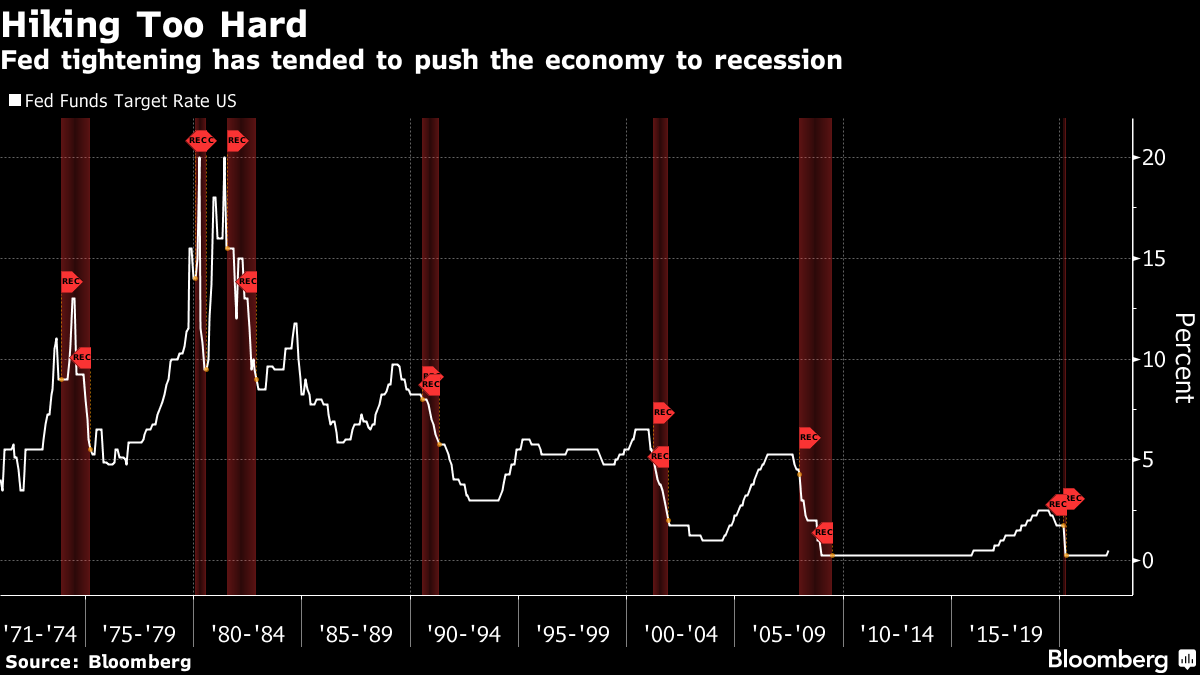
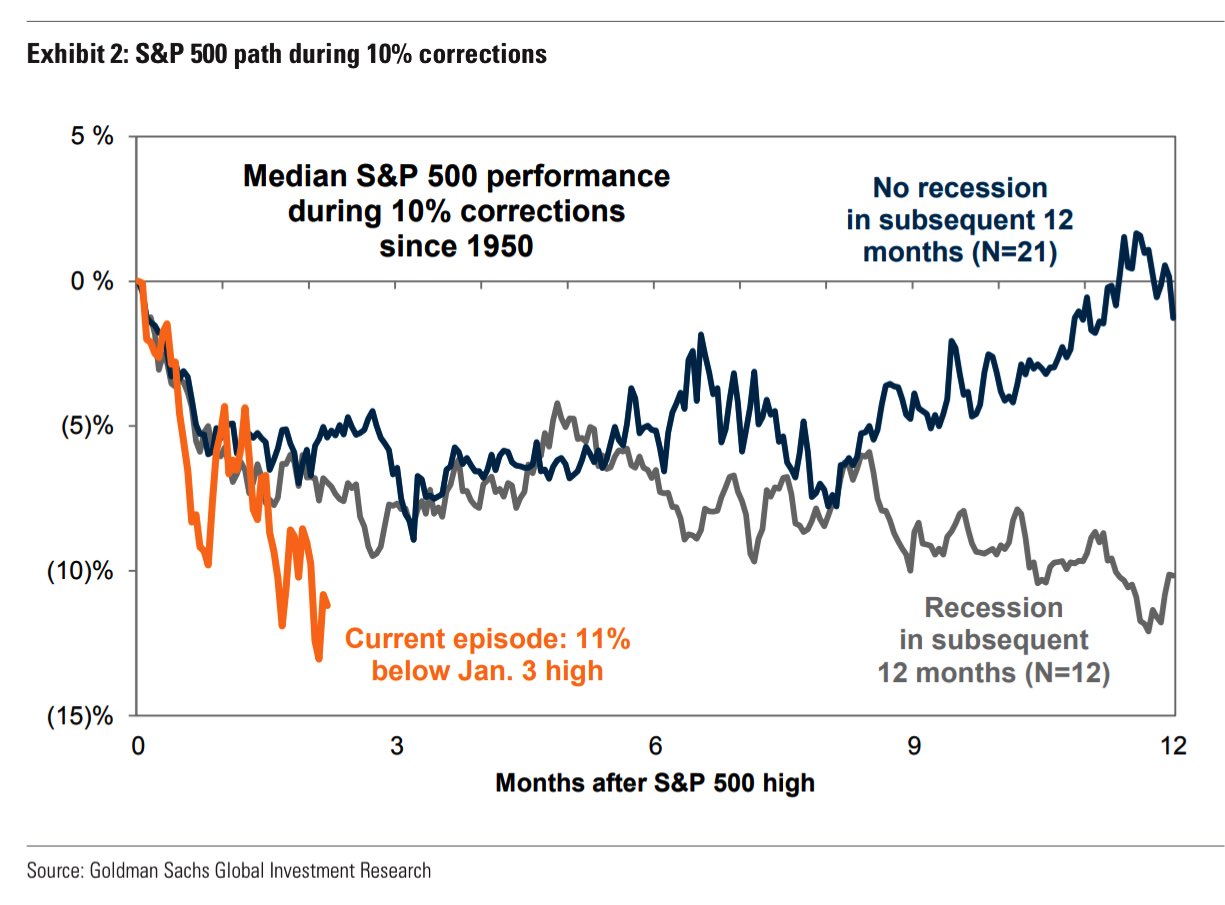
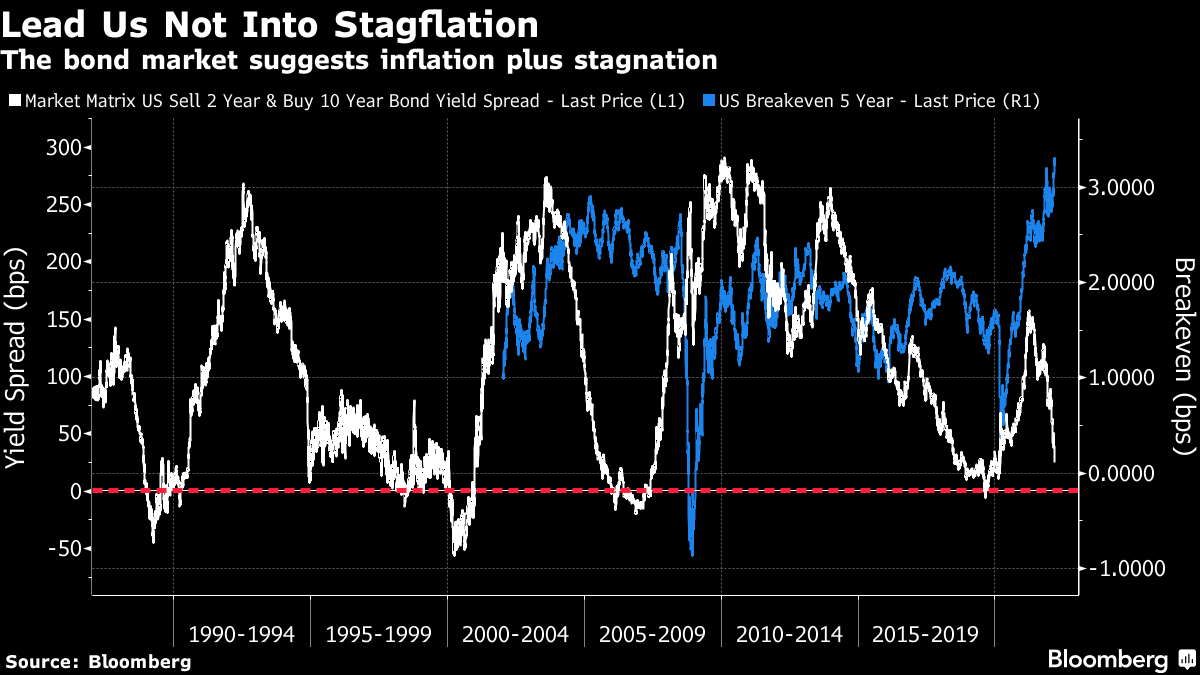
Per @ConvexityMaven, recession chatter is unwarranted. The economy is expanding and the only worry investors should have is “if the Fed cannot chill nominal GDP.”
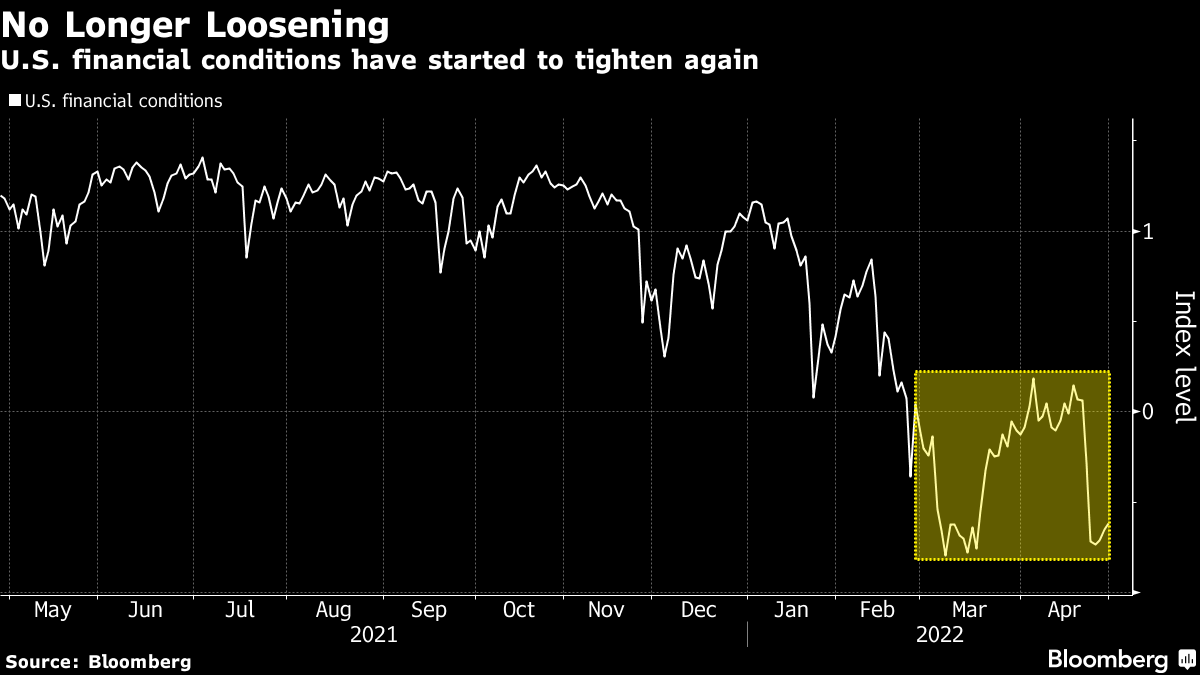
That means “rates are going north” and, according to Bank of America Corporation’s Michael Hartnett, “asset prices must reset lower.”
Some investors, like the Japanese, have heeded this message and are offloading billions in Treasuries in anticipation of more attractive levels and “stabilization in long-dated yields.”
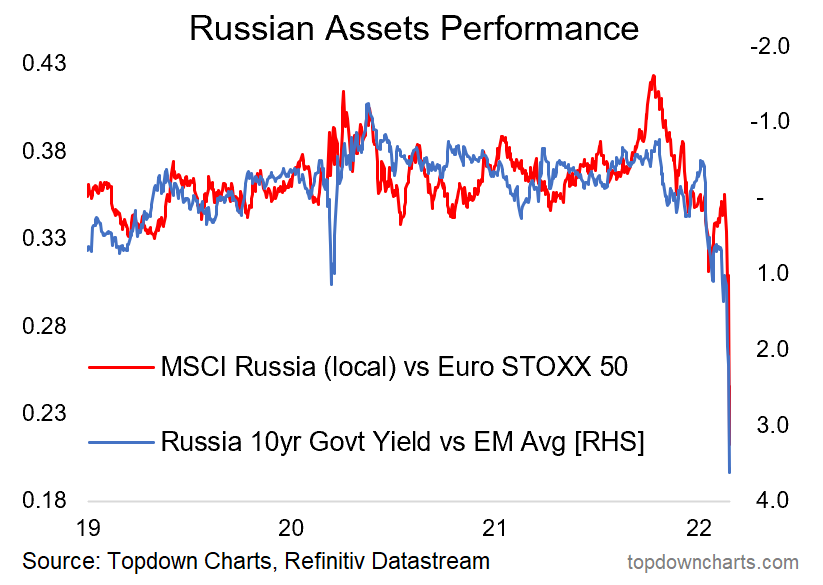
Perspectives: Some, including Credit Suisse Group AG’s (NYSE: CS) Zoltan Pozsar, believe market participants are in for a world of [much more] hurt as “central banks can only deal with nominal, not real chokepoints.”
“Banks’ stock buybacks are lowering SLRs as we speak, and the Fed is about to embark on QT, and these nominal balance sheet and liquidity trends, will at some point clash with the realities of a garden variety of supply chain issues,” as a result of geopolitical chokepoints.
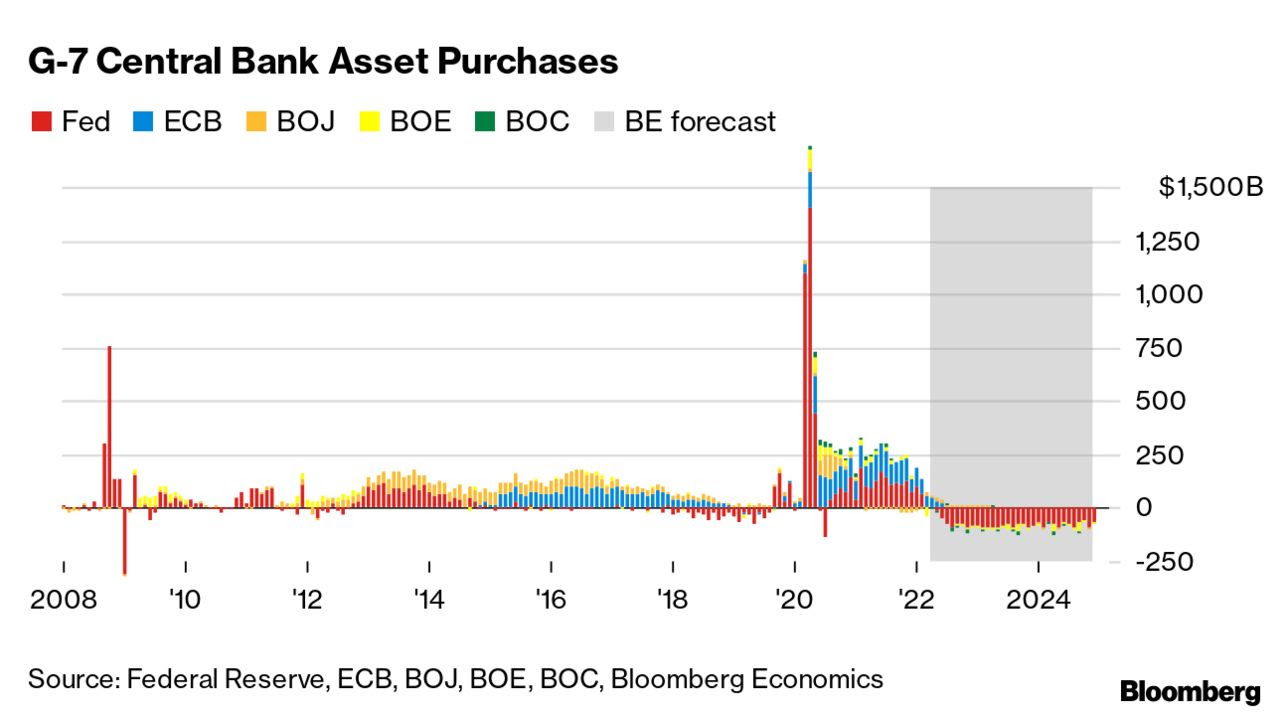
Given Pozsar’s findings, “The Fed will do QE again by summer 2023.”
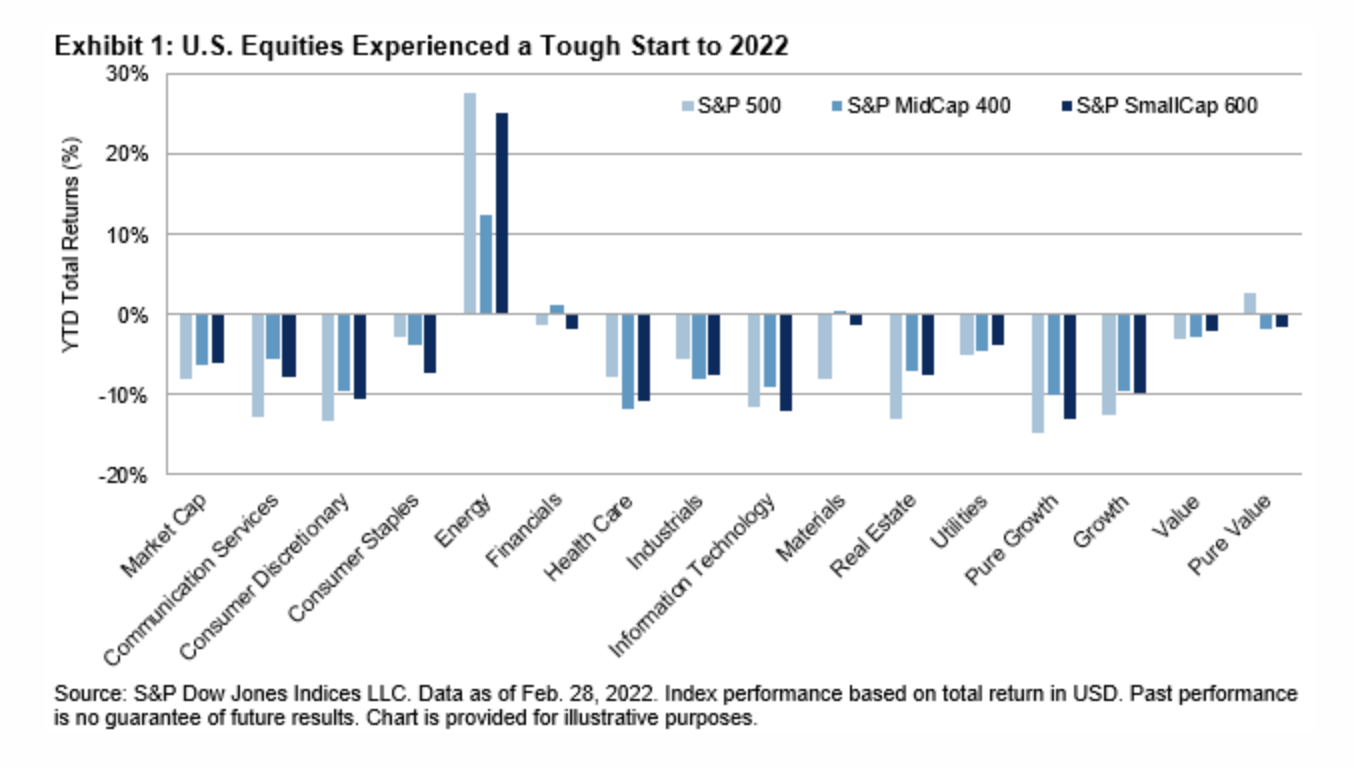
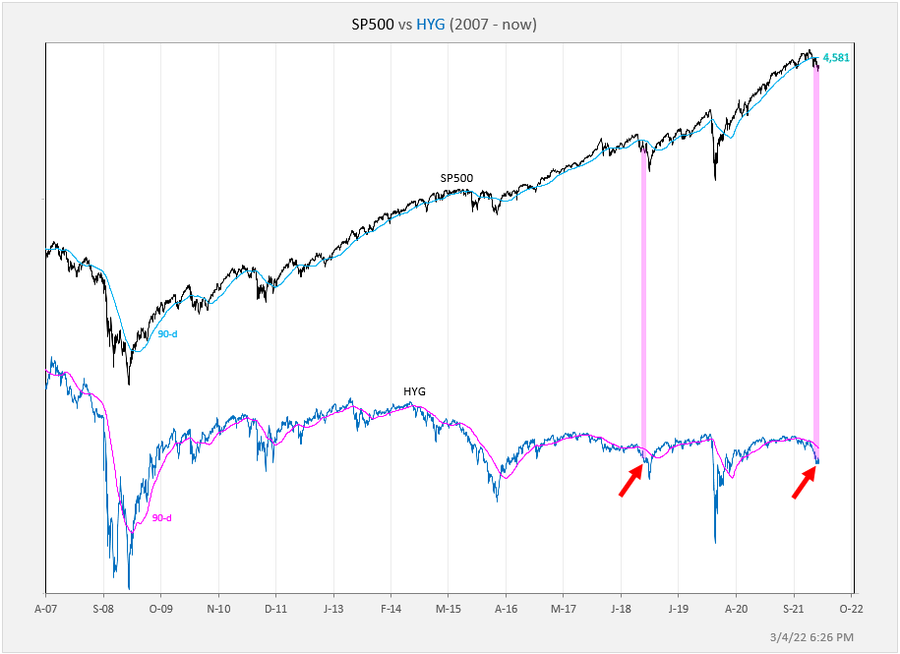
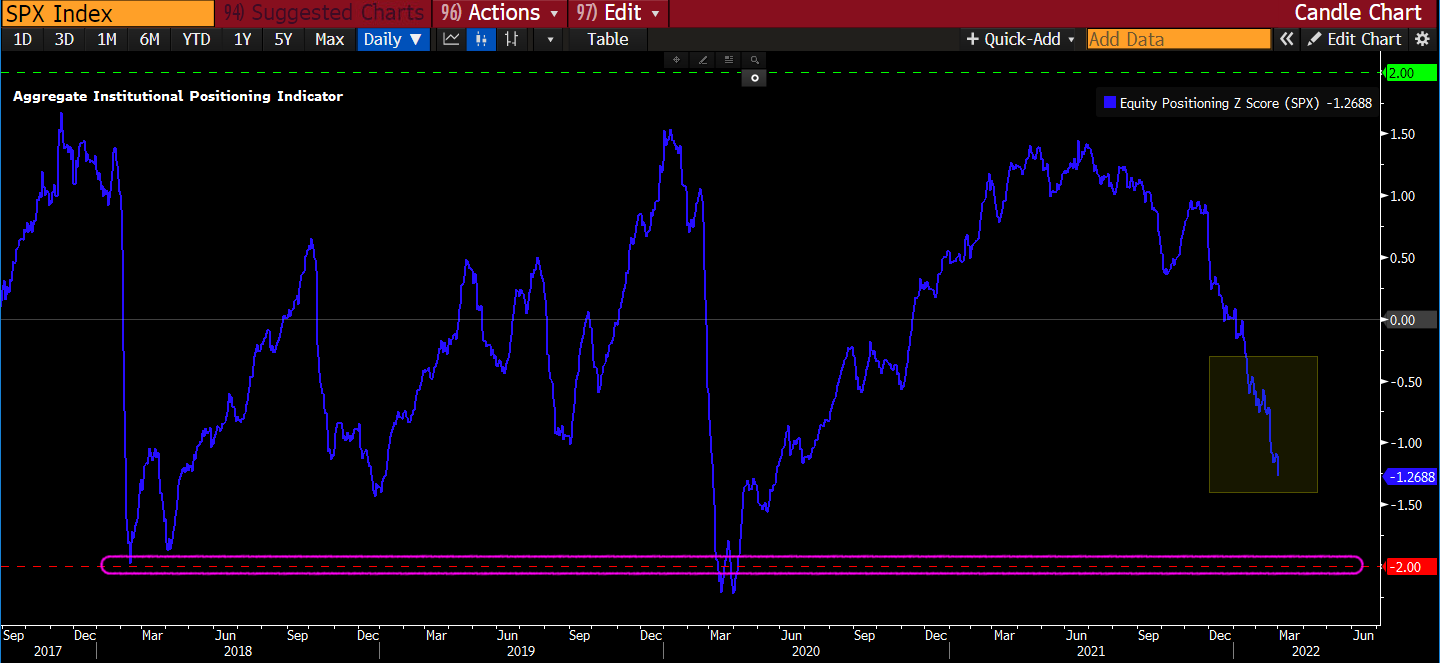
Positioning: Recall that the indexes are trading relatively strong, in comparison to constituents, especially those that are smaller technology and growth companies.
Essentially, “we’re two-thirds of the way through a dot-com type collapse,” explains Simplify Asset Management’s Mike Green.
“It’s just happened underneath the surface of the indices which is [that] … dynamic of passive flows supporting the largest stocks within the index, whereas the smaller stocks can be influenced to a greater extent by the behavior of discretionary managers.”
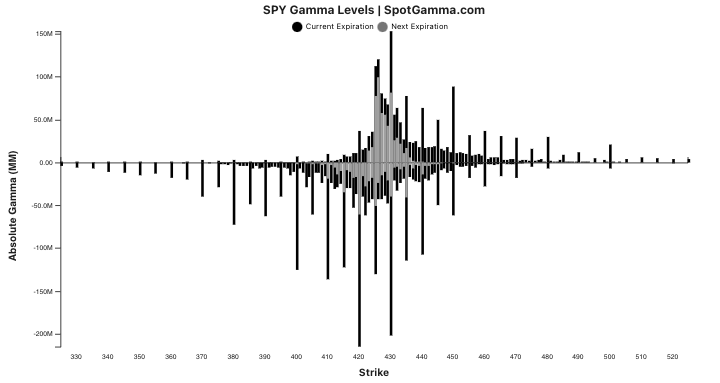
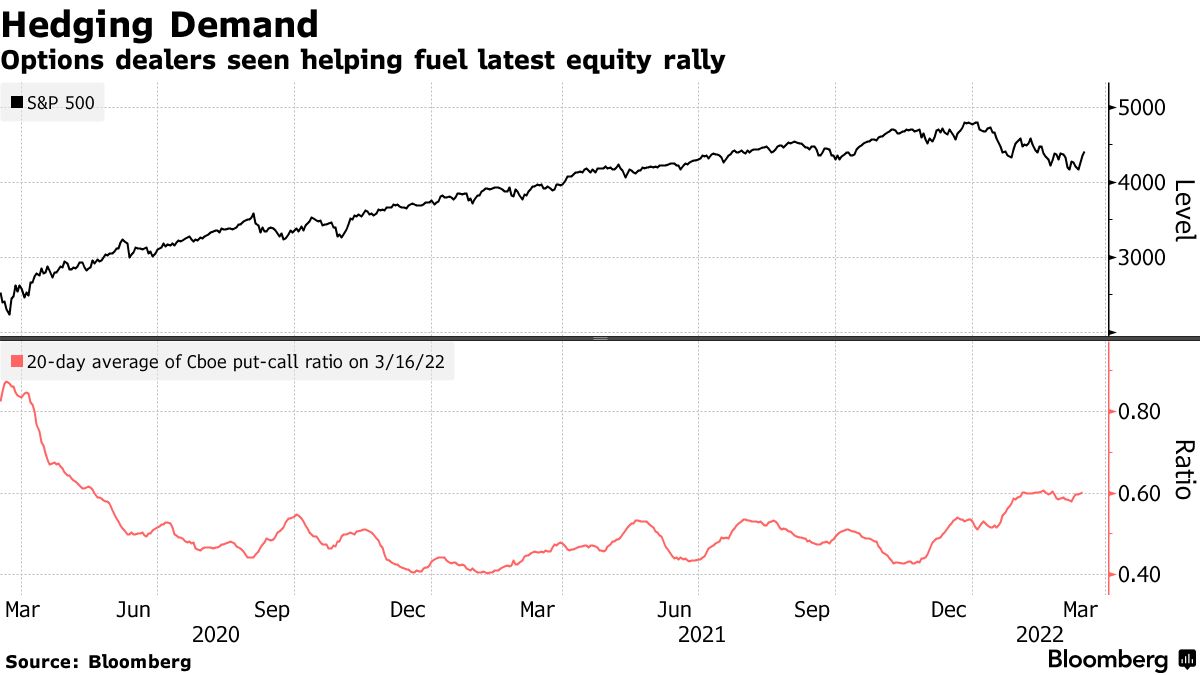
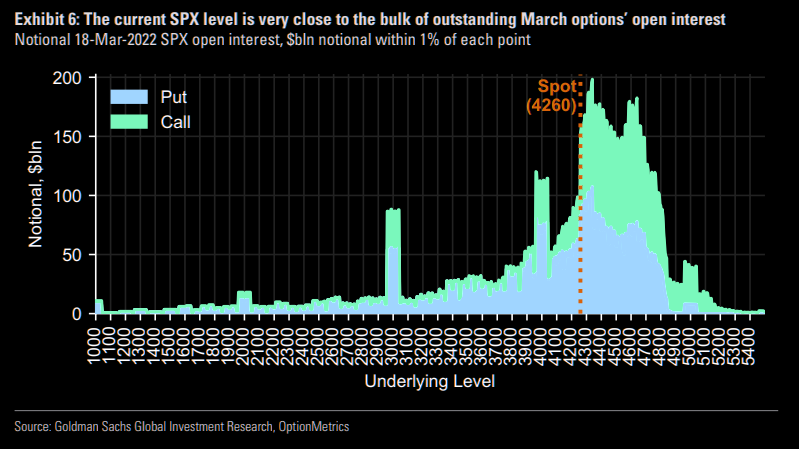
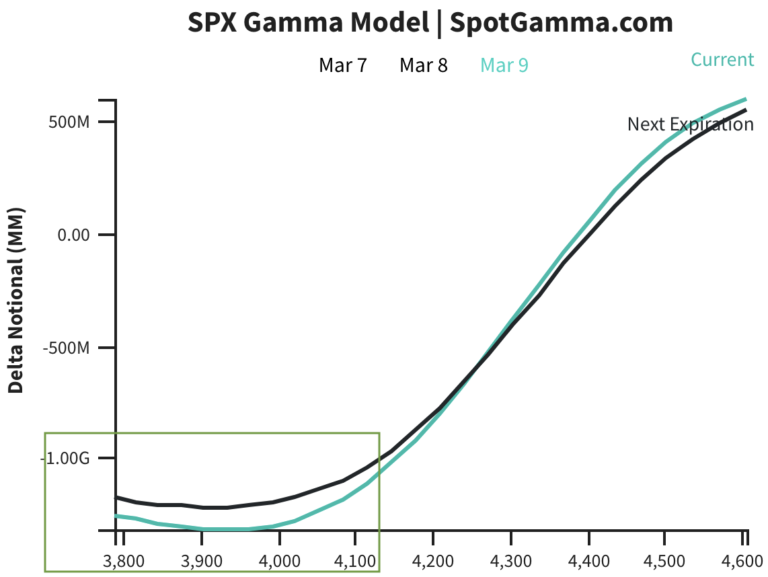
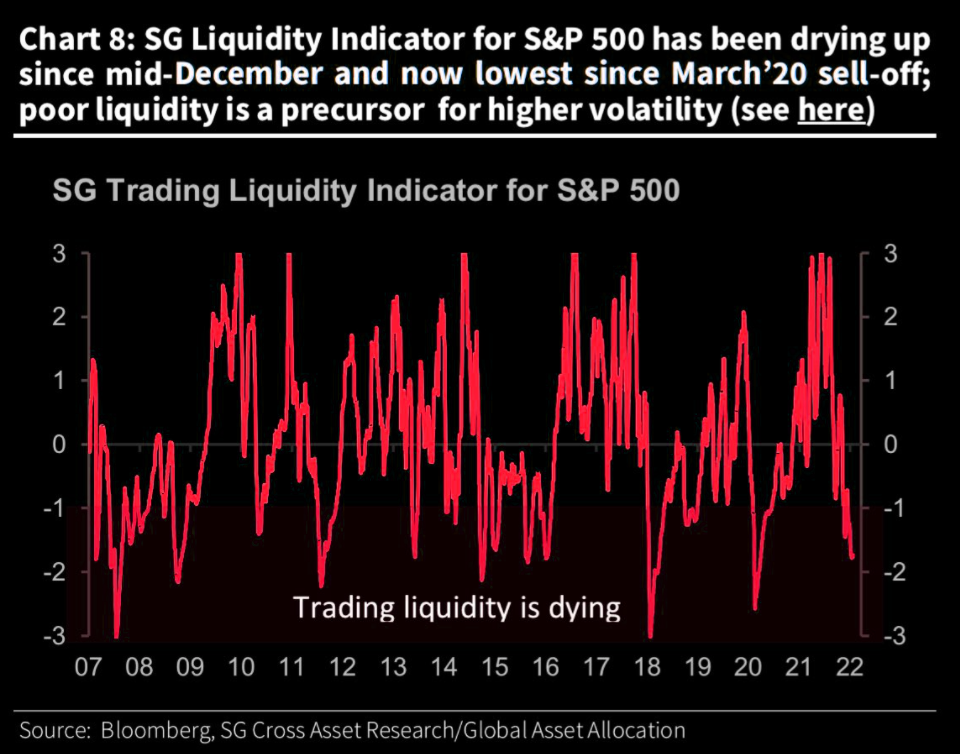
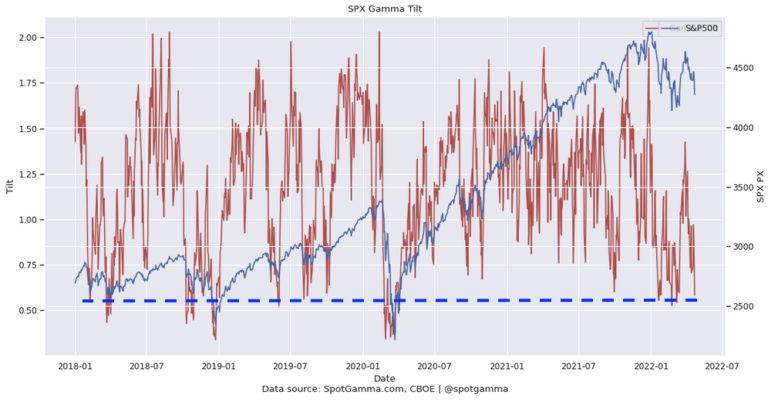
This liquidity supply, apart from passive flows, stems from index-level hedging pressures, also.
Here’s why, as borrowed from our April 27, 2022 commentary.
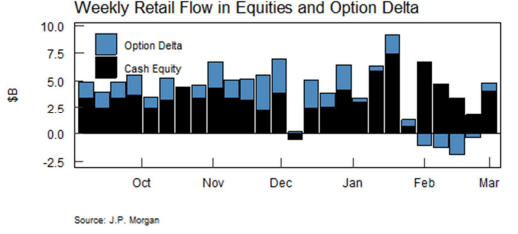
Participants are well-hedged and use weakness as an opportunity to buy into a less highly valued broader market.
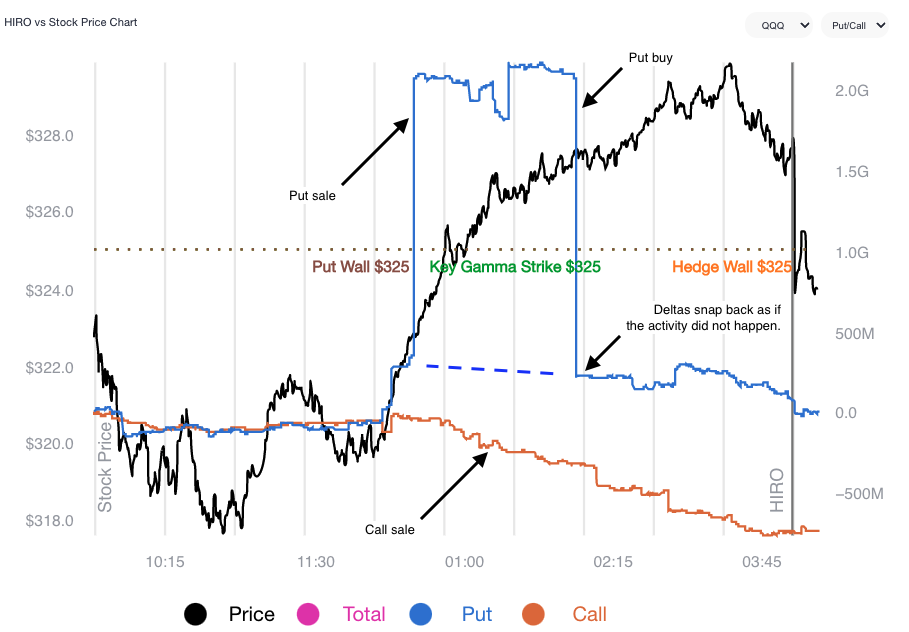
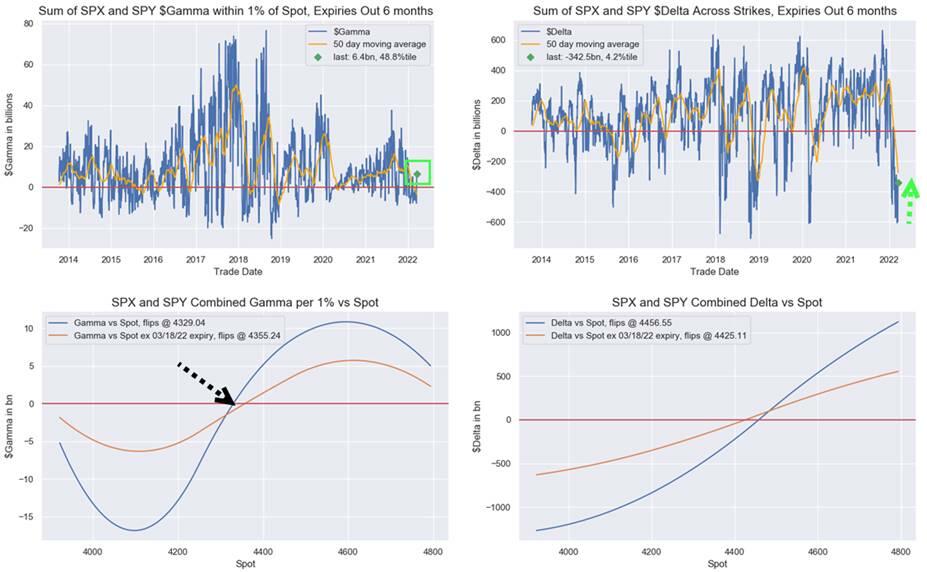
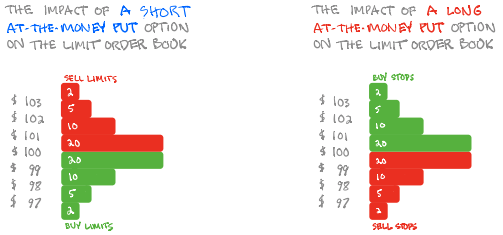
Well-hedged means that customers (i.e., you and I) own protection against long equity exposure. So, that could mean customers own puts and/or are short calls. One of the most dominant flows is the long put, short call.
Such trade offers customers positive, yet asymmetric (gamma), exposure to direction (delta). In other words, negative delta and positive gamma.
The counterparty has exposure to positive delta and negative gamma. If the underlyings trade lower and volatility rises, all else equal, the position will lose. To hedge against these losses, the counterparties will sell underlying into weakness.
If prices reverse and move higher, these counterparties will re-hedge and buy underlying.
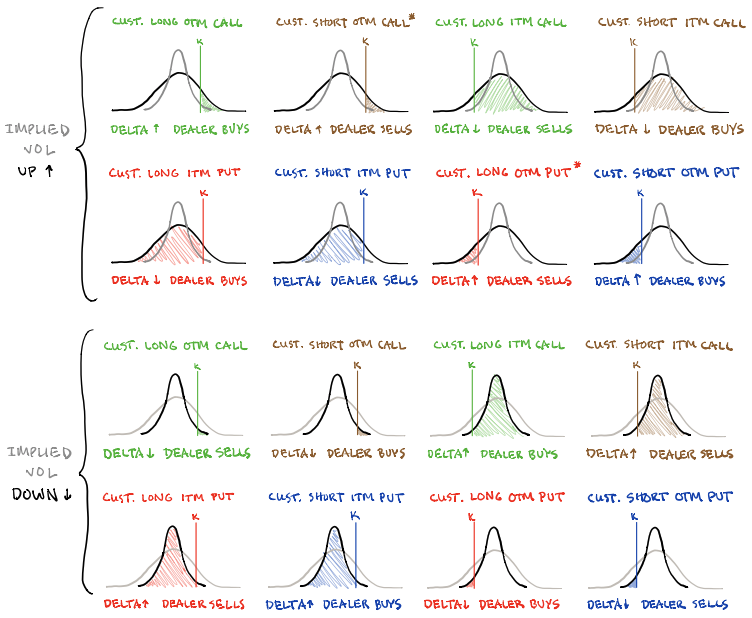
Normally, as seen over the bull run of 2020 and 2021, markets are in an uptrend and there’s a strong supply of volatility. Often, customers sell more calls than puts and, in an uptrend, those calls solicit more active hedging than the put options.
Recall that the customer is short the call. That means the counterparty is long the call (a positive delta and gamma trade) and will make money if prices rise, all else equal.
The hedging of this particular exposure (i.e., sell strength, buy weakness), in an uptrend, occurs slower (i.e., counterparts will allow their profits to run), and that’s what can help the market sustain lower volatility trends for longer periods.
When prices reverse and underlyings trade lower, put options solicit increased hedging activity. Given the nature of counterparty exposure to those puts, that hedging happens quickly and can take from market liquidity as to volatility (i.e., buy strength, sell weakness).
So, what now?
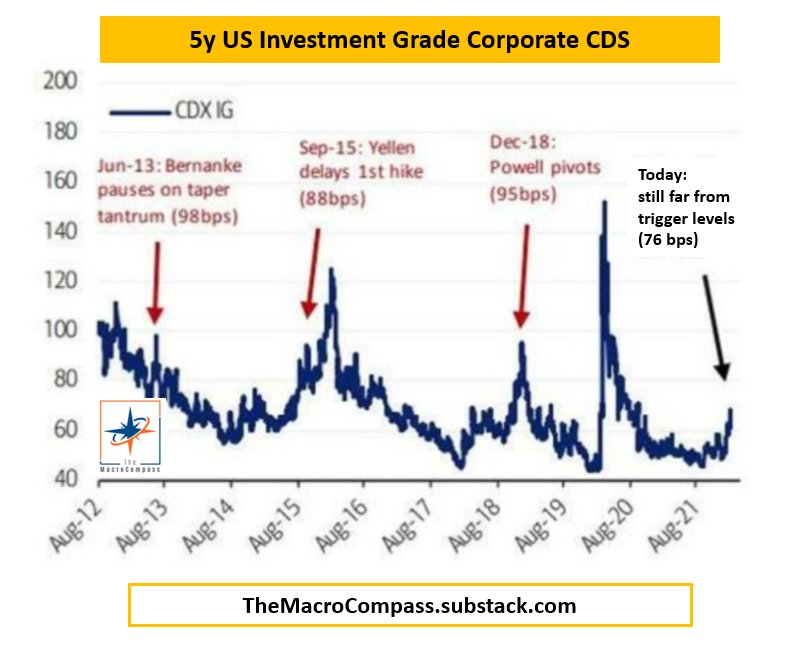
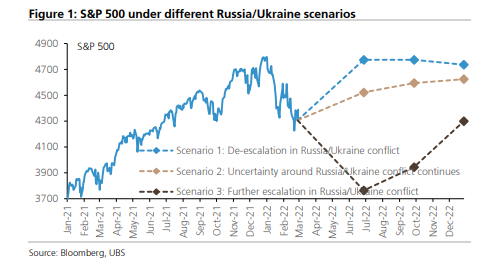
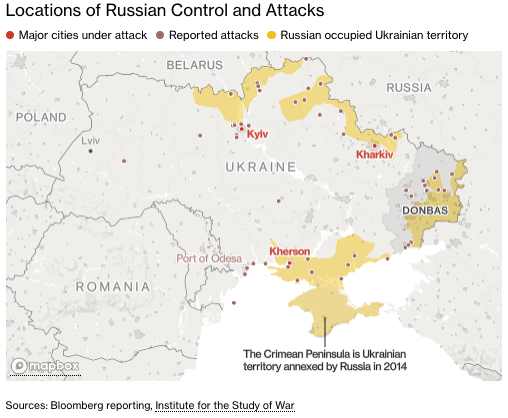
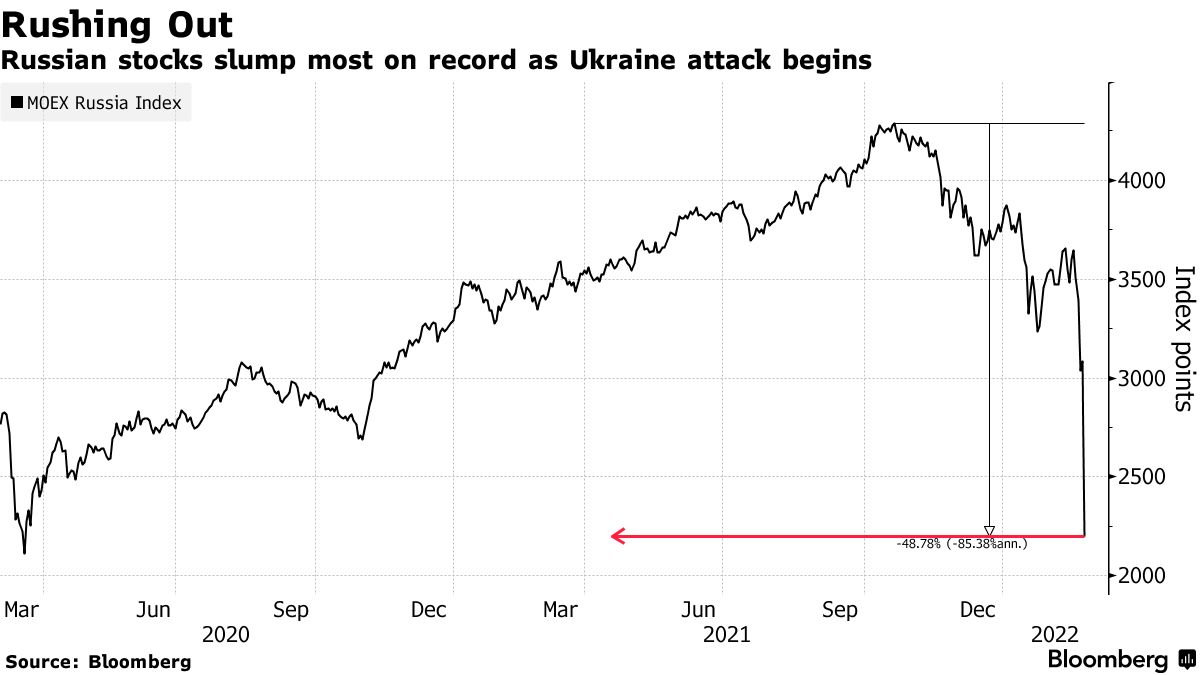
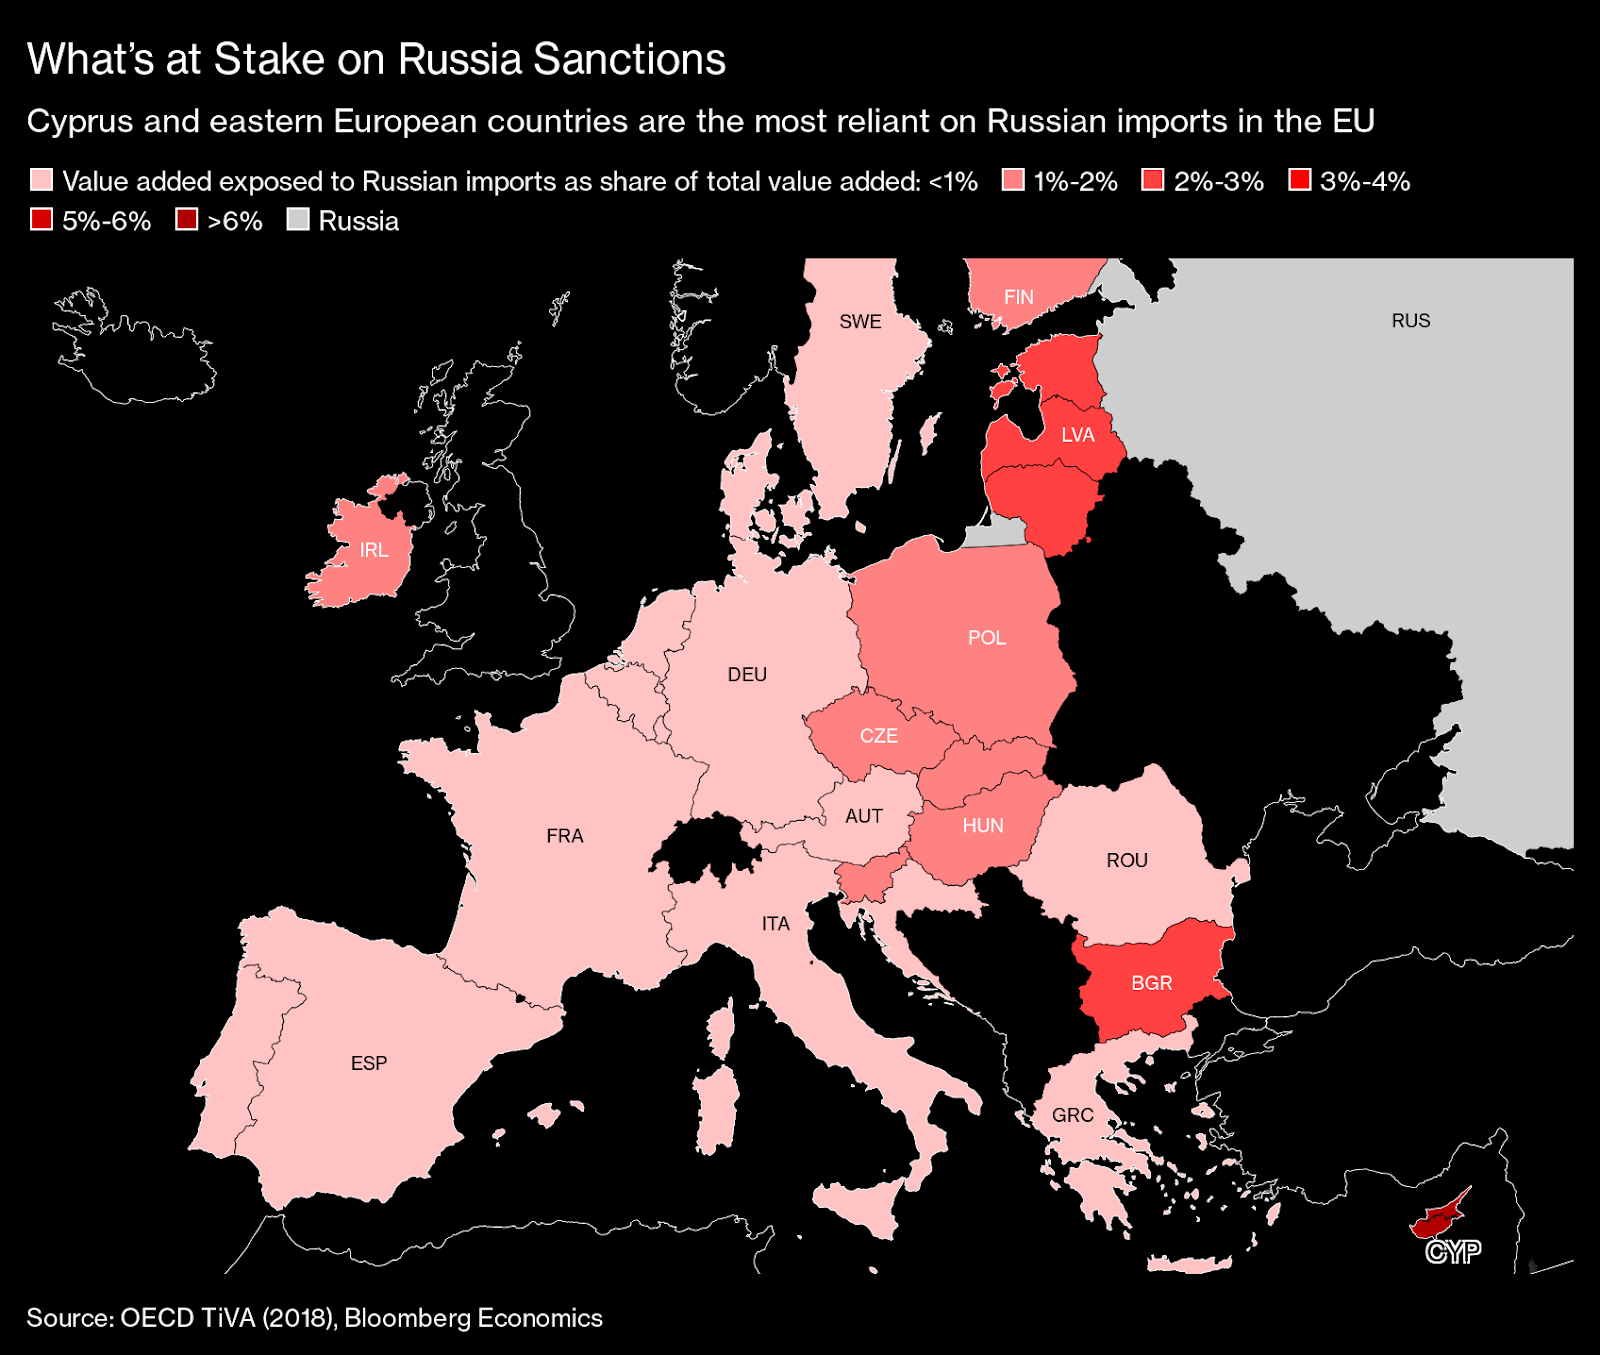
Participants are most concerned (and hedging against) unforeseen monetary policy action and economic chokepoints like a potential Russian default.
Investors will get clarity on some of these issues in the coming sessions.
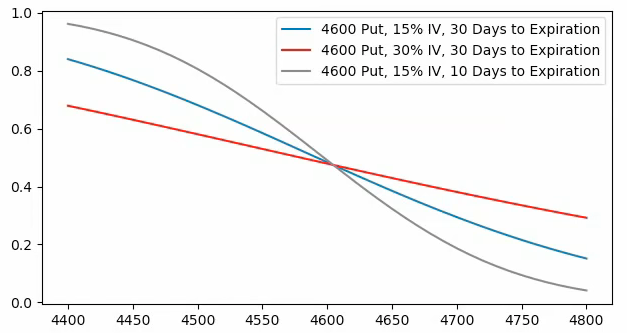
Barring a worst-case scenario, if markets do not perform to the downside (i.e., do not trade lower), those highly-priced (often very short-dated) bets on direction will quickly decay, and hedging flows with respect to time and volatility may bolster sharp rallies.
Whether those price rises kick off a sustained reversal depends on what the fundamental situation is, then.
Presently, the largest index constituents are starting to succumb to worsening fundamentals and that will, ultimately, feed into the indexes which are pinned due to passive and hedging flows.
In other words, fundamentals will trump this talk of positioning (i.e., it is only in the short-term does this positioning we’ve talked about have greater implications).
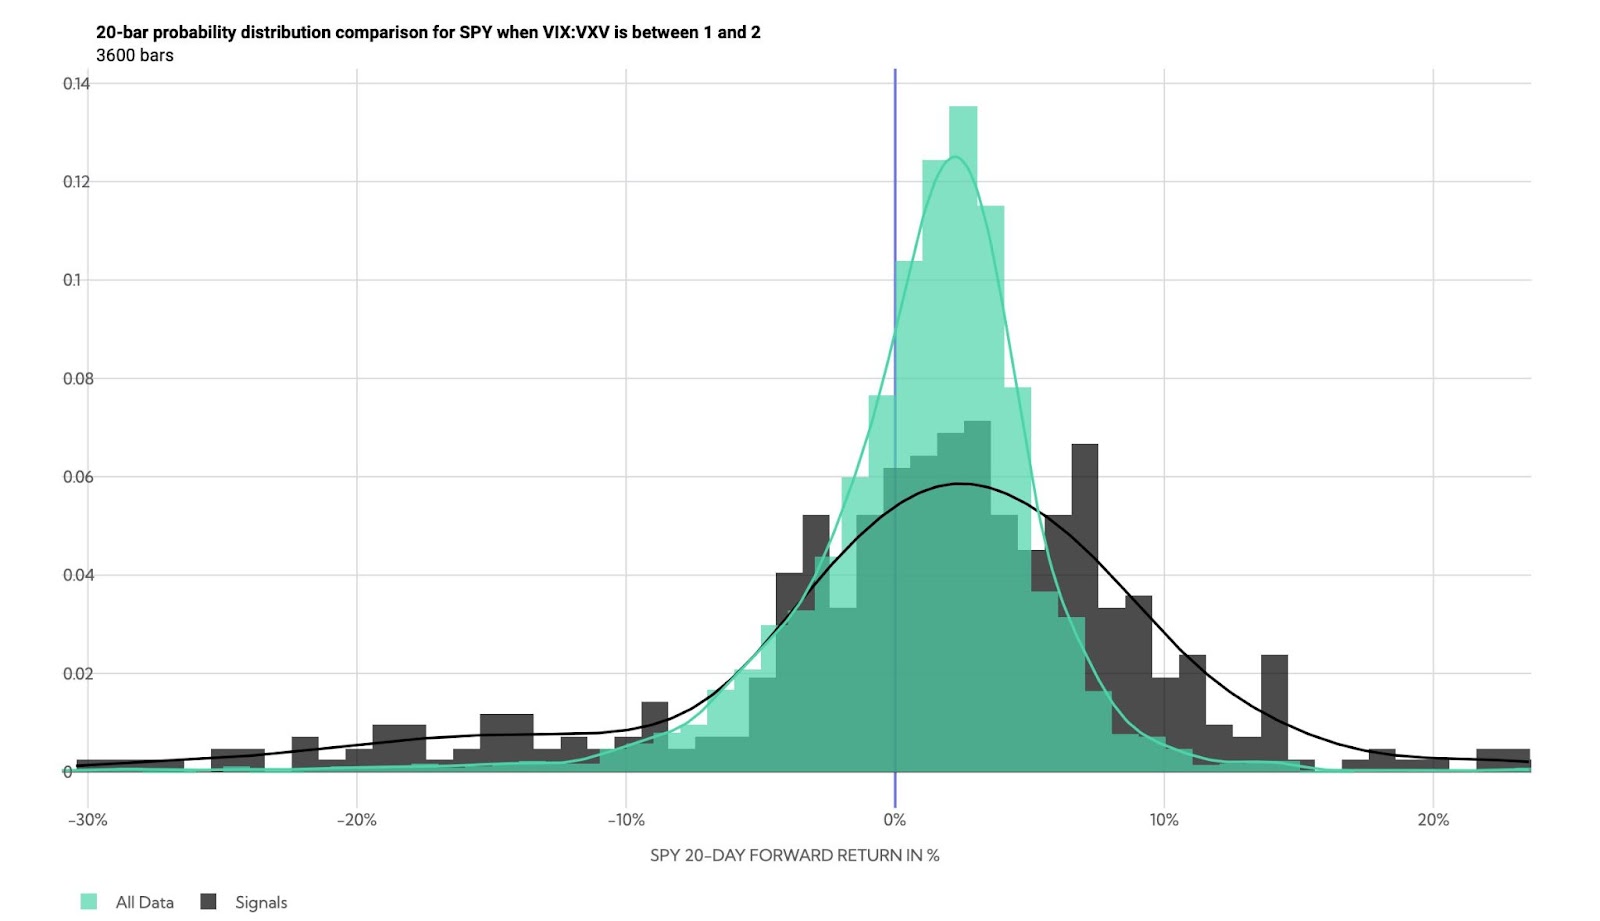
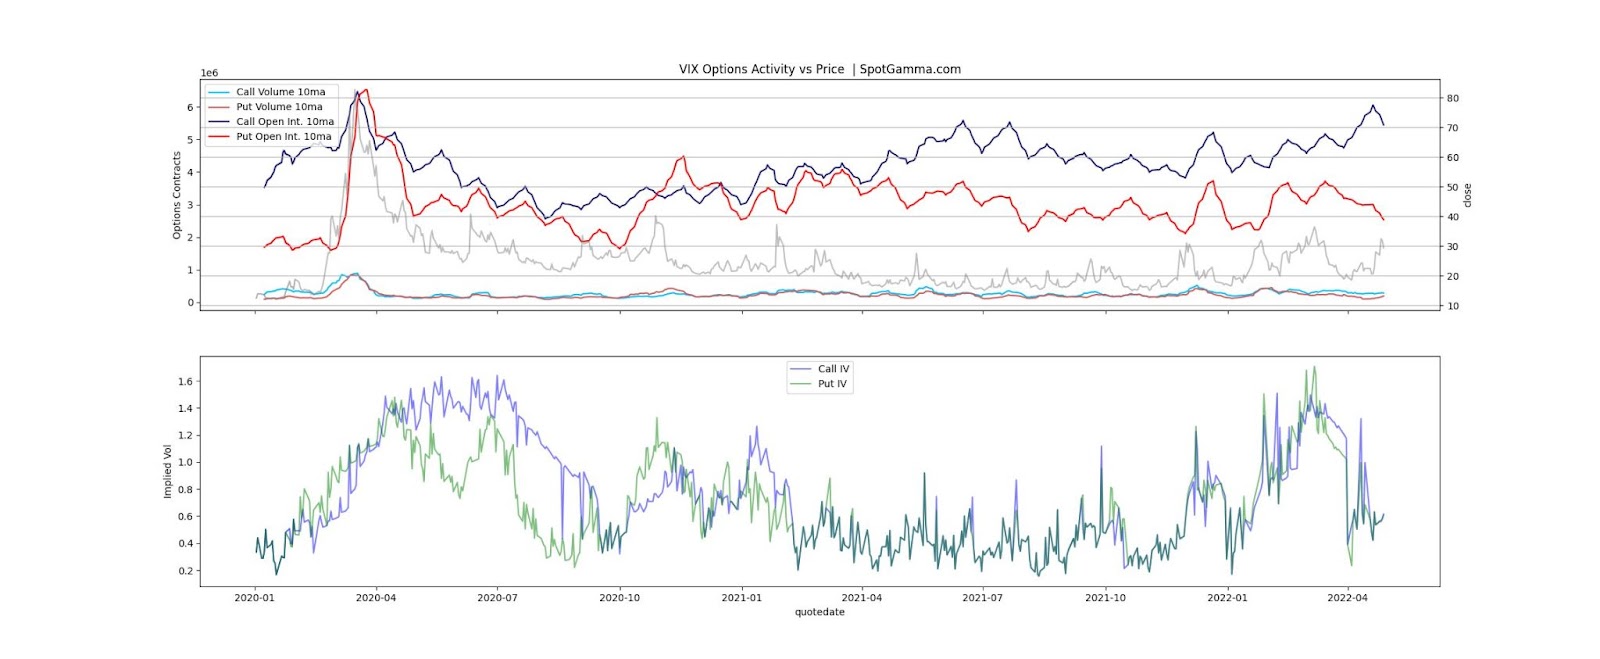
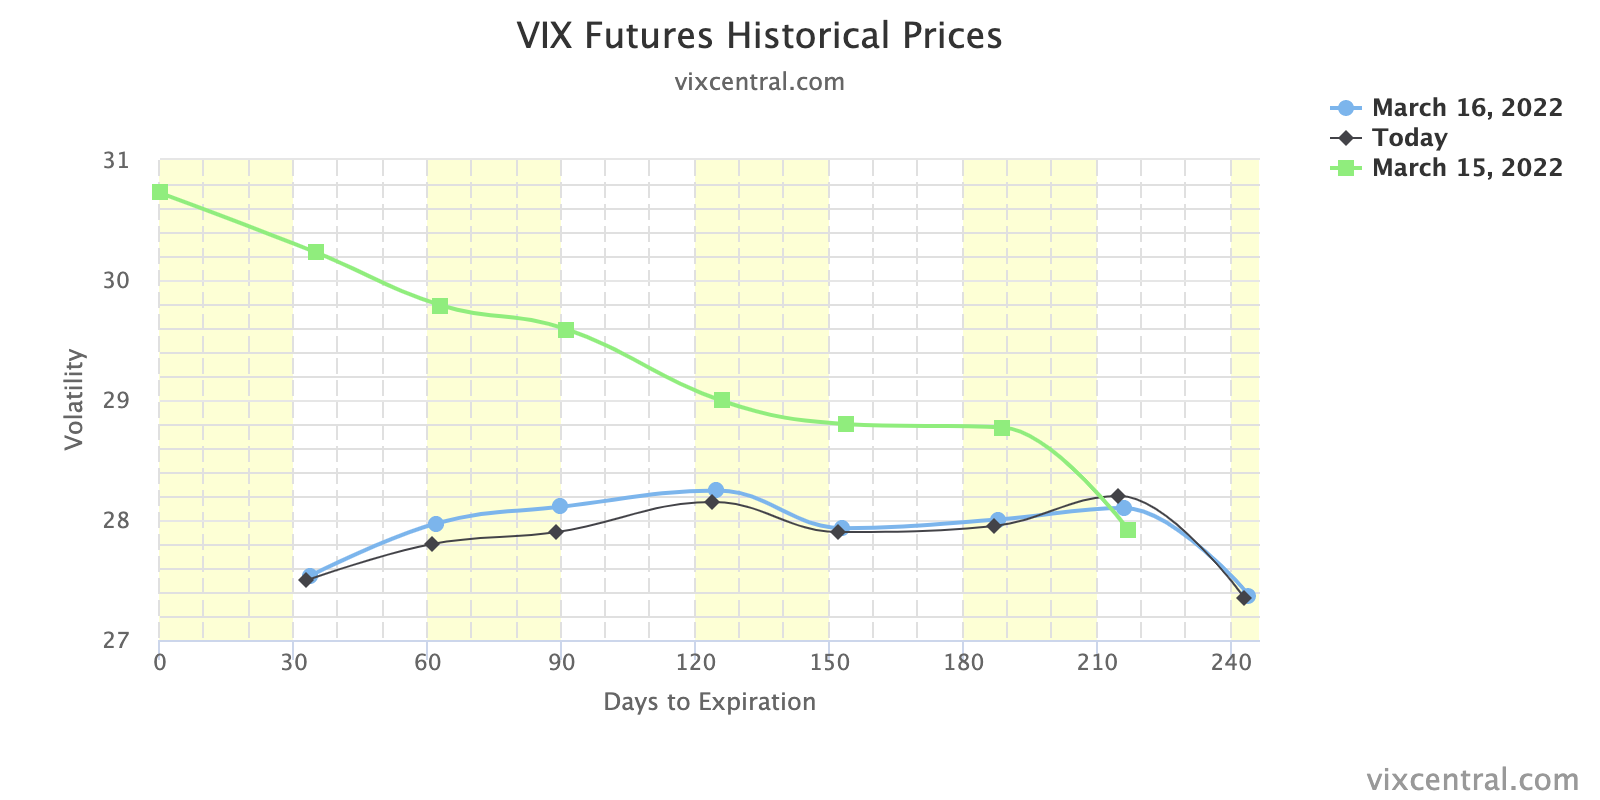
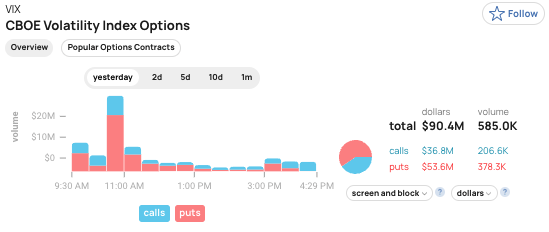
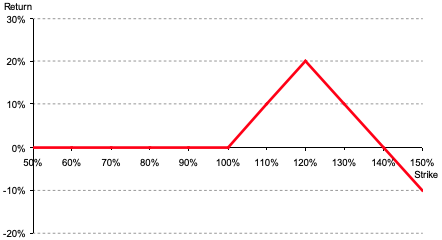
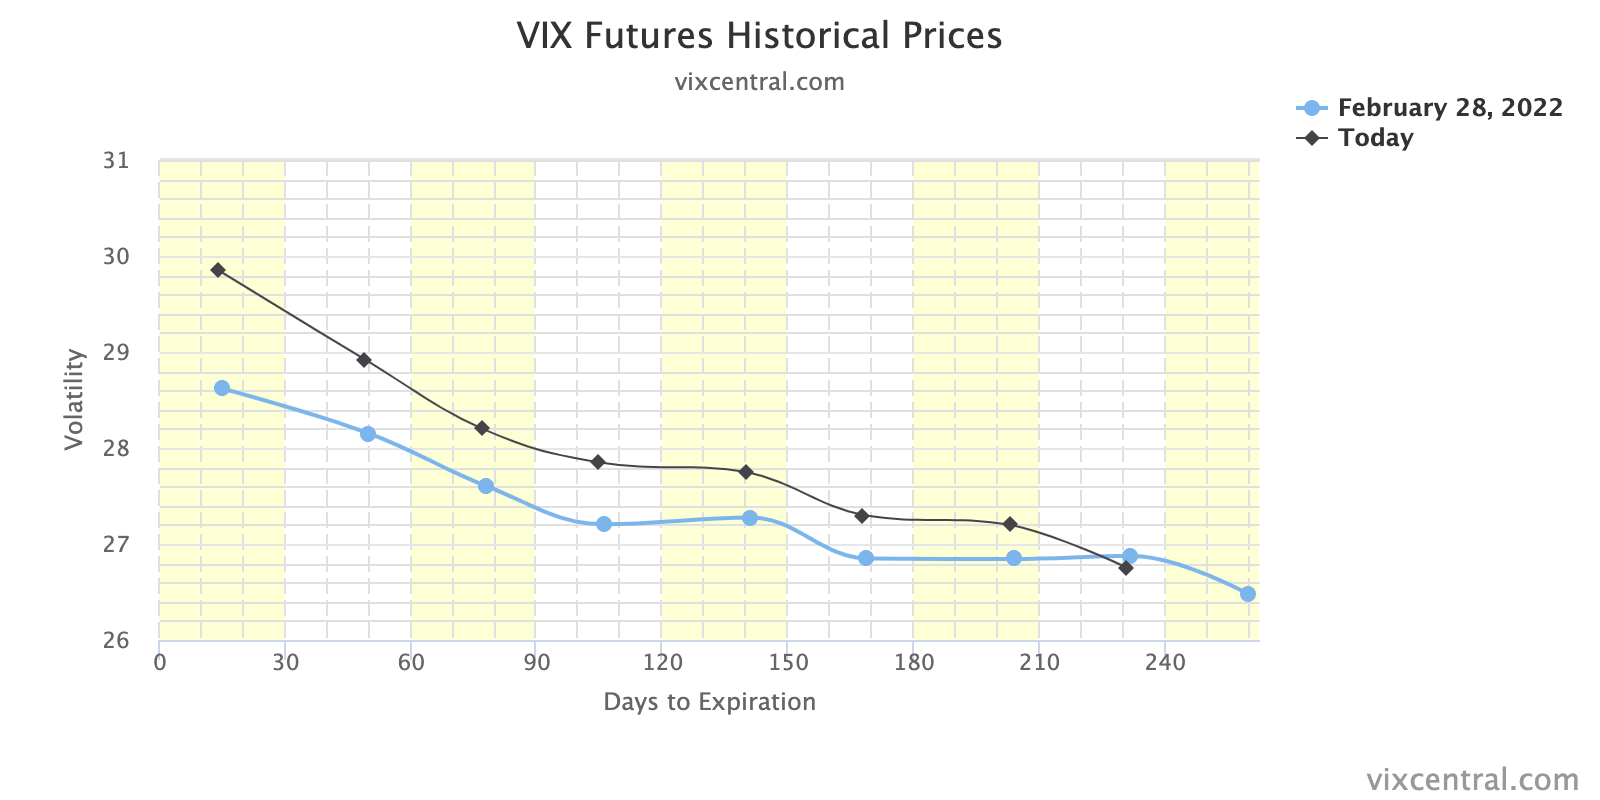
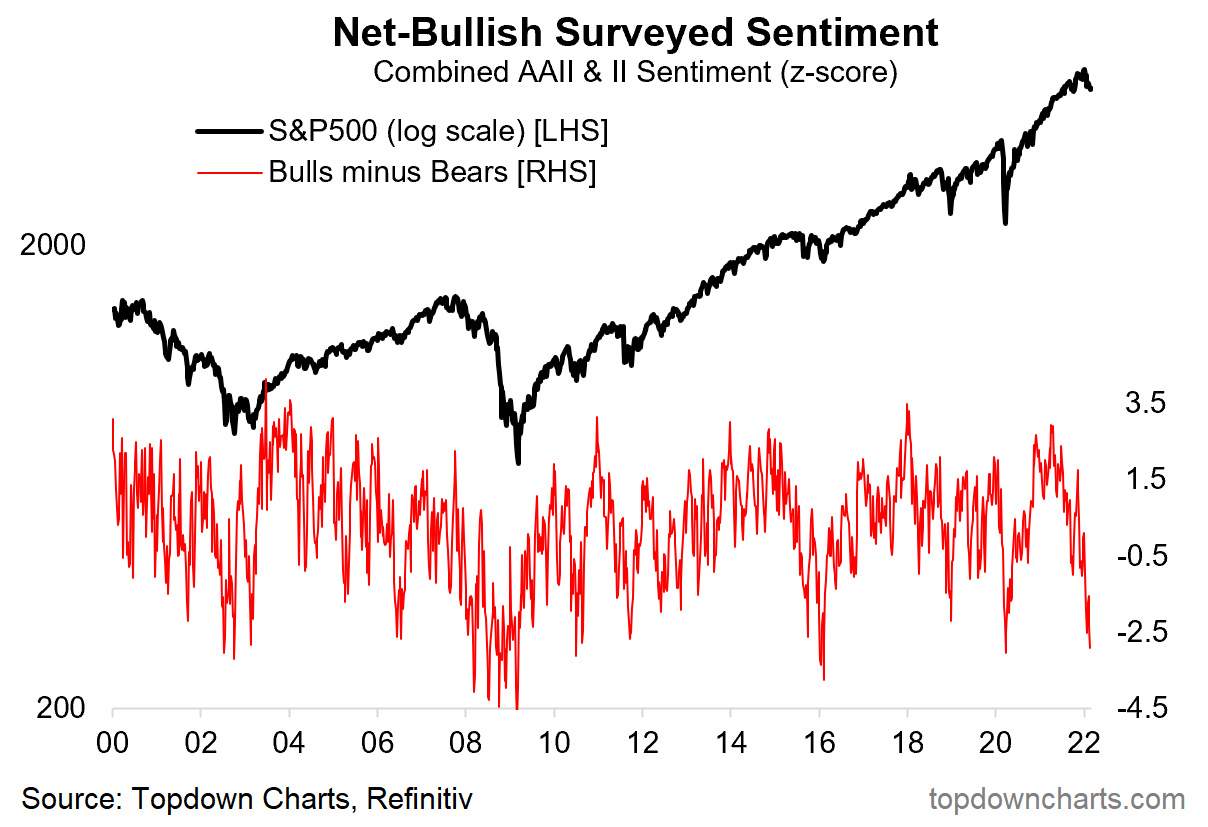
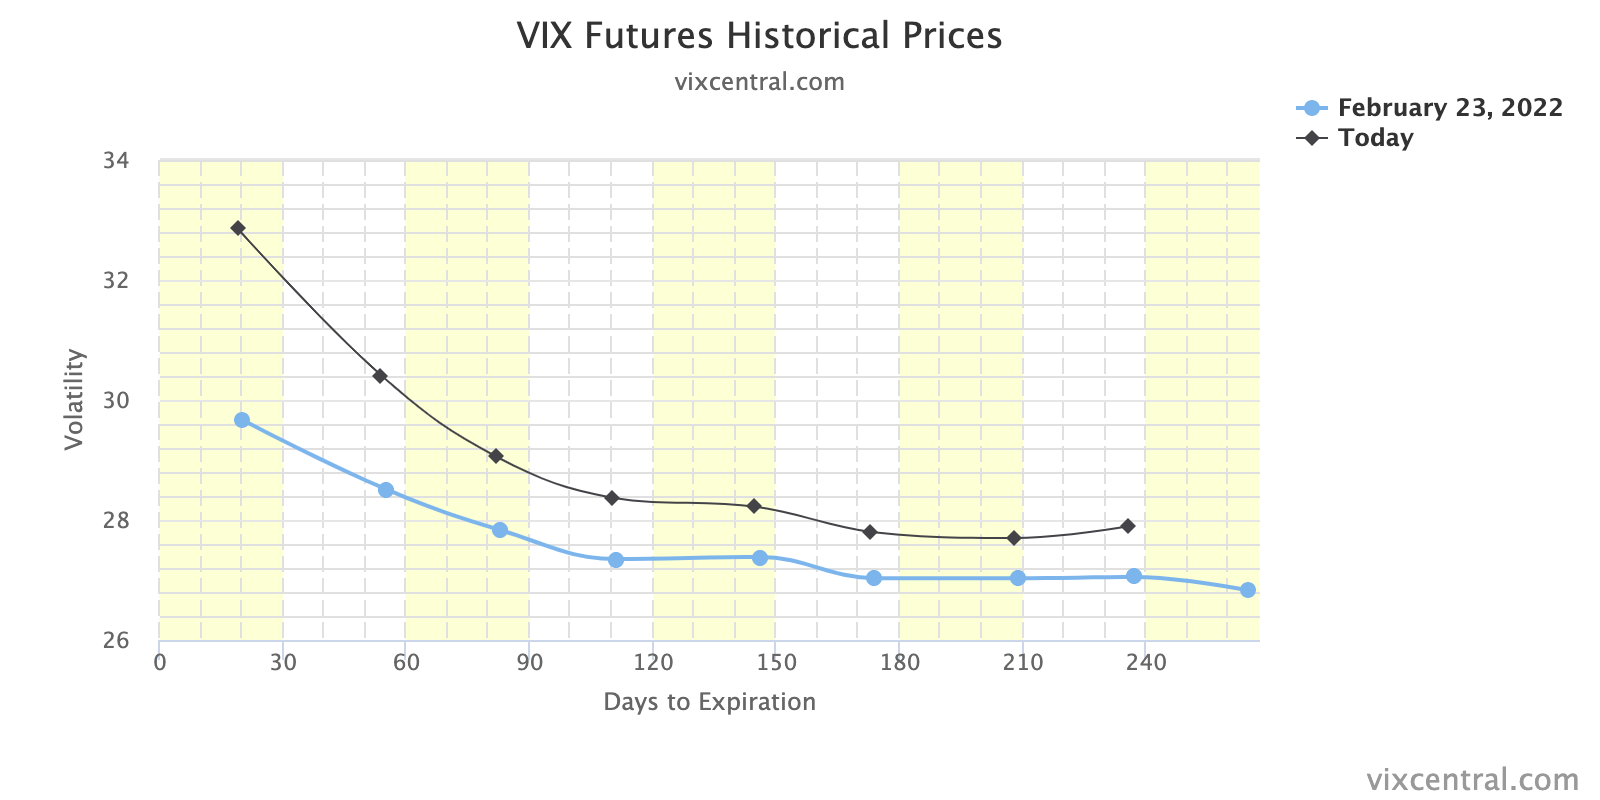
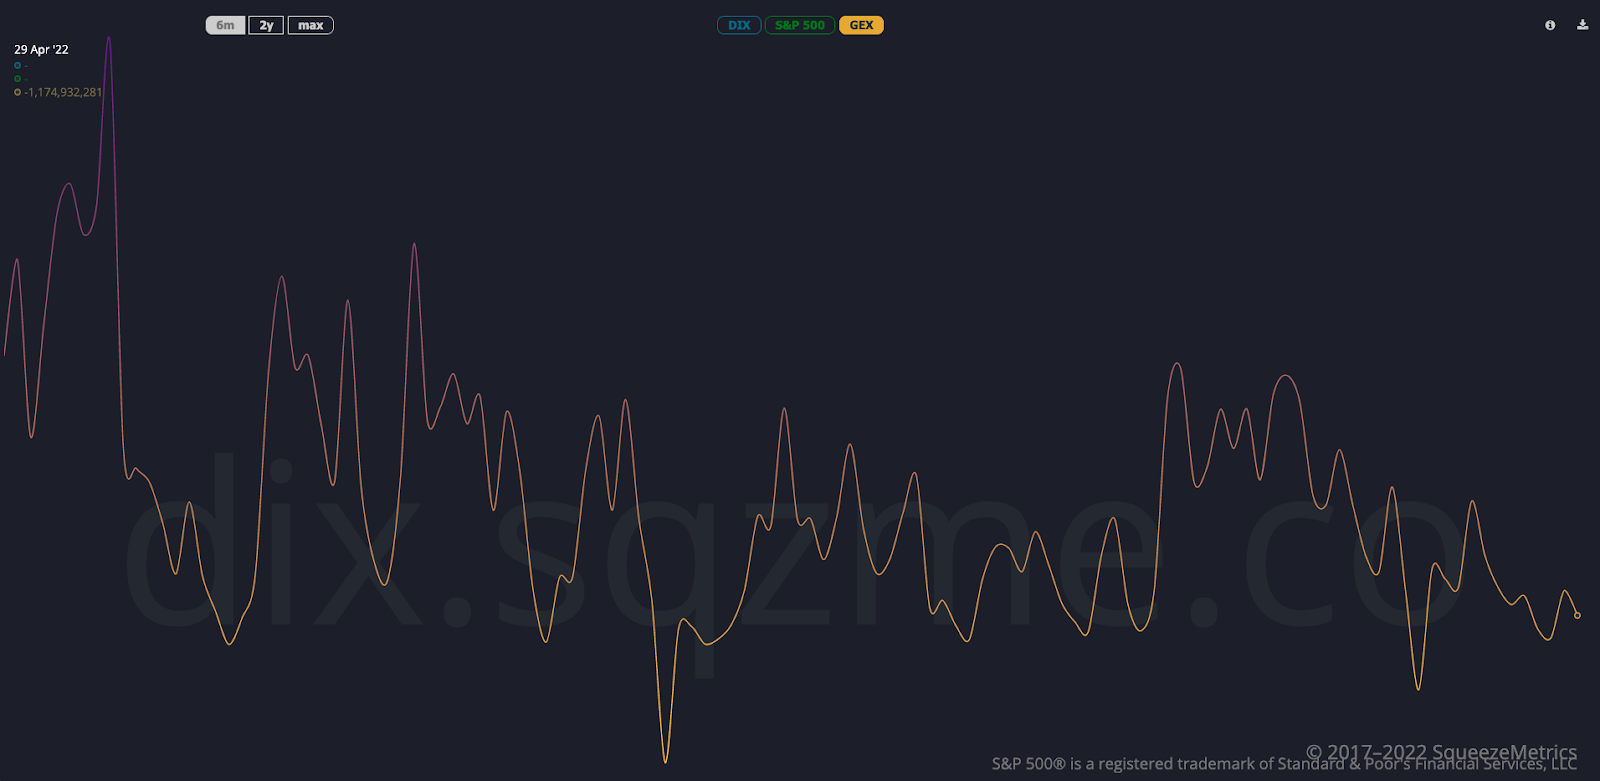
Consideration: The returns distribution, based on implied volatility metrics alone, is skewed positive (though there are some large negative outliers pursuant to The Ambrus Group’s Kris Sidial recent explanation that despite negative sentiment, “nobody is truly scared” and “Fixed strike vols continue to underperform, along with the lack of concern in the VX term structure”).
Caution.
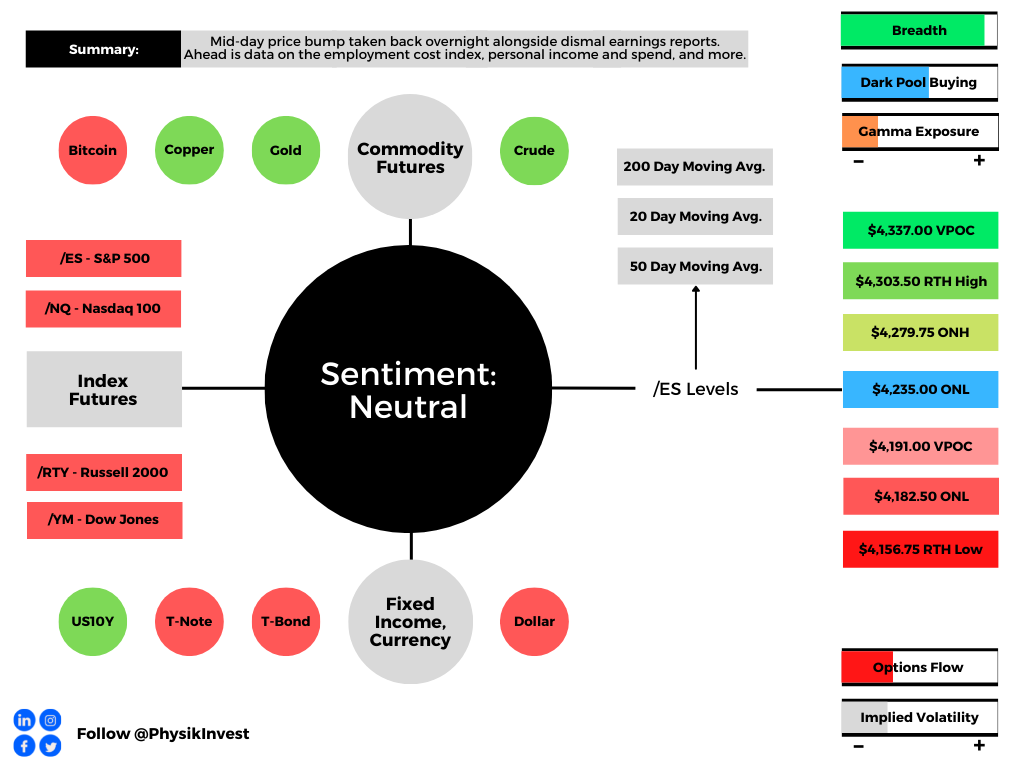
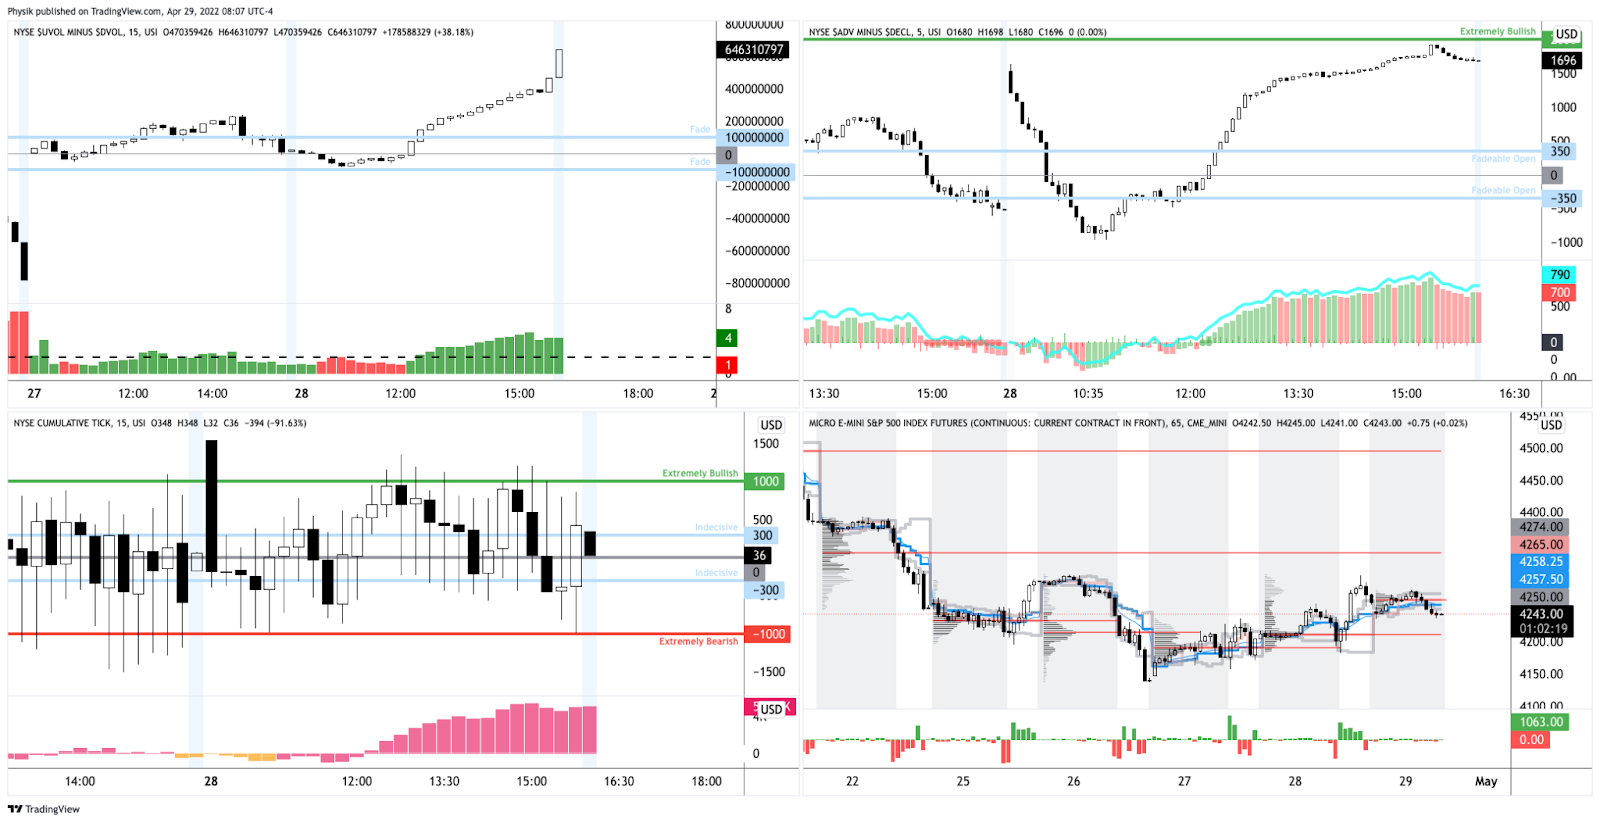
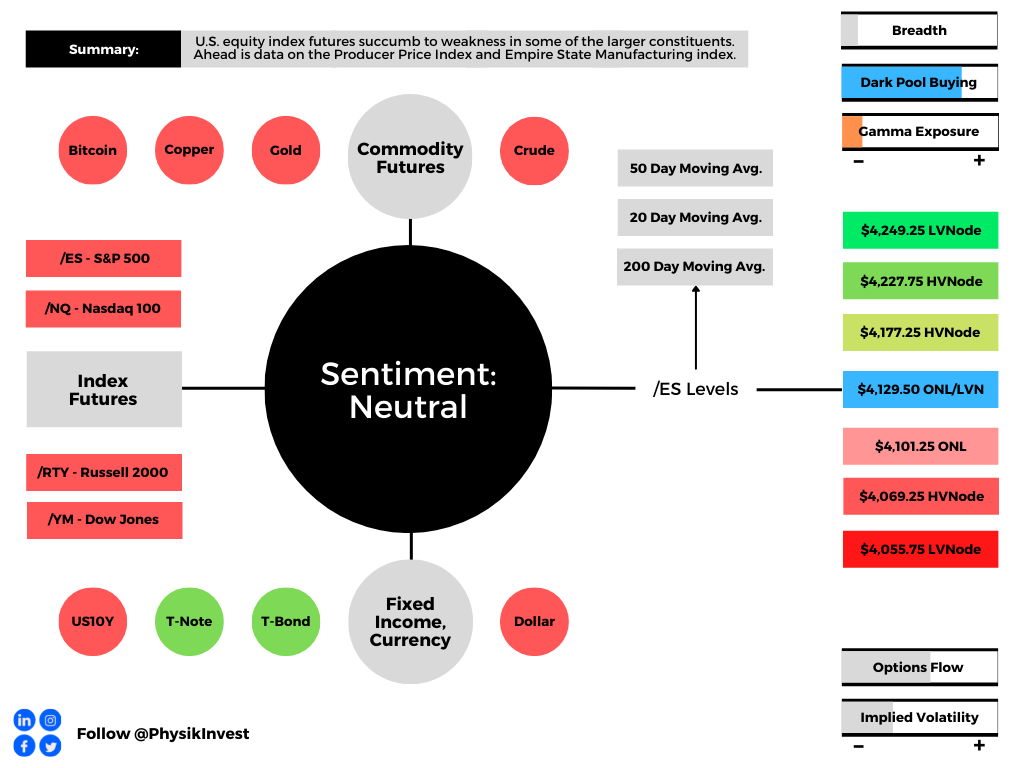
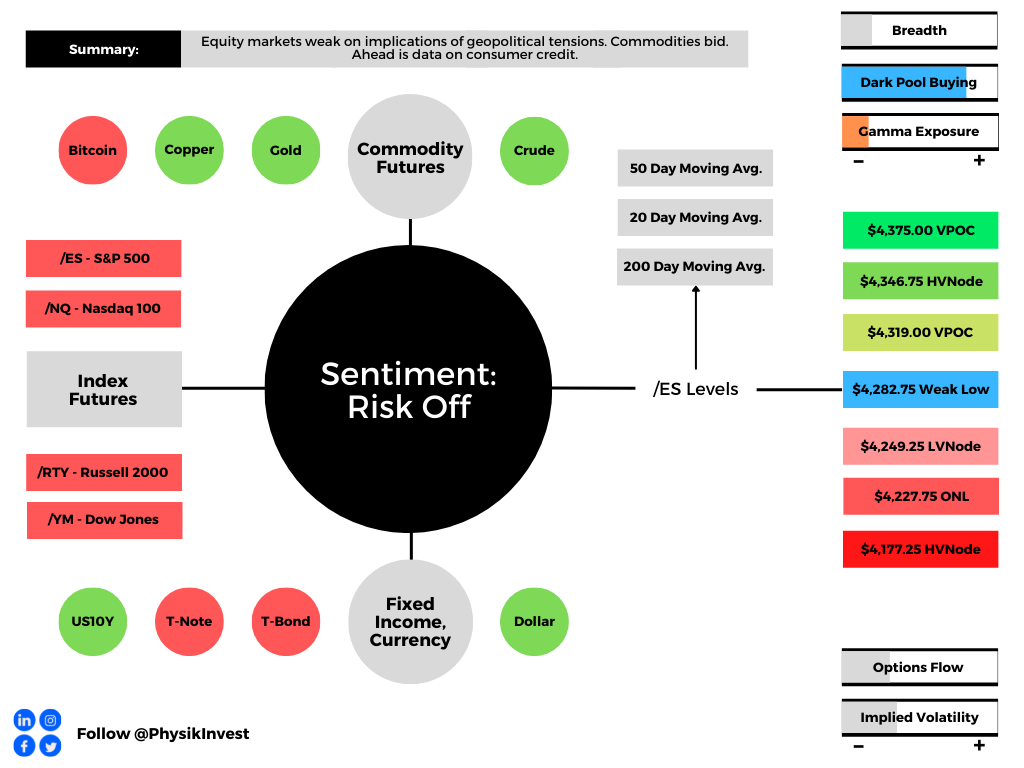
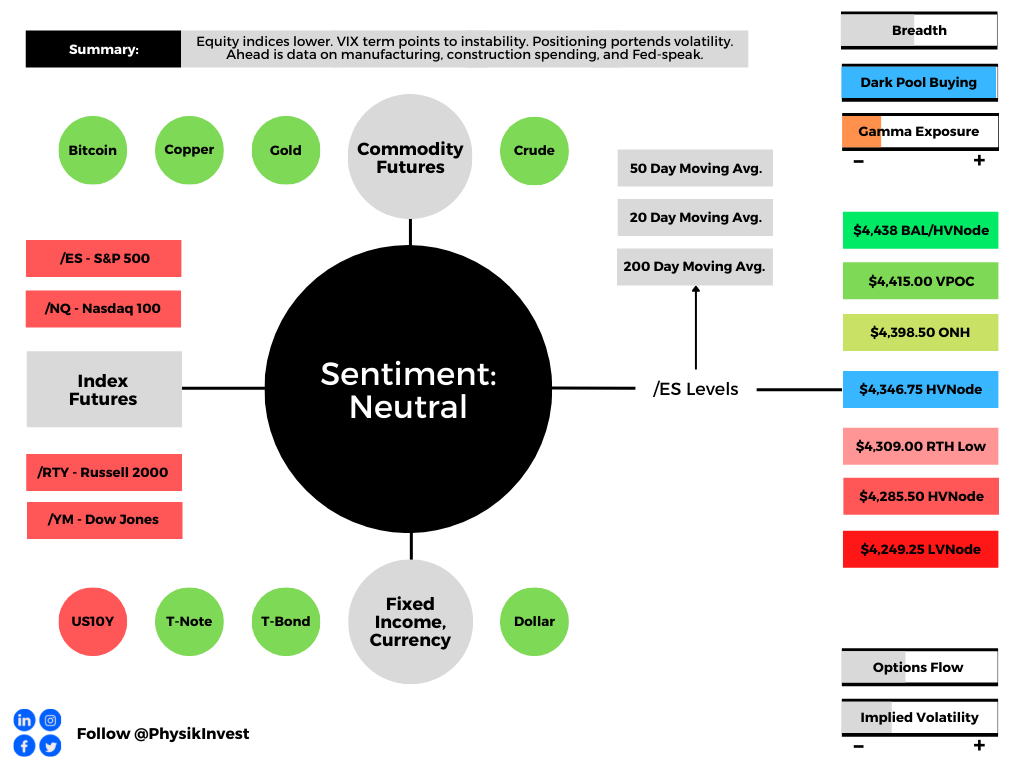
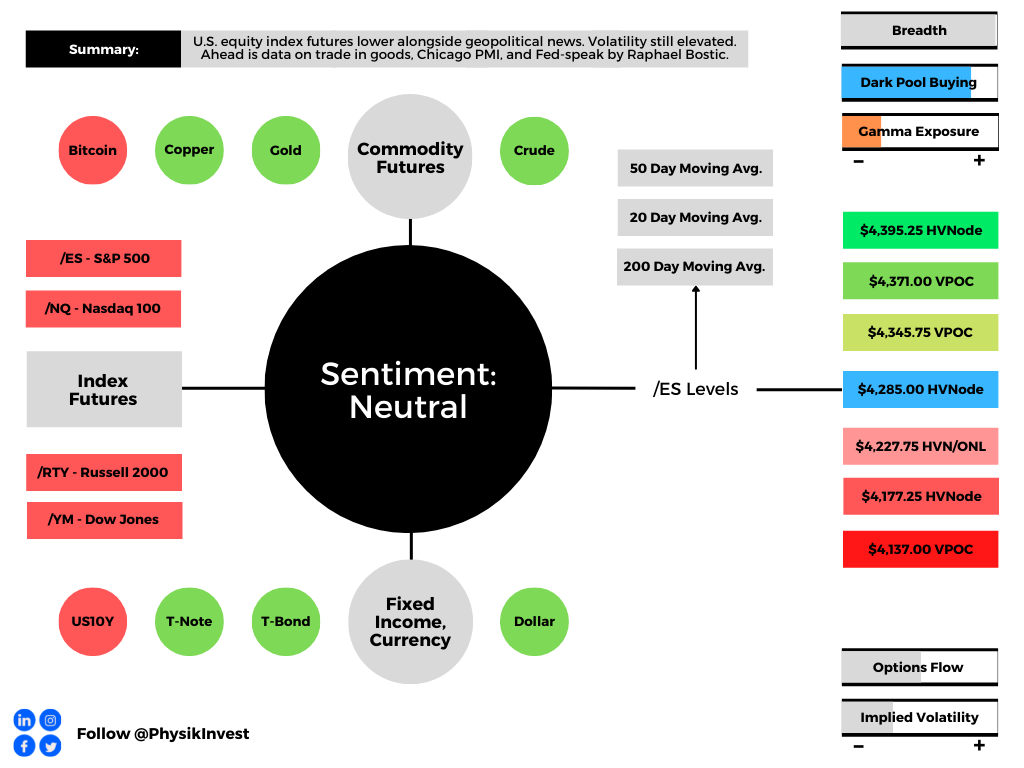
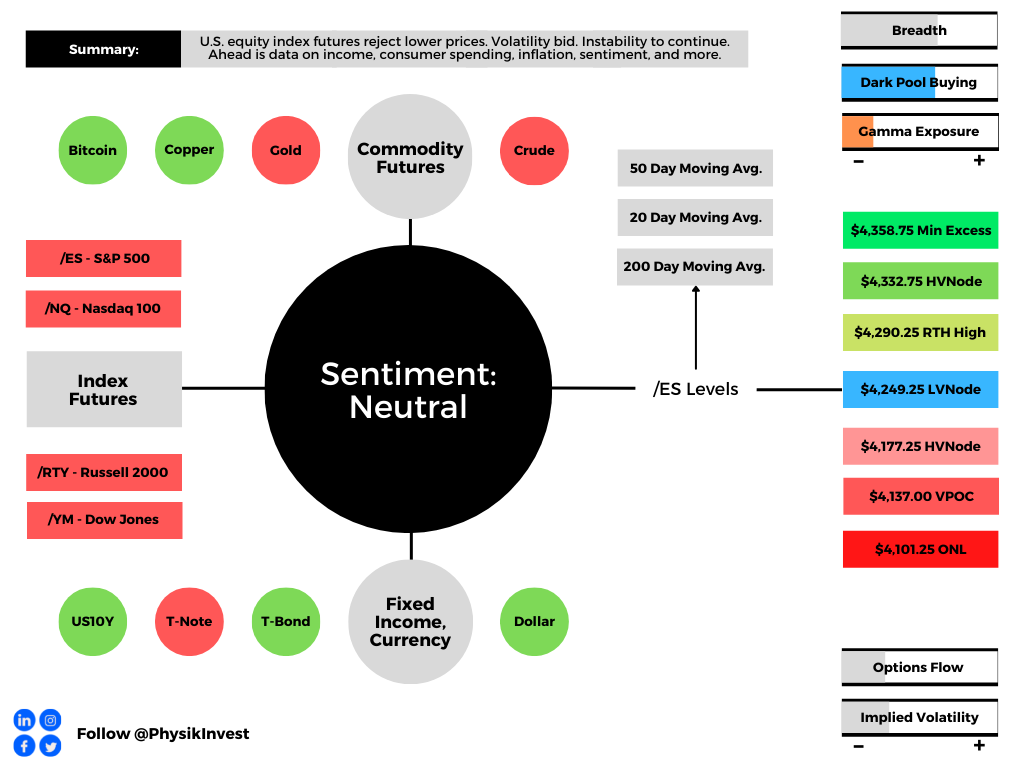
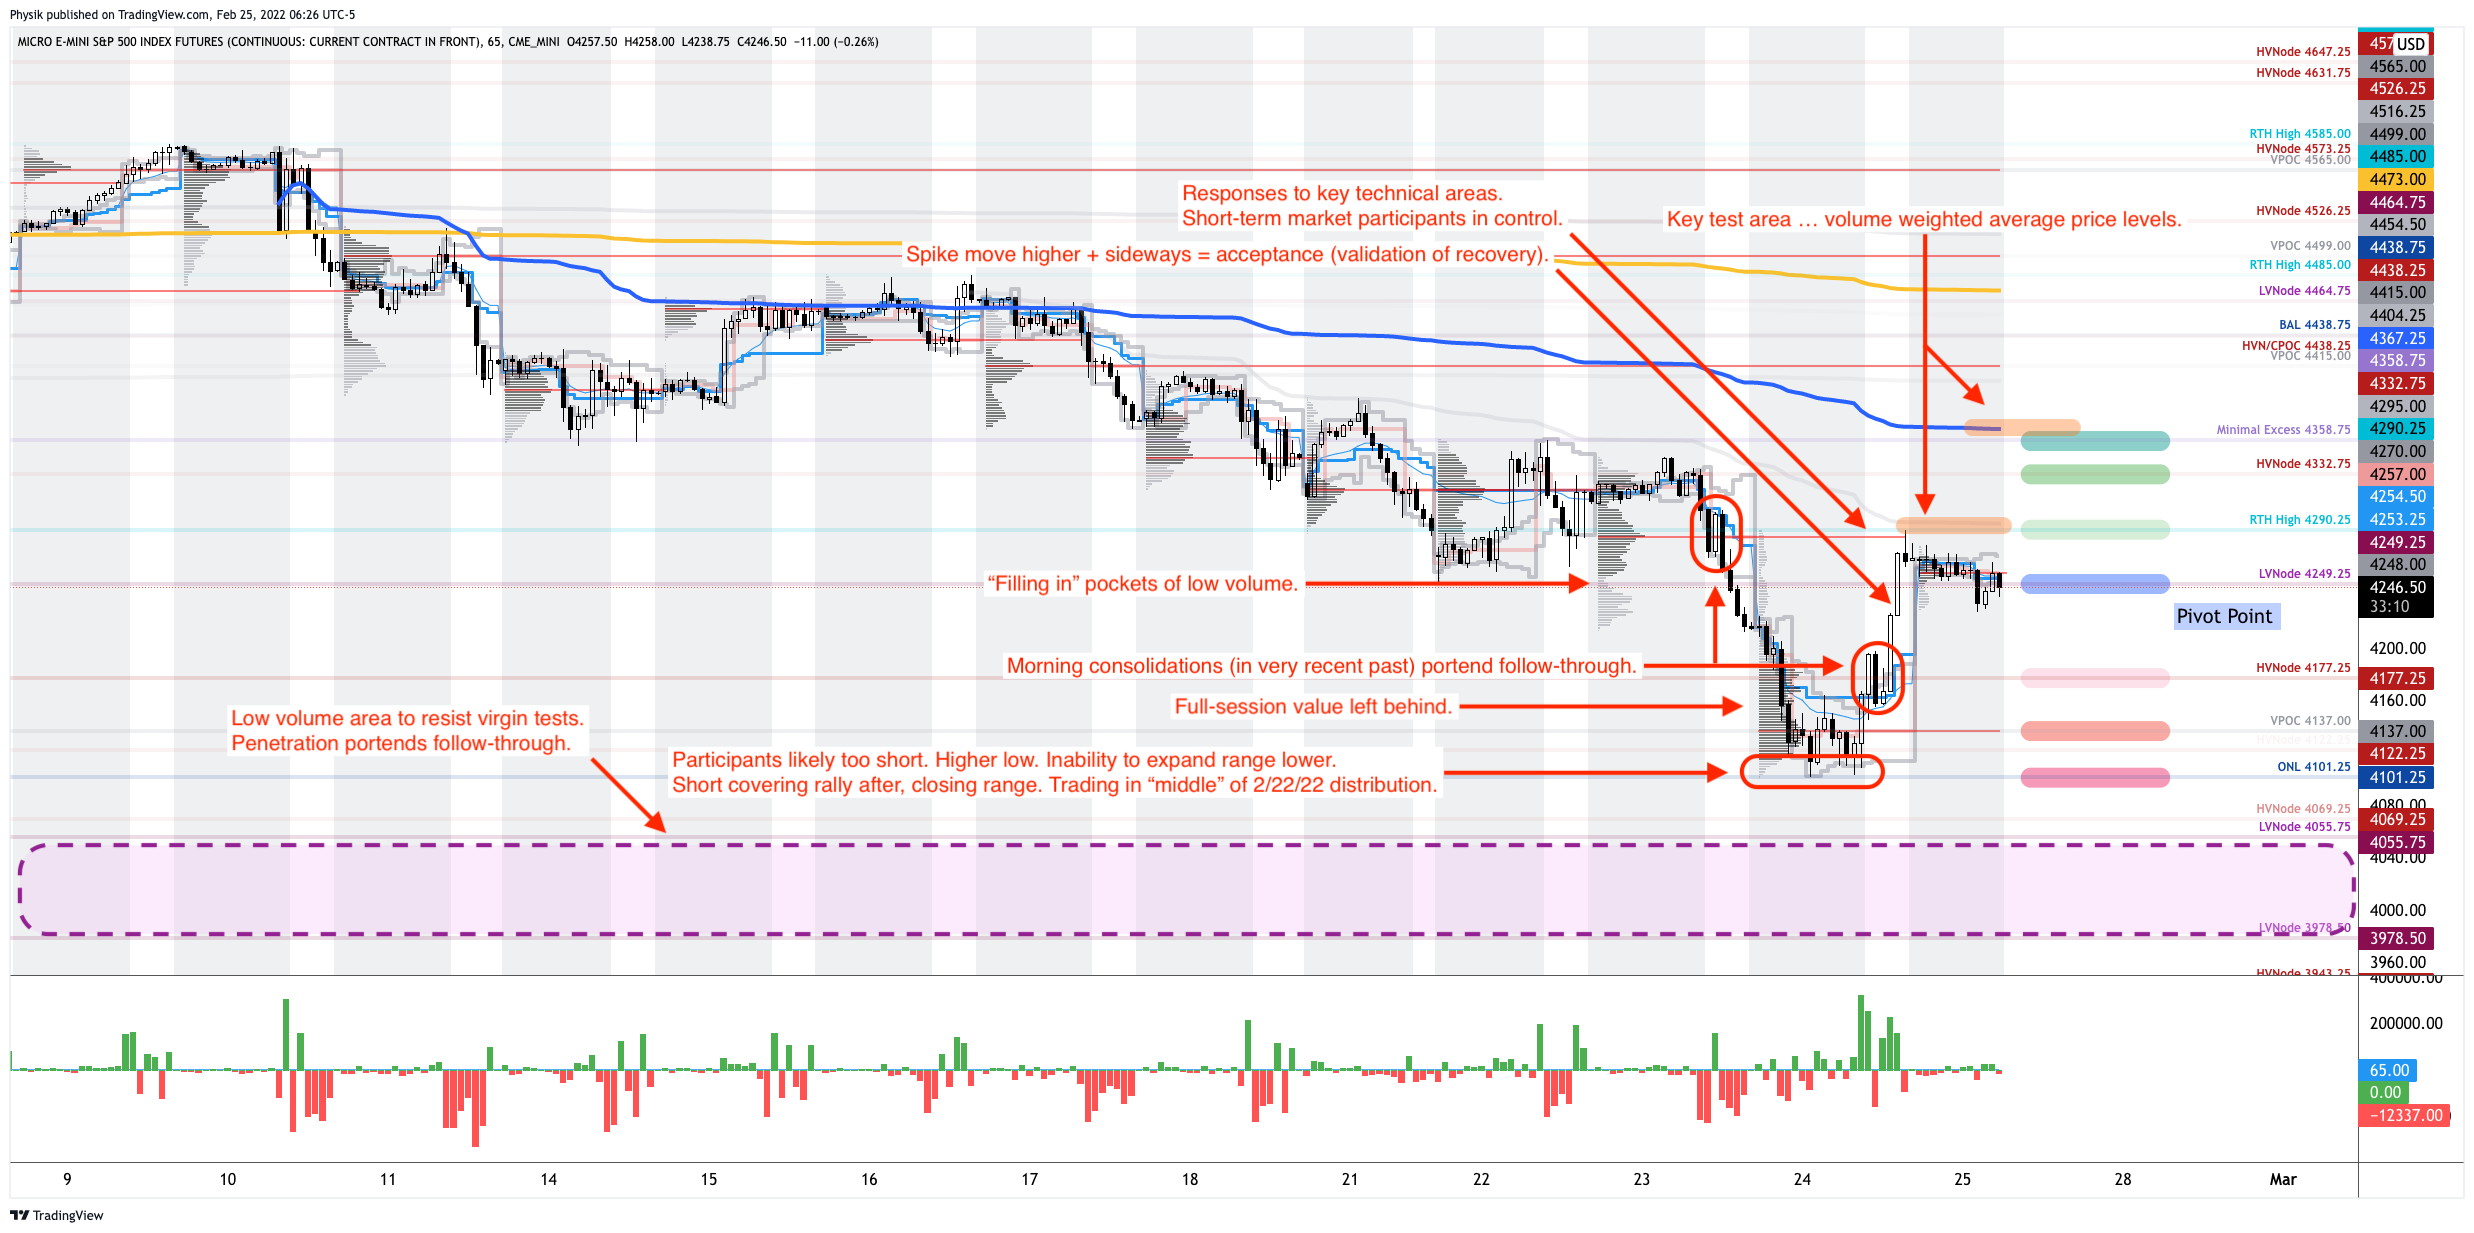
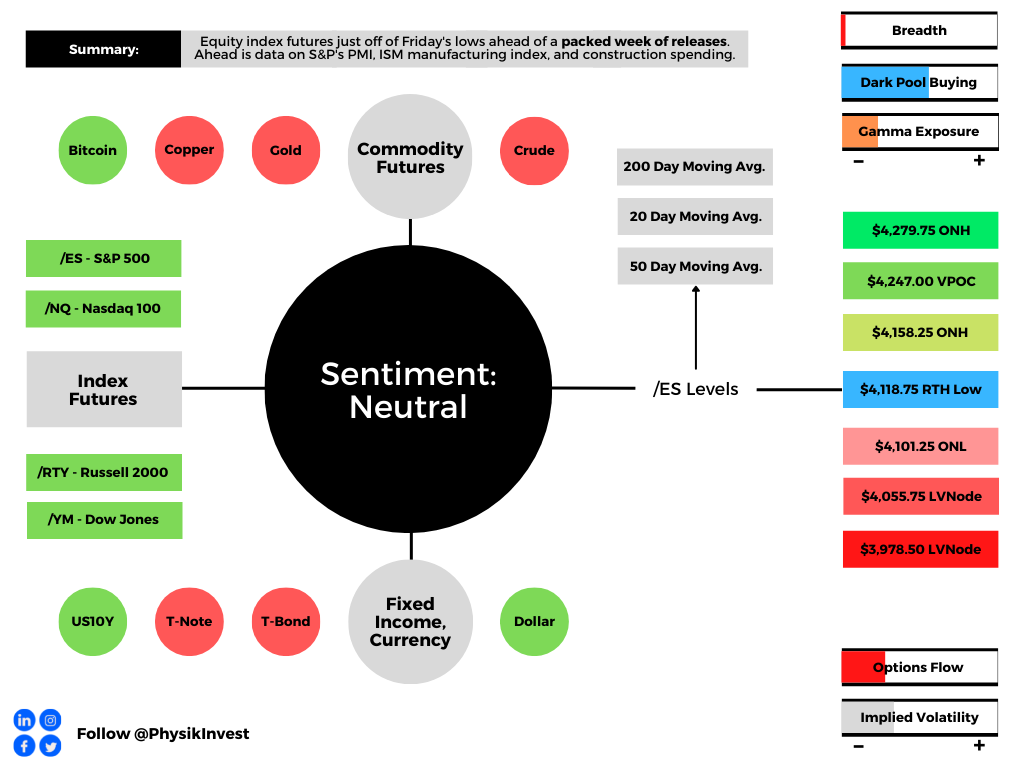
Technical: As of 6:30 AM ET, Monday’s regular session (9:30 AM – 4:00 PM ET), in the S&P 500, will likely open in the middle part of a balanced overnight inventory, inside of prior-range and -value, suggesting a limited potential for immediate directional opportunity.
In the best case, the S&P 500 trades higher; activity above the $4,118.75 regular trade low (RTH Low) puts in play the $4,158.25 overnight high (ONH). Initiative trade beyond the ONH could reach as high as the $4,247.00 untested point of control (VPOC) and $4,279.75 ONH, or higher.
In the worst case, the S&P 500 trades lower; activity below the $4,118.75 RTH Low puts in play the $4,101.25 overnight low (ONL). Initiative trade beyond the ONL could reach as low as the $4,055.75 low volume area (LVNode) and $3,978.50 low volume area (LVNode), or lower.
Click here to load today’s key levels into the web-based TradingView charting platform. Note that all levels are derived using the 65-minute timeframe. New links are produced, daily.

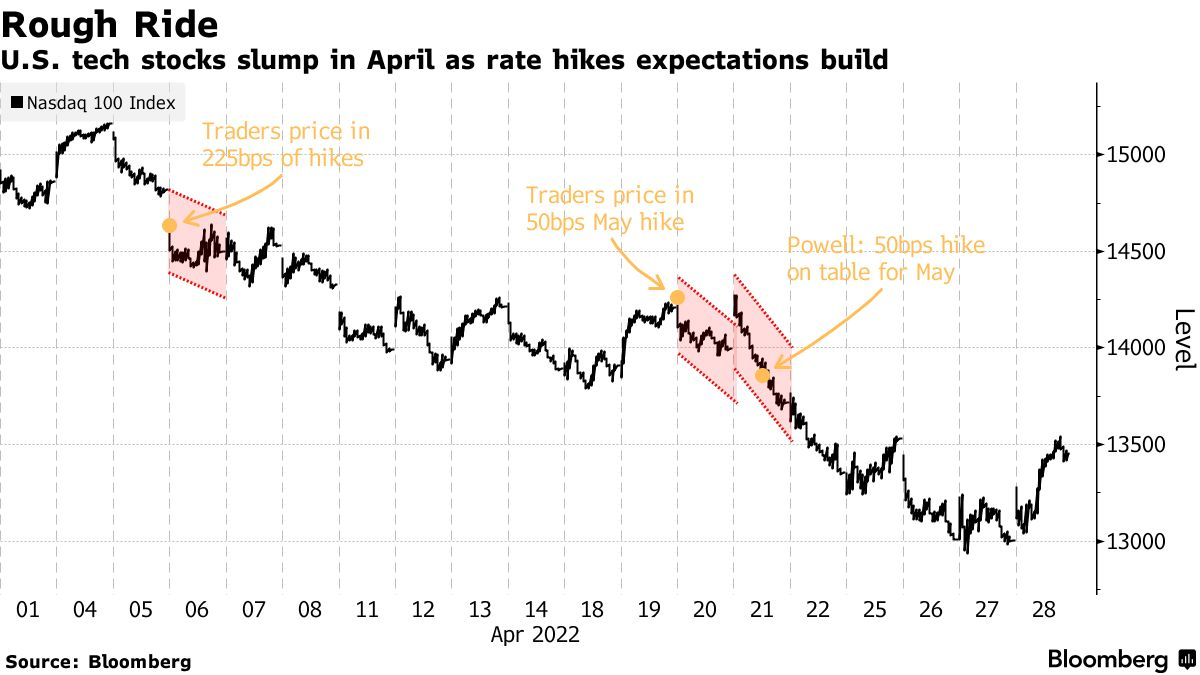
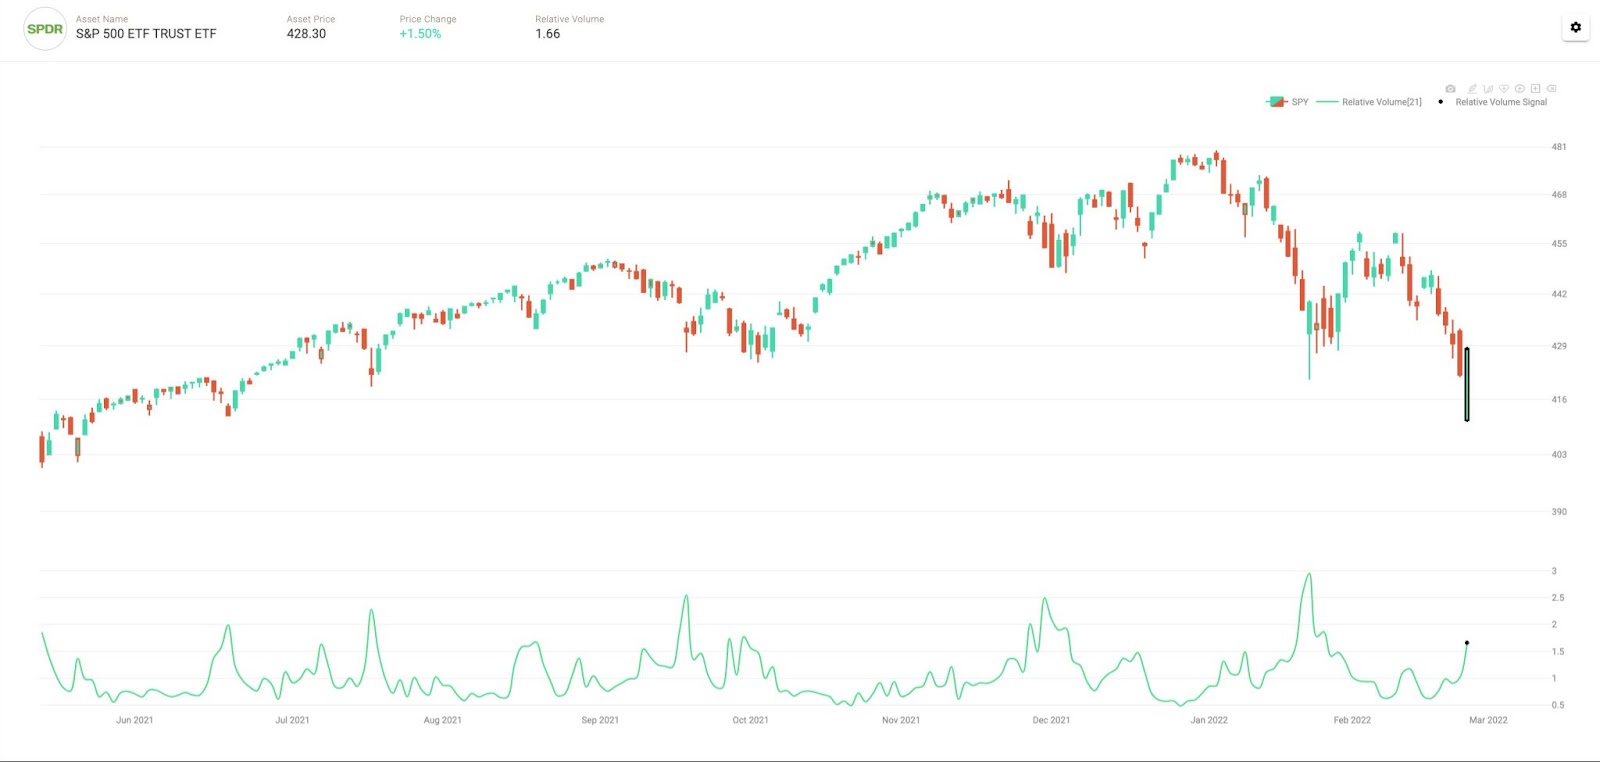
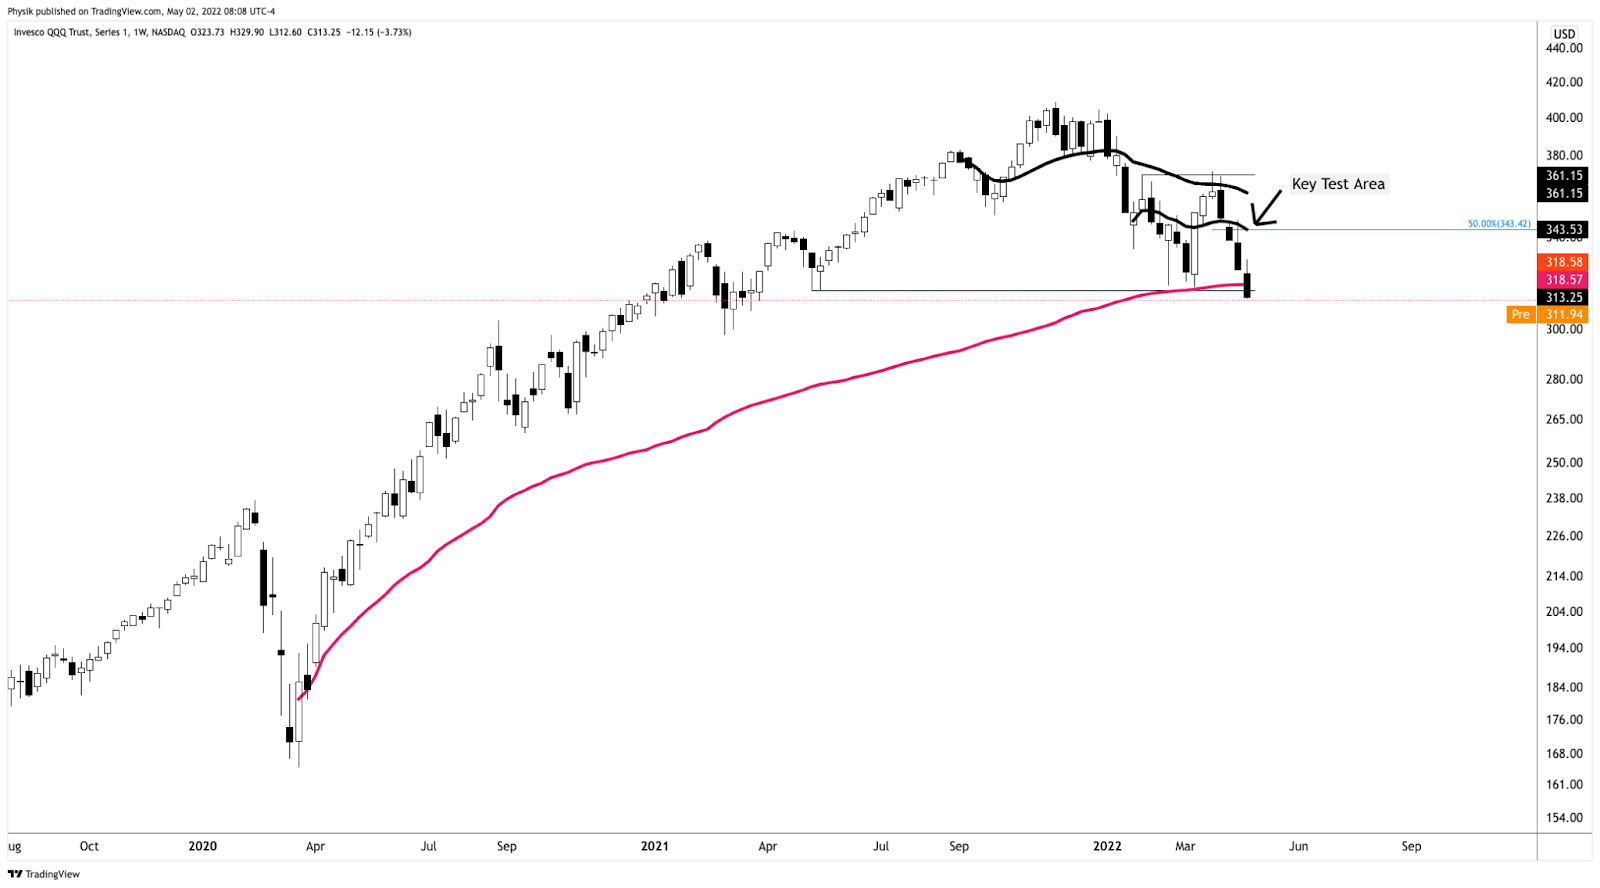
Considerations: Terribly weak price action, last week, with the S&P 500, Nasdaq 100, and Russell 2000 all flirting with early 2022 lows.
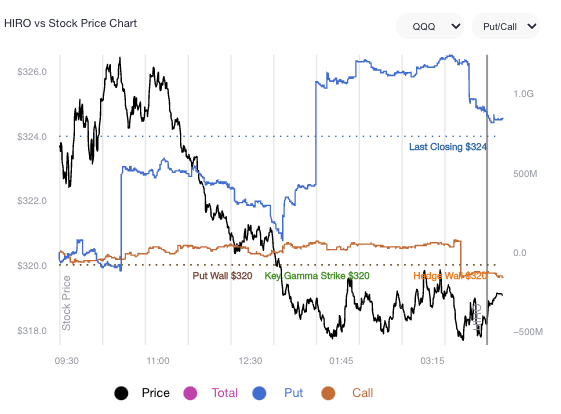
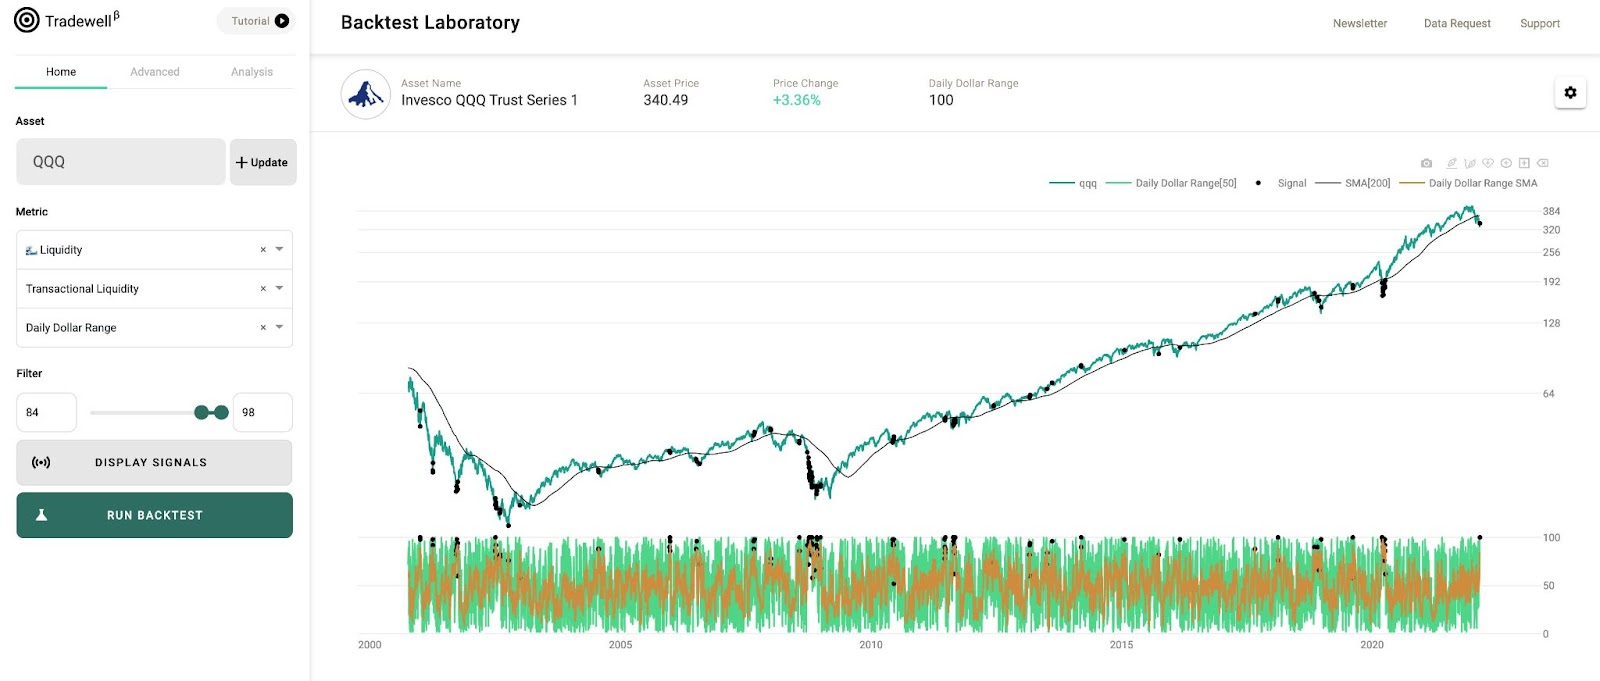
The weaker of the bunch – the Invesco QQQ Trust Series 1 (NASDAQ: QQQ) – just broke a major VWAP anchored from the lows of March 2020.
That indicator denotes the level at which the average buyer/seller is in.
In other words, it is the fairest price to pay for Nasdaq 100 exposure (since March 2020) and, instead of being construed as a so-called demand zone, the level ought to be looked at as overhead supply on tests, higher. Caution.
Definitions
Overnight Rally Highs (Lows): Typically, there is a low historical probability associated with overnight rally-highs (lows) ending the upside (downside) discovery process.
Volume Areas: A structurally sound market will build on areas of high volume (HVNodes). Should the market trend for long periods of time, it will lack sound structure, identified as low volume areas (LVNodes). LVNodes denote directional conviction and ought to offer support on any test.
If participants were to auction and find acceptance into areas of prior low volume (LVNodes), then future discovery ought to be volatile and quick as participants look to HVNodes for favorable entry or exit.
POCs: POCs are valuable as they denote areas where two-sided trade was most prevalent in a prior day session. Participants will respond to future tests of value as they offer favorable entry and exit.
Volume-Weighted Average Prices (VWAPs): A metric highly regarded by chief investment officers, among other participants, for quality of trade. Additionally, liquidity algorithms are benchmarked and programmed to buy and sell around VWAPs.
About
After years of self-education, strategy development, mentorship, and trial-and-error, Renato Leonard Capelj began trading full-time and founded Physik Invest to detail his methods, research, and performance in the markets.
Capelj also develops insights around impactful options market dynamics at SpotGamma and is a Benzinga reporter.
Some of his works include conversations with ARK Invest’s Catherine Wood, investors Kevin O’Leary and John Chambers, FTX’s Sam Bankman-Fried, Kai Volatility’s Cem Karsan, The Ambrus Group’s Kris Sidial, among many others.
Disclaimer
In no way should the materials herein be construed as advice. Derivatives carry a substantial risk of loss. All content is for informational purposes only.