The daily brief is a free glimpse into the prevailing fundamental and technical drivers of U.S. equity market products. Join the 300+ that read this report daily, below!
What Happened
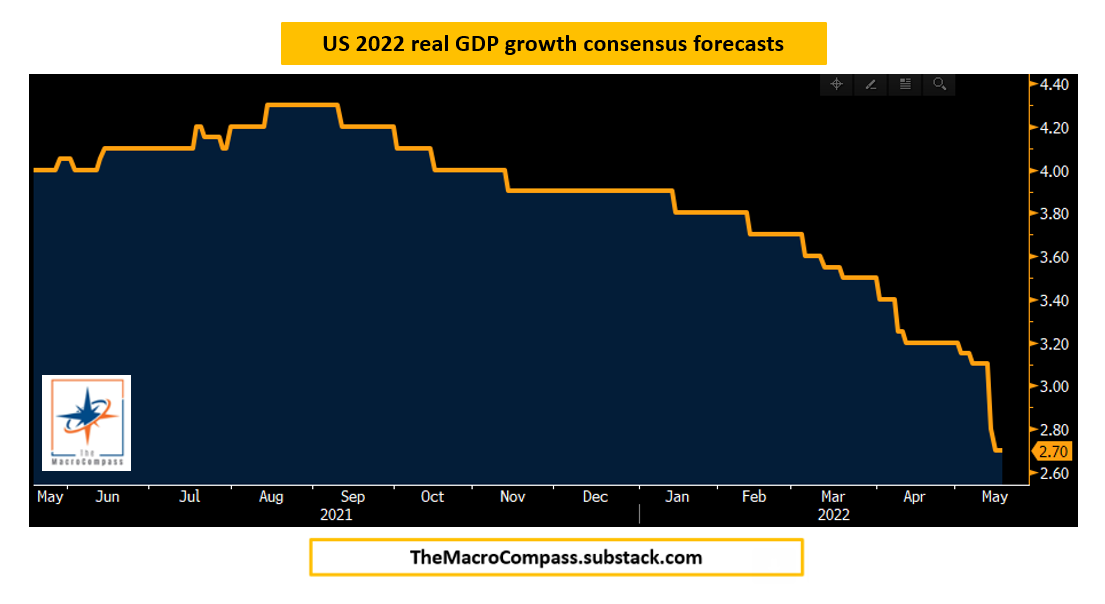
Overnight, equity index futures auctioned sideways-to-higher, along with bonds, snapping the pricing in of tighter monetary policies and economic slowing.
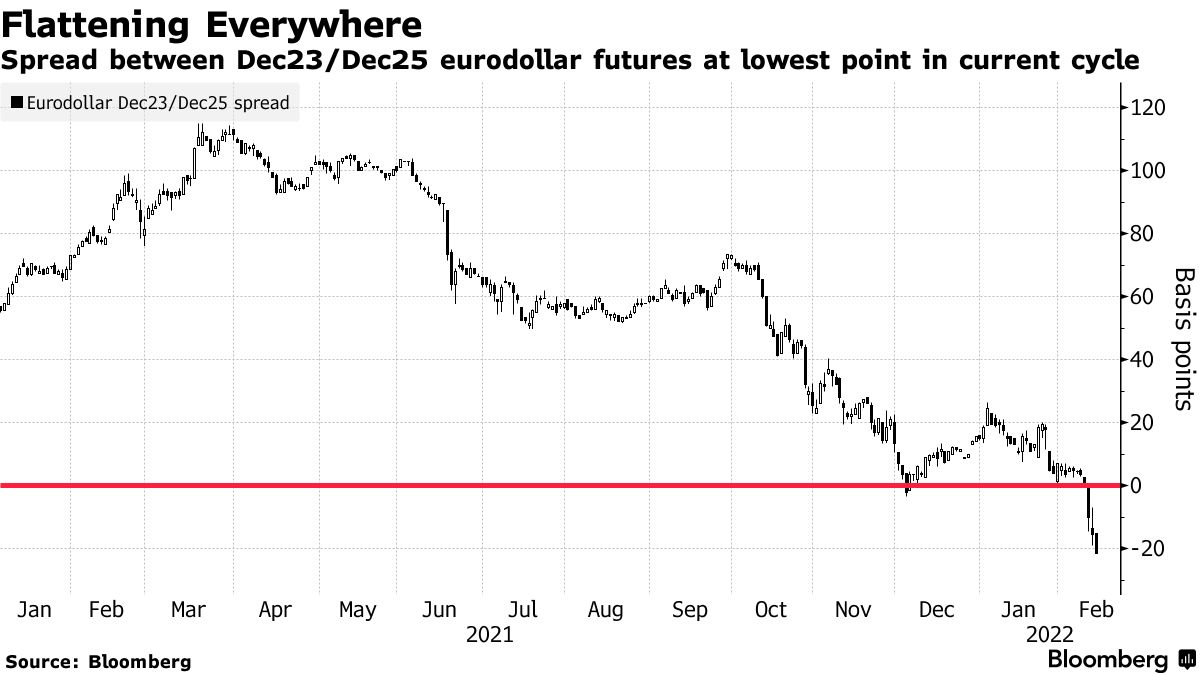
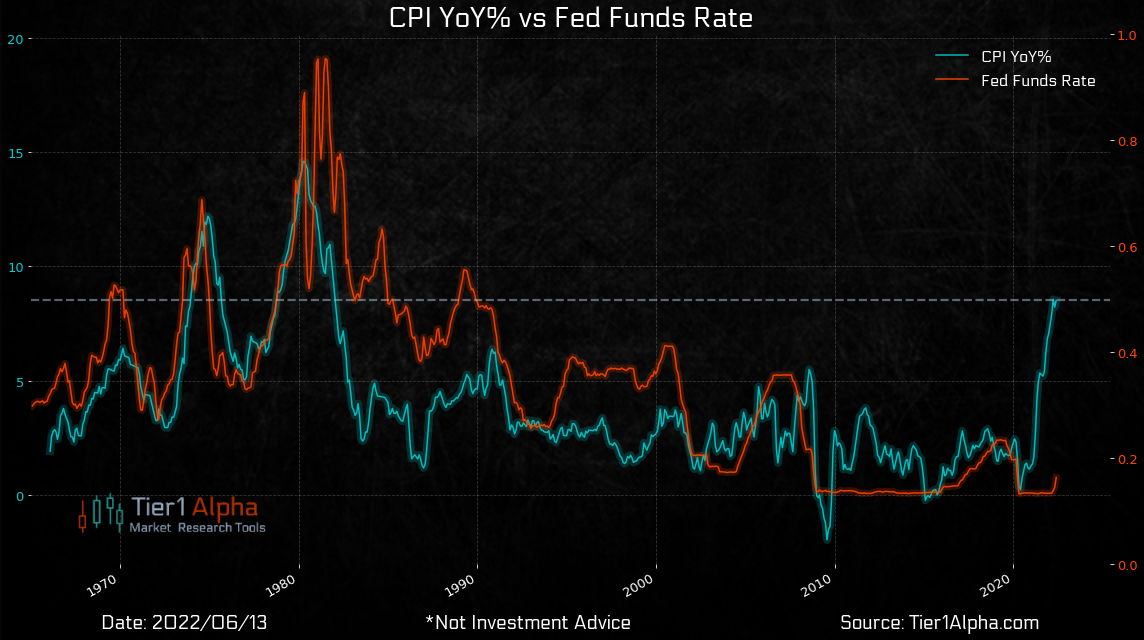
Creeping up are expectations regarding the amount of tightening policymakers are to add. Treasury yields had their biggest jump in decades. U.S. 3-year Treasury yields, in particular, were up 25 basis points, to 3.49%, the highest since 2007, per Bloomberg.
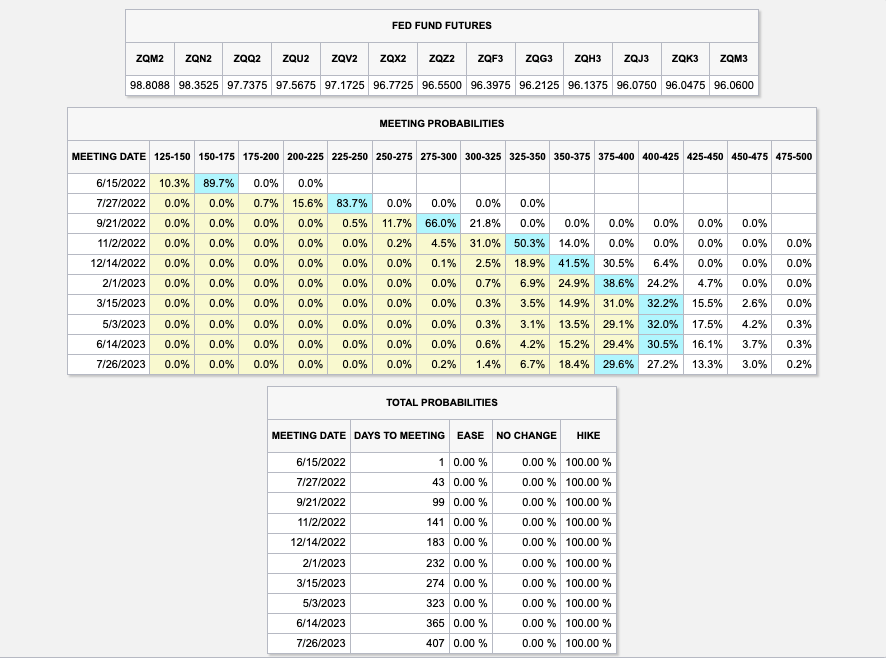
Now, traders see nearly 200 basis points of tightening by the Federal Reserve’s (Fed) by September, as well as the possibility of a one-off 75 basis point hike. The overnight rate is expected to peak near 4% by mid-2023.
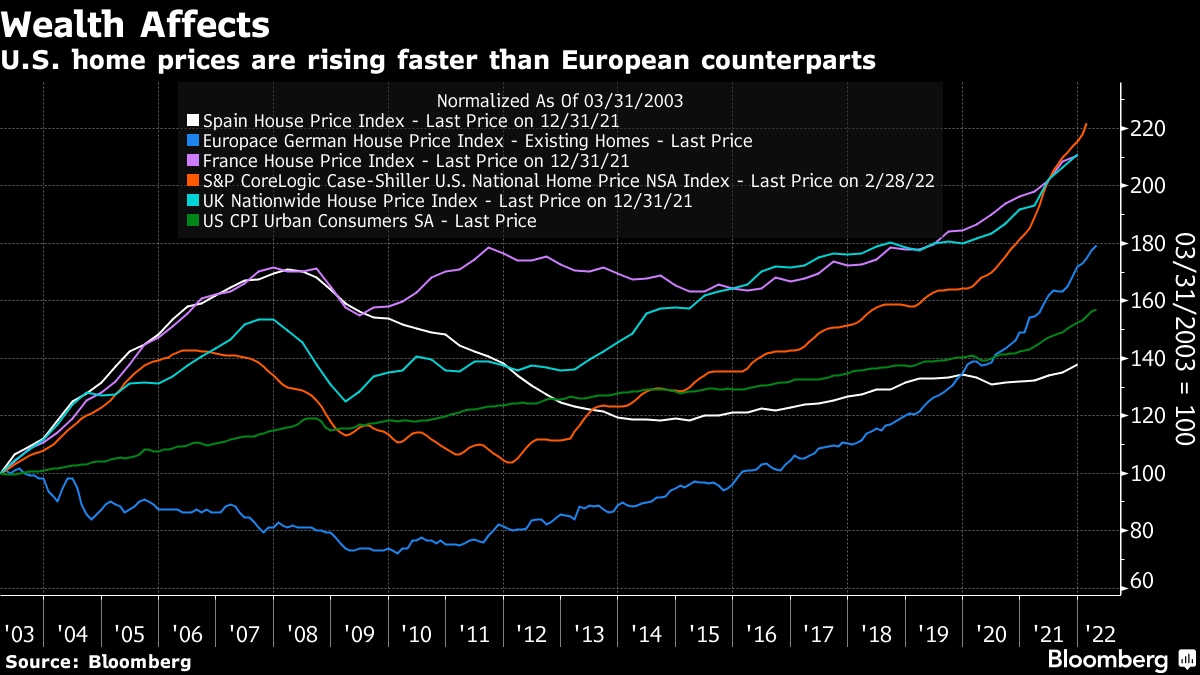
Accordingly, the U.S. and European real estate values have taken a hit amid rising rates and inflated prices, falling 5-10%. Rental demand has thinned, also.
In other news, the U.S. sought to boost supplies of Russian fertilizer as “sanctions fears have led to a sharp drop in supplies, fueling spiraling global food costs.”

What To Expect
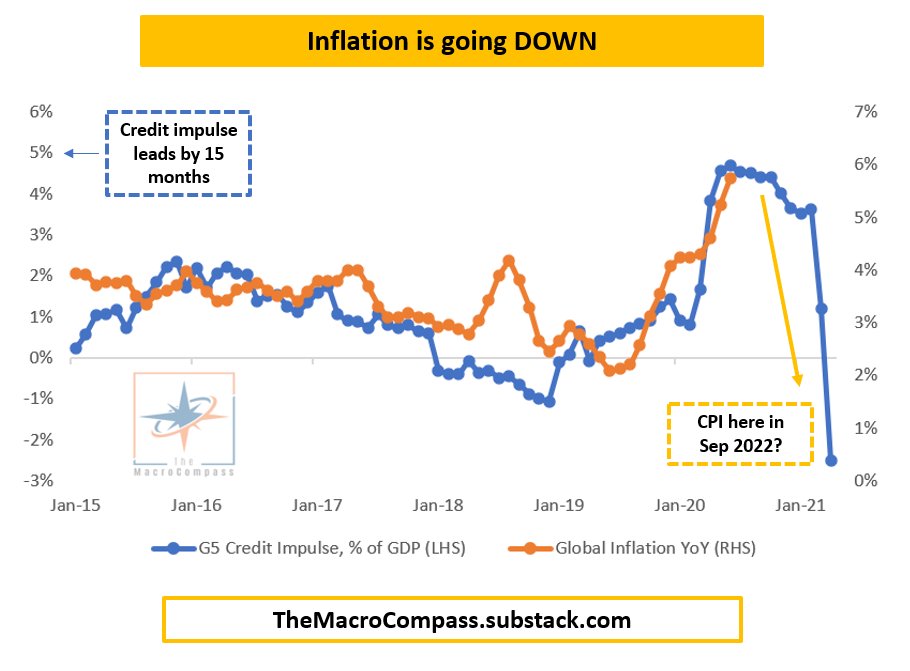
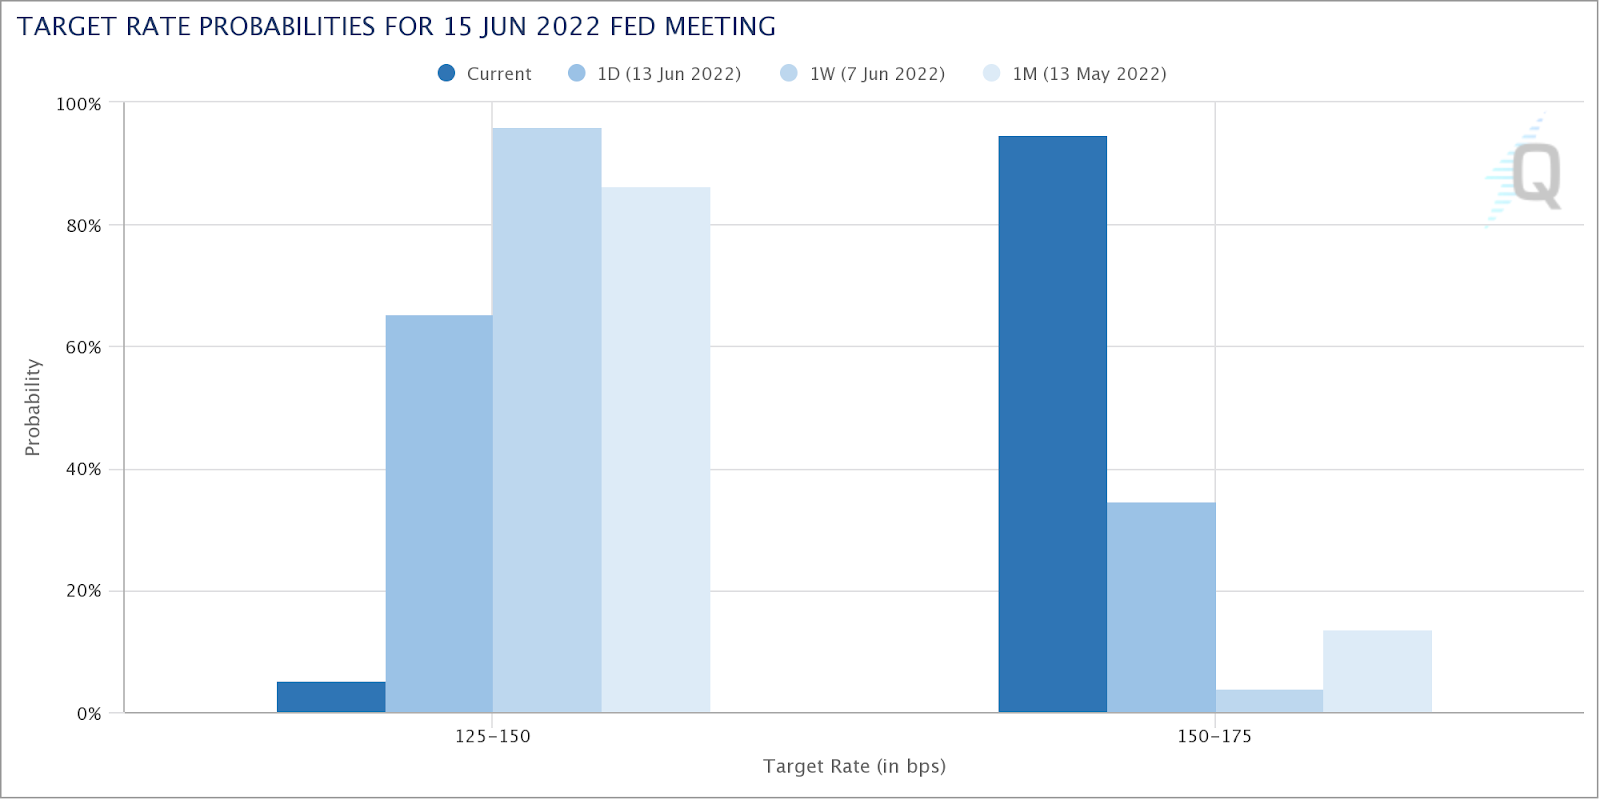
Fundamental: In what seems to be “a coordinated attempt to guide the market through trusted journalists,” recent updates on the path of inflation may push policymakers to surprise markets.
Markets reacted, accordingly, pricing in a near-certainty of a 75 basis point hike, later this week.
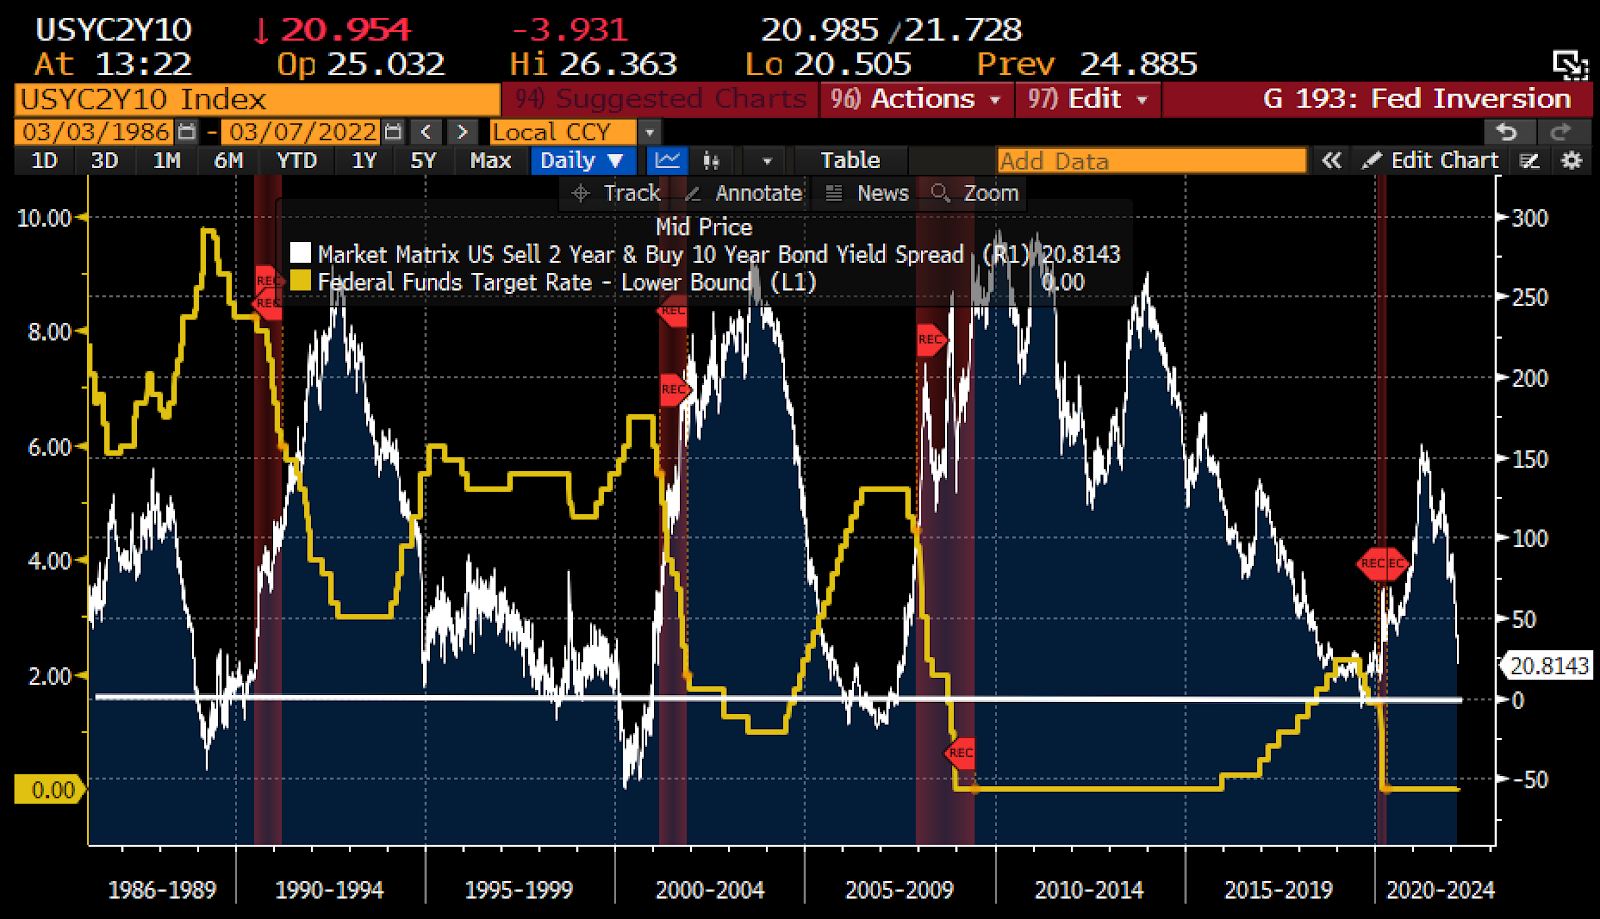
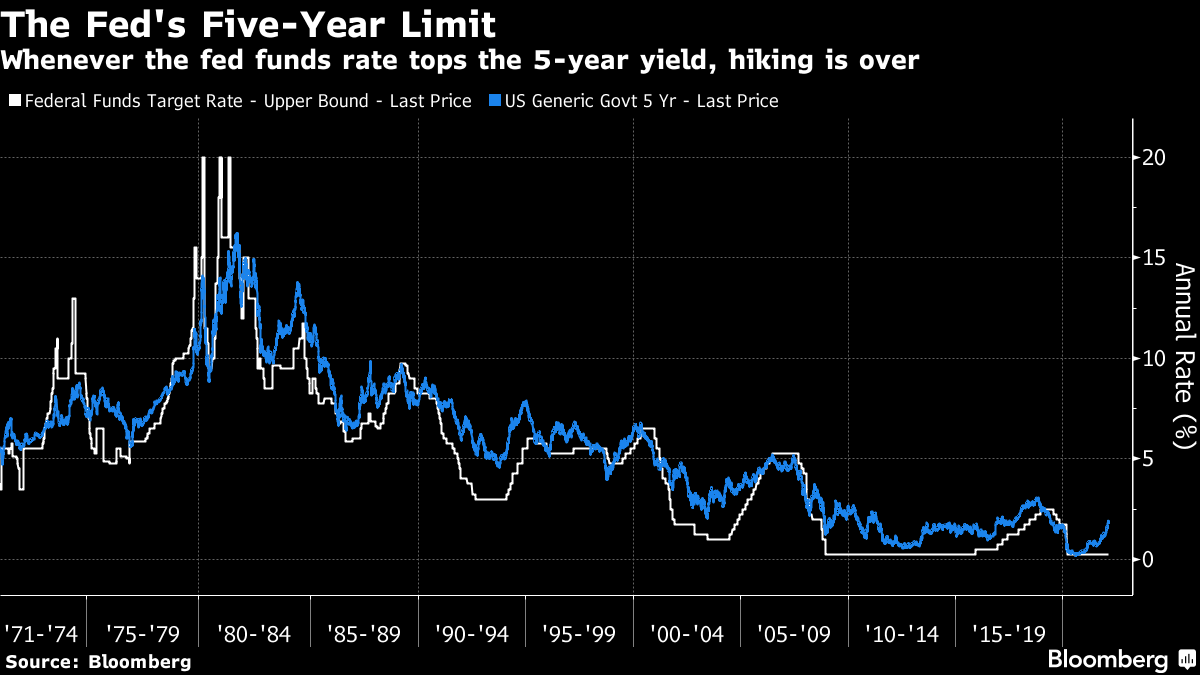
Looking into the future, Fed Funds target rates, based on the Fed Fund futures contract prices, are projected to peak into the mid-next year (Spring/Summer 2023).
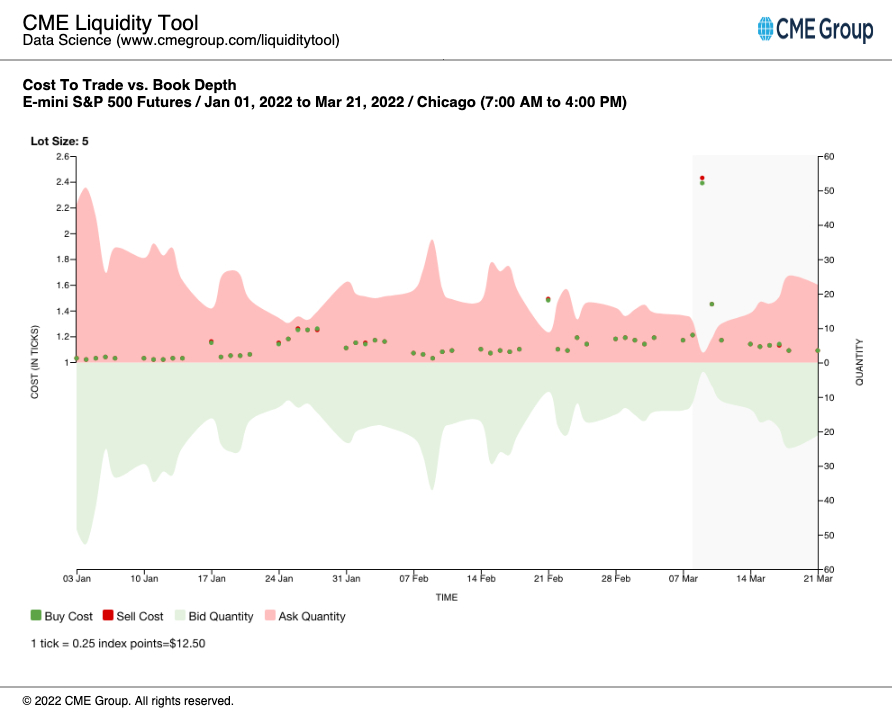
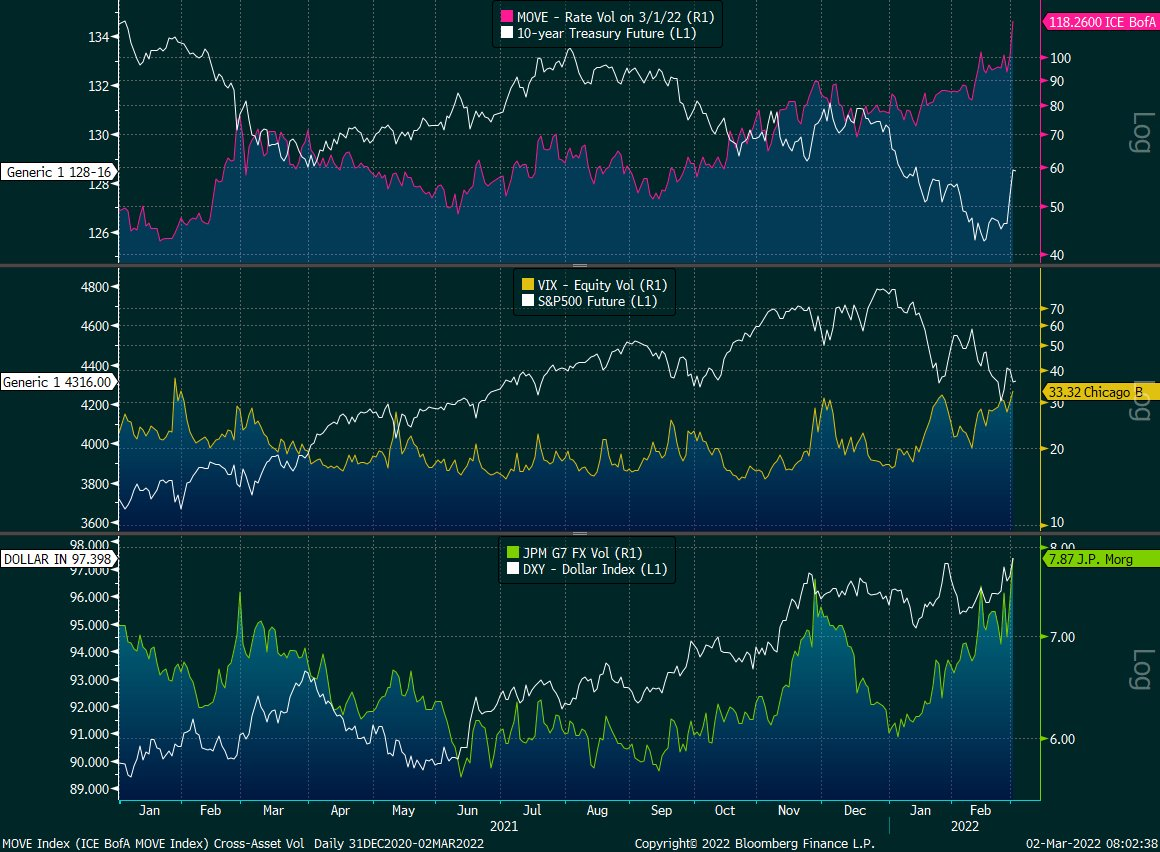
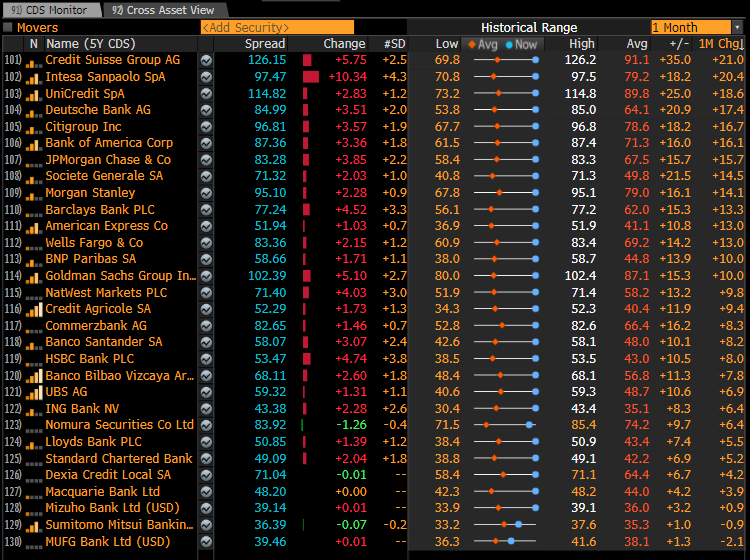
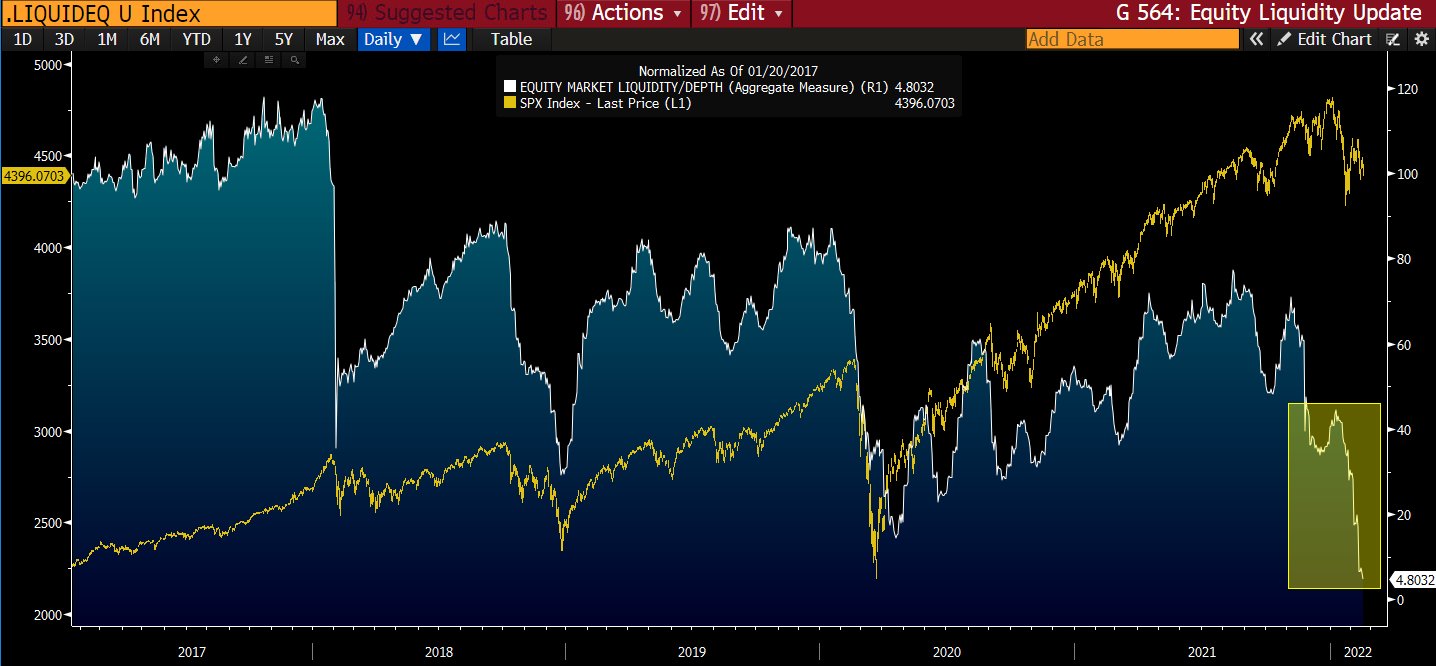
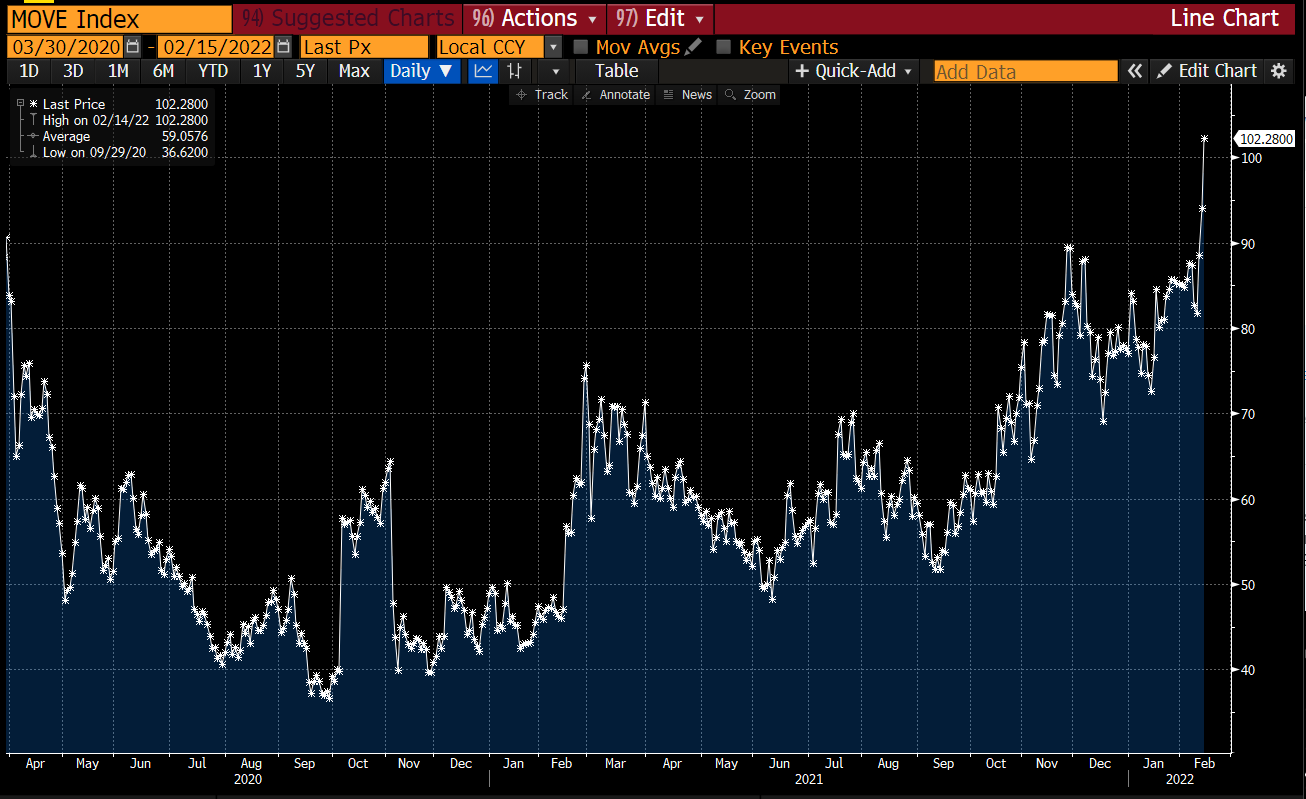
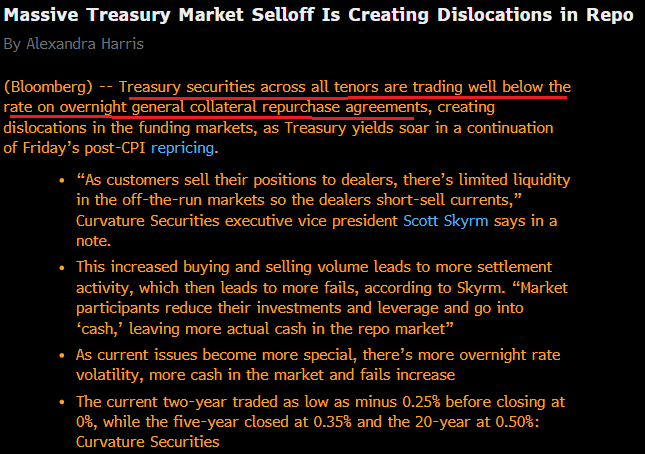
Accordingly, Treasury market turmoil continued with liquidity “worse than it was leading up to Lehman,” says Christian Hoffman, a portfolio manager for Thornburg Investment Management.
“That creates even more risk because if the market doesn’t have liquidity, it can gap down very quickly.”
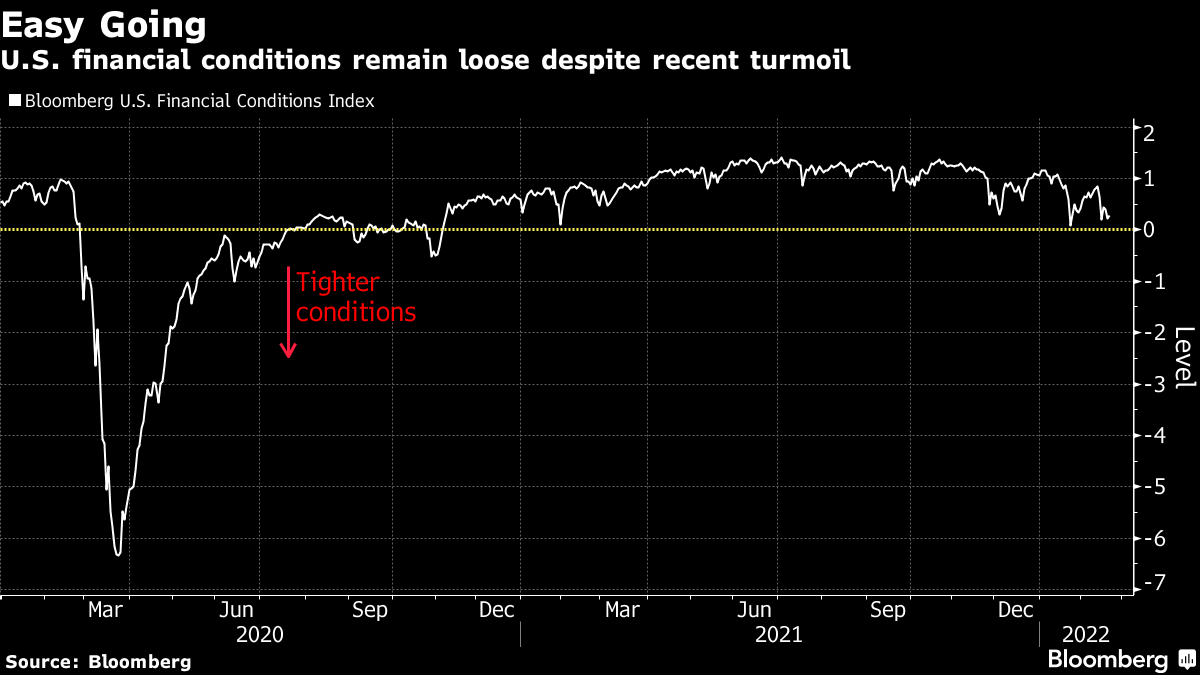
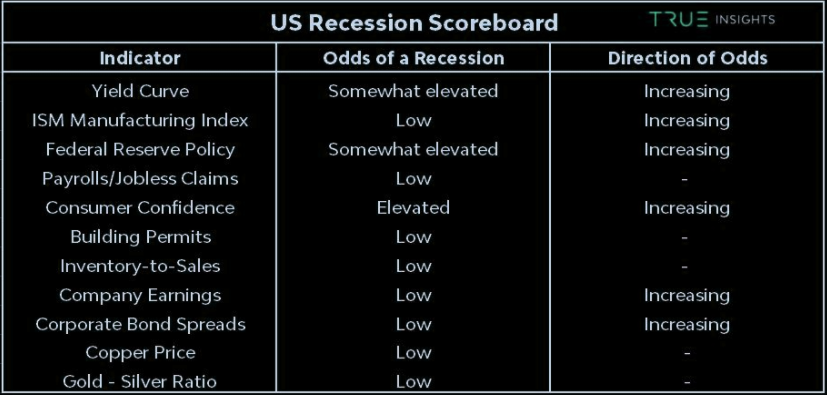
As talked about in past newsletters, pressures in the financial system, all the while the economy is slowing, are rising. This is amidst a dash for cash as fixed income and equity markets are not perceived to be as safe.
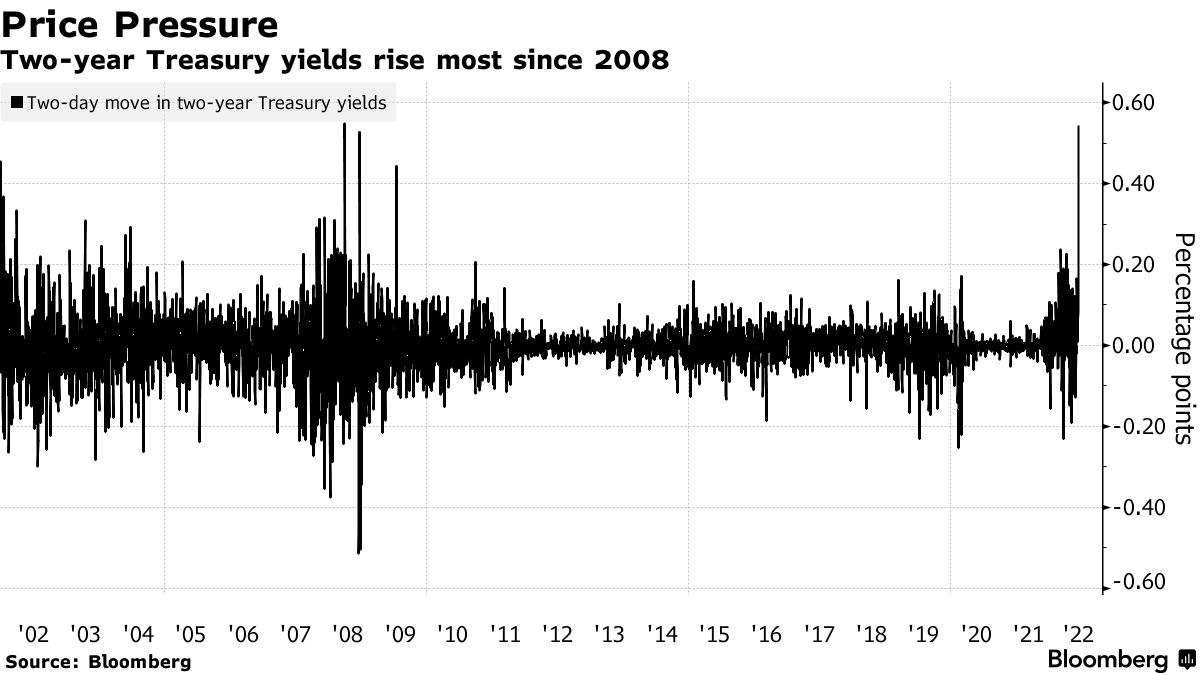
“People are trying to process what’s behind these large moves,” Subadra Rajappa, head of U.S. rates strategy at Societe Generale SA (OTC: SCGLY), said. She attributes some of the volatility to poor liquidity, panic selling, and margin calls.
Ultimately, according to Bloomberg’s John Authers, this is a tantrum the Fed is likely to let “rip for a while” before, potentially, suffocating “with more easy money.”
“The relationship between central banks and bond markets is, as I’ve said before, a lot like that between a parent and an angry toddler. Indulging the bond market early last year might prove a critical mistake in losing parental authority for the Fed.”
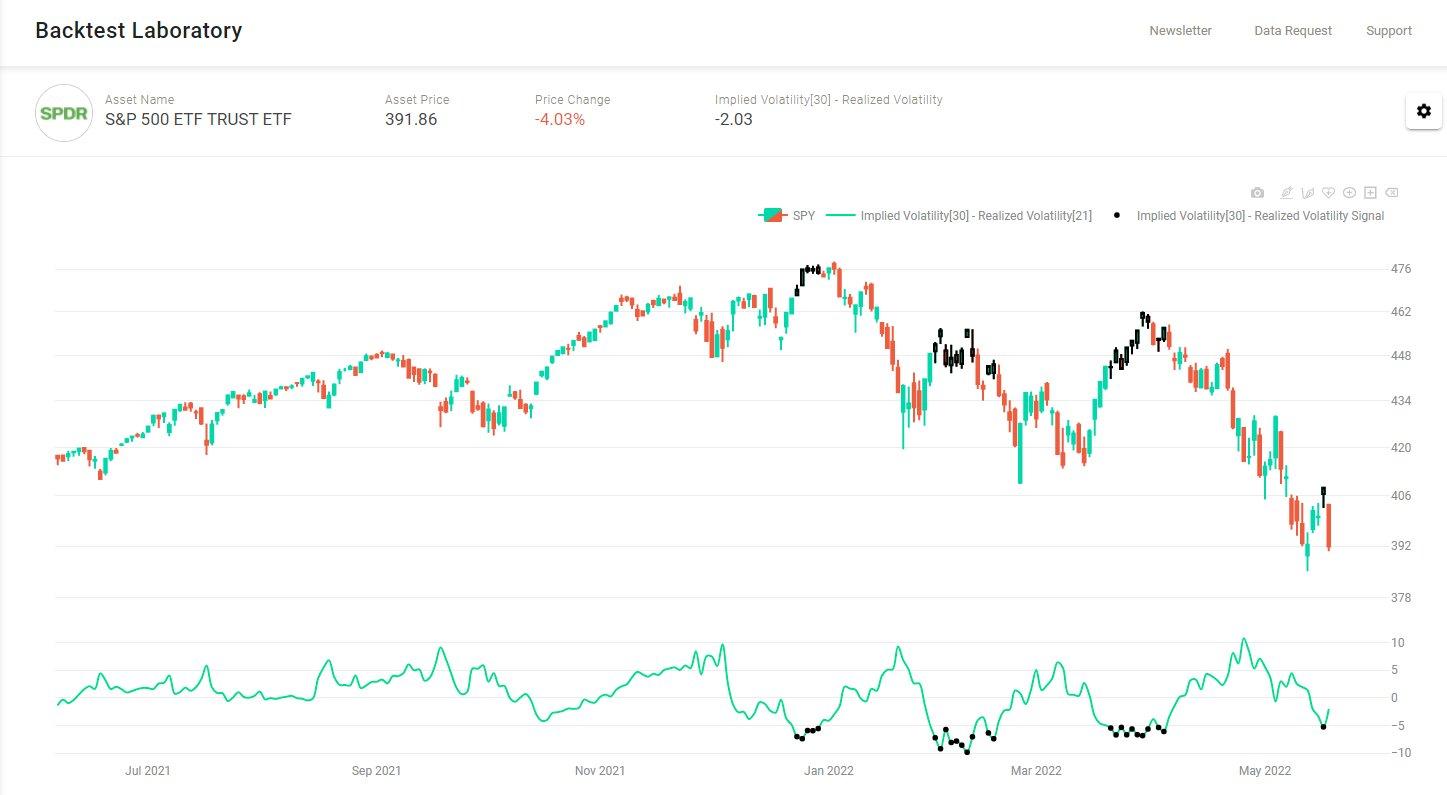
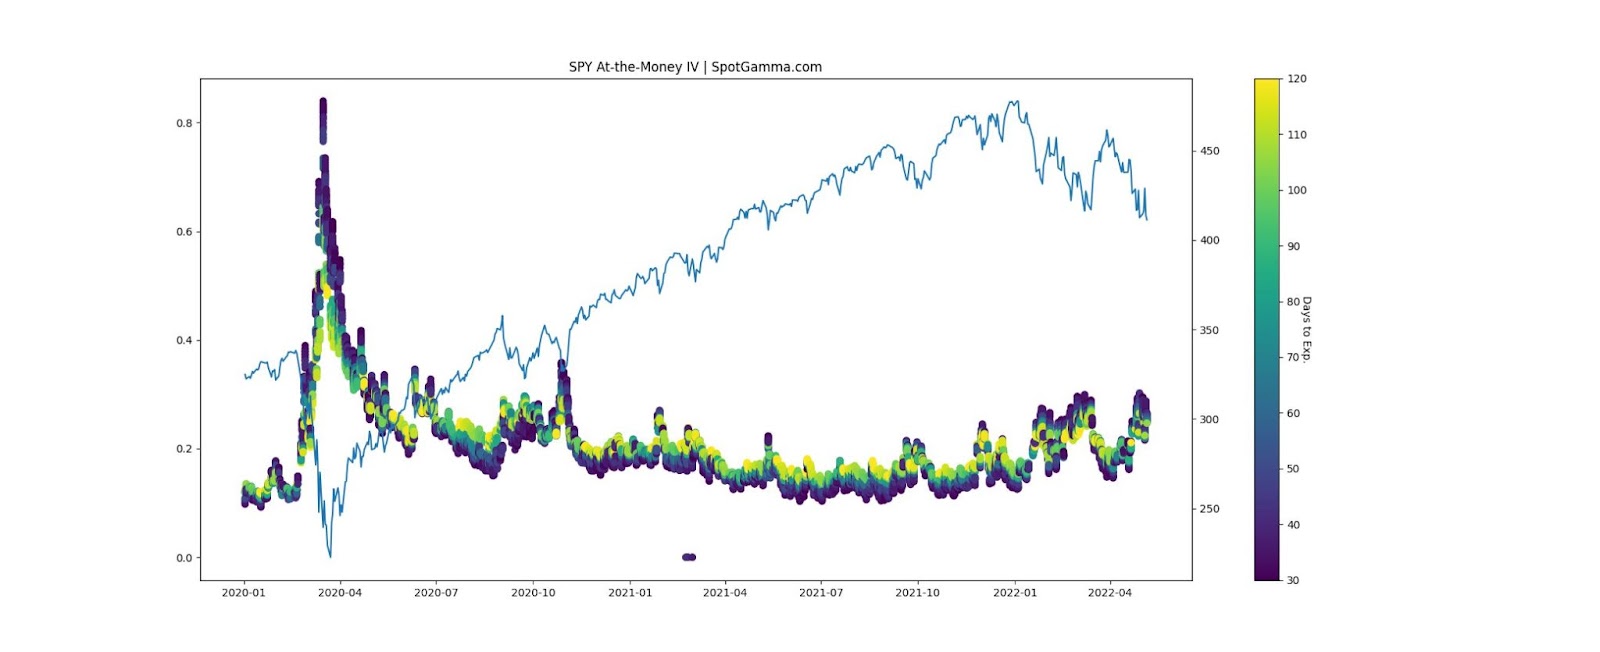
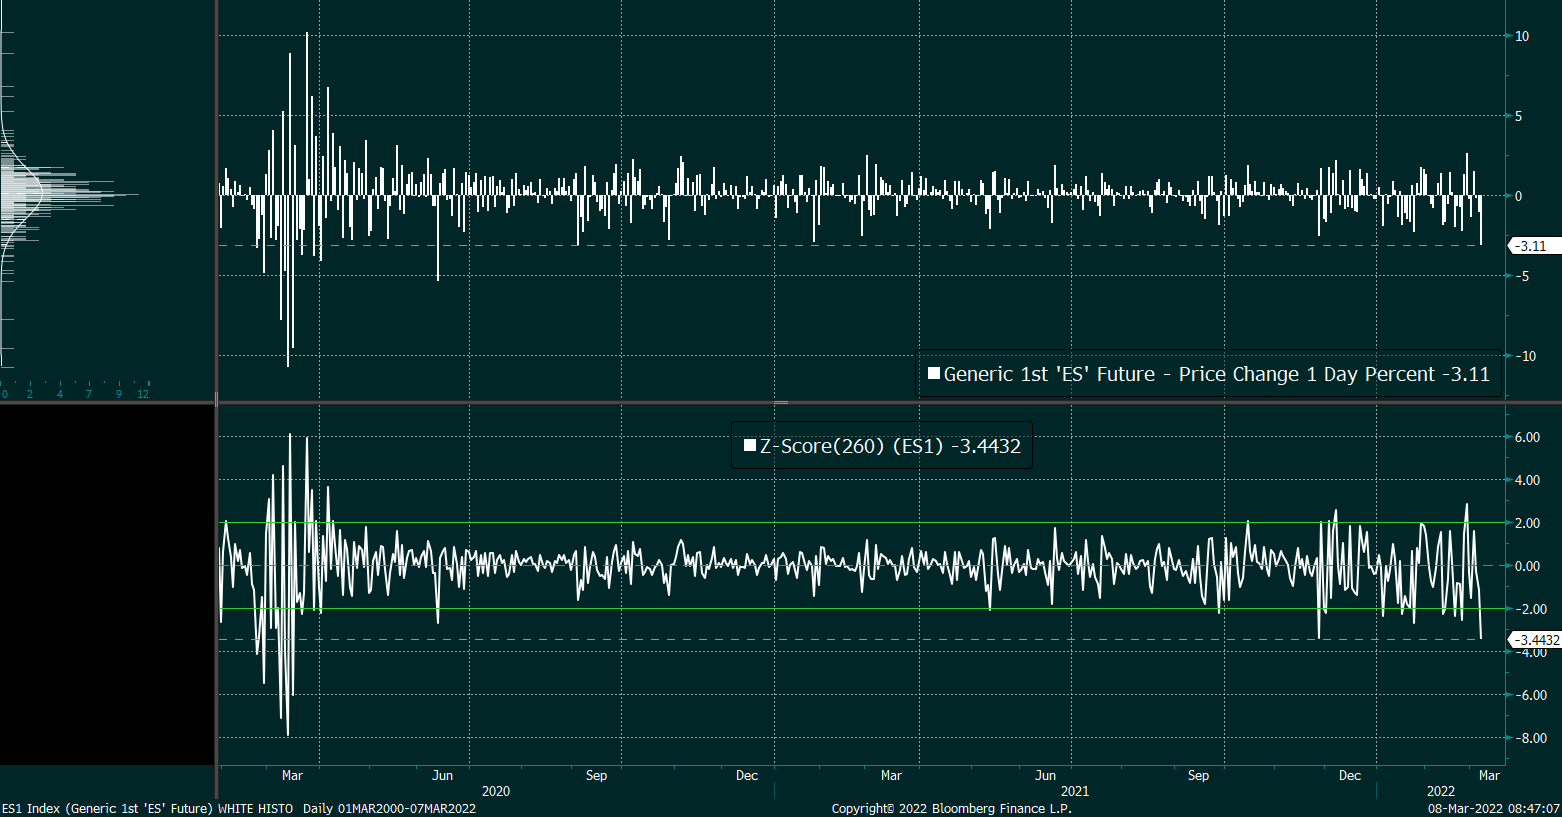
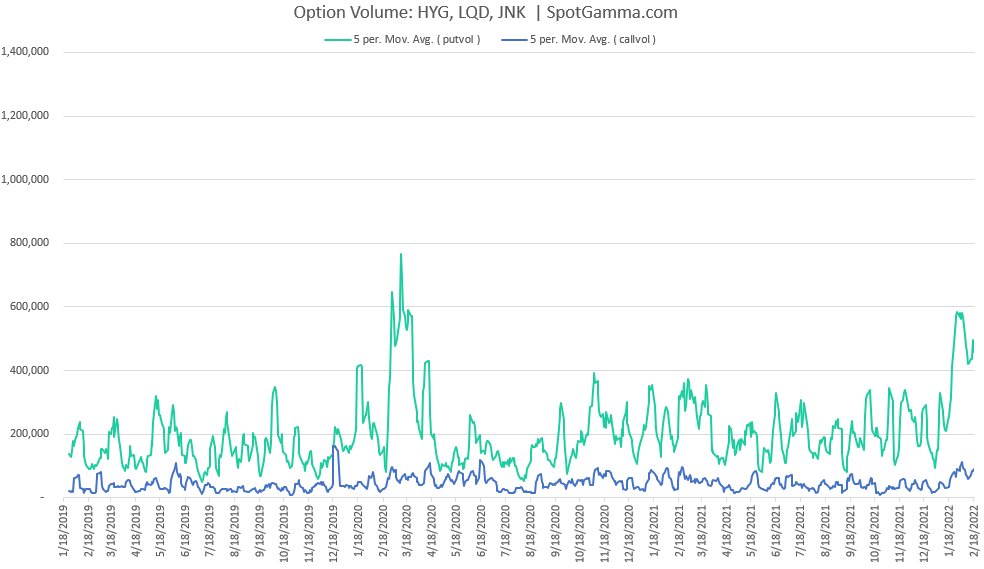
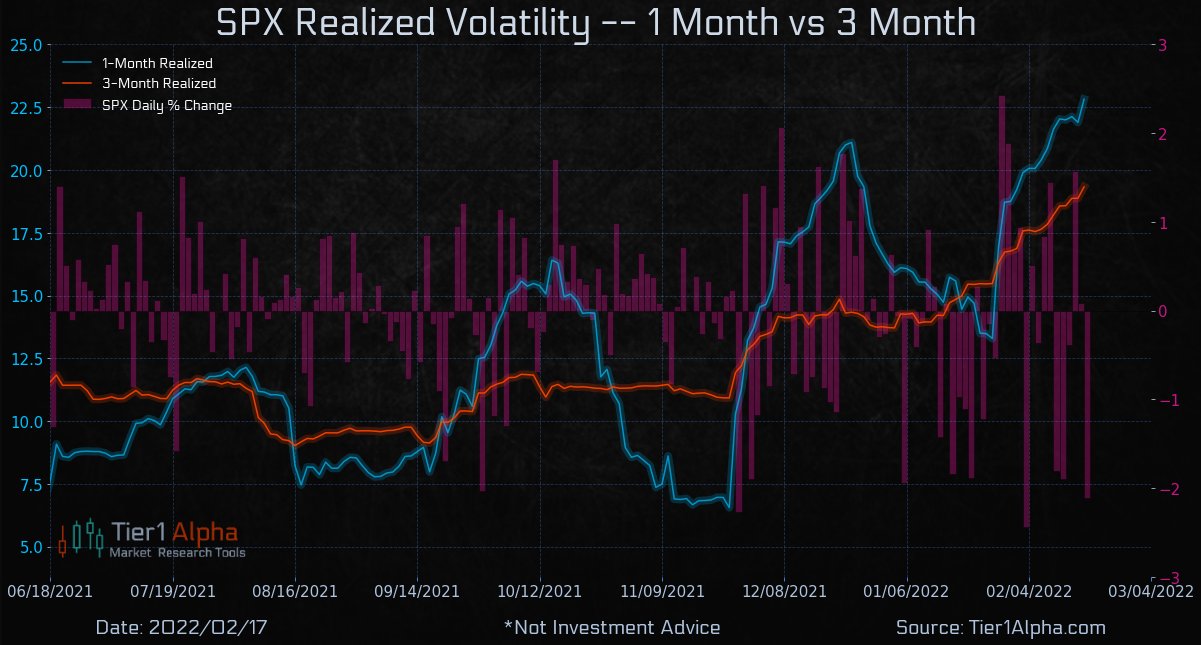
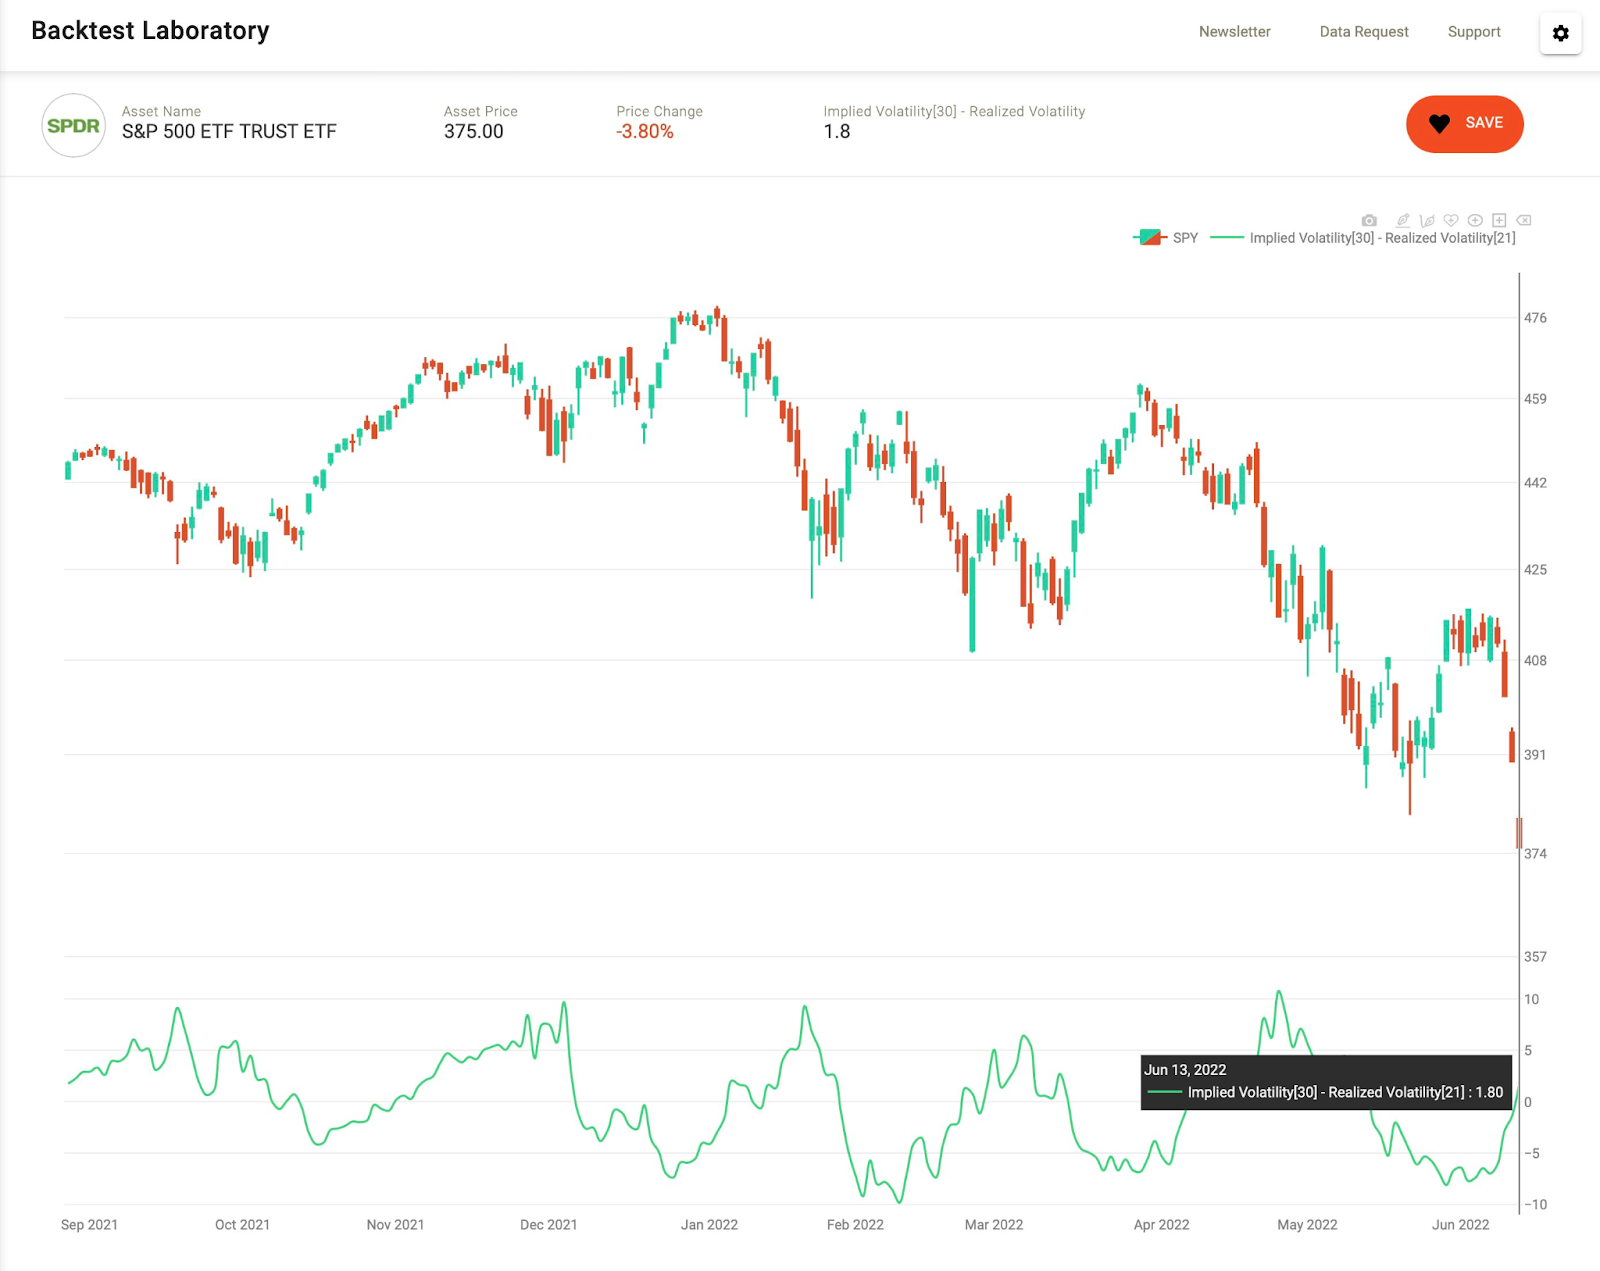
Positioning: Last night, as I wrote a report for SpotGamma’s subscribers, noteworthy is how “subdued” volatility was with, recently, “realized outpacing that which is implied by participants’ options activity.”
That dynamic resolved, Monday, as implied (IVOL) finally retook that which is realized (RVOL).
Read, also, the Daily Brief for Monday, June 13, 2022.
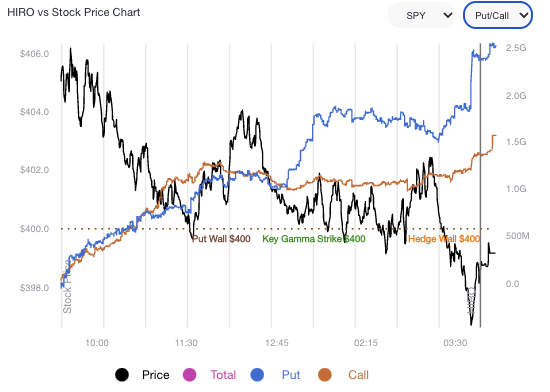
Moreover, for much of the session, the equity markets were range-bound as most of the movement in both equity and volatility markets happened overnight.
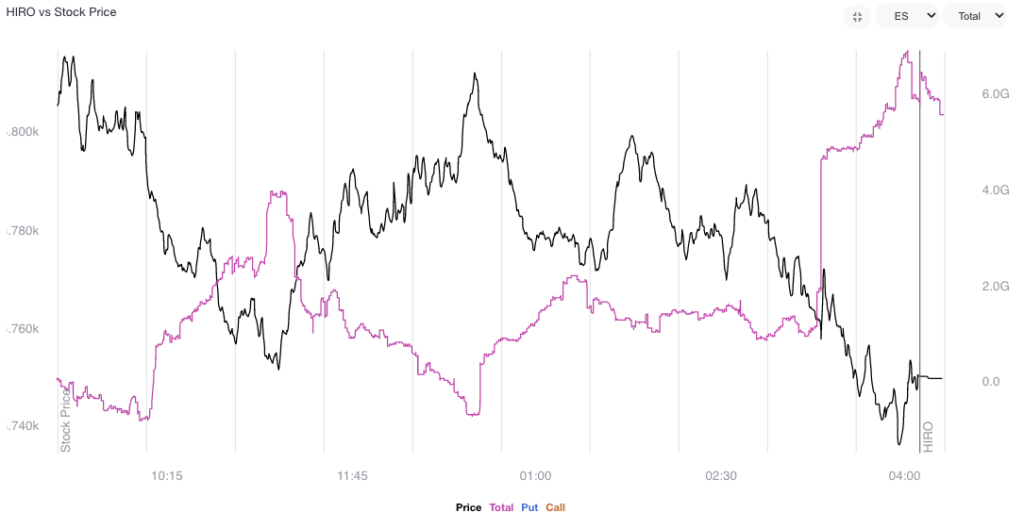
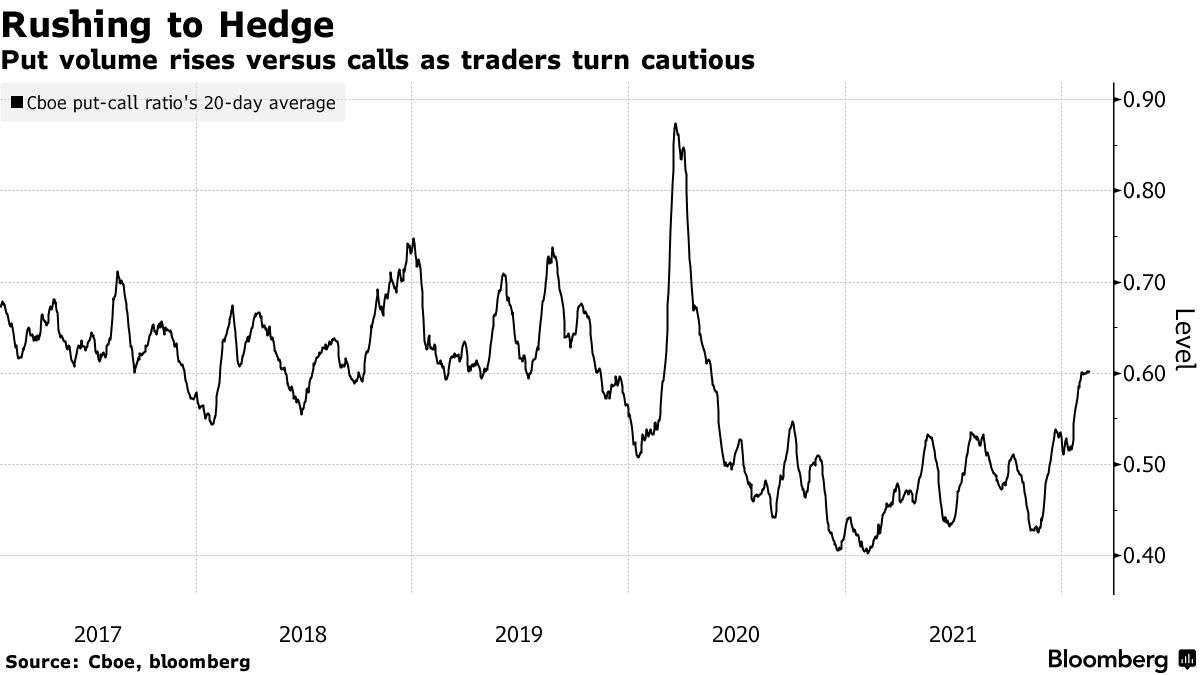
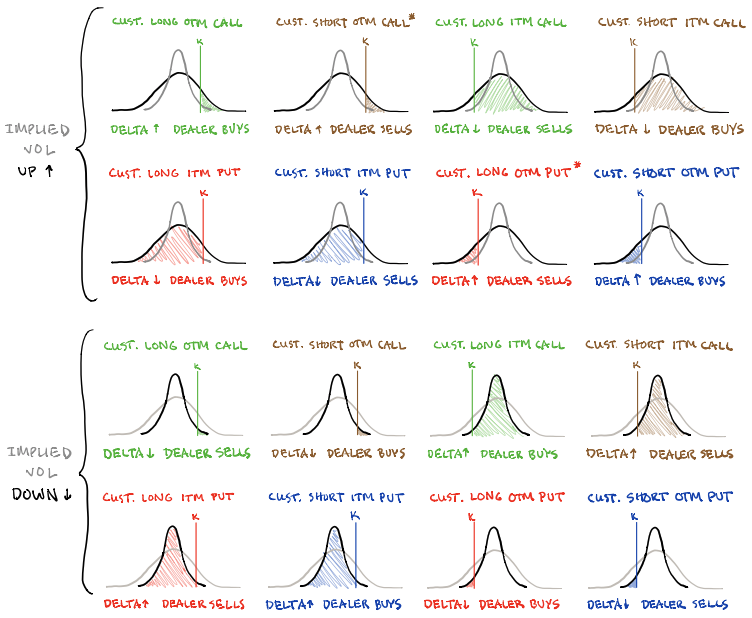
Noteworthy, was the absence of demand for protection that performs non-linearly with respect to changes in direction (delta) and volatility (vega).
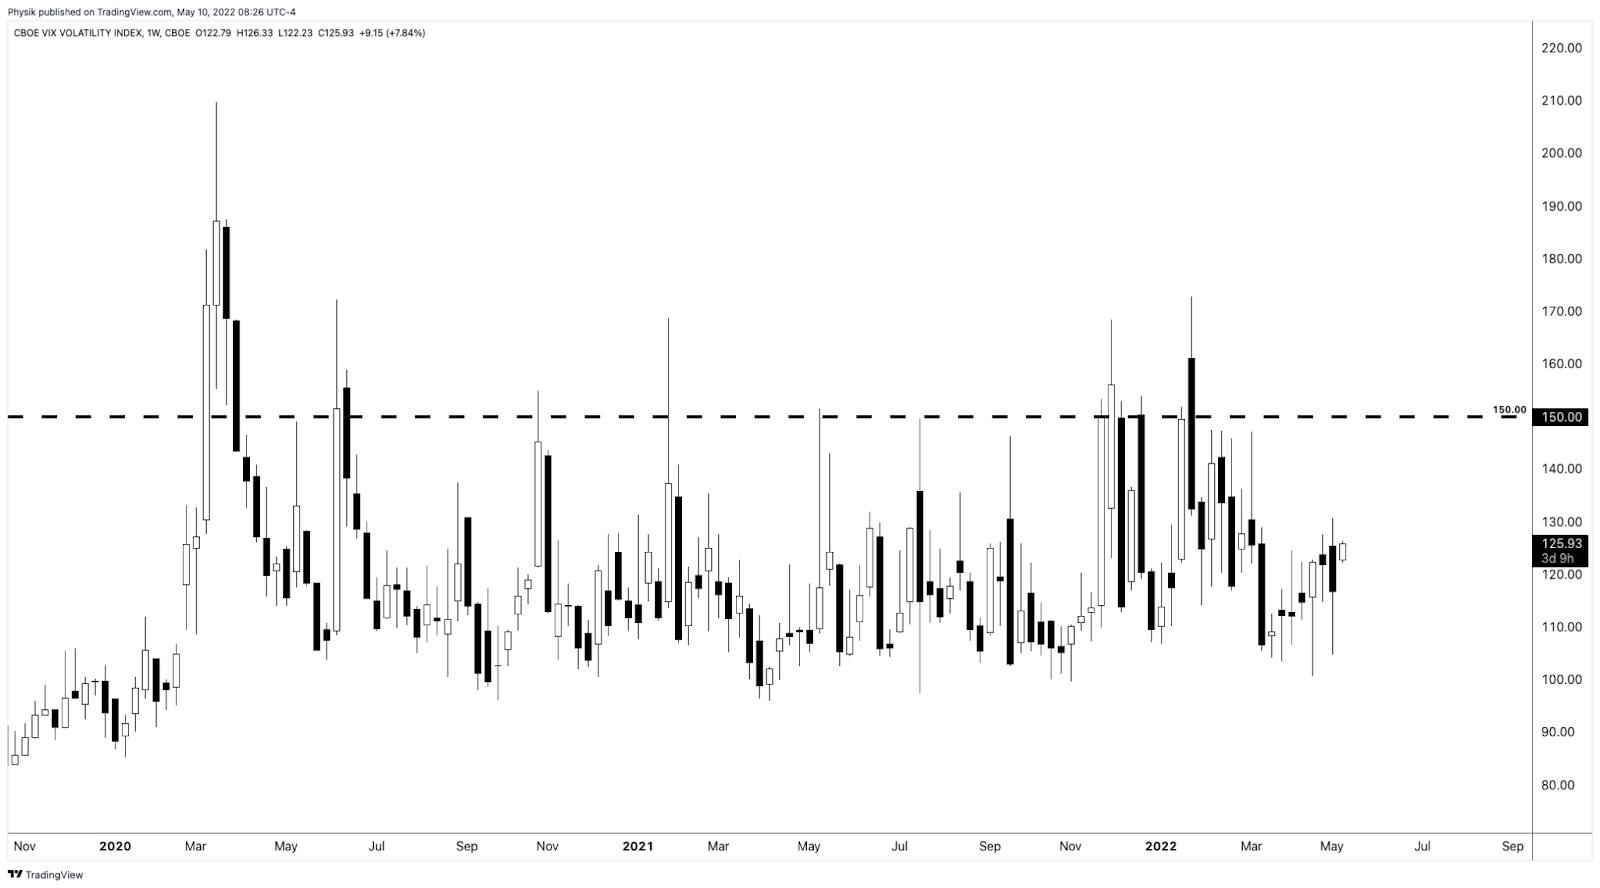
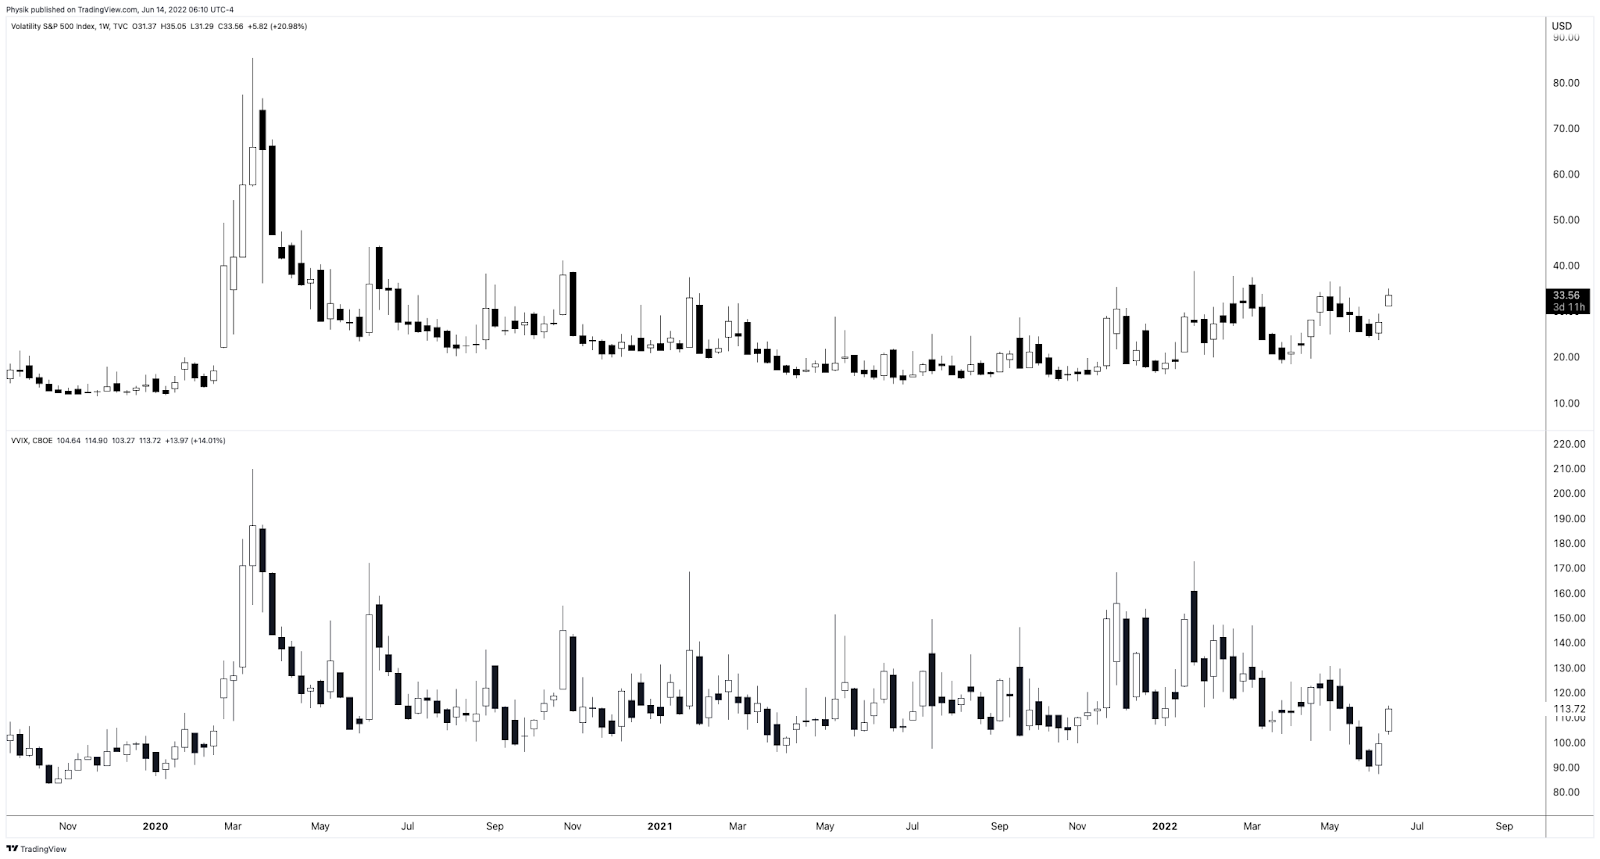
“Fixed strike vols actually caught a bid, VIX futures are in backwardation,” The Ambrus Group’s Kris Sidial explains.
“However, that spot-vol relationship in the S&P still underperformed and skew was also lackluster.”
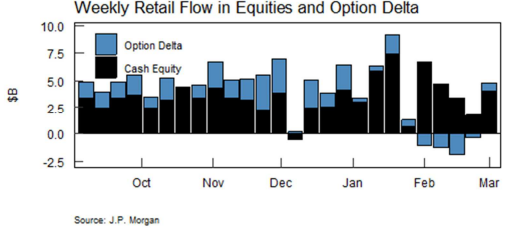
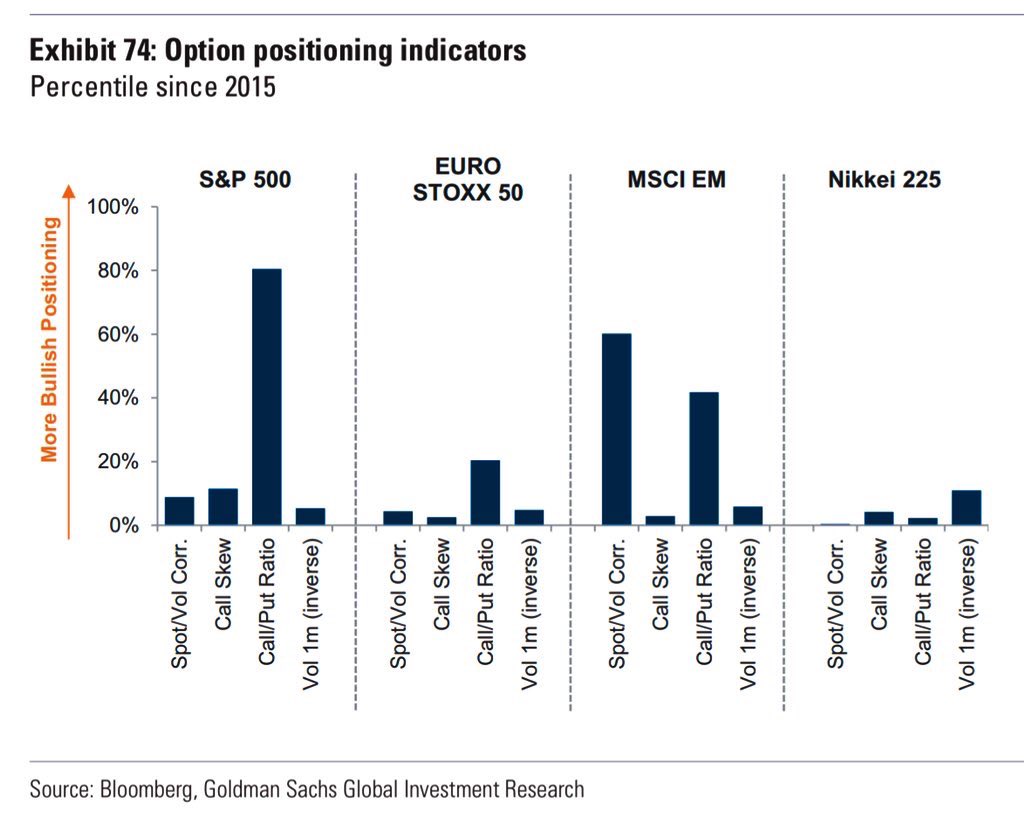
As said before, it is supply and demand dynamics that played into divergences between the volatility that the market realizes (RVOL) and that which is implied (IVOL). Participants are hedged and volatility remains well-supplied.
Was there to be forced selling and demand for protection en masse, we’d likely see that repricing in volatility we have been looking for.
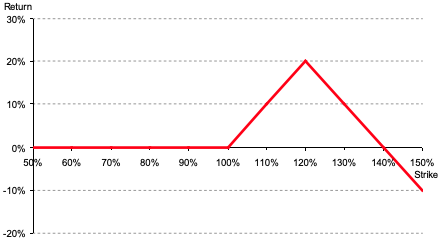
To quote Benn Eifert of QVR Advisors: “Skew goes up if vol outperforms the skew curve a lot on a selloff.”

And so, to position for that, (although it is not as opportune as it was a week ago), it continues to make sense to own volatility structures (that, one, either sold very short-dated pre-FOMC and OPEX volatility to fund that which is farther-dated or, two, buy into implied skew convexity, non-linear with respect to delta [gamma] and vega [volga] changes).
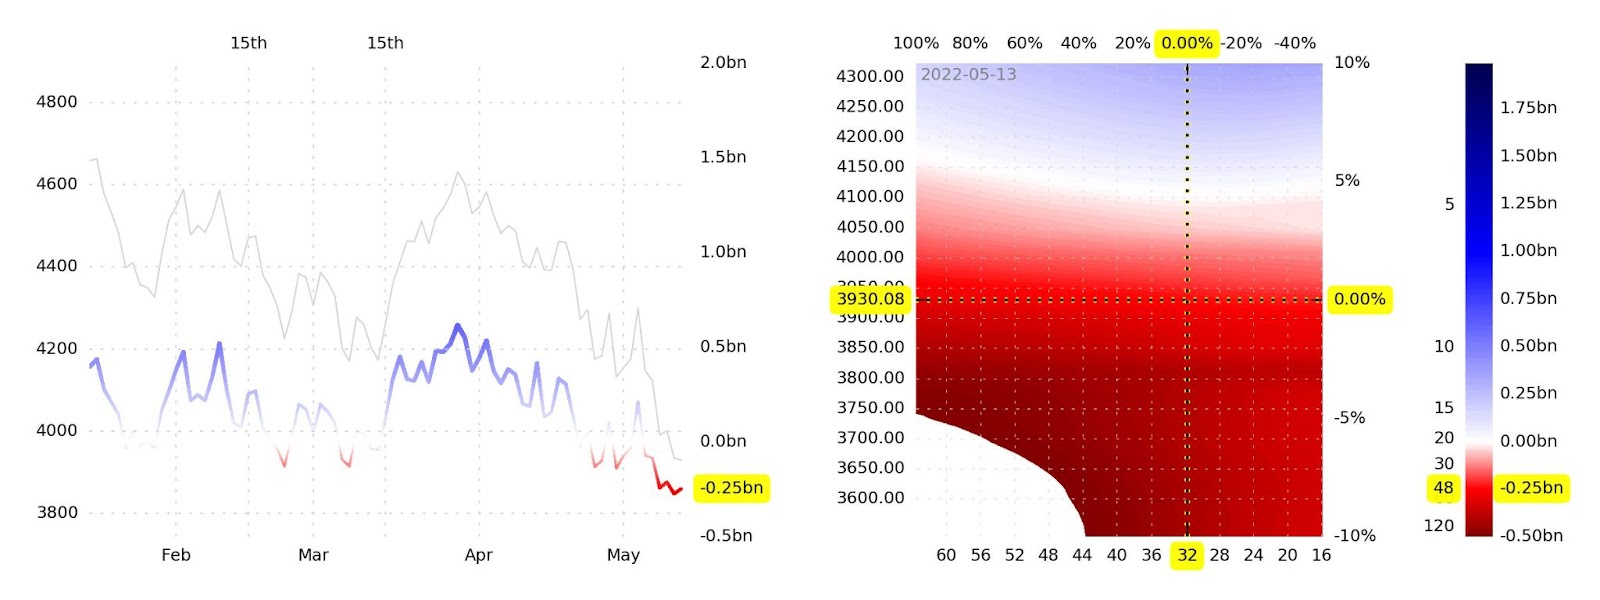
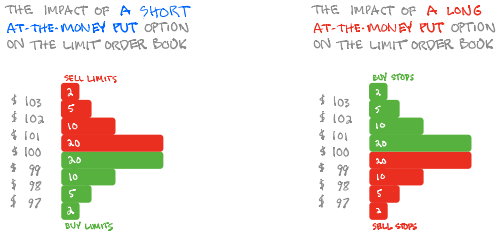
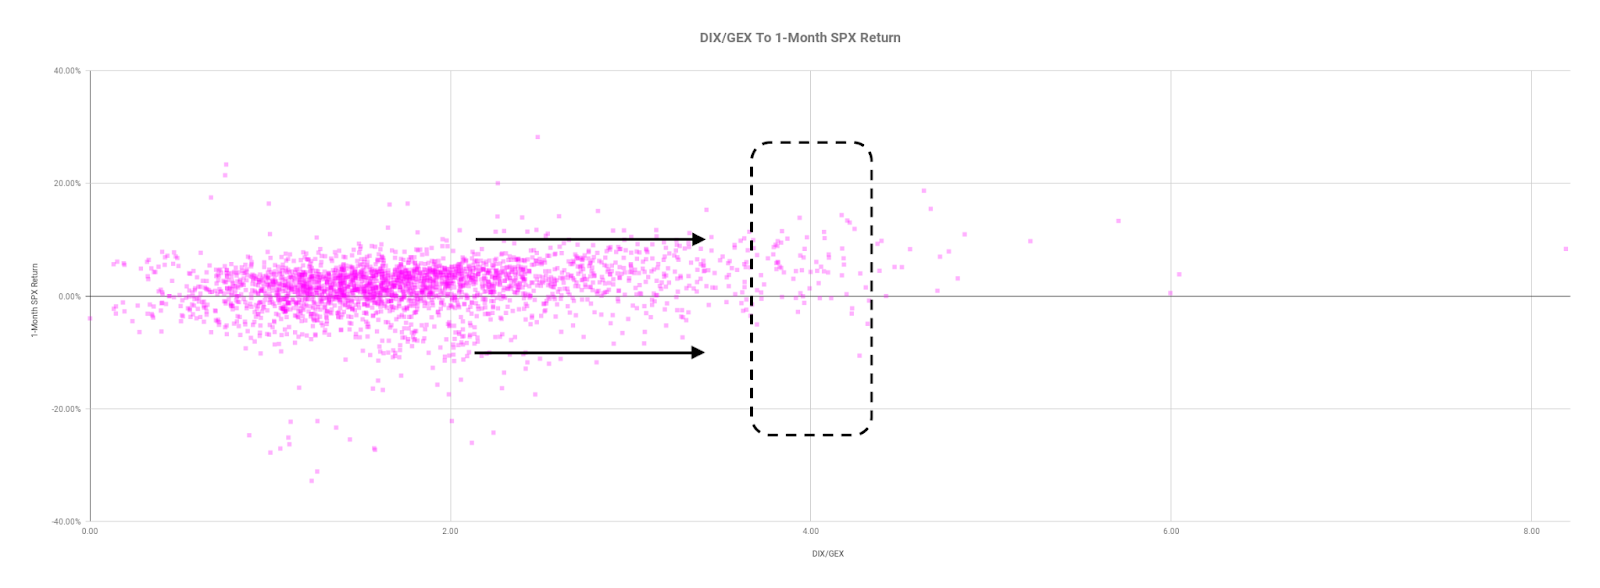
Notwithstanding, per SpotGamma, a lower bound in the market is near $3,700.00. It is at this level options flows may shift from “inducing” to “reducing” volatility as, “beneath this level, all else equal, liquidity providers would have less and less pressure to add on further weakness.”
Ultimately, it is at higher levels of volatility that the marginal impact of further volatility compression is likely to do more to bolster equity market upside as liquidity providers buy back their negative delta hedges to positive delta (short put) exposures.
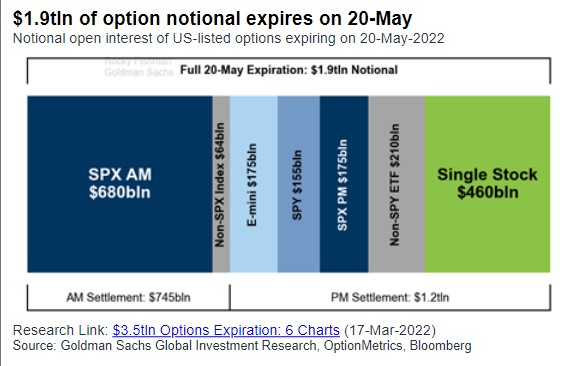
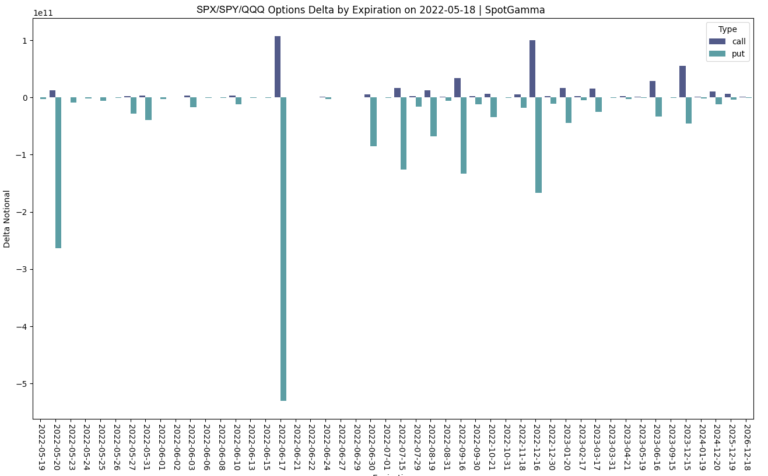
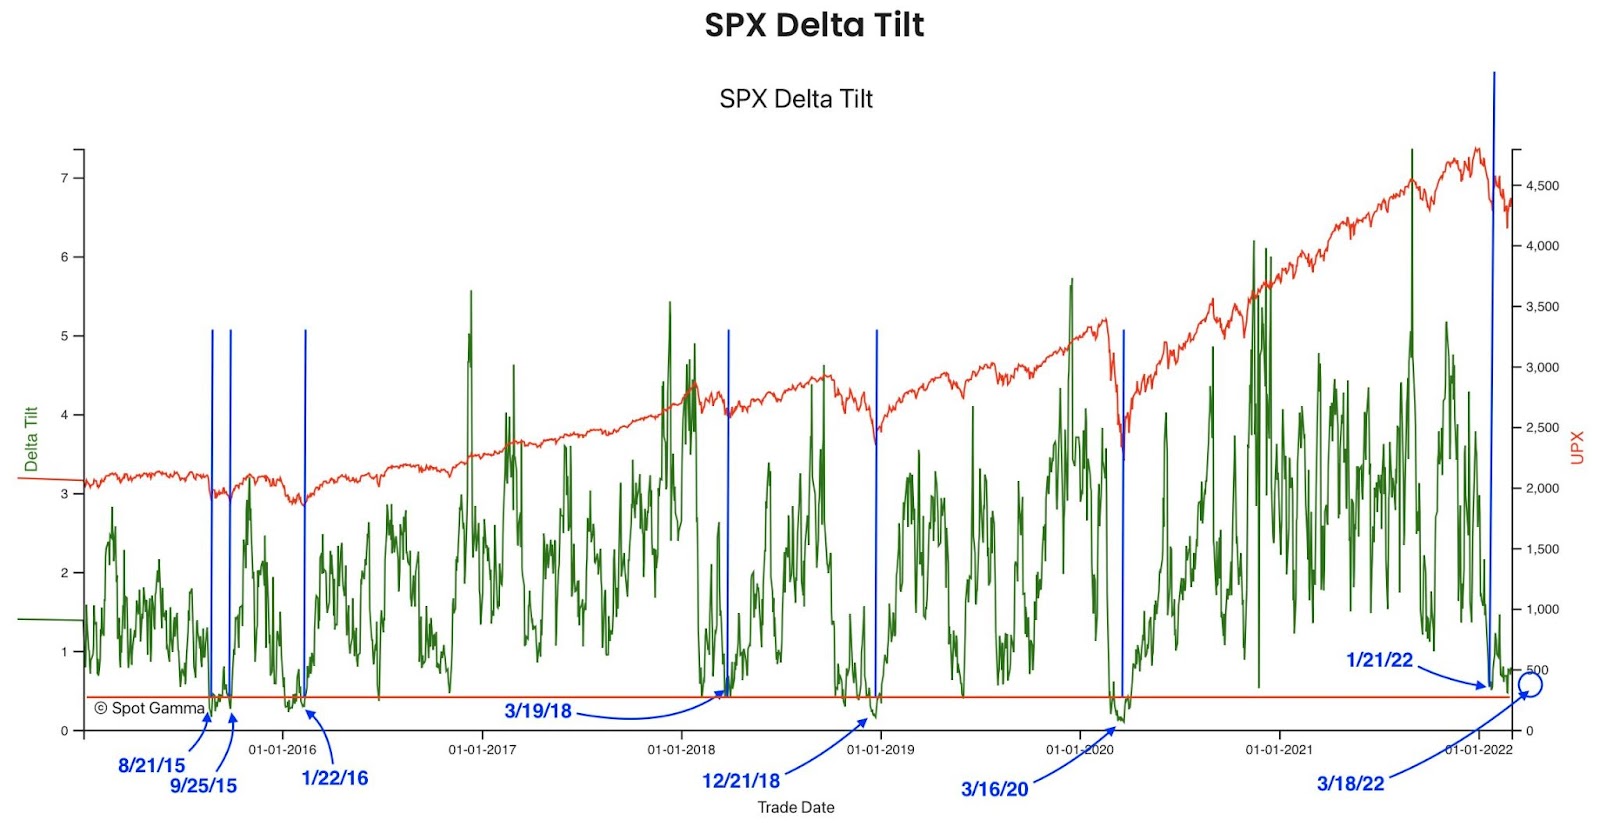
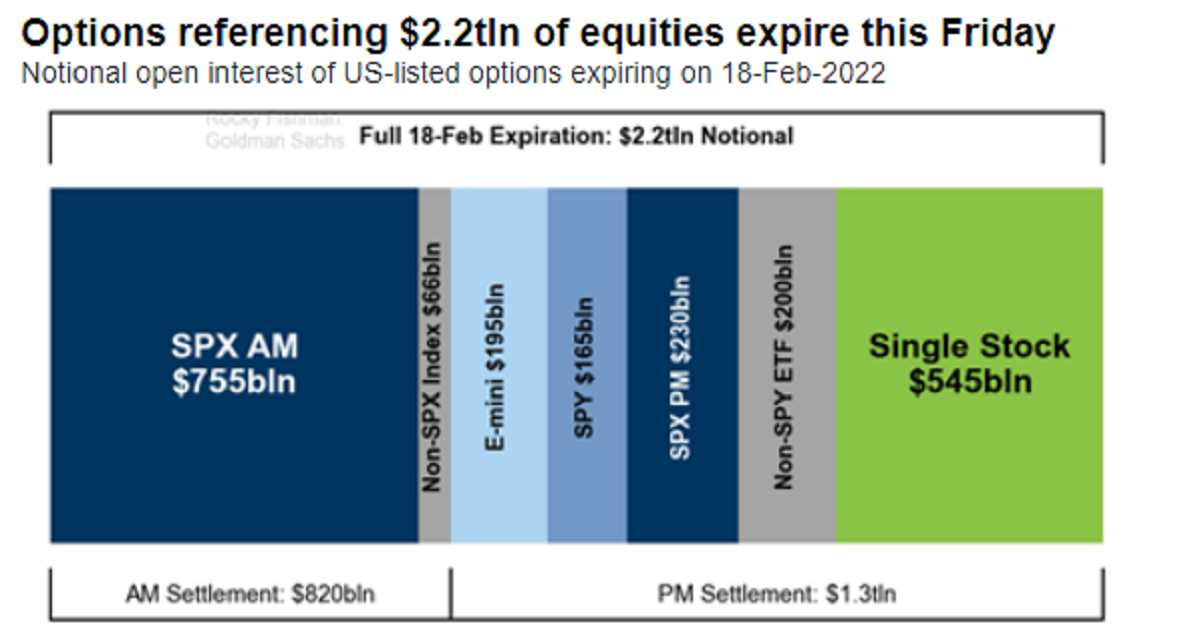
SpotGamma’s founder, Brent Kochuba, adds: “Ultimately this expiration is clearing out a lot of equity put protection, which clears the way for lower lows in the weeks and months ahead.”
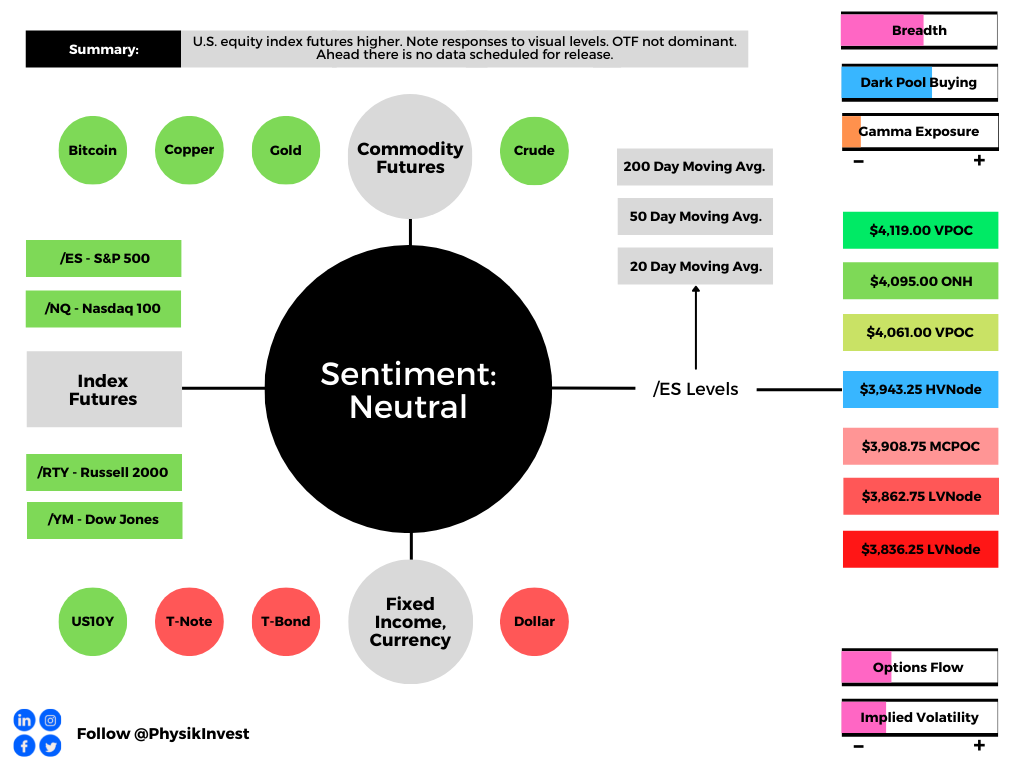
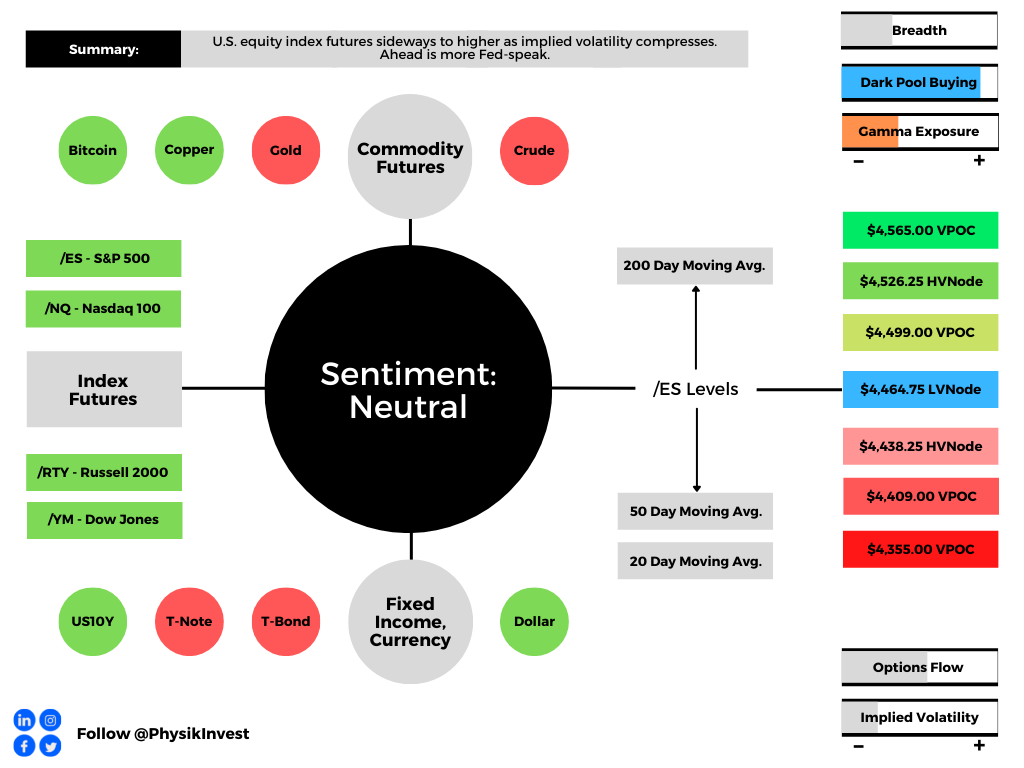
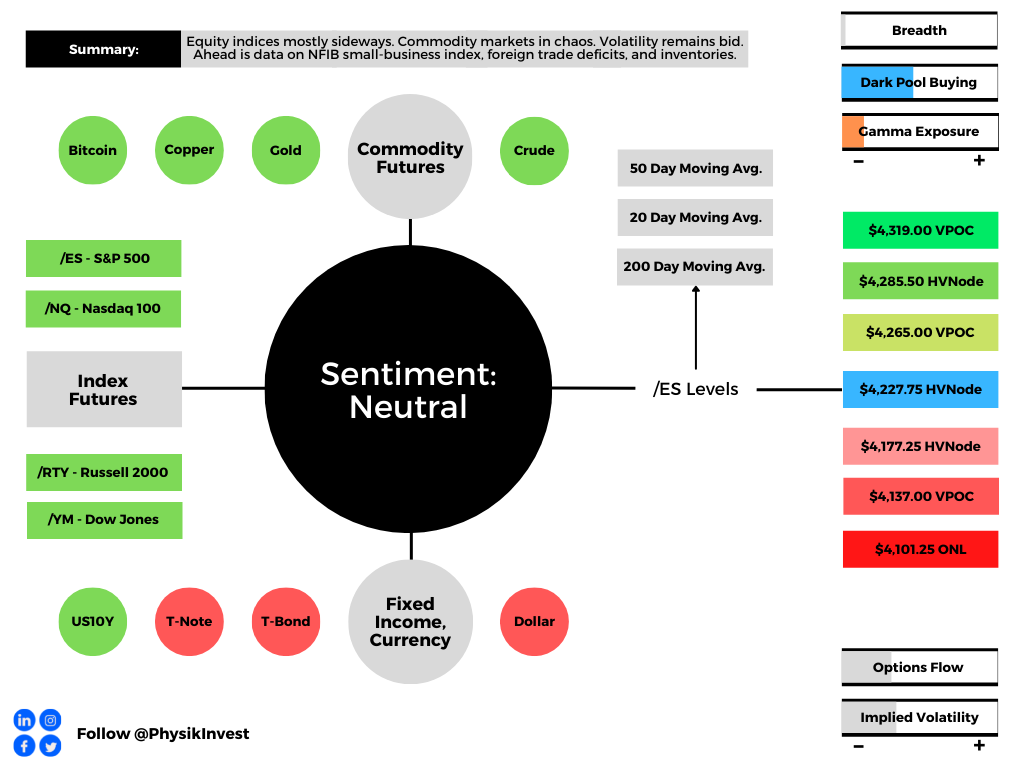
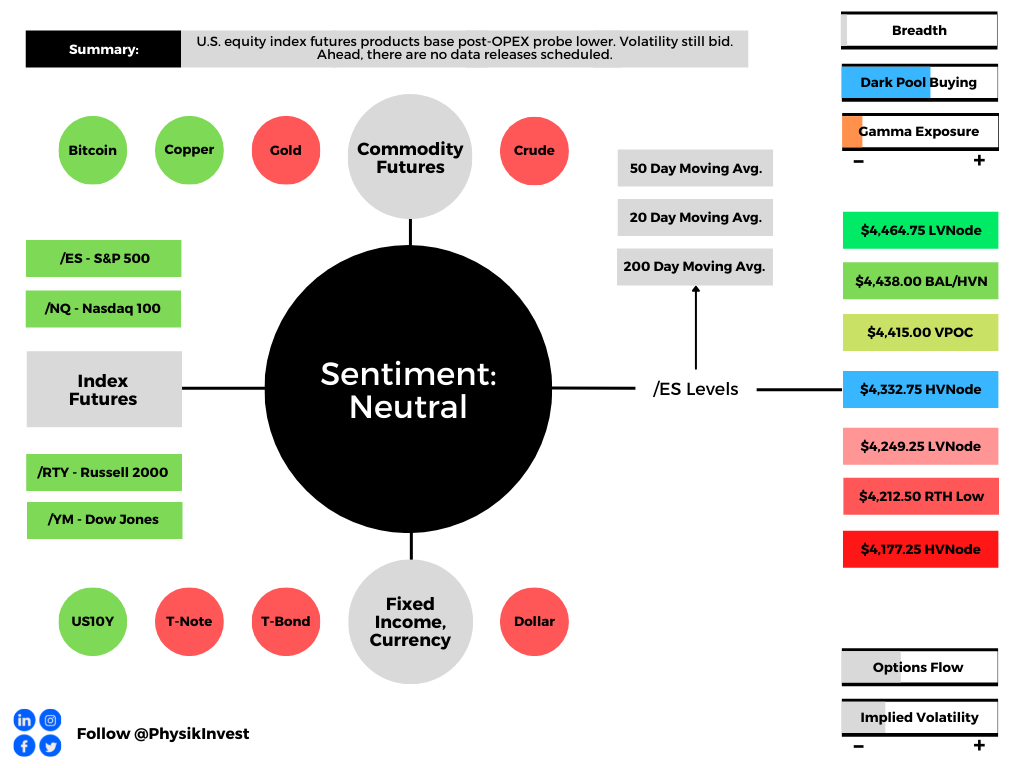
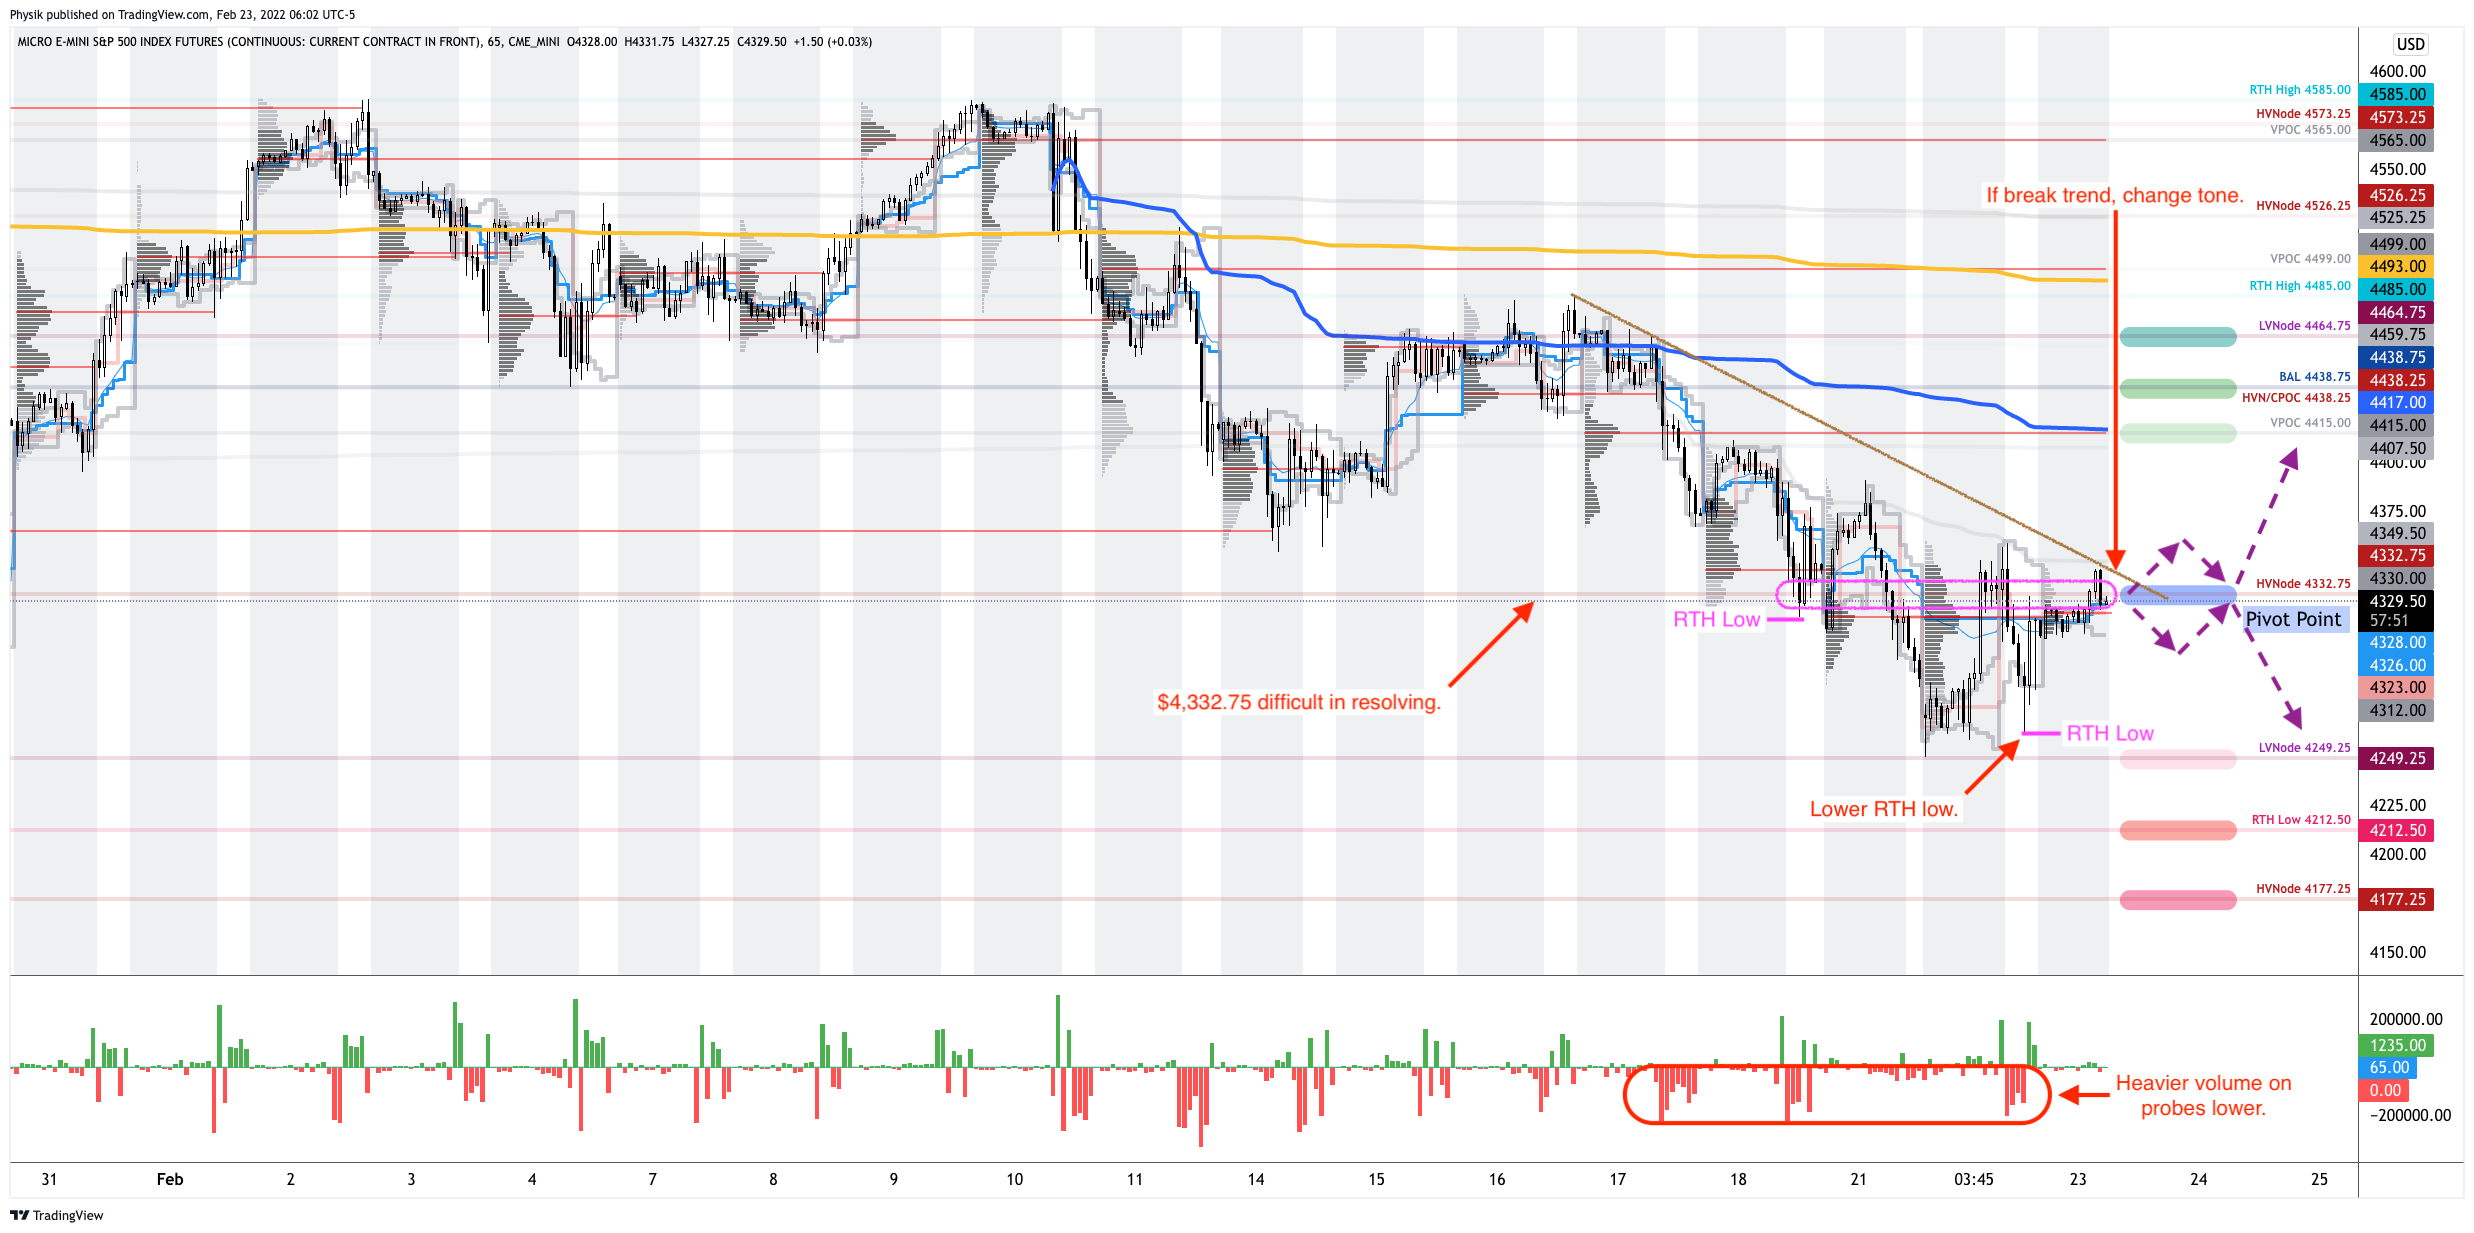
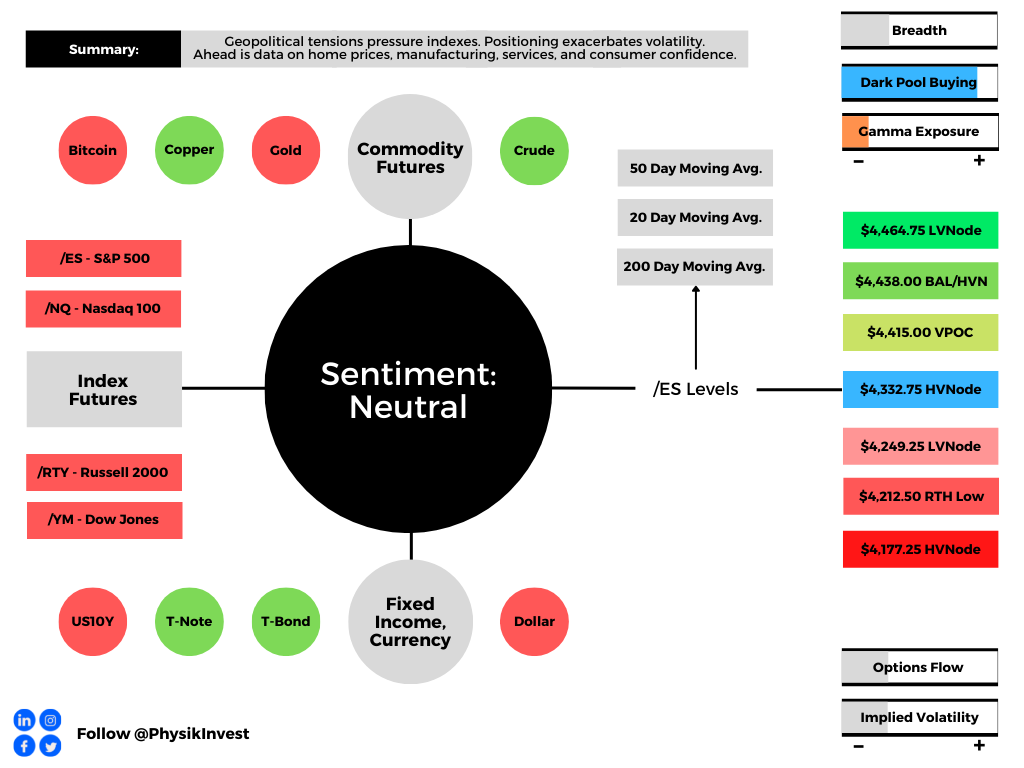
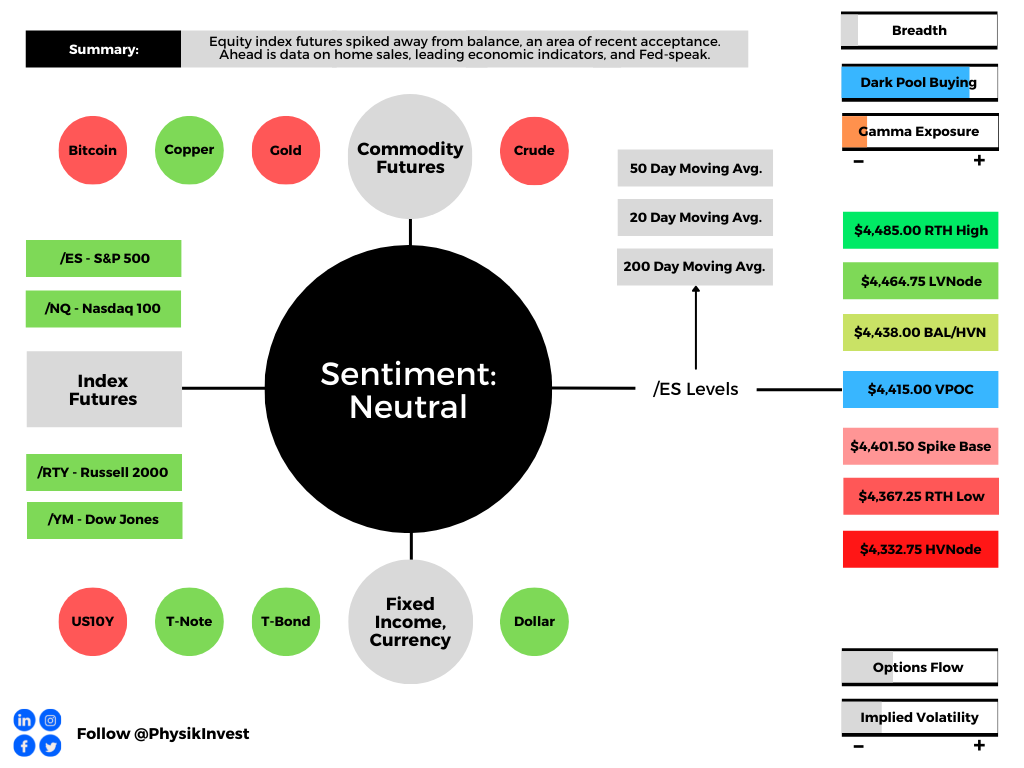
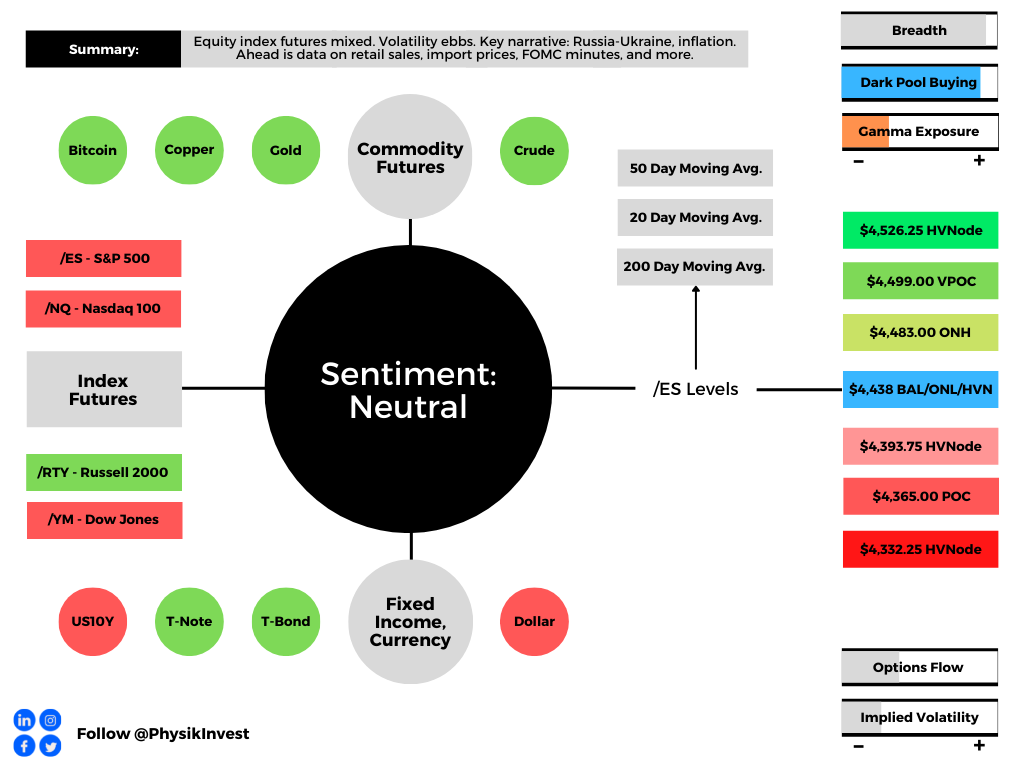
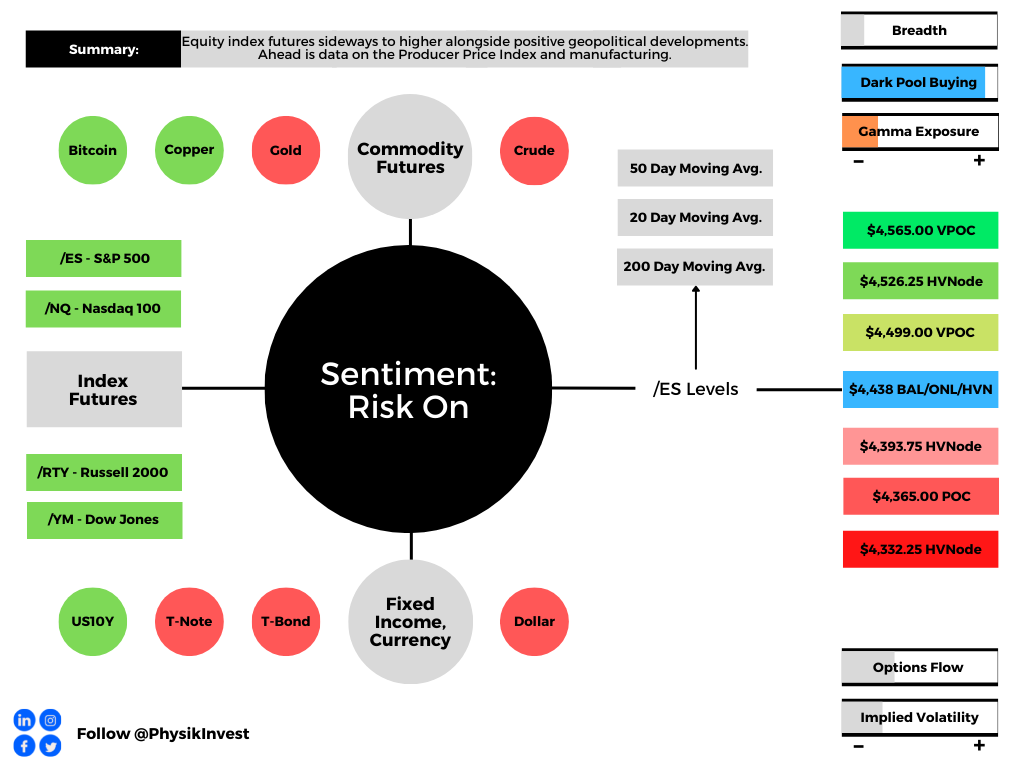
Technical: As of 6:30 AM ET, Tuesday’s regular session (9:30 AM – 4:00 PM ET), in the S&P 500, will likely open in the lower part of a positively skewed overnight inventory, inside of prior-range and -value, suggesting a limited potential for immediate directional opportunity.
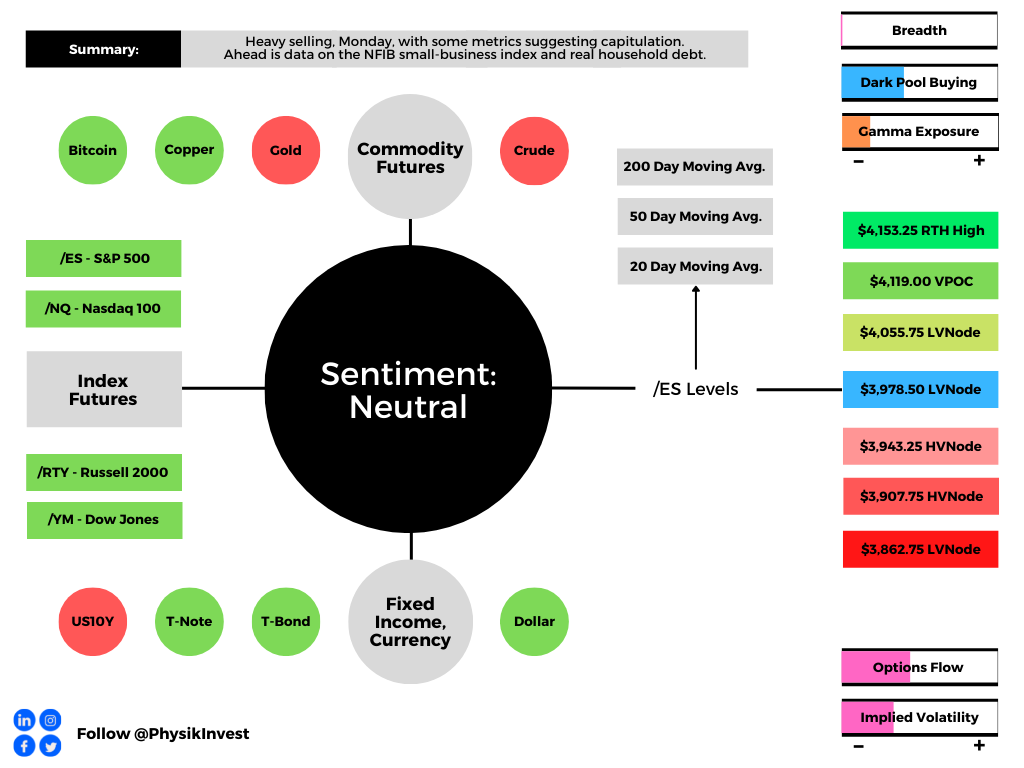
In the best case, the S&P 500 trades higher; activity above the $3,768.25 HVNode puts in play the $3,808.50 HVNode. Initiative trade beyond the $3,808.50 HVNode could reach as high as the $3,836.25 LVNode and $3,863.25 LVNode, or higher.
In the worst case, the S&P 500 trades lower; activity below the $3,768.25 HVnode puts in play the $3,727.75 HVNode. Initiative trade beyond the $3,727.75 HVNode could reach as low as the $3,688.75 and $3,664.25 HVNode, or lower.
Click here to load today’s key levels into the web-based TradingView charting platform. Note that all levels are derived using the 65-minute timeframe. New links are produced, daily.

Definitions
Volume Areas: A structurally sound market will build on areas of high volume (HVNodes). Should the market trend for long periods of time, it will lack sound structure, identified as low volume areas (LVNodes). LVNodes denote directional conviction and ought to offer support on any test.
If participants were to auction and find acceptance into areas of prior low volume (LVNodes), then future discovery ought to be volatile and quick as participants look to HVNodes for favorable entry or exit.
Point Of Control: POCs are valuable as they denote areas where two-sided trade was most prevalent in a prior day session. Participants will respond to future tests of value as they offer favorable entry and exit.
Micro Composite Point Of Control: POCs are valuable as they denote areas where two-sided trade was most prevalent over numerous day sessions. Participants will respond to future tests of value as they offer favorable entry and exit.
Volume-Weighted Average Prices (VWAPs): A metric highly regarded by chief investment officers, among other participants, for quality of trade. Additionally, liquidity algorithms are benchmarked and programmed to buy and sell around VWAPs.
About
After years of self-education, strategy development, mentorship, and trial-and-error, Renato Leonard Capelj began trading full-time and founded Physik Invest to detail his methods, research, and performance in the markets.
Capelj also develops insights around impactful options market dynamics at SpotGamma and is a Benzinga reporter.
Some of his works include conversations with ARK Invest’s Catherine Wood, investors Kevin O’Leary and John Chambers, FTX’s Sam Bankman-Fried, Kai Volatility’s Cem Karsan, The Ambrus Group’s Kris Sidial, among many others.
Disclaimer
In no way should the materials herein be construed as advice. Derivatives carry a substantial risk of loss. All content is for informational purposes only.