
Editor’s Note: The Daily Brief is a free glimpse into the prevailing fundamental and technical drivers of U.S. equity market products. Join the 200+ that read this report daily, below!
What Happened
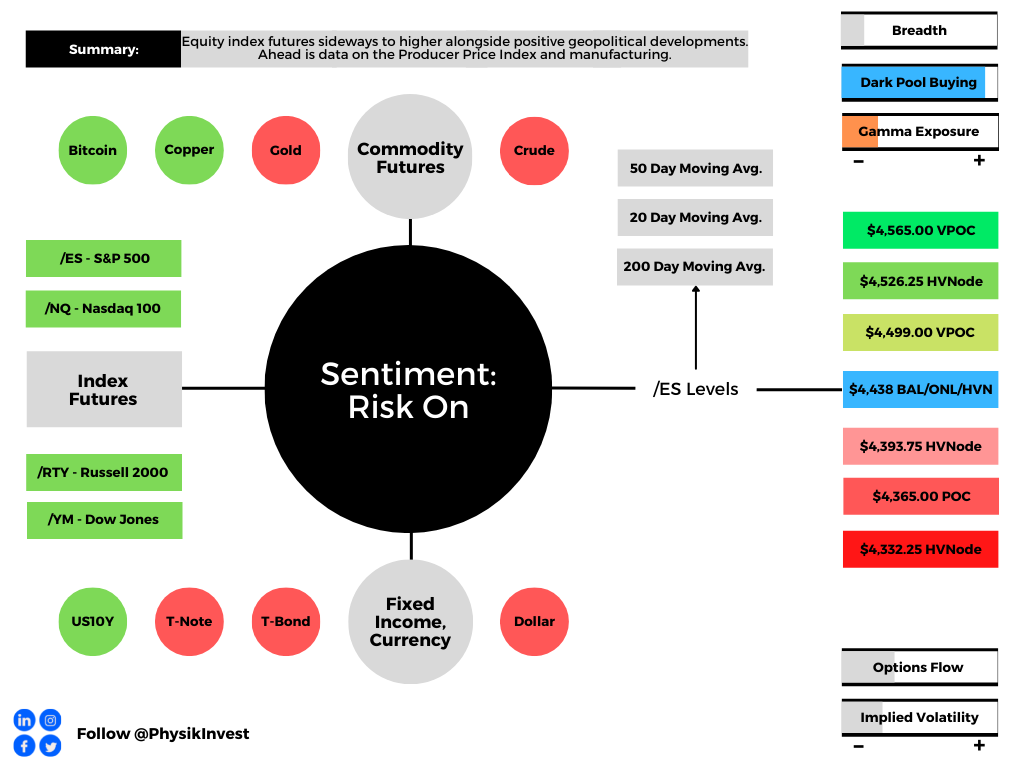
Overnight, equity index futures auctioned sharply higher after Russia announced a pullback of some forces near Ukraine.
Ahead is data on the Producer Price Index and Empire State Manufacturing Index (8:30 AM ET).
What To Expect
Fundamental: In the face of what participants feel will be an aggressive wave of monetary tightening and geopolitical tensions, markets had sold.
The number of interest-rate increases implied by the market for overnight index swaps, according to Bloomberg, increased to seven. Higher rates ding valuations, hurting most high-flying technology stocks and junk bonds.
JPMorgan Chase & Co strategists led by Marko Kolanovic suggest what the market is pricing will not materialize.
“We believe risky asset markets have mostly adjusted to monetary policy shifts by now,” the JPMorgan analysts wrote. “Short-term rates markets have likely moved too far vs. what CBs will ultimately deliver in hikes this year.”
The team at JPMorgan concludes that though the risk of conflict in Ukraine is high, the impact on global equity markets would be limited and “likely prompt a dovish reassessment by CBs.”
“We expect risky asset markets to rebound as they digest these risks and sentiment improves, aided by inflows from systematic investors and corporate buybacks.”
Pursuant to those remarks, Goldman Sachs Group Inc (NYSE: GS) “saw the largest net buying since late December (+1.0SDs), driven by risk-on flows with long buys outpacing short sales 8 to 1.”
“All regions were net bought led by North America (driven by long buys) and to a lesser extent DM Asia (driven by short covers). 8 of 11 global sectors were net bought led in $ terms by Info Tech, Materials, Financials, and Consumer Disc. Net buying in US Info Tech continued this week.”
Positioning: As much as this newsletter sounds like a broken record, not much has changed in terms of positioning.
Lower prices and higher implied volatility (the byproduct of demand for protection) compounded macro flows, exacerbating weakness.
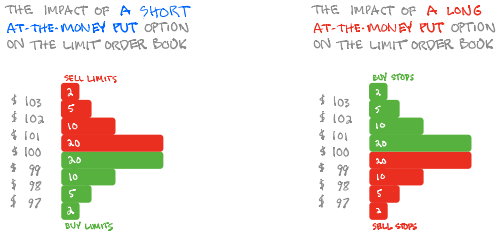
According to options modeling and analysis provider SpotGamma, “When long a put, investors are offered the potential to make asymmetric payouts. They are long gamma and have positive exposure to convexity.”
Dealers, on the other side, have the potential to realize multiplied losses if markets trade down.
“To protect against ‘blowout’ situations, dealers can and will buy puts against their existing exposure. At a certain point, the convexity of the dealers’ own insurance kicks in and basically reduces the amount of added hedges needed on increases in volatility or lower markets.”
Therefore, markets have reached a potential lower bound, in light of this dynamic. Participants, en masse, would have to commit more capital to strike prices much further down and out in time to indirectly add pressure.
Taking into account this options positioning, versus buying pressure (measured via short sales or liquidity provision on the market-making side), positioning metrics remain positively skewed.
To conclude, the dip lower and demand for protection may prime the market for upside (when volatility starts to compress again and counterparties unwind hedges to put-heavy exposures).
Technical: As of 6:30 AM ET, Tuesday’s regular session (9:30 AM – 4:00 PM ET), in the S&P 500, will likely open in the upper part of a positively skewed overnight inventory, outside of prior-range and -value, suggesting a potential for immediate directional opportunity.
Gap Scenarios: Gaps ought to fill quickly. Should they not, that’s a signal of strength; do not fade. Leaving value behind on a gap-fill or failing to fill a gap (i.e., remaining outside of the prior session’s range) is a go-with indicator.

Auctioning and spending at least 1-hour of trade back in the prior range suggests a lack of conviction; in such a case, do not follow the direction of the most recent initiative activity.
In the best case, the S&P 500 trades higher; activity above the $4,438.00 puts in play the $4,499.00 untested point of control (VPOC). Initiative trade beyond the VPOC could reach as high as the $4,526.25 high volume area (HVNode) and $4,565.00 VPOC, or higher.
In the worst case, the S&P 500 trades lower; activity below the $4,438.00 puts in play the $4,393.75 HVNode. Initiative trade beyond the HVNode could reach as low as the $4,365.00 POC and $4,332.25 HVNode, or lower.
Click here to load today’s key levels into the web-based TradingView charting platform. Note that all levels are derived using the 65-minute timeframe. New links are produced, daily.

What People Are Saying
Definitions
Overnight Rally Highs (Lows): Typically, there is a low historical probability associated with overnight rally-highs (lows) ending the upside (downside) discovery process.
Volume Areas: A structurally sound market will build on areas of high volume (HVNodes). Should the market trend for long periods of time, it will lack sound structure, identified as low volume areas (LVNodes). LVNodes denote directional conviction and ought to offer support on any test.
If participants were to auction and find acceptance into areas of prior low volume (LVNodes), then future discovery ought to be volatile and quick as participants look to HVNodes for favorable entry or exit.
POCs: POCs are valuable as they denote areas where two-sided trade was most prevalent in a prior day session. Participants will respond to future tests of value as they offer favorable entry and exit.
About
After years of self-education, strategy development, mentorship, and trial-and-error, Renato Leonard Capelj began trading full-time and founded Physik Invest to detail his methods, research, and performance in the markets.
Capelj is also a Benzinga finance and technology reporter interviewing the likes of Shark Tank’s Kevin O’Leary, JC2 Ventures’ John Chambers, FTX’s Sam Bankman-Fried, and ARK Invest’s Catherine Wood, as well as a SpotGamma contributor developing insights around impactful options market dynamics.
Disclaimer
Physik Invest does not carry the right to provide advice.
In no way should the materials herein be construed as advice. Derivatives carry a substantial risk of loss. All content is for informational purposes only.