Editor’s Note: The Daily Brief is a free glimpse into the prevailing fundamental and technical drivers of U.S. equity market products. Join the 200+ that read this report daily, below!
What Happened
During holiday and overnight trade, U.S. equity index futures probed below trading ranges established the week prior. Strong buying surfaced after a test of a key visual area.
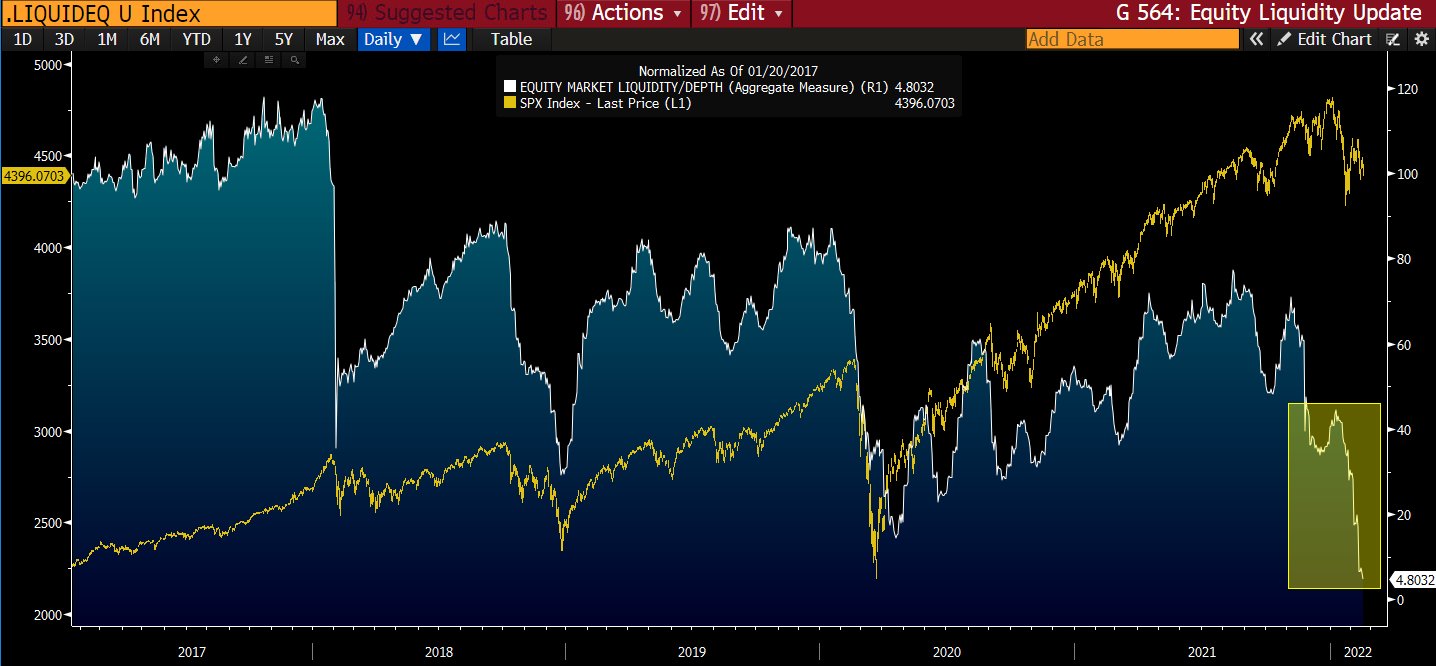
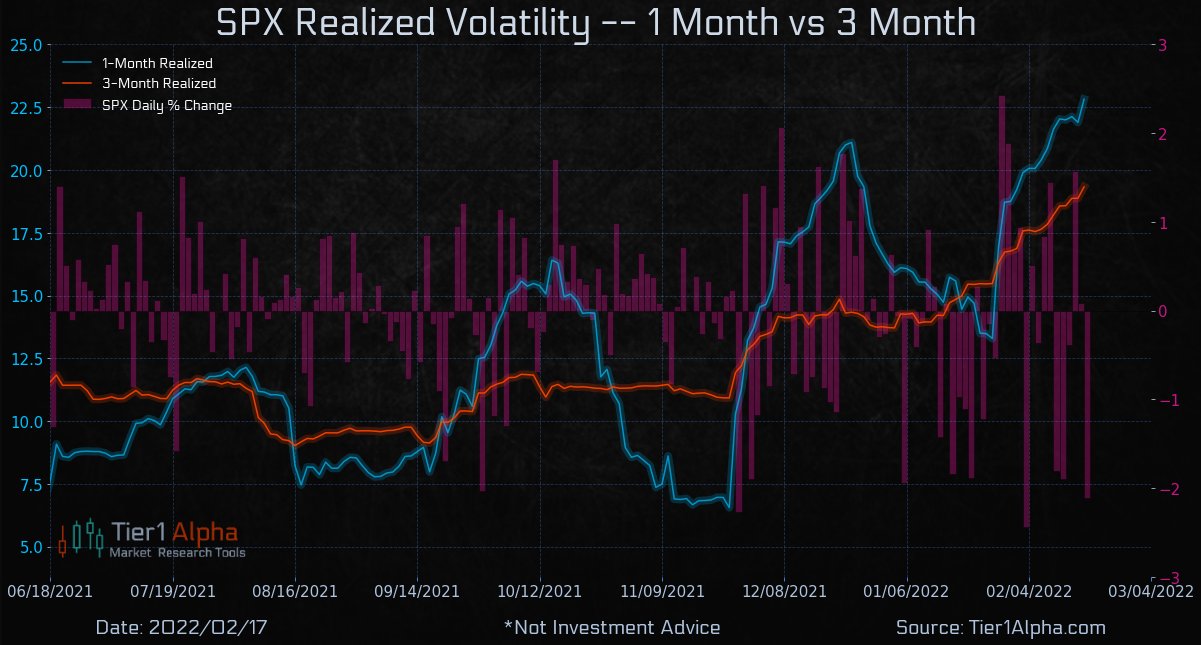
Increased implied volatility (IV) to pressure markets as counterparties hedge directional risks. Present options positioning, combined with liquidity measures, suggest big moves up and down.
Ahead is data on the S&P Case-Shiller home price index and FHFA home price index (9:00 AM ET), Markit manufacturing and services PMI (9:45 AM ET), as well as the consumer confidence index (10:00 AM ET).
What To Expect
Fundamental: Are markets in turmoil?
Depends. Abroad, yes. At home, yes (but not as much).
Russian stocks, alongside Russia-Ukraine angst, sank the most since the 2008 financial crisis, pressuring markets in other parts of the world, as well. Russia’s MOEX Index plunged ~14% Monday.
The geopolitical disputes come alongside the threat of contractionary monetary policy.
Some, however, say the risk premium expansion driven by inflation and tightening fears has run its course.
According to a note published by Andy Constan of Damped Spring Advisors, “We believe that risk premium expansion has peaked. A new low … will require more than frontrunning but Fed action that is not currently priced into markets.”
That is as Mark Haefele, chief investment officer at UBS Group AG’s (NYSE: UBS) Global Wealth Management arm says that “Despite the recent volatility, it’s important to remember that we are still in an environment of robust economic and earnings growth.”
“Our base case we expect upside for equity markets over the balance of the year.”
JPMorgan Chase & Co’s (NYSE: JPM) Mislav Matejka adds that stock pessimism is wrong and positioning for a recession would be too early given favorable financing conditions, strong labor, an underleveraged consumer, as well as strong cash flows and bank balance sheets.
“We believe one should look through the widespread ‘slowdown’ calls that are currently in vogue, and stay bullish on banks, mining, energy, insurance, autos, travel and telecoms,” Matejka and his team wrote noting, too, that market internals are “bullish again.”
Does this mean that markets are positioned for a near-term bounce? Let’s see.
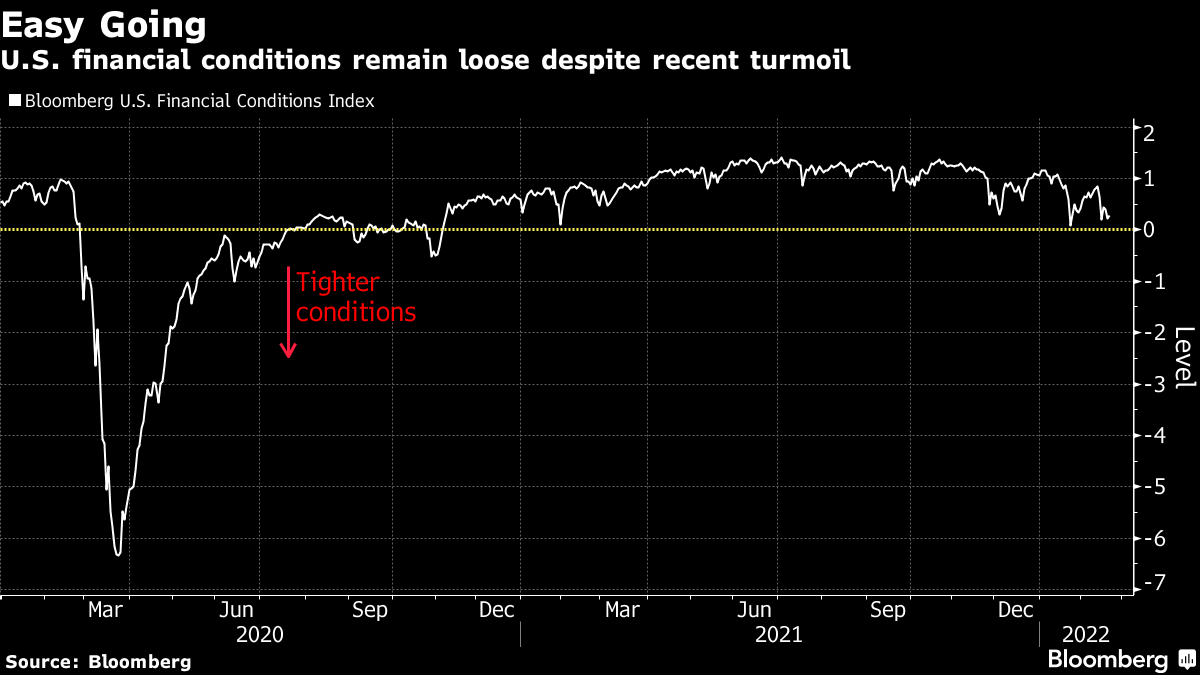
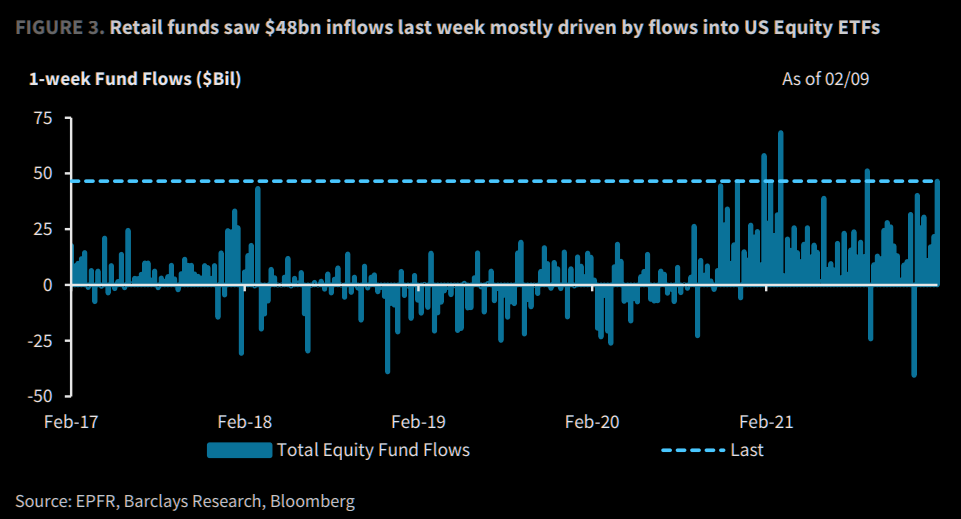
Positioning: As noted last week, passive buying flows continue to persist alongside a drop in bearish sentiment readings and bond market outflow readings which “have actually lined up closer to bottoms in the equity market.”
This is as participants’ demand for protection (negative delta exposure) left dealers (on the other side and warehousing risk) adding negative delta exposure linearly (via stock and futures sales) to hedge.
To note, owning an option offers someone positive exposure to gamma or convexity (to have profits multiplied if the direction is correct, all else equal). On the other side, though, participants who are short gamma or convexity may have their losses multiplied if incorrect.
Making some naive assumptions on the build-in interest in options strikes at lower prices, we may surmise that dealers were exposed to increased negative gamma exposure.
To hedge this, if volatility were to remain unchanged, dealers would sell (buy) into weakness (strength) to hedge increasing (decreasing) negative gamma exposure.
If volatility rises (drops), then more stock and futures must be sold (bought/covered).

Moreover, Friday’s monthly options expiration (OPEX) coincided with the removal of lots of put-heavy exposures. This will decrease the dealers’ positive exposure to delta and make gamma exposures less negative.
Therefore, absent some exogenous event that increases demand for protection, again, there is the potential for strength, post-OPEX. Volatility compression would mark down dealer positive delta and therefore coincide with positive “vanna” flows that bolster attempts higher.
Technical: As of 6:30 AM ET, Monday’s regular session (9:30 AM – 4:00 PM ET), in the S&P 500, will likely open in the upper part of its overnight inventory, inside of prior-range and -value, suggesting a limited potential for immediate directional opportunity.
Gap Scenarios May Be In Play: Gaps ought to fill quickly. Should they not, that’s a signal of strength; do not fade. Leaving value behind on a gap-fill or failing to fill a gap (i.e., remaining outside of the prior session’s range) is a go-with indicator.

Auctioning and spending at least 1-hour of trade back in the prior range suggests a lack of conviction; in such a case, do not follow the direction of the most recent initiative activity.
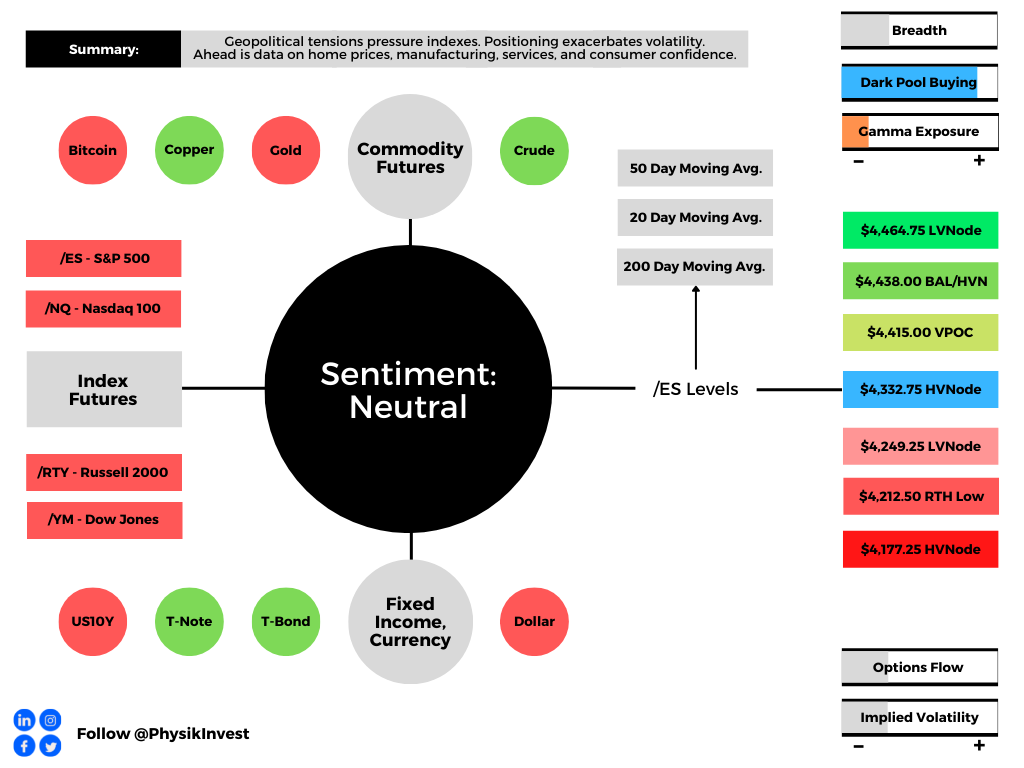
In the best case, the S&P 500 trades higher; activity above the $4,332.75 high volume area (HVNode) puts in play the $4,415.00 untested point of control (VPOC). Initiative trade beyond the VPOC could reach as high as the $4,438.00 key response area and $4,464.00 low volume area (LVNode), or higher.
In the worst case, the S&P 500 trades lower; activity below the $4,332.75 HVNode puts in play the $4,249.00 LVNode. Initiative trade beyond the LVNode could reach as low as the $4,212.50 regular trade low (RTH Low) and $4,177.25 HVNode, or lower.
Click here to load today’s key levels into the web-based TradingView charting platform. Note that all levels are derived using the 65-minute timeframe. New links are produced, daily.

What People Are Saying
Definitions
Volume Areas: A structurally sound market will build on areas of high volume (HVNodes). Should the market trend for long periods of time, it will lack sound structure, identified as low volume areas (LVNodes). LVNodes denote directional conviction and ought to offer support on any test.
If participants were to auction and find acceptance into areas of prior low volume (LVNodes), then future discovery ought to be volatile and quick as participants look to HVNodes for favorable entry or exit.
Liquidation Breaks: The profile shape suggests participants were “too” long and had poor
Vanna: The rate at which the delta of an option changes with respect to volatility.
Charm: The rate at which the delta of an option changes with respect to time.
Options: If an option buyer was short (long) stock, he or she would buy a call (put) to hedge upside (downside) exposure. Option buyers can also use options as an efficient way to gain directional exposure.
POCs: POCs are valuable as they denote areas where two-sided trade was most prevalent in a prior day session. Participants will respond to future tests of value as they offer favorable entry and exit.
About
After years of self-education, strategy development, mentorship, and trial-and-error, Renato Leonard Capelj began trading full-time and founded Physik Invest to detail his methods, research, and performance in the markets.
Capelj is also a Benzinga finance and technology reporter interviewing the likes of Shark Tank’s Kevin O’Leary, JC2 Ventures’ John Chambers, FTX’s Sam Bankman-Fried, and ARK Invest’s Catherine Wood, as well as a SpotGamma contributor developing insights around impactful options market dynamics.
Disclaimer
Physik Invest does not carry the right to provide advice.
In no way should the materials herein be construed as advice. Derivatives carry a substantial risk of loss. All content is for informational purposes only.