
Physik Invest’s Daily Brief is read free by thousands of subscribers. Join this community to learn about the fundamental and technical drivers of markets.
Fundamental
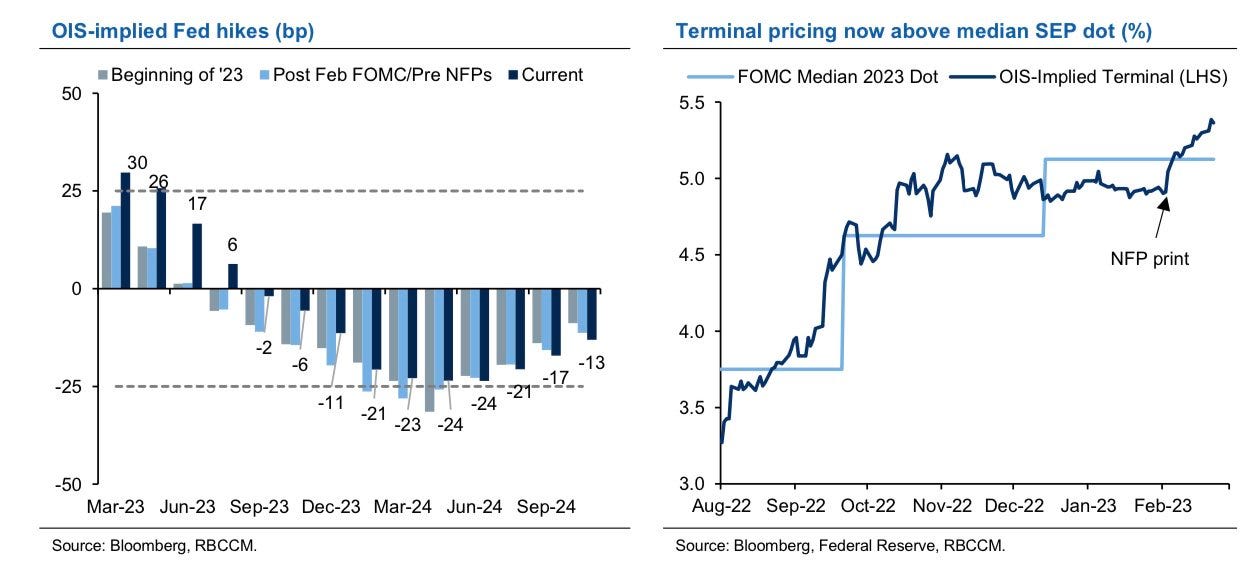
Bloomberg’s John Authers summarized well the release of the Federal Open Market Committee (FOMC) meeting minutes. He said that almost all officials “supported a step down in the pace of tightening by 25 basis points, while a ‘few’ favored or could have supported a bigger 50 basis-point hike. Nobody wanted to stop straightaway.”
“Participants observed that a restrictive policy stance would need to be maintained until the incoming data provided confidence that inflation was on a sustained downward path to 2%, which was likely to take some time,” the minutes said.
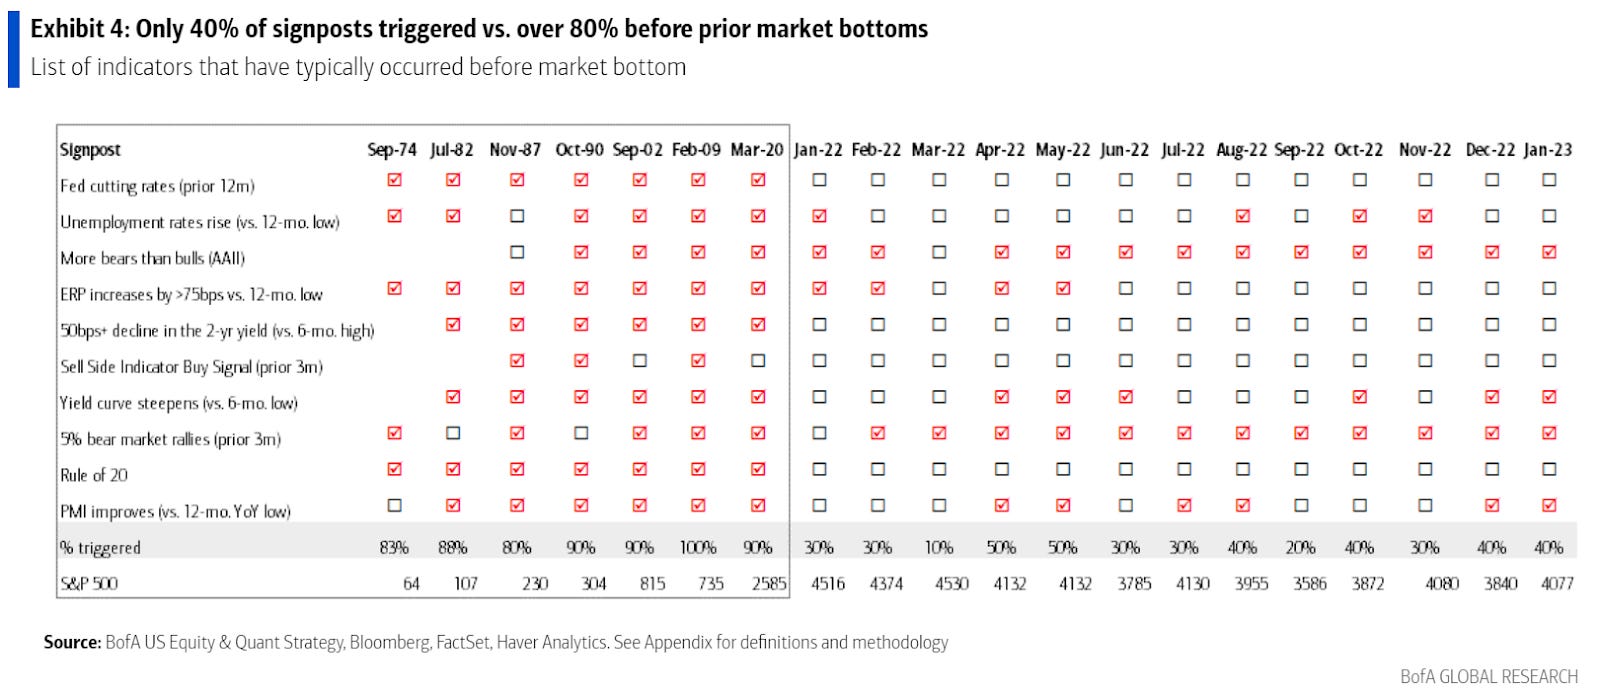
Notwithstanding hits to markets like housing, which news has concentrated on, the S&P 500 (INDEX: SPX) is trading about 18x forward price-to-earnings, Bank of America Corporation (NYSE: BAC) said, the highest since March 2022 and 20% above the last decade’s average P/E.
Per Savita Subramanian, “the traditional Rule of 20 … holds that the multiple should be whatever number results by subtracting the inflation rate from 20 — which with inflation at 6.4% would imply that the P/E needs to fall to 13.6.”
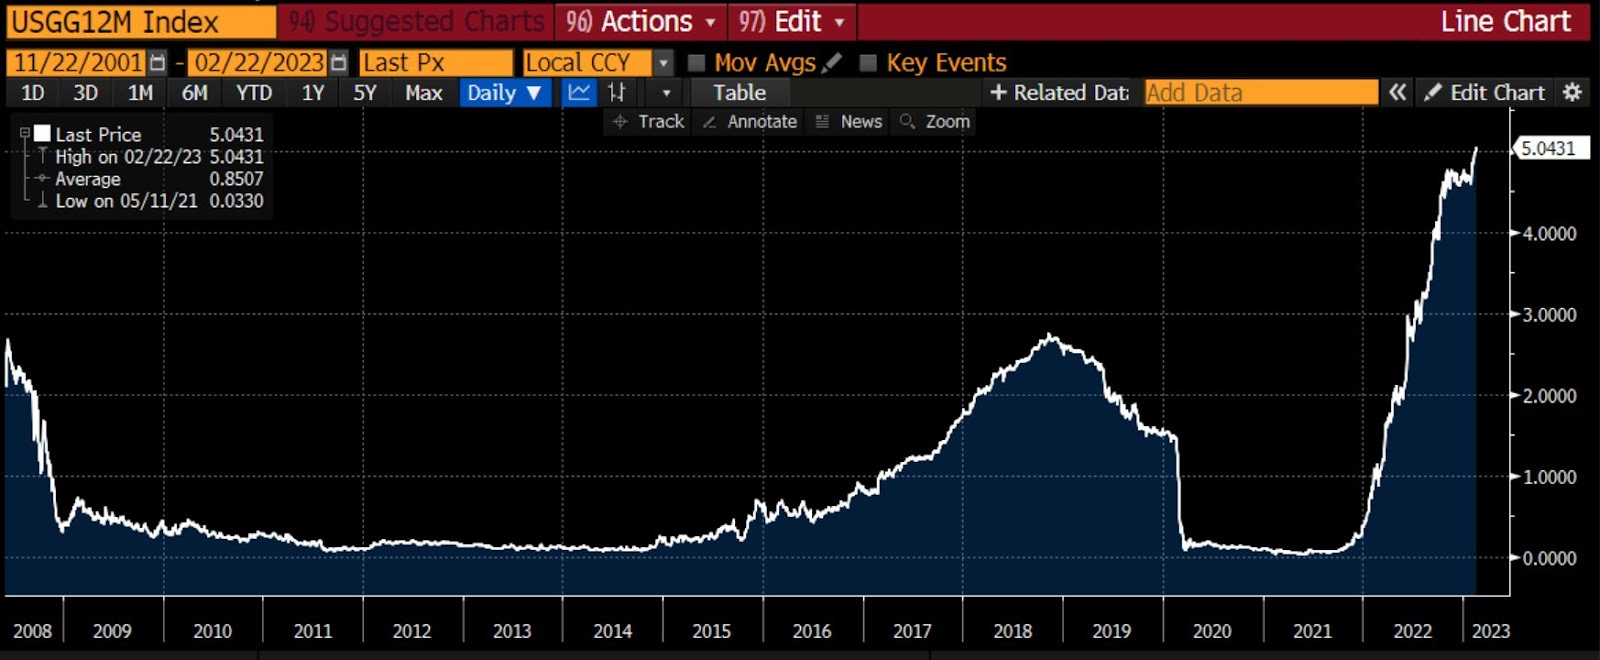
Recall yesterday’s letter discussing the “risk-reward of holding bonds [looking] better than equity (earnings yield).”
Positioning
The SPX’s decline is orderly and contained.
However, the break below $4,000.00 SPX did open the door to a “liquidity hole,” SpotGamma explained. New information has traders anticipating more equity market downside; traders are “reset[ing] to lower equity valuations” on the higher-for-longer rate narrative all the while “vanna and gamma hedging serve to pull markets lower.”
The contexts for a far-reaching rally are weak. A change in the context is likely to coincide with charged options values (i.e., wound implied volatility or big put delta).
Technical
As of 6:30 AM ET, Thursday’s regular session (9:30 AM – 4:00 PM ET), in the S&P 500, is likely to open in the middle part of a positively skewed overnight inventory, inside of the prior day’s range, suggesting a limited potential for immediate directional opportunity.
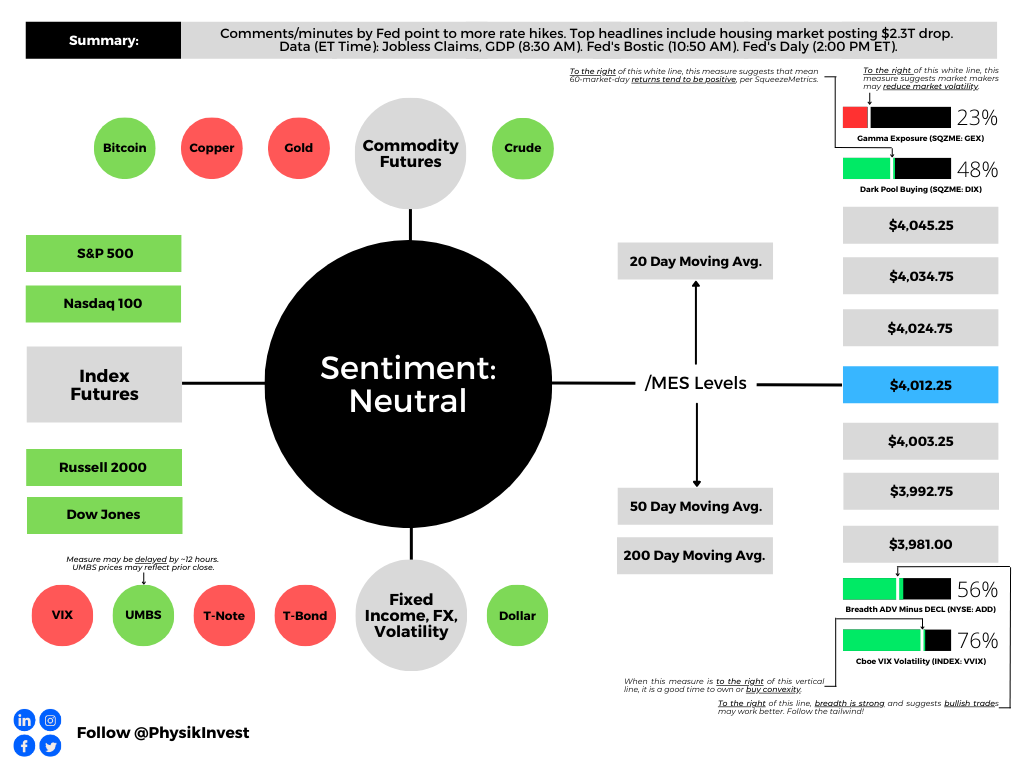
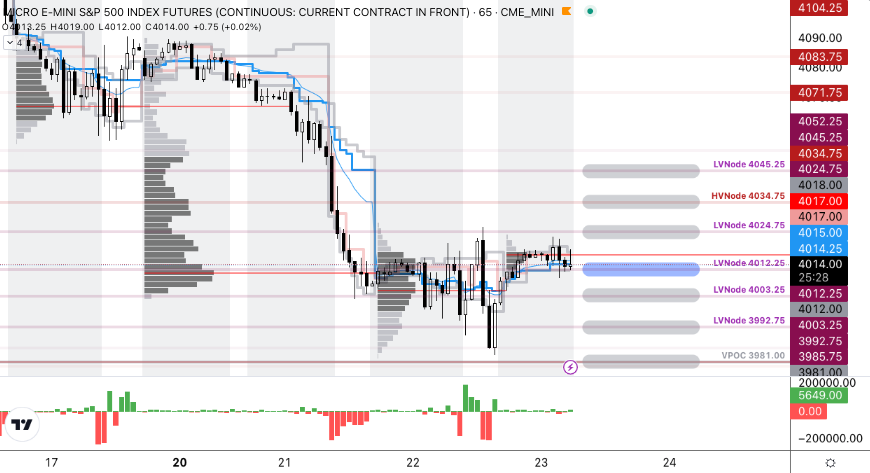
The S&P 500 (FUTURE: /MES) pivot for today is $4,012.25.
Key levels to the upside include $4,024.75, $4,034.75, and $4,045.25.
Key levels to the downside include $4,003.25, $3,992.75, and $3,981.00.
Disclaimer: Click here to load the updated key levels via the web-based TradingView platform. New links are produced daily. Quoted levels likely hold barring an exogenous development.
Definitions
Volume Areas: Markets will build on areas of high-volume (HVNodes). Should the market trend for a period of time, this will be identified by a low-volume area (LVNodes). The LVNodes denote directional conviction and ought to offer support on any test.
If participants auction and find acceptance in an area of a prior LVNode, then future discovery ought to be volatile and quick as participants look to the nearest HVNodes for more favorable entry or exit.
Delta: An option’s exposure to the direction or underlying asset movement.
Gamma: The sensitivity of an option’s delta to changes in the underlying asset’s price.
Vanna: The rate at which the delta of an option changes with respect to implied volatility.
POCs: Areas where two-sided trade was most prevalent in a prior day session. Participants will respond to future tests of value as they offer favorable entry and exit.
About
The author, Renato Leonard Capelj, works in finance and journalism.
Capelj spends the bulk of his time at Physik Invest, an entity through which he invests and publishes free daily analyses to thousands of subscribers. The analyses offer him and his subscribers a way to stay on the right side of the market. Separately, Capelj is an options analyst at SpotGamma and an accredited journalist.
Capelj’s past works include conversations with investor Kevin O’Leary, ARK Invest’s Catherine Wood, FTX’s Sam Bankman-Fried, North Dakota Governor Doug Burgum, Lithuania’s Minister of Economy and Innovation Aušrinė Armonaitė, former Cisco chairman and CEO John Chambers, and persons at the Clinton Global Initiative.
Connect
Direct queries to renato@physikinvest.com. Find Physik Invest on Twitter, LinkedIn, Facebook, and Instagram. Find Capelj on Twitter, LinkedIn, and Instagram. Only follow the verified profiles.
Calendar
You may view this letter’s content calendar at this link.
Disclaimer
Do not construe this newsletter as advice. All content is for informational purposes. Capelj and Physik Invest manage their own capital and will not solicit others for it.


