Physik Invest’s Daily Brief is read by over 1,200 people. To join this community and learn about the fundamental and technical drivers of markets, subscribe below.
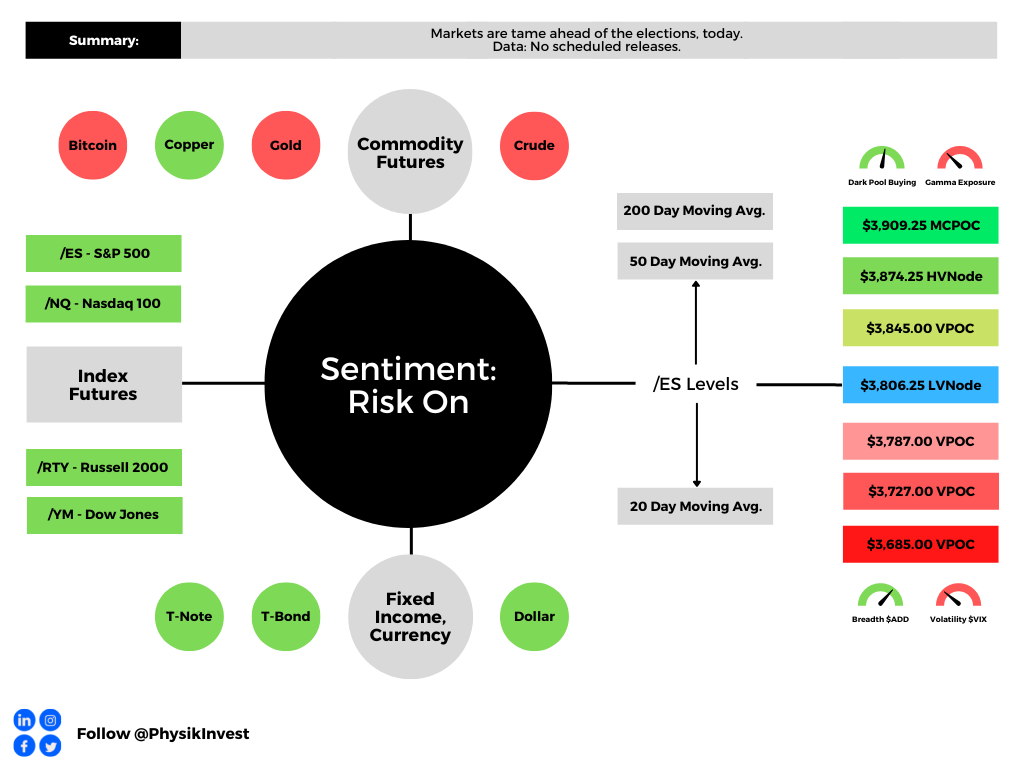
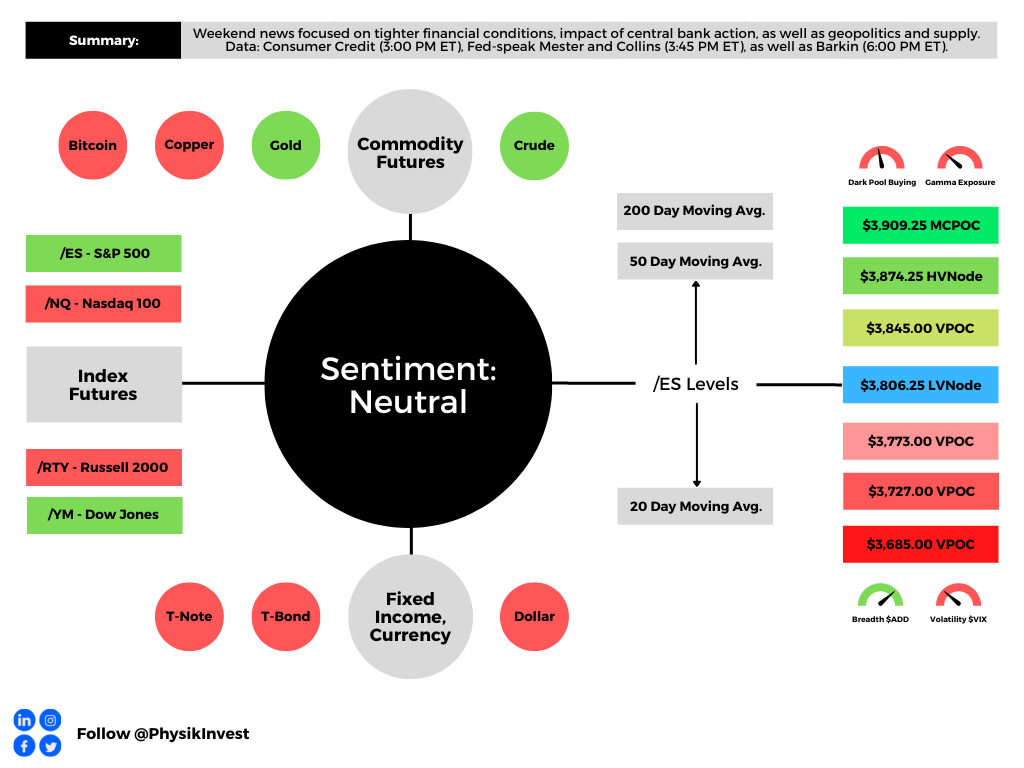
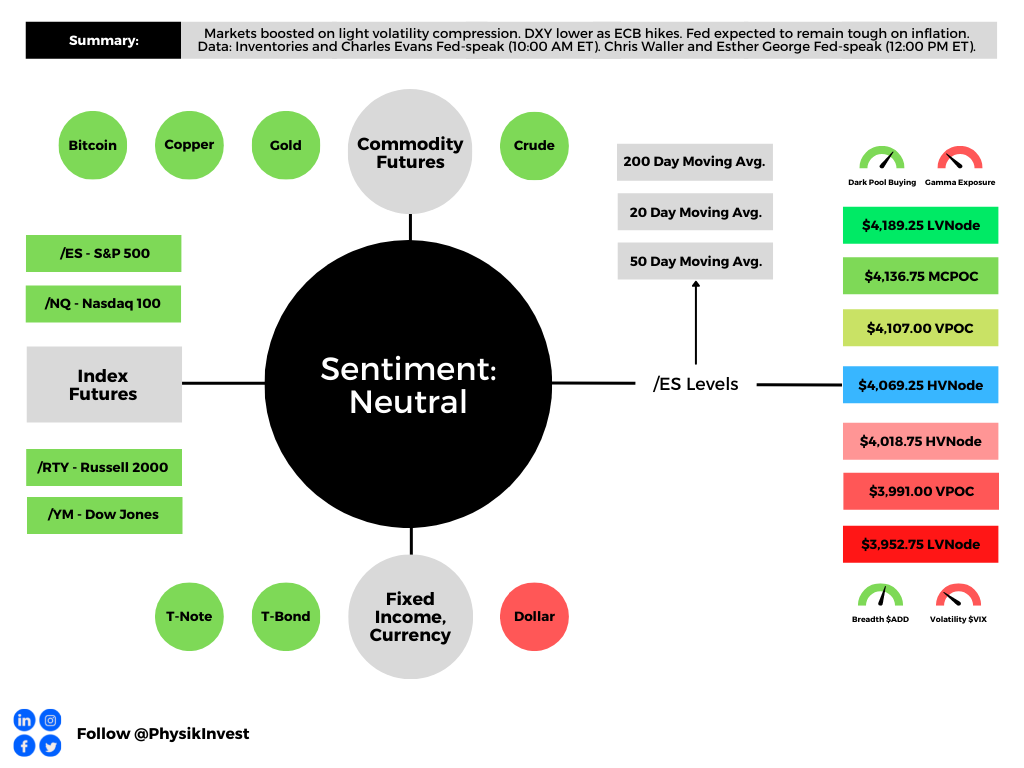
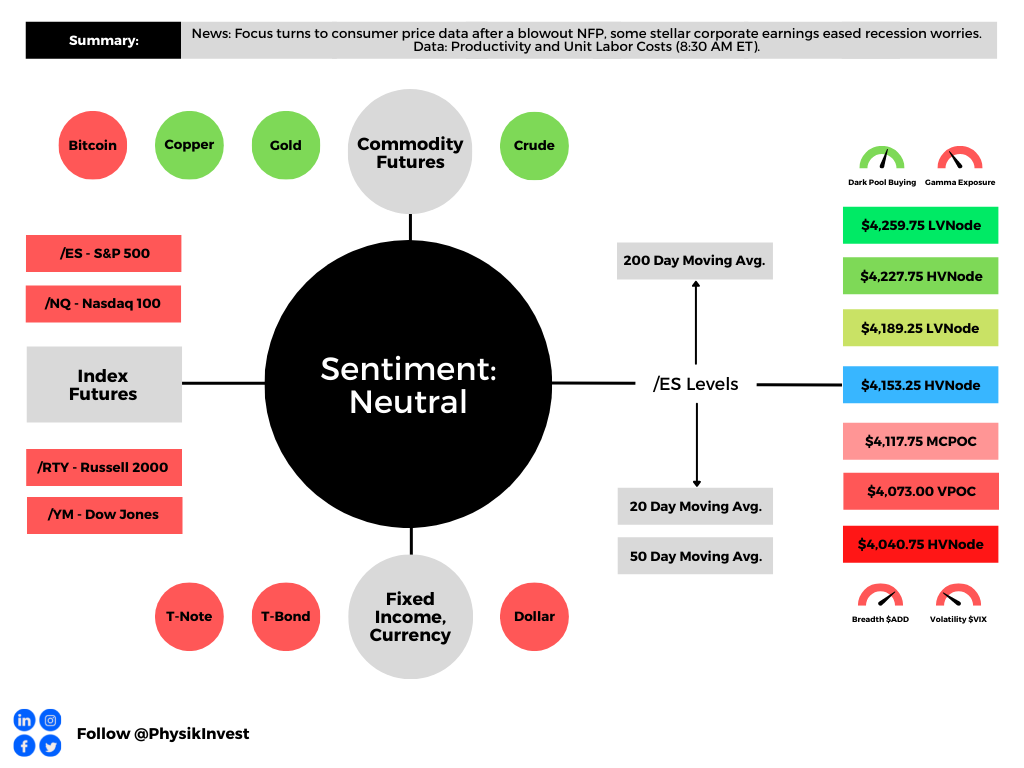
Graphic updated 6:50 AM ET. Sentiment Neutral if expected /ES open is inside of the prior day’s range. /ES levels are derived from the profile graphic at the bottom of this letter. Levels may have changed since initially quoted; click here for the latest levels. SqueezeMetrics Dark Pool Index (DIX) and Gamma (GEX) with the latter calculated based on where the prior day’s reading falls with respect to the MAX and MIN of all occurrences available. A higher DIX is bullish. At the same time, the lower the GEX, the more (expected) volatility. Click to learn the implications of volatility, direction, and moneyness. Breadth reflects a reading of the prior day’s NYSE Advance/Decline indicator. VIX reflects a current reading of the CBOE Volatility Index (INDEX: VIX) from 0-100.
Positioning
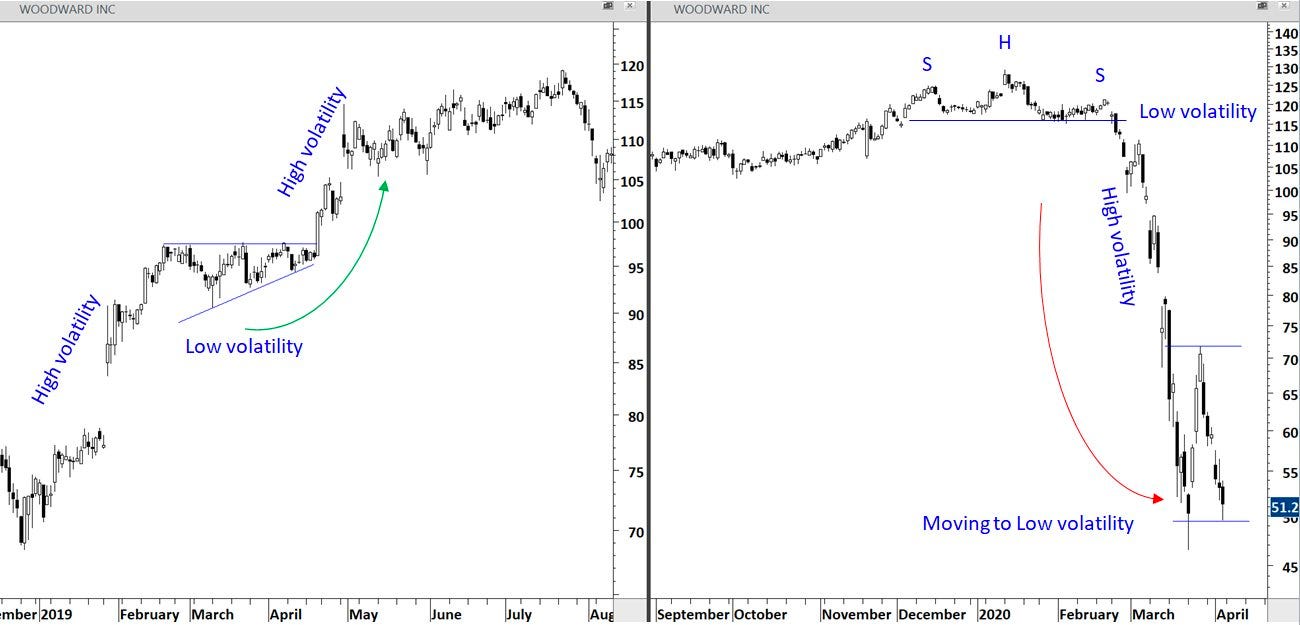
Aksel Kibar of Tech Charts said it well: There are two types of trades.
“1) Trades that you take moving from low volatility to high volatility [and] 2) trades that you take in high volatility while moving to low volatility.”
Like Kibar, we aim to be well-positioned for a move from low to high volatility. In short, that is where we are today. After an expansion of range to the upside, markets are trading sideways, in a tight range, and traders’ recent activities are likely to keep the status quo intact a bit longer.
Notwithstanding, we are likely nearing an expansion of realized volatility (RVOL), per the implied volatility (IVOL) bid; on Monday, some IVOL measures, such as the Cboe Volatility Index (INDEX: VIX), shifted up, as did term structure. Markets sold a bit, too.
Quick aside:
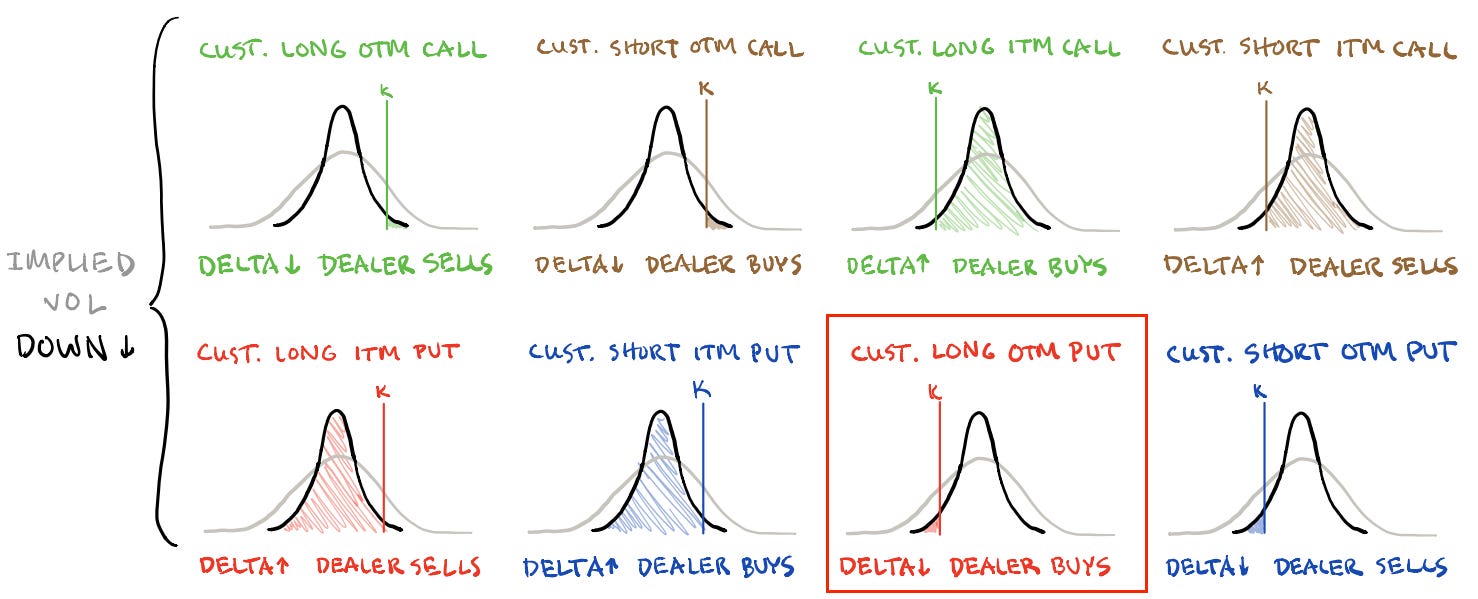
Changes in IVOL are a byproduct of supply and demand (i.e., demand rushes in → IVOL rises → option prices adjust higher).
When protection is demanded by investors, counterparties may pressure markets (a naive take, if we will, for the purpose of breaking things down).
To explain further, say the market is in balance and trading sideways, and traders seek to protect against potential downside movement by purchasing put options.
This new demand will bid put options prices, causing counterparties to hedge in a manner that pressures the market (i.e., a trader buys put and bids IVOL → the counterparty sells that put and futures to hedge that put), as we’re seeing (i.e., IVOL higher and market lower ahead of updates to measures like the Personal Consumption Expenditures [INDEX: PCE], the Fed’s go-to inflation reading).
Back to the letter:
Upon some new information, participants will enter and reprice the market.
Counterparties’ re-hedging could add to the movement up or down (e.g., traders sell their put hedges → IVOL compresses → counterparties buy back futures hedges and support the market).
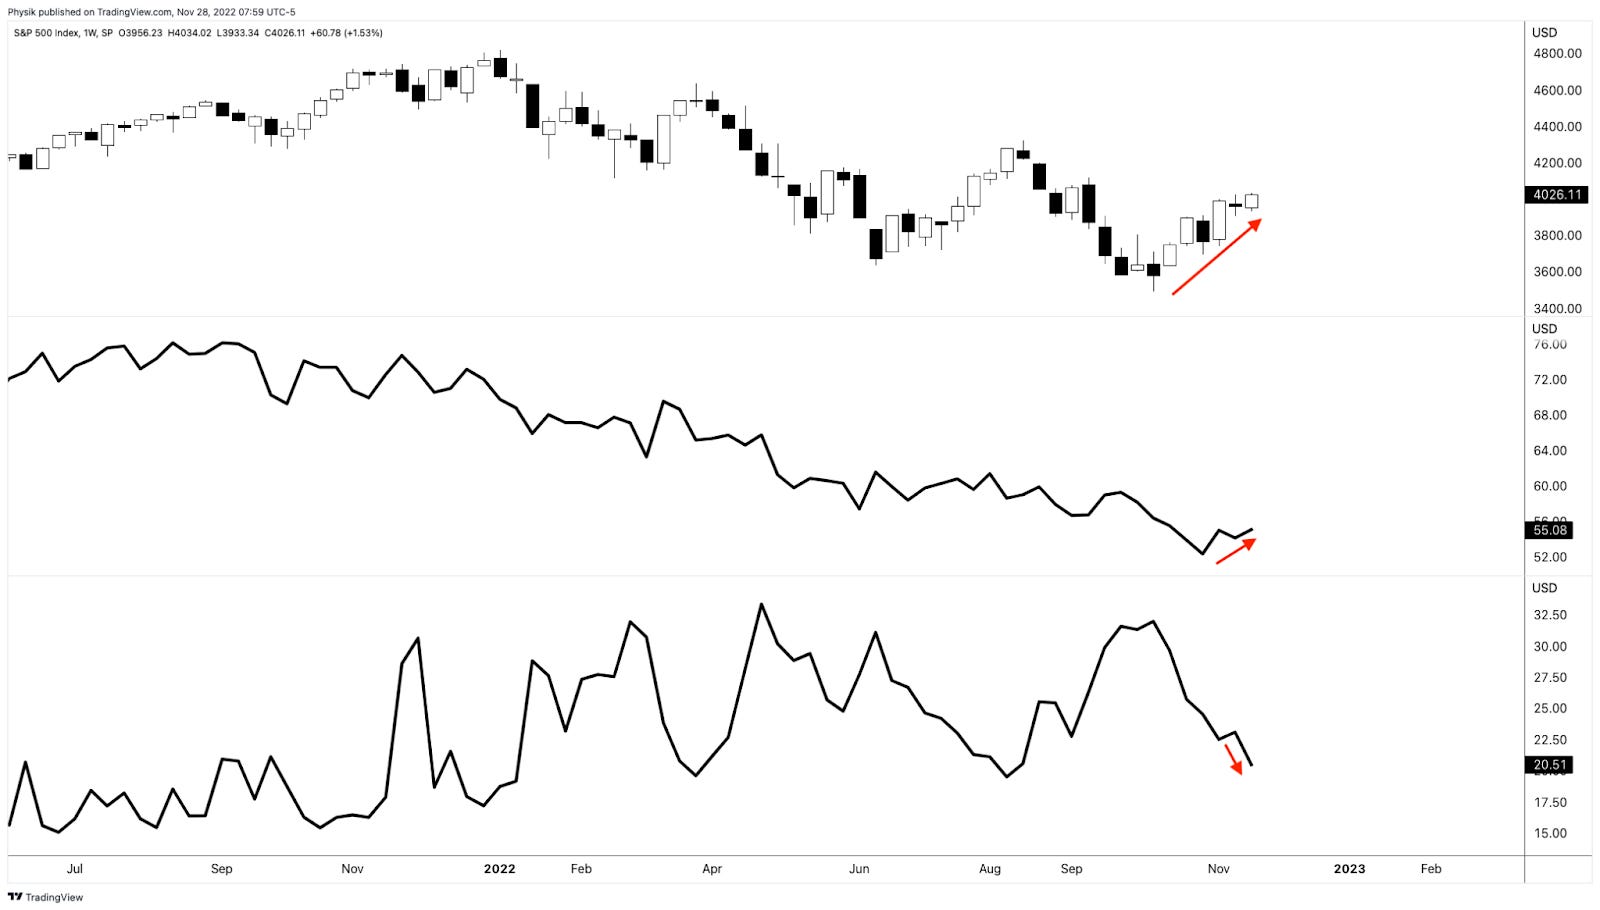
If you’re betting on lower prices, recommended is a quick reference of Physik Invest’s Daily Brief for November 28, 2022. In short, according to SpotGamma, “there’s less to be lost owning protection down below,” given the performance of skew, relative to topline measures such as the Cboe Volatility Index (INDEX: VIX).
“On the contrary, if you buy [protection] and nothing happens, that [protection] may very well hold its value better than in the past.”
Graphic: Retrieved from TradingView. Top, S&P 500 (INDEX: SPX). Middle Nations SkewDex (INDEX: SDEX). Bottom Cboe Volatility Index (INDEX: VIX). According to one paper from Nations Indexes, “SkewDex tells market participants how expensive out-of-the-money options are in relation to at-the-money options and thus, how risk-averse investors are.”
On the call side, the story is similar; selling volatility blindly is not a good trade.
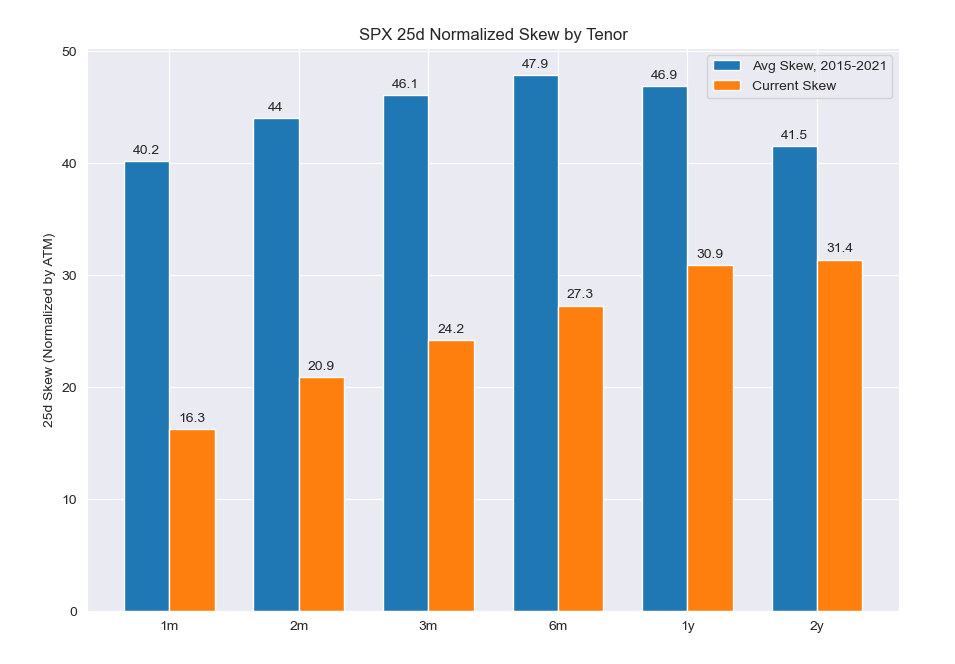
To explain, incentive schemes drove “people to be much more willing to pay and chase upside,” and this is, in part, evidenced by historically low skew. There is also stock replacement, among other things, due to the opportunity cost of buying stock being higher in the current interest rate environment (i.e., “higher call options premium when interest rates are high is the ‘opportunity cost’ of forgone interest”).
Graphic: Retrieved from Charles Schwab Corporation (NYSE: SCHW).
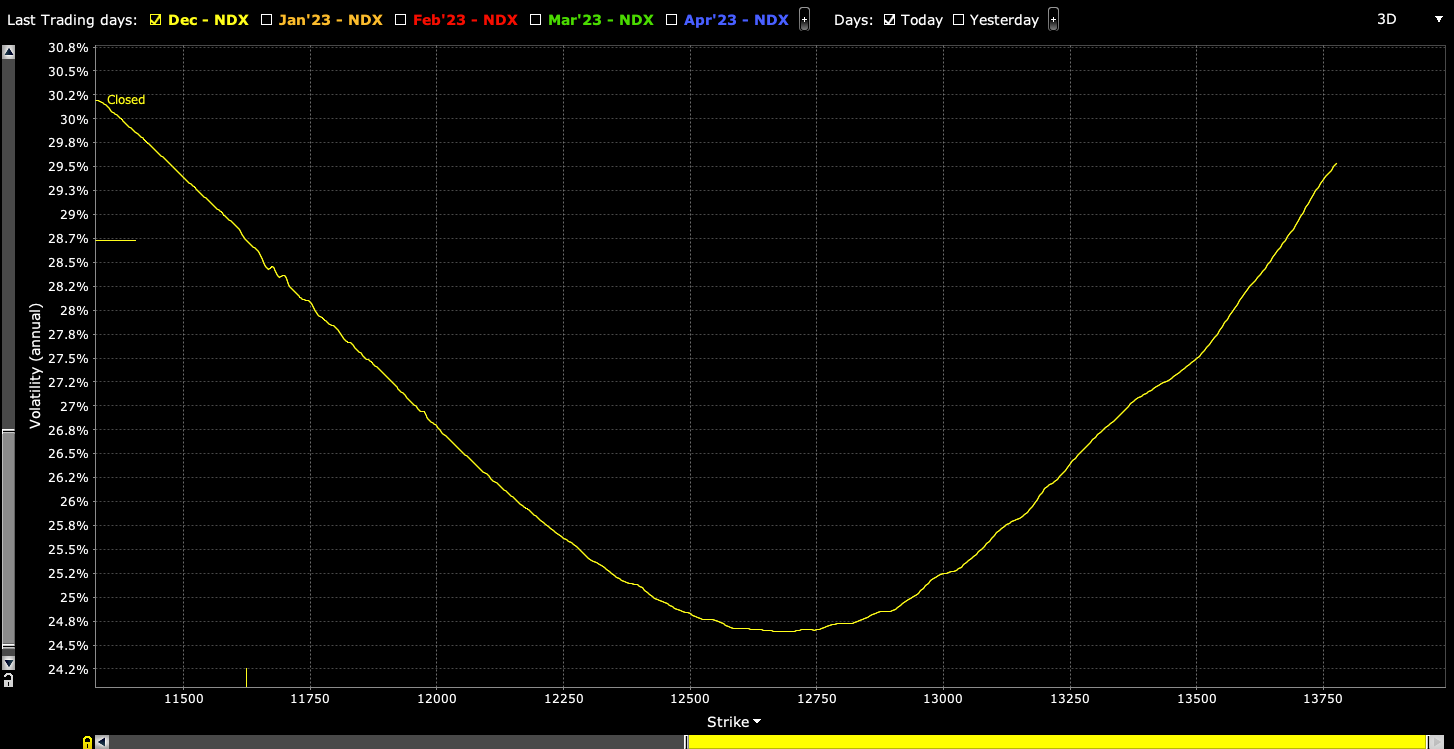
In the interest of brevity, this environment has resulted in a smile-shaped volatility skew pattern, rather than the typical smirk-shaped reverse volatility skew pattern.
Graphic: Retrieved from Interactive Brokers (NASDAQ: IBKR). Nasdaq 100 (INDEX: NDX) volatility skew resembles the so-called smile.
Skew has steepened on the call side – a result of traders positioning for an upside move – and we can use the richness of out-of-the-money calls to reduce the cost of our bets on the market upside.
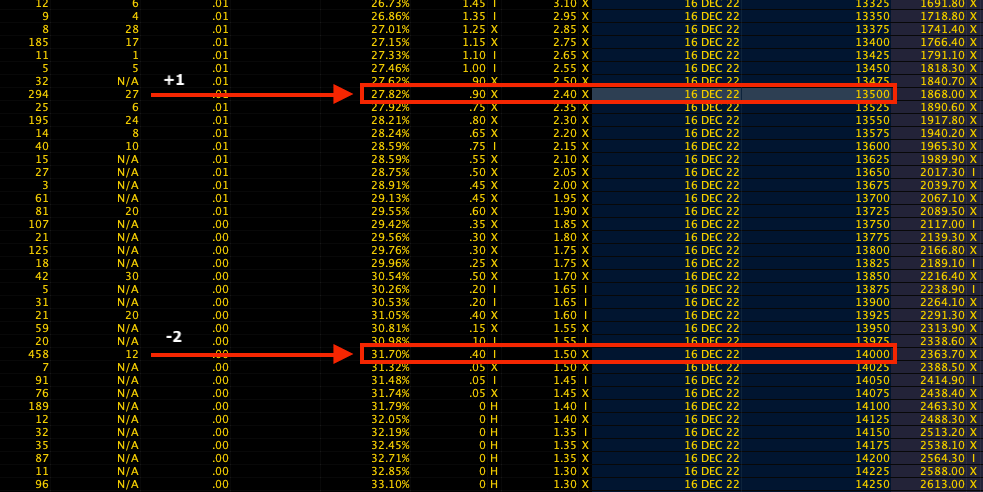
Graphic: Retrieved from the Charles Schwab Corporation-owned (NYSE: SCHW) thinkorswim platform. Nasdaq 100 options prices.
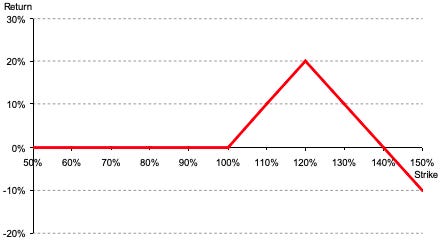
For instance, low-cost 500-1000 points wide call ratio spreads (buy the closer leg, sell two of the farther legs) expiring in fifteen days may work well.
Graphic: Via Banco Santander SA (NYSE: SAN) research. The return profile, at expiry, of a 1×2 (long 1, short 2 further away) ratio spread.
A concern with these strategies is the width and time to expiry. Should either of those be wrong, then spreads initially positive gamma turn negative, meaning upside market movement hurts the position and losses are amplified.
Technical
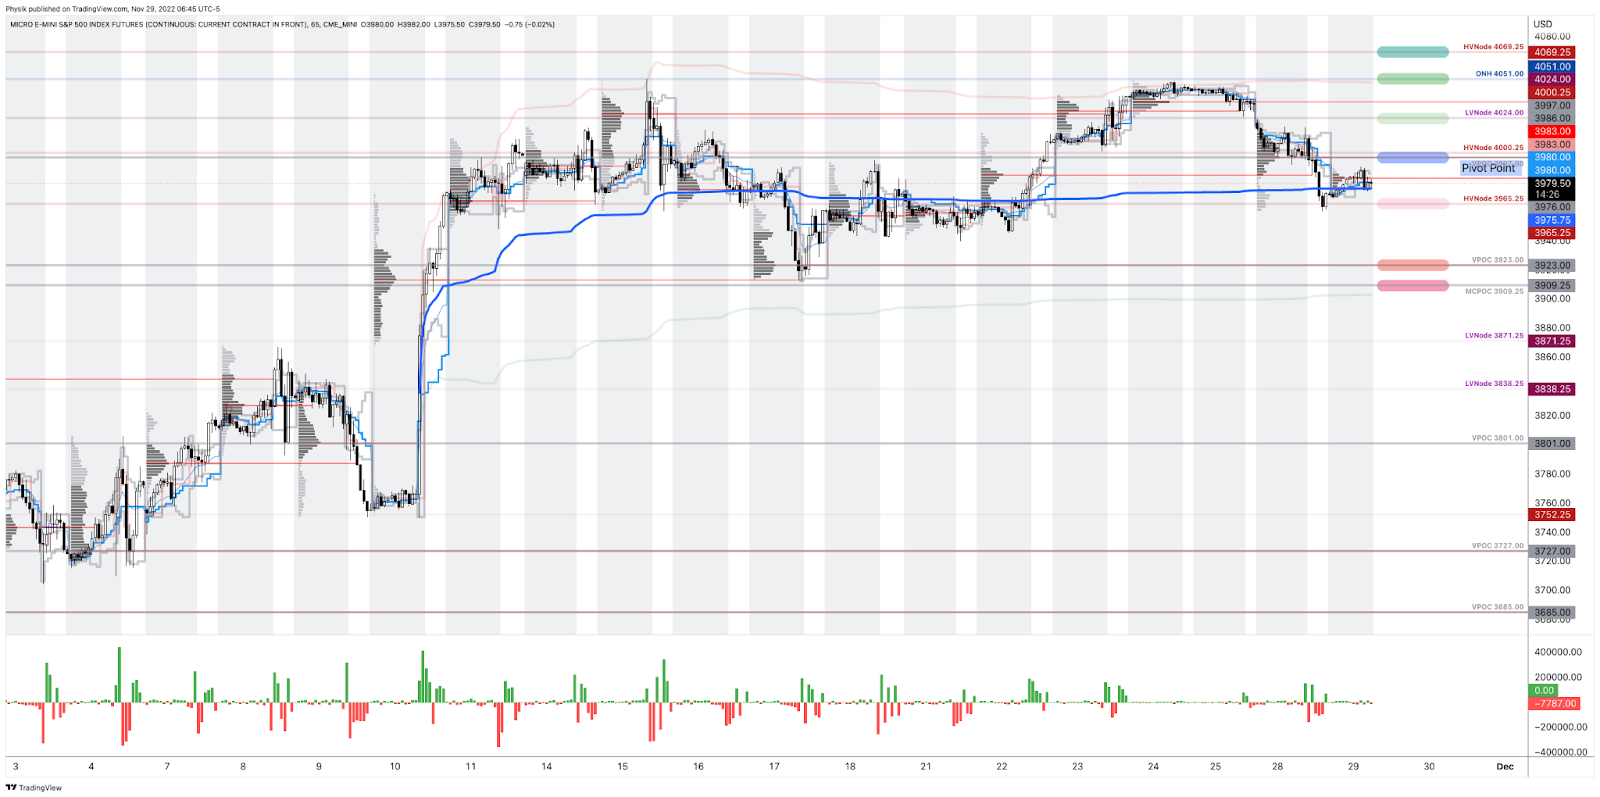
As of 6:45 AM ET, Tuesday’s regular session (9:30 AM – 4:00 PM ET), in the S&P 500, is likely to open in the middle part of a positively skewed overnight inventory, inside of prior-range and -value, suggesting a limited potential for immediate directional opportunity.
Our S&P 500 pivot for today is $4,997.00.
Key levels to the upside include $4,024.00, $4,051.00, and $4,069.25.
Key levels to the downside include $3,965.25, $3,923.00, and $3,909.25.
Click here to load today’s key levels into the web-based TradingView platform. All levels are derived using the 65-minute timeframe. New links are produced, daily.
Graphic: 65-minute profile chart of the Micro E-mini S&P 500 Futures.
About
After years of self-education, strategy development, mentorship, and trial-and-error, Renato Leonard Capelj began trading full-time and founded Physik Invest to detail his methods, research, and performance in the markets.
Capelj also writes options market analyses at SpotGamma and is a Benzinga journalist.
The daily brief is a free glimpse into the prevailing fundamental and technical drivers of U.S. equity market products. Join the 1,200+ that read this report daily, below!
Graphic updated 9:15 AM ET. Sentiment Risk-On if expected /ES open is above the prior day’s range. /ES levels are derived from the profile graphic at the bottom of the following section. Levels may have changed since initially quoted; click here for the latest levels. SqueezeMetrics Dark Pool Index (DIX) and Gamma (GEX) calculations are based on where the prior day’s reading falls with respect to the MAX and MIN of all occurrences available. A higher DIX is bullish. At the same time, the lower the GEX, the more (expected) volatility. Learn the implications of volatility, direction, and moneyness. Breadth reflects a reading of the prior day’s NYSE Advance/Decline indicator. VIX reflects a current reading of the CBOE Volatility Index (INDEX: VIX) from 0-100.
Administrative
This letter’s author is ramping up coverage and returning to speed after a short hiatus. Today’s focus will be on adding to the “Positioning” section of Monday’s letter.
Positioning
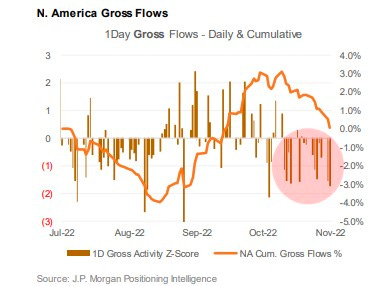
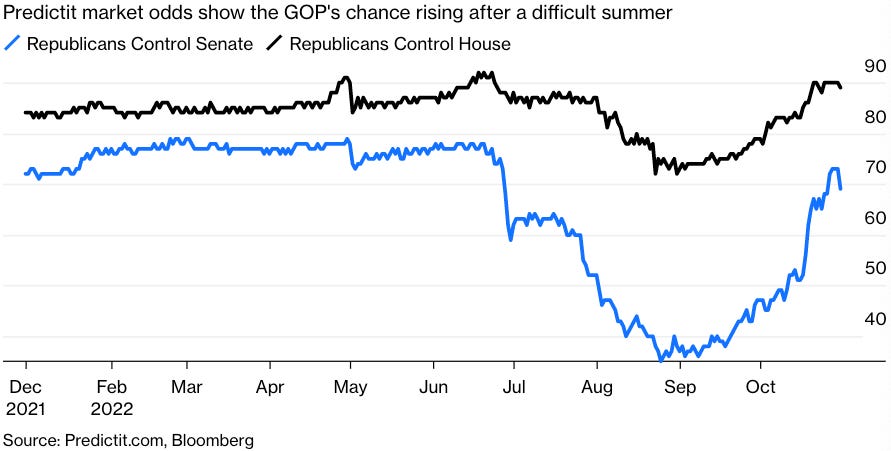
After some late-October weakness that is coinciding with the Federal Reserve’s (Fed) decision to raise rates, stocks are tame. This is heading into midterm elections, today, and inflation updates, Thursday.
Graphic: Retrieved from Bloomberg. Created by JPMorgan Chase & Co (NYSE: JPM).
Republicans are likely to add to their control of the House and Senate.
Having fewer Democrats in Congress would lower “the odds of fiscal measures [that would] embolden a hawkish Federal Reserve.”
This is a boon for stocks.
Graphic: Retrieved from Bloomberg. “With things looking that bad, current polls show the Democrats appear to be headed for a drubbing, almost certain to lose control of the House and increasingly likely to see the Senate slip away.”
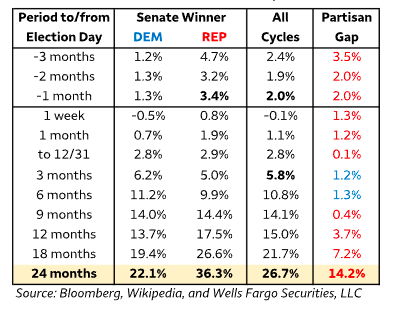
Indeed, Wells Fargo & Co (NYSE: WFC) strategists found a “GOP-controlled Senate historically is associated with superior equity returns.”
Graphic: Retrieved from Wells Fargo & Co (NYSE: WFC).
In spite of recessions, even, the S&P 500, a year after midterms, often netted positive 20% or so returns Citigroup Inc (NYSE: C) strategists add.
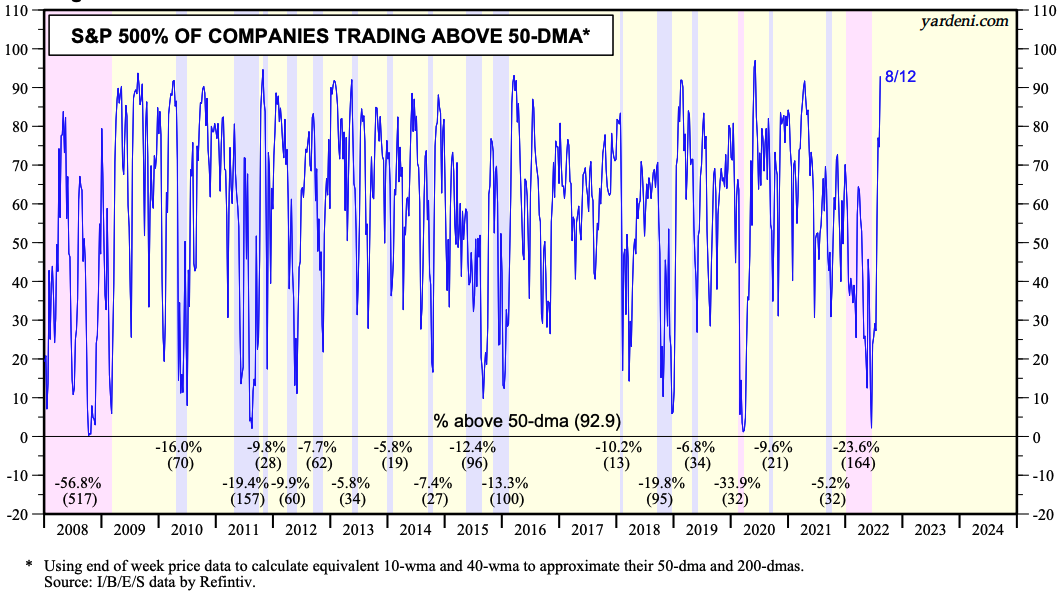
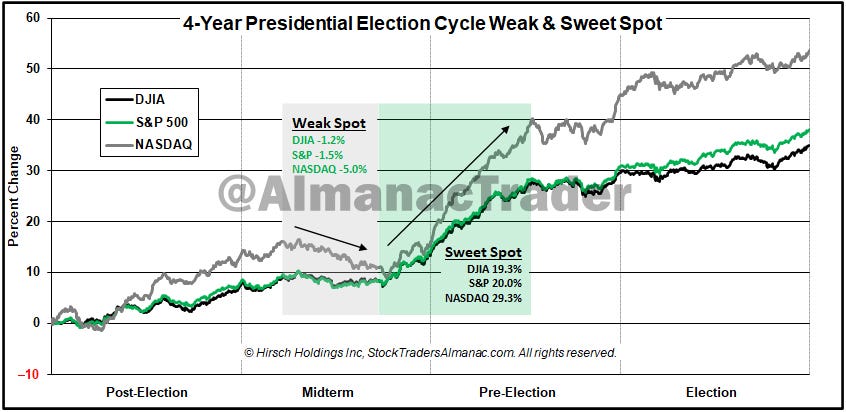
Graphic: Retrieved from Callum Thomas’ Weekly S&P 500 ChartStorm. The “seasonal/cycle outlook is for a lower low or retest of the lows over the next three months as we are in the worst two months of the year and are smack dab in the *Weak Spot* of the 4-Year Cycle”
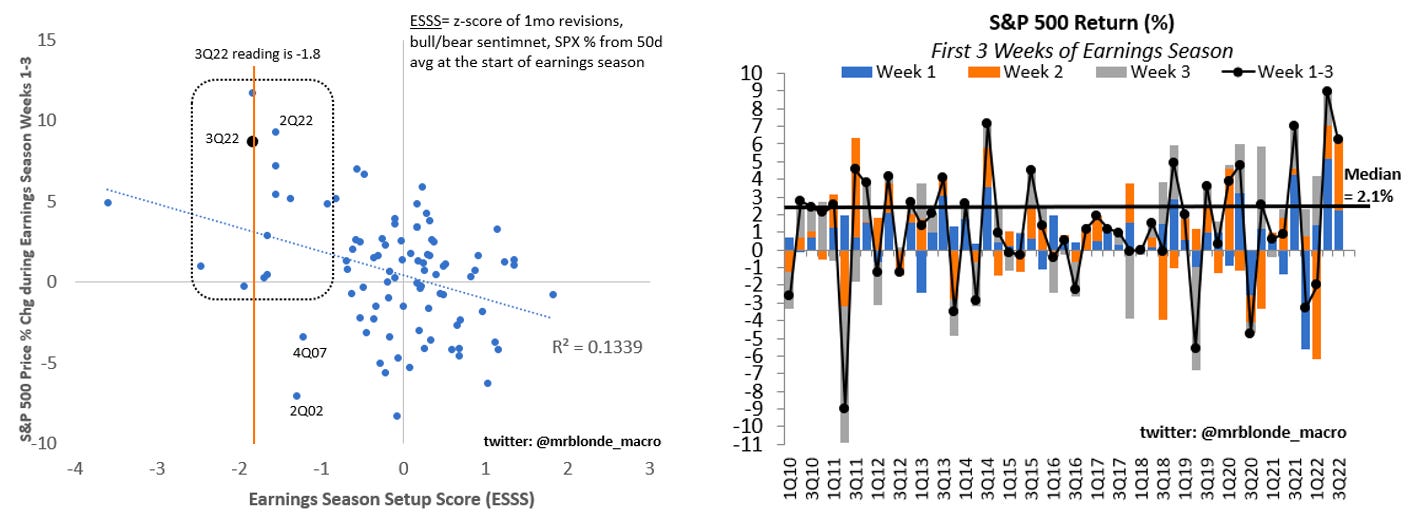
A post-election bump is on top of the general positiveness of equity performance during the earnings season and periods of strong pessimism as we have today.
Graphic: Retrieved from Mr. Blonde’s Stuck in the Middle letter.
Why all the potential positivity over this short period?
The aforementioned events are happening during a period wherein market liquidity eases (i.e., the holiday season).
It’s during this period, from a positioning perspective, the effects of decay (which we discuss more below) accelerate, and a lack of liquidity, according to Kai Volatility’s Cem Karsan, makes markets sensitive to positive-leaning flows.
Pessimism and hedging may indirectly give rise to bullishness. Why is that?
Demand for options exposures, especially across shorter time horizons, evidenced by heightened implied volatility (IVOL) at the front end (see below), has indirectly added to the pressures of de-grossing, as observed.
Though positioning is generally thin, as we also talked about in yesterday’s newsletter, thus reducing the impact of the hedging of this positioning, demand remains “strong,” per Karsan, and “dealers are short that volatility.”
Derivatives strategists at the likes of the Royal Bank of Canada (NYSE: RY) agree with Karsan’s remarks; Amy Wu Silverman said that the Cboe Volatility Index’s (INDEX: VIX) elevation was the result of demand for hedges after October options expiry.
“Part of today’s move at least is a function of new positions. There is likely demand for future months since we just went through October options expiry,” she said. “Part of it is a function of the ‘floor’ of a new volatility regime.”
So, what’s the point to make?
For IVOL measures to remain wound, something bad needs to happen, in short.
Otherwise, per SpotGamma, a “decline in IVOL … can aid in a push-and-pull that actually serves to … resist far-reaching weakness” and keep selling orderly.
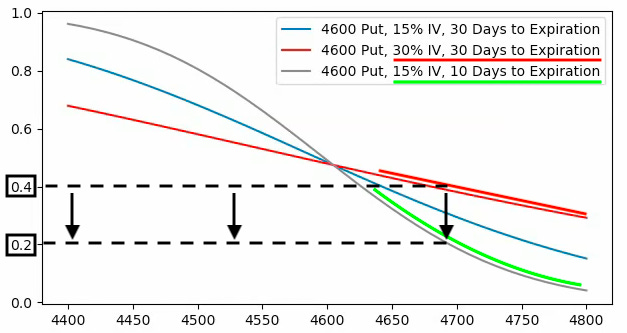
That’s because, from here, the removal of the protection that’s been demanded in the past days and weeks compounds the sped-up effects of Charm.
Graphic: Retrieved from SpotGamma. SPX prices X-axis. Option delta Y-axis. When the factors of implied volatility (Vanna) and time change (Charm), hedging ratios change. The graphic is for illustrational purposes, only.
Charm, which is the change in options Delta (i.e., exposure to direction) with respect to changes in time, “drives a positive window or seasonality”; “the reduction in time” and “lack of liquidity” make markets more sensitive to those positive flows.
Graphic: Retrieved from Corey Hoffstein on Twitter.
Technical
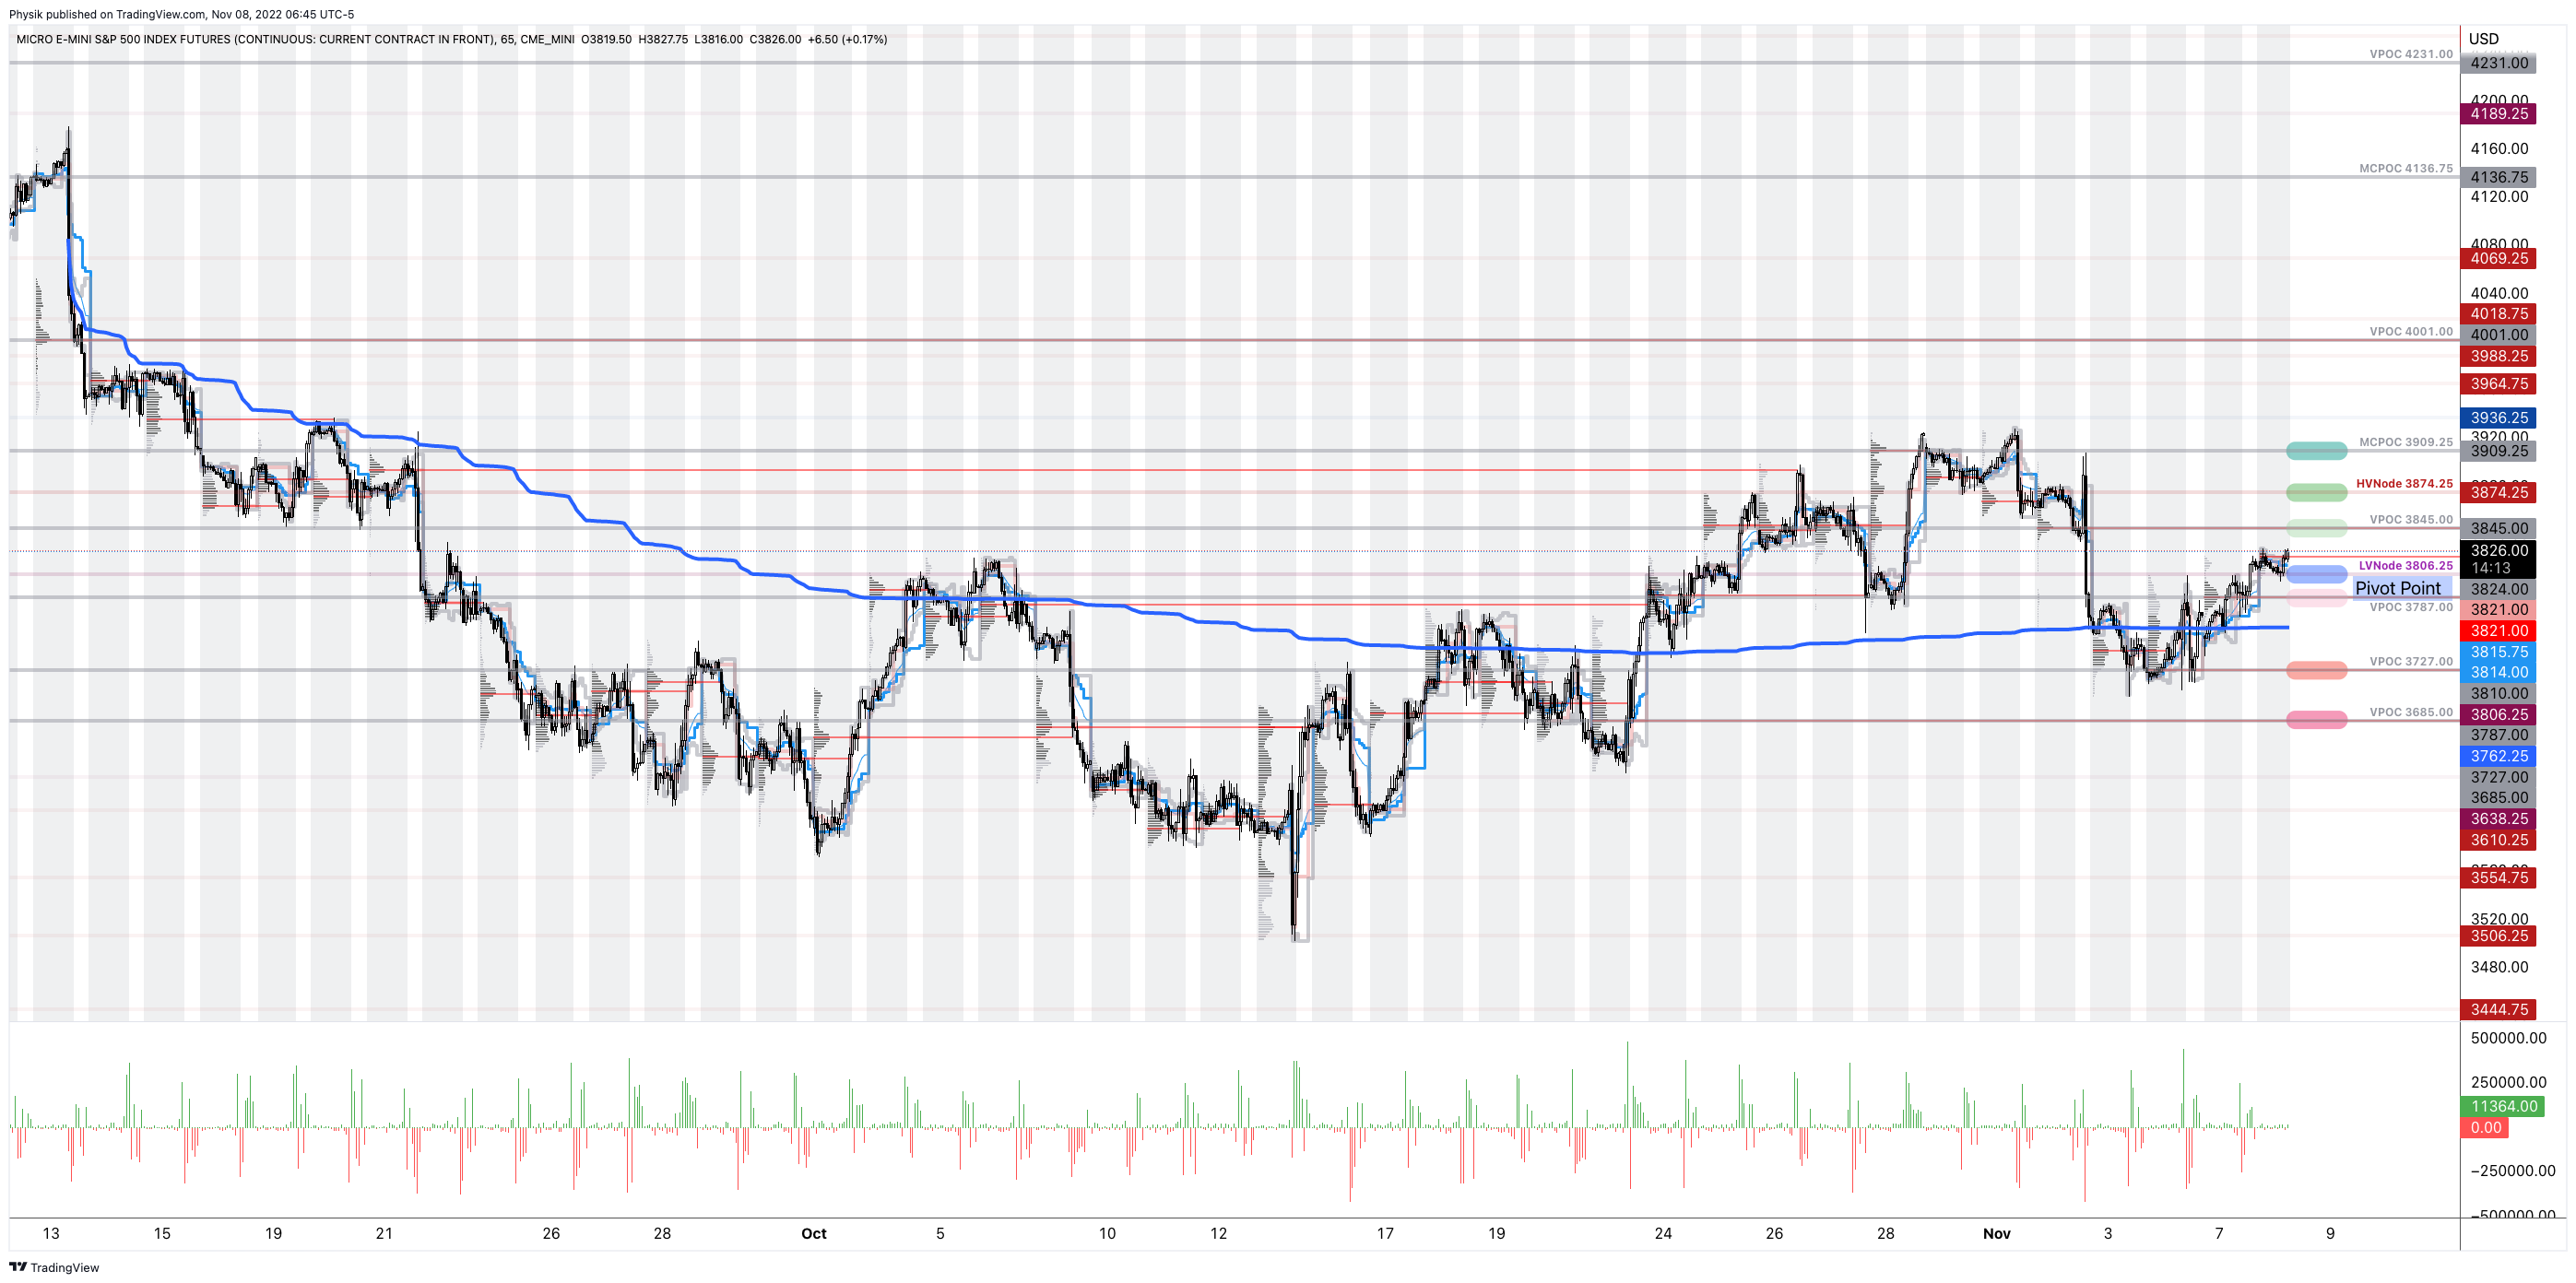
As of 6:45 AM ET, Tuesday’s regular session (9:30 AM – 4:00 PM ET), in the S&P 500, is likely to open in the upper part of a positively skewed overnight inventory, just outside of prior-range and -value, suggesting a limited potential for immediate directional opportunity.
In the best case, the S&P 500 trades higher.
If above the $3,806.25 LVNode, the $3,845.00 VPOC is in play. Initiative trade beyond the latter could reach as high as the $3,874.25 HVNode and $3,909.25 MCPOC, or higher.
In the worst case, the S&P 500 trades lower.
If above the $3,806.25 LVNode, the $3,787.00 VPOC is in play. Initiative trade beyond the latter could reach as low as the $3,727.00 and $3,685.00 VPOC, or lower.
Click here to load today’s key levels into the web-based TradingView charting platform. Note that all levels are derived using the 65-minute timeframe. New links are produced, daily.
Graphic: 65-minute profile chart of the Micro E-mini S&P 500 Futures.
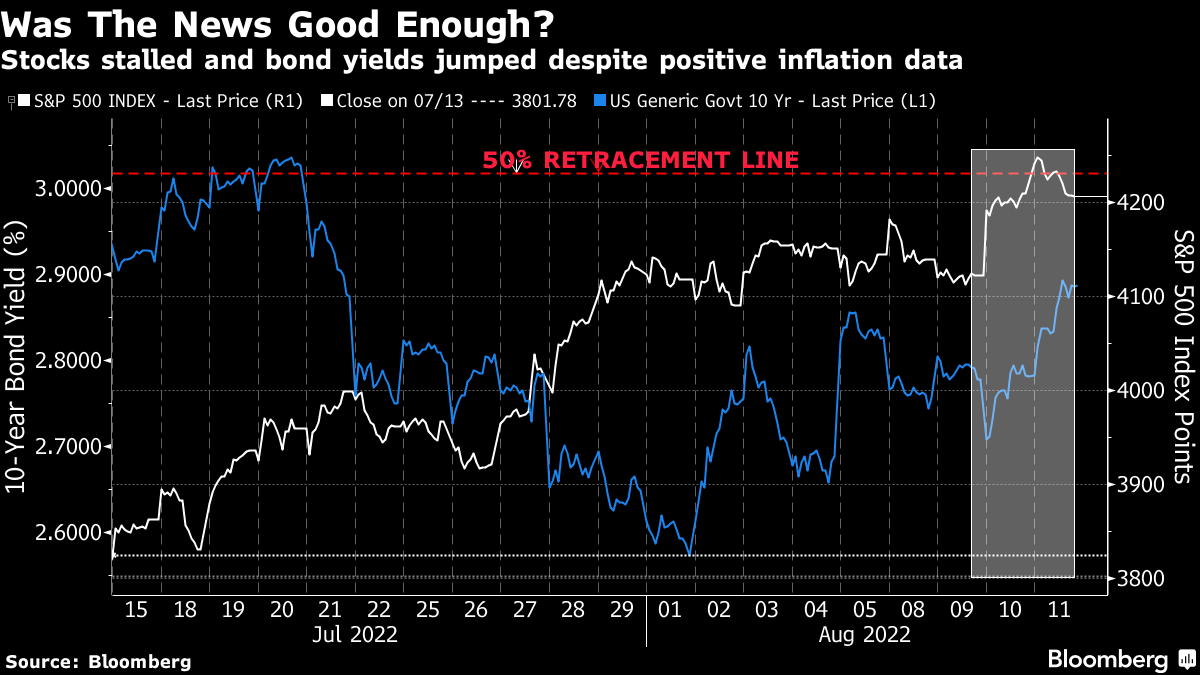
Considerations: Futures tied to the S&P 500 are trading within close proximity to a blue line in the above graphic. This blue line depicts a volume-weighted average price (VWAP) anchored to price action following the release of consumer price data on September 13, 2022.
The VWAP metric is highly regarded by chief investment officers, among other participants, for the quality of trade. Additionally, liquidity algorithms are benchmarked and programmed to buy and sell around VWAPs.
Should the S&P 500 auction away from this level, and come back to it, a prudent response is to fade. If the price is above the VWAP, and it auctions lower, into the VWAP, traders would buy. On the other hand, if the price is below the VWAP, and it auctions higher, into the VWAP, sell.
At this time, the S&P 500 is near VWAP offering traders lower (directional) opportunities.
Definitions
Volume Areas: A structurally sound market will build on areas of high volume (HVNodes). Should the market trend for long periods of time, it will lack sound structure, identified as low volume areas (LVNodes). LVNodes denote directional conviction and ought to offer support on any test.
If participants were to auction and find acceptance into areas of prior low volume (LVNodes), then future discovery ought to be volatile and quick as participants look to HVNodes for favorable entry or exit.
Gamma: Gamma is the sensitivity of an option to changes in the underlying price. Dealers that take the other side of options trades hedge their exposure to risk by buying and selling the underlying. When dealers are short-gamma, they hedge by buying into strength and selling into weakness. When dealers are long-gamma, they hedge by selling into strength and buying into weakness. The former exacerbates volatility. The latter calms volatility.
Vanna: The rate at which the delta of an option changes with respect to volatility.
Charm: The rate at which the delta of an option changes with respect to time.
POCs: POCs are valuable as they denote areas where two-sided trade was most prevalent in a prior day session. Participants will respond to future tests of value as they offer favorable entry and exit.
MCPOCs: POCs are valuable as they denote areas where two-sided trade was most prevalent over numerous day sessions. Participants will respond to future tests of value as they offer favorable entry and exit.
About
After years of self-education, strategy development, mentorship, and trial-and-error, Renato Leonard Capelj began trading full-time and founded Physik Invest to detail his methods, research, and performance in the markets.
Capelj also develops insights around impactful options market dynamics at SpotGamma and is a Benzinga reporter.
In no way should the materials herein be construed as advice. Derivatives carry a substantial risk of loss. All content is for informational purposes only.
The daily brief is a free glimpse into the prevailing fundamental and technical drivers of U.S. equity market products. Join the 1,190+ that read this report daily, below!
Graphic updated 11:00 AM ET. Sentiment Neutral if expected /ES open is inside of the prior day’s range. /ES levels are derived from the profile graphic at the bottom of the following section. Levels may have changed since initially quoted; click here for the latest levels. SqueezeMetrics Dark Pool Index (DIX) and Gamma (GEX) calculations are based on where the prior day’s reading falls with respect to the MAX and MIN of all occurrences available. A higher DIX is bullish. At the same time, the lower the GEX, the more (expected) volatility. Learn the implications of volatility, direction, and moneyness. Breadth reflects a reading of the prior day’s NYSE Advance/Decline indicator. VIX reflects a current reading of the CBOE Volatility Index (INDEX: VIX) from 0-100.
Administrative
After a one-month hiatus, the Daily Brief by Physik Invest is back, albeit with new inspiration and direction.
Previously, the letter was focused on analyses of secondary and tertiary sources. New for the letter will be the inclusion of primary source information. It will be some time before these changes are most noticeable but that’s the general direction.
For instance, interviewing a country’s economic minister on policy and discussing how that policy impacts markets, at the end of it all, is on the table.
That said, apologies for not being there for the past month. I found a lot happened and I could not rid myself of the desire to unpack. This letter helps me structure trades through which real capital is at risk.
Not having the full picture did me a disservice, in short.
Going forward, I will try to feature a good mix of detail and pointedness. Take care and I look forward to learning and earning together!
Fundamental
Weekend news was centered around the tightening of financial conditions, the impact of central bank action, as well as geopolitics (e.g., Lithuania opening a trade office in Taiwan), and supply chokepoints.
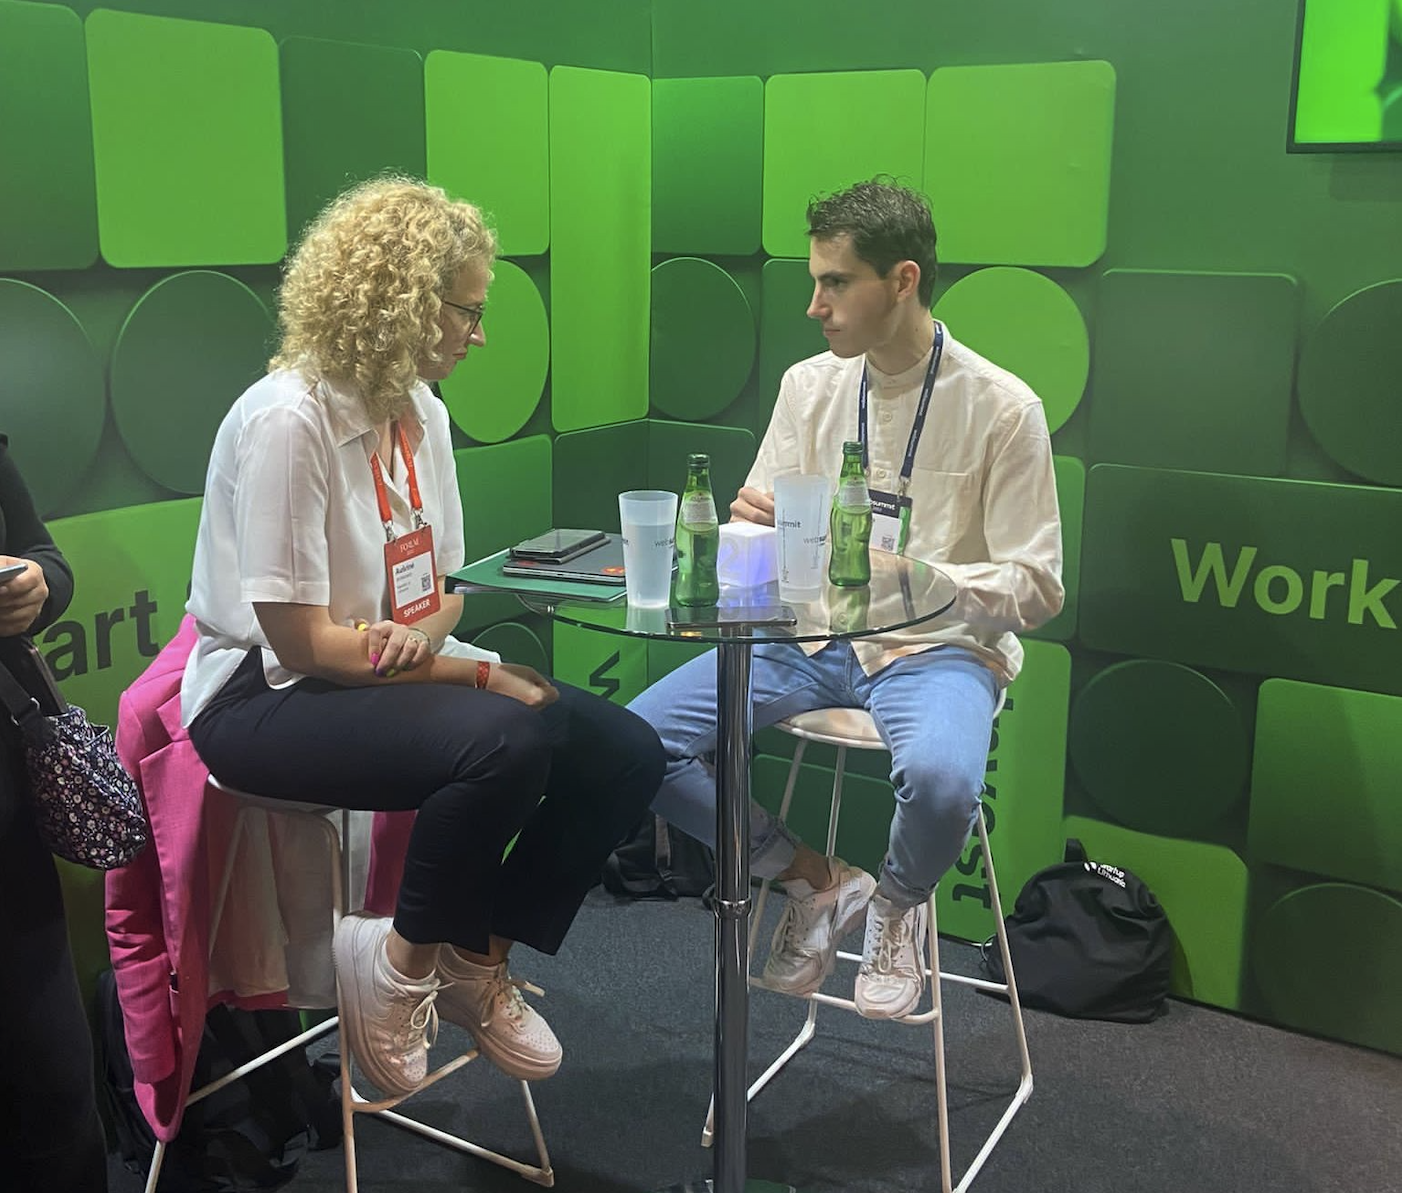
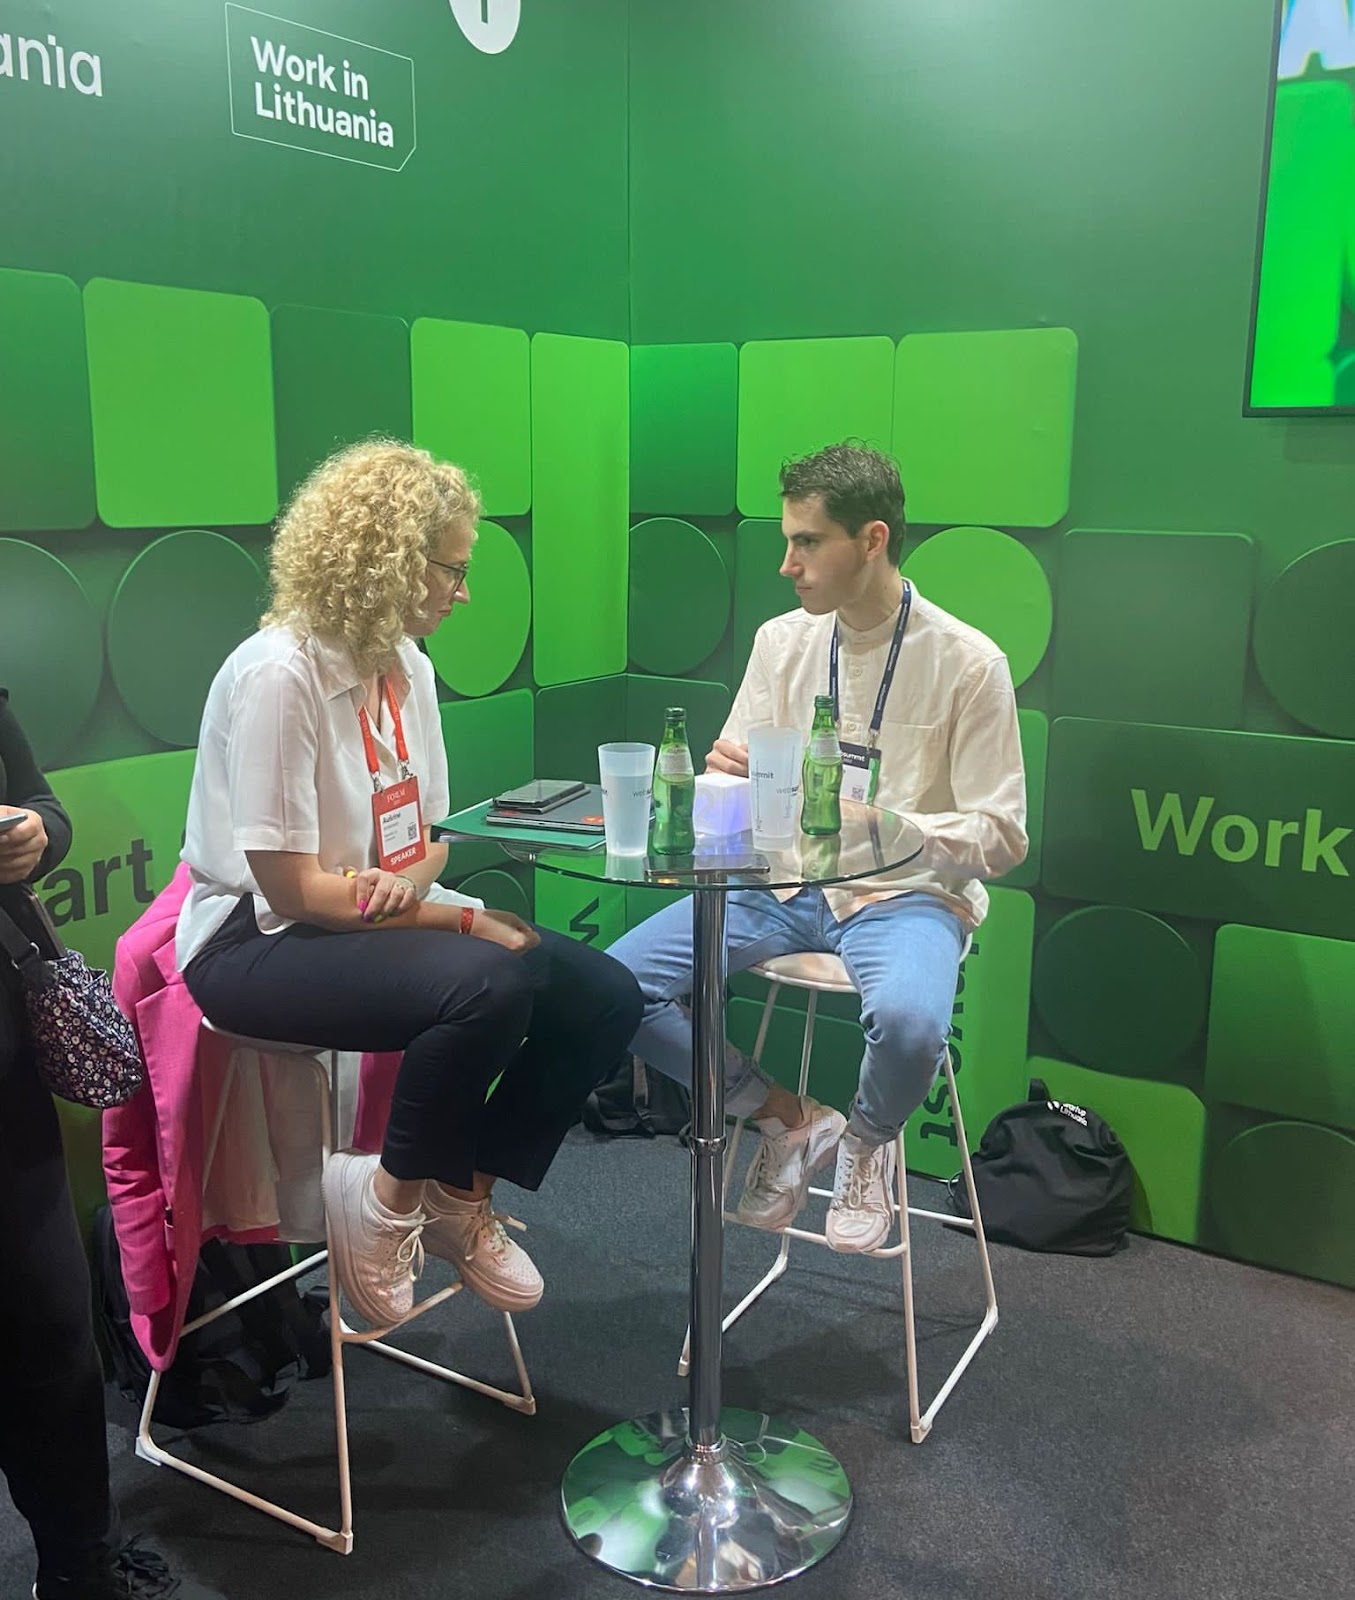
By happenstance, I interviewed the Lithuanian Economy Minister Ausrine Armonaite, quoted by Bloomberg in the above story, last week in Lisbon. More on this, later.
Graphic: Provided by the Lithuanian Delegation. Left, Lithuanian Economy Minister Ausrine Armonaite. Right, Renato Leonard Capelj conducting an interview on behalf of Benzinga.com.
The One Big Thing:
With labor still tight, former New York Fed President Bill Dudley commented that “there’s a lot of work to do … [so] inflation expectations don’t become unanchored” and force “something really, really harsh later.”
Unfortunately, the impact of actions here, in the US, is not isolated.
US tightening pains the rest of the world, too. Stronger dollars pressure emerging-market economies with dollar-denominated debts. This, ultimately, works to upend the dollar’s role as a reserve.
Margin Compression, Dollar Debt:
Dollar strength feeds margin compression (just now filtering through, according to Kai Volatility’s Cem Karsan, and impacting dollar-denominated debt), adding to the “billion[s] less in demand for assets per day” via quantitative tightening (QT).
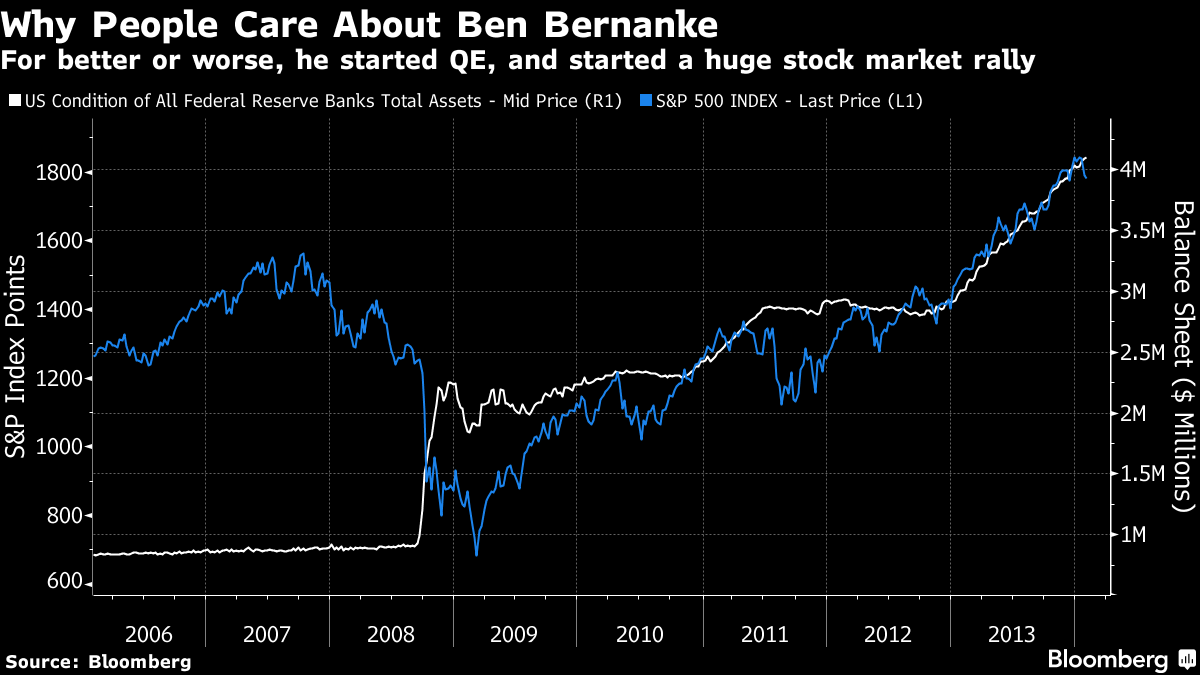
As a refresher, quantitative easing (QE) lowers interest rates and makes investments in financial assets more attractive. This bolsters asset inflation and deflation in the real economy.
Graphic: Retrieved from Bloomberg. The chart is an example showing “money-printing or ‘quantitative easing’ that [Ben Bernanke] pioneered seemed to prop up the stock market.”
QT Compounds Rising Rate Impact:
Moreover, in 2020, policymakers embarked on historic interventions.
Monetary authorities cut interest rates and bought bonds, all the while money was sent to people. Risk assets were the first to respond. Then, as the economy reopened, demand picked up, supply chains (that were slowed) tightened, and prices in the real economy inflated.
Threats to globalization and persistent supply chokepoints (e.g., Ukraine and Russia) have done little to help. Inflation remains a problem and investors are seeking safety amid Fed intervention.
Financial assets are in less demand while real assets are in more demand; sticky inflation and the policymaker reactions are putting in jeopardy dollar carry (mentioned above) and the S&P 500, a focus point for this letter and a center of the global carry regime, among other things.
Responses Invoke Collateral Damage:
As Credit Suisse Group AG’s Zoltan Pozsar summarizes, inflation is a structural issue, and “we [have] to generate a round of negative wealth effects to lower demand such that it becomes more in line with the new realities of supply.”
That invokes “collateral damage to the US economy,” S&P Global Inc (NYSE: SPGI) economists have put forth “as households and businesses pull back spending and investment.”
Ultimately, “[a]s demand erodes, businesses that changed inventory strategy to ‘just-in-case’ from ‘just-in-time’ are left with full shelves to unwind at a loss and less need for workers that were in high demand just a few months ago.” That’s a recession.
Positioning
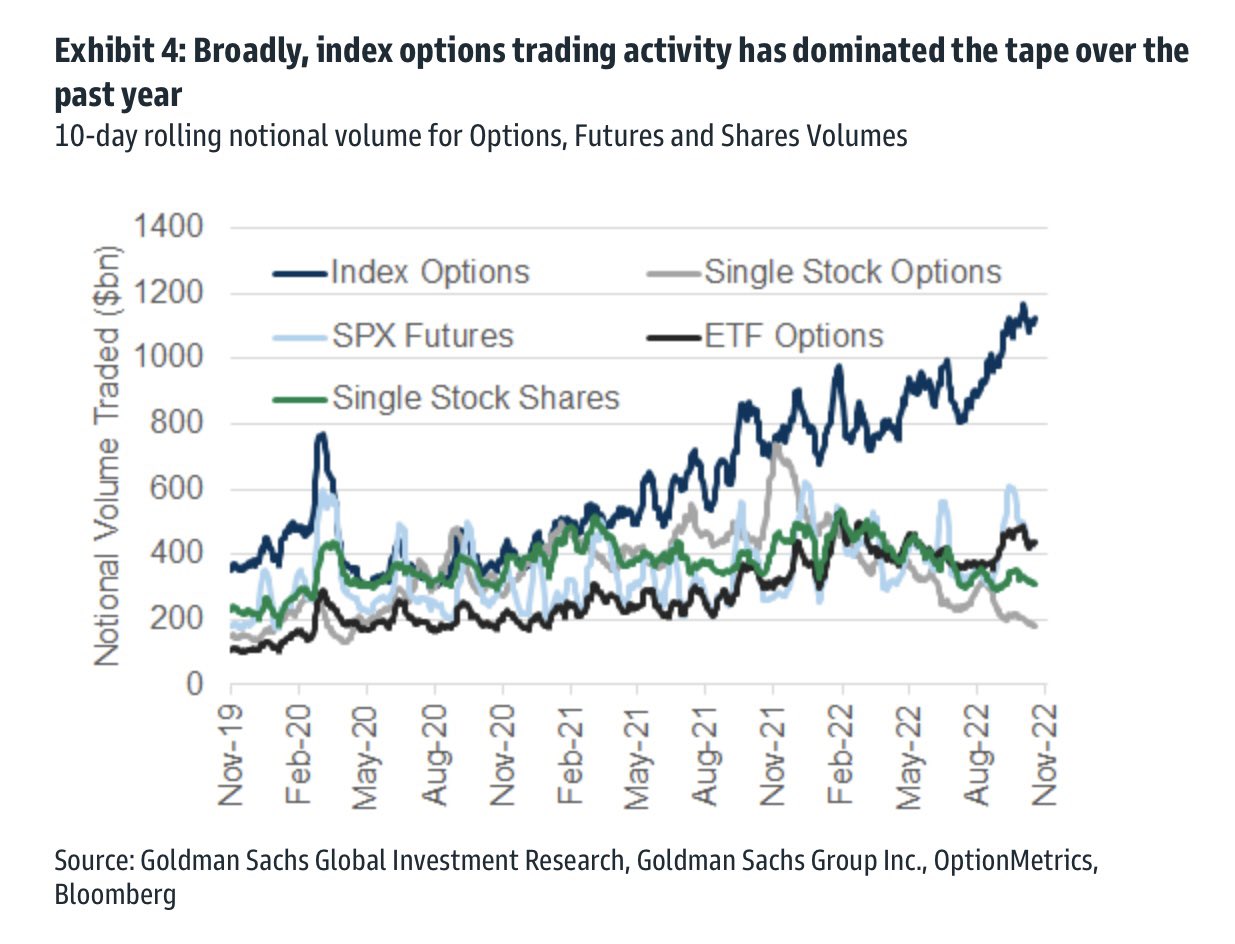
Equity market implied volatility (IVOL) remains subdued and part of the blame rests on the (1) growth of derivatives and …
Graphic: Retrieved from Goldman Sachs Group Inc (NYSE: GS). Reposted by Rob Emrich III.
(2) a lower liquidity environment in which the hedging of these derivatives matters more.
Graphic: Retrieved from Goldman Sachs Group Inc (NYSE: GS). Taken from The Market Ear.
To recap, equity IVOL remains subdued, in part, because traders hedged into the 2022 decline.
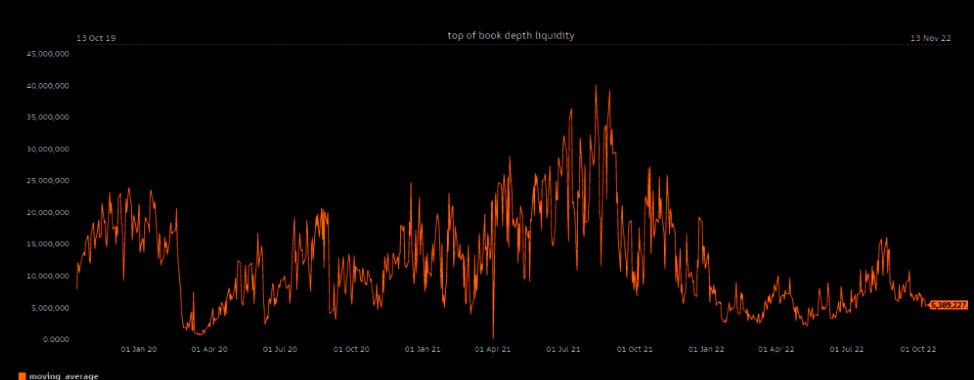
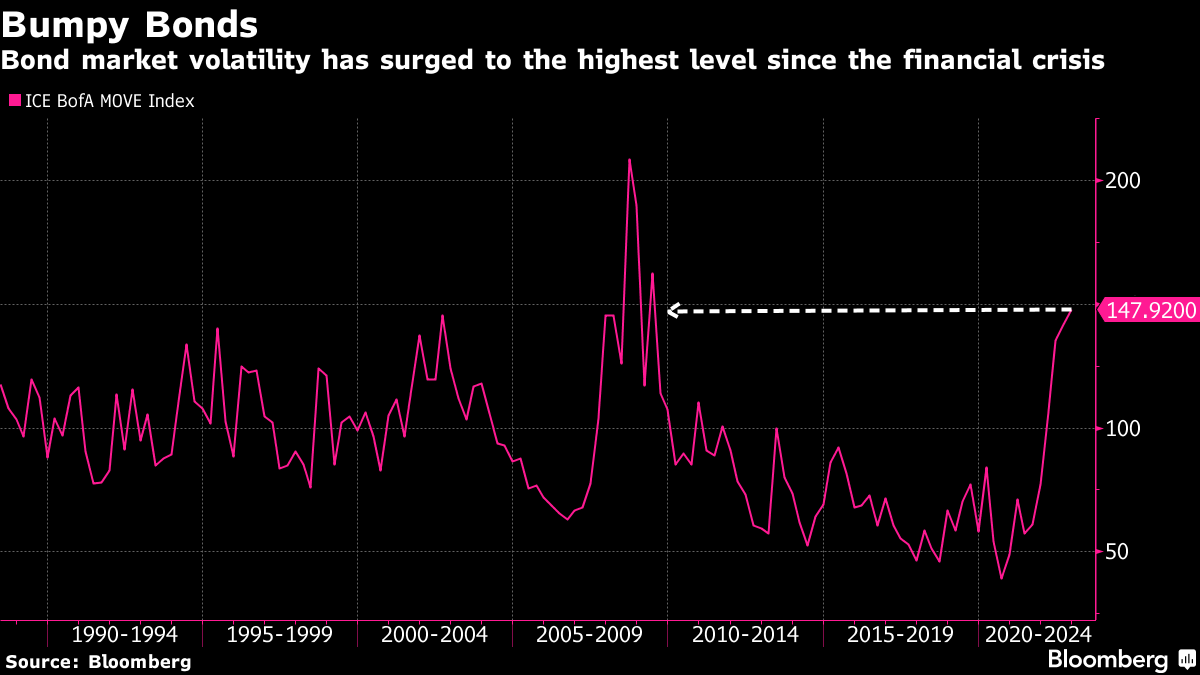
The liquidity providers’ response to the monetization of protection (i.e., trader sell put → liquidity provider buy put and stock and/or futures to hedge), as well as decreases in demand for equity exposure (and new protection), is keeping the Cboe Volatility Index (INDEX: VIX) tame while measures such as the Merrill Lynch Options Volatility Estimate (INDEX: MOVE) are surging.
As well put in a recent Bloomberg article quoting QVR Advisors’ Benn Eifert, “[e]veryone was prepared for another jarring market crash, and that, in essence, is why certain categories of protective options have failed to pay off this year.”
Graphic: Retrieved from Bloomberg. Initially created by QVR Advisors. “When shares drop, demand for fresh protection remains subdued given the unusually thin positioning among big money. At the same time, put owners quickly book profits, often leading to a drop in implied vol.
In support, IPS Strategic Capital’s Pat Hennessy puts forth that equity positioning is light and, “[I]f you have little to no equity exposure to hedge, why would you be buying puts?” That is all the while “[t]he last 5 years is still fresh in PMs heads though. This means that they have been quick to buy calls on any sign of a market bounce.”
Another takeaway is that with skew at “near all-time lows, … [and] the highest rates we’ve seen in 15 years, [] longer dated collars [are] an attractive trade for those who are worried about the performance of stocks over the next year but do not want to sell or try timing the market.”
Graphic: Retrieved from Pat Hennessy of IPS Strategic Capital.
A last big takeaway includes some loss of structural support from hedging flows.
To explain, often, traders hedge into impactful events such as elections and Fed rate decisions. The demand for protection will pressure markets indirectly. After, however, the decay, as well as the removal of that protection, indirectly supports the market.
Graphic: Retrieved from Bespoke on Twitter. Into Fed days, traders often demand protection. Barring the worst case, traders’ closure of this protection bolsters a price rise, after. The same has been observed after elections (e.g., November 2020 election bottom).
As it sits, traders are hedged into events such as the elections. Per SpotGamma, “[i]f nothing bad happens, and traders close those puts, that would likely bolster a rally.”
This coincides with the market’s entry into a period of lower liquidity (i.e., the holiday season). It’s during this period the effects of decay accelerate and a lack of liquidity, per Karsan, makes markets sensitive to those positive positioning flows.
Ultimately, the very poor hedging that’s going on, heading into the next rally, is going to set the stage for a large tail, Karsan adds. Traders, who aren’t as well hedged, will seek protection and this will pressure markets, adding to any macro-type selling.
More explanation in the coming letters.
Technical
As of 6:30 AM ET, Monday’s regular session (9:30 AM – 4:00 PM ET), in the S&P 500, is likely to open in the upper part of a positively skewed overnight inventory, inside of prior-range and -value, suggesting a limited potential for immediate directional opportunity.
In the best case, the S&P 500 trades higher.
Any activity above the $3,806.25 LVNode puts into play the $3,845.00 VPOC. Initiative trade beyond the VPOC could reach as high as the $3,874.25 HVNode and $3,909.25 MCPOC, or higher.
In the worst case, the S&P 500 trades lower.
Any activity below the $3,806.25 LVNode puts into play the $3,773.00 VPOC. Initiative trade beyond the VPOC could reach as low as the $3,727.00 and $3,685.00 VPOC, or lower.
Click here to load today’s key levels into the web-based TradingView charting platform. Note that all levels are derived using the 65-minute timeframe. New links are produced, daily.
Graphic: 65-minute profile chart of the Micro E-mini S&P 500 Futures.
Considerations: Futures tied to the S&P 500 are trading within close proximity to a blue line in the above graphic. This blue line depicts a volume-weighted average price (VWAP) anchored to price action following the release of consumer price data on September 13, 2022.
The VWAP metric is highly regarded by chief investment officers, among other participants, for the quality of trade. Additionally, liquidity algorithms are benchmarked and programmed to buy and sell around VWAPs.
Should the S&P 500 auction away from this level, and come back to it, a prudent response is to fade. If the price is above the VWAP, and it auctions lower, into the VWAP, traders would buy. On the other hand, if the price is below the VWAP, and it auctions higher, into the VWAP, sell.
At this time, S&P 500 prices are near VWAP offering traders lower (directional) opportunities.
Definitions
Volume Areas: A structurally sound market will build on areas of high volume (HVNodes). Should the market trend for long periods of time, it will lack sound structure, identified as low volume areas (LVNodes). LVNodes denote directional conviction and ought to offer support on any test.
If participants were to auction and find acceptance into areas of prior low volume (LVNodes), then future discovery ought to be volatile and quick as participants look to HVNodes for favorable entry or exit.
POCs: POCs are valuable as they denote areas where two-sided trade was most prevalent in a prior day session. Participants will respond to future tests of value as they offer favorable entry and exit.
MCPOCs: POCs are valuable as they denote areas where two-sided trade was most prevalent over numerous day sessions. Participants will respond to future tests of value as they offer favorable entry and exit.
The daily brief is a free glimpse into the prevailing fundamental and technical drivers of U.S. equity market products. Join the 900+ that read this report daily, below!
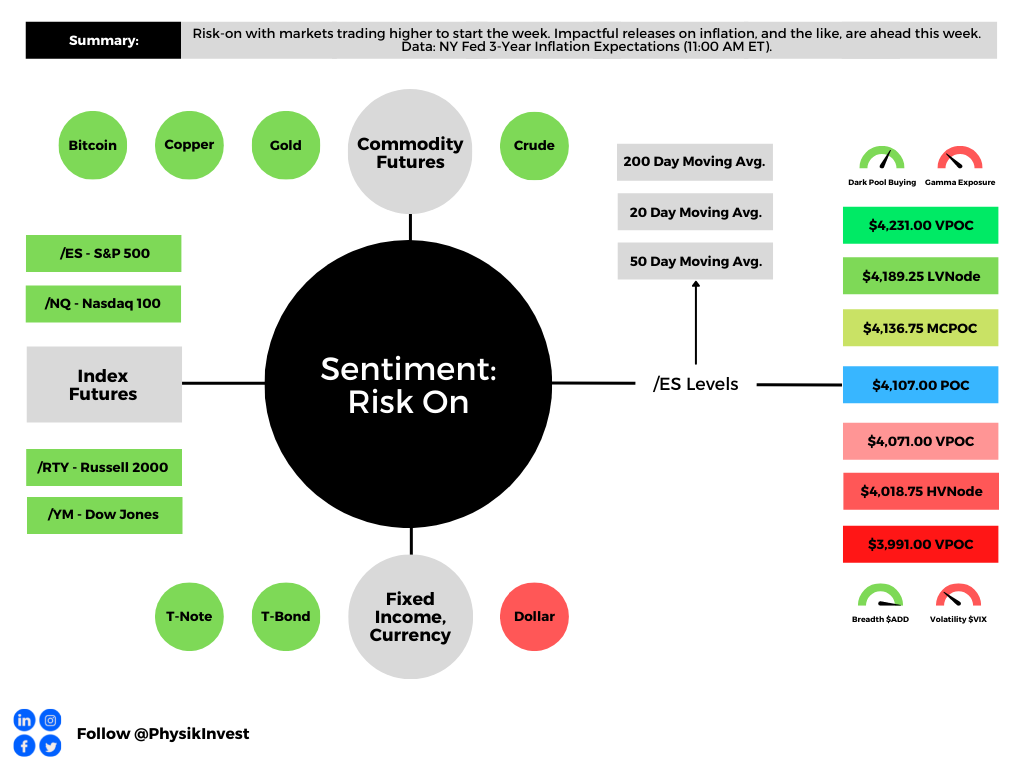
Graphic updated 7:30 AM ET. Sentiment Risk-On if expected /ES open is above the prior day’s range. /ES levels are derived from the profile graphic at the bottom of the following section. Levels may have changed since initially quoted; click here for the latest levels. SqueezeMetrics Dark Pool Index (DIX) and Gamma (GEX) calculations are based on where the prior day’s reading falls with respect to the MAX and MIN of all occurrences available. A higher DIX is bullish. At the same time, the lower the GEX, the more (expected) volatility. Learn the implications of volatility, direction, and moneyness. Breadth reflects a reading of the prior day’s NYSE Advance/Decline indicator. VIX reflects a current reading of the CBOE Volatility Index (INDEX: VIX) from 0-100.
Administrative
Hey team, before we get started, let’s address the mismatch some observed last week with this letter’s levels and S&P quotes, versus what they saw at home.
It is basically the case that our charting platform rolled over to the December S&P 500 Index futures contract on September 9, 2022. This was about 1-week ahead of the expiry of the old contract on September 16, 2022.
Going forward, unless otherwise noted, 6-days prior to the expiration of a quoted contract, the levels and prices in this letter may reflect that of the new, father-dated contract.
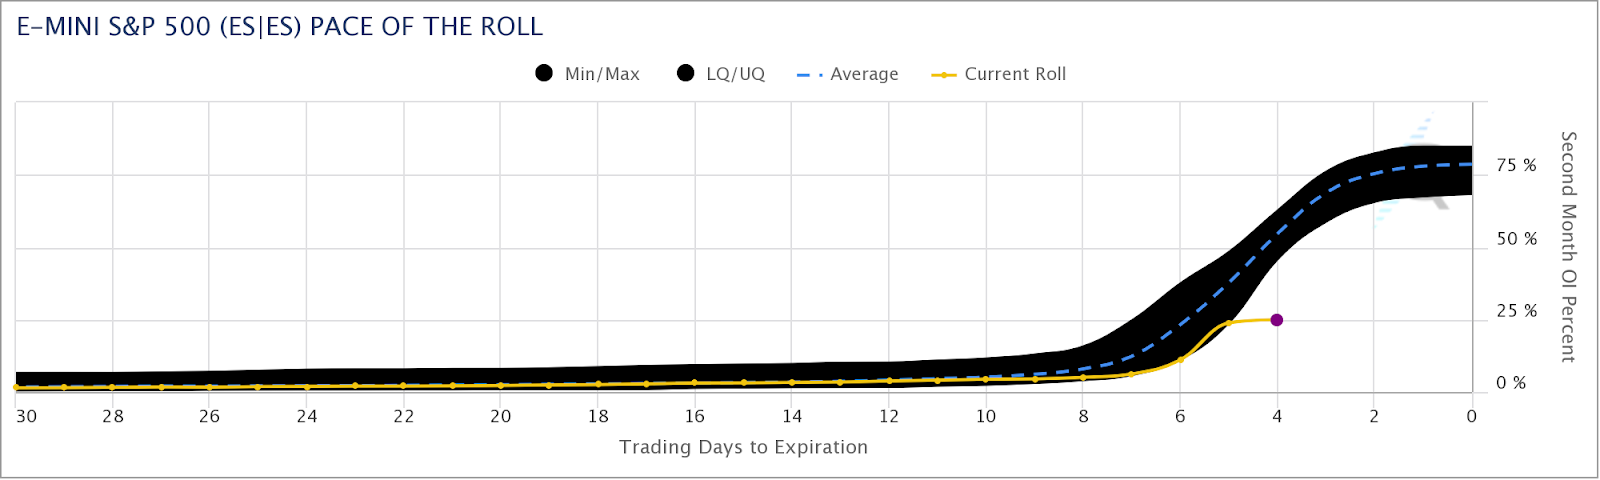
As an aside, based on CME Group Inc’s (NASDAQ: CME) Equity Quarterly Roll Analyzer Tool, the pace of the E-mini S&P 500 (FUTURE: /ES) roll is far off of what it has historically been at this stage of the roll period.
This roll, too, caught your letter’s writer by surprise. Sorry!
Graphic: Retrieved from CME Group Inc (NASDAQ: CME).
Moving on, coverage this week may be sporadic due to some uncertain travel commitments. It is seeming very likely that there may not be a letter published on September 13 and 14, 2022.
Fundamental
Let’s get into it.
At its core, there’s a lot of stuff happening on the monetary and fiscal front. Guiding some of this action, on those fronts, are (geo)political happenings, the rising tide of populism, and beyond.
On the political fronts, Ukrainians “broke through weakened Russian lines, seizing the strategic railway hub of Kupiansk and the key staging area of Izyum,” Noah Smith explained in his letter.
A timelapse of the progress over the first 4 days of Ukraine's Kharkiv offensive. pic.twitter.com/qicoHEEKPD
Recent happenings illustrate “some important principles about the broader conflict unfolding across our world between liberalism and illiberalism,” as well as what a “successful defense of Ukraine” would do to hurt “the dawn of a new age of imperial expansionism,” something we’ve talked a lot about in past letters, alongside the growing deglobalization pulse.
The go-to on the implications of these conflicts, as well as the “burgeoning monetary order,” dubbed Bretton Woods III, has been Credit Suisse Group AG’s (NYSE: CS) Zoltan Pozsar who thinks the dollar “is entering a new and rockier phase” and what “matters more than access to dollars is access to commodities and actual things.”
From hereon, Pozsar thinks “commodity prices can go much higher, … and a dollar can get devalued in terms of commodities.”
In the face of geopolitical and supply chokepoints (further bolstered by such things as railroad strikes), as well as the fragmentation of “the physical world,” it’s no “longer appropriate to think about the world as a unified whole,” Pozsar explains.
Potentially at hand is a “self-reinforcing ‘dollar doom loop,’” Jon Turek of JST Advisors adds in the earlier quoted article. That’s big since, as we once explained, the dollar is the dominant currency for carry due to the easy monetary policies that removed the risk of a strong dollar.
“Non-US entities make dollar-based loans and transactions … because it’s considered more trustworthy than native fiat,” Bankless explained. “When there’s a disruption in global cash flows, there’s effectively a short squeeze on the dollar.”
Therefore, while efforts to stem inflation bolstered by supply chokepoints continue, “the stronger the dollar gets in comparison, the less tenable it becomes as a global reserve.”
That is pressure on the long-term trajectory of the dollar.
Ultimately, through the earlier mentioned developments, “breaking the dollar’s dominance could arguably help some countries avoid a tightening of financial conditions,” Bloomberg explains.
Accordingly, with “the dollar’s peak [] already in the rearview mirror,” concerns are amped in regard to how this impacts U.S. markets. It’s the case that U.S. market liquidity, as well as the dollar’s strong role as a reserve, put the S&P 500 at the center of the global carry regime.
Thus, an unwinding of carry may compound a market drop affecting nearly all risk assets, even housing, and prompting recession, something we shall unpack further in coming letters.
Graphic: Retrieved from The Market Ear. Via Morgan Stanley (NYSE: MS). “MS Research thinks the lows for this bear market will likely arrive in the fourth quarter with 3,400 the minimum downside and 3,000 the low if a recession arrives.”
To round out this section, a bull case is likely characterized by less outsized interest rate hikes here, in the US, with quantitative tightening (QT) ramping “to its maximal caps” with no increase in “vol or yields,” said JPMorgan Chase & Co (NYSE: JPM) market intelligence.
However, if inflation remains hot – 8% and 9% – and supply disruptions remain sticky, the Fed may continue on its path of higher for longer. That means an “outsized rate hike cadence in Nov/Dec, bringing Fed Funds above 4.0% … and QT put[ting] upward pressure on yields.”
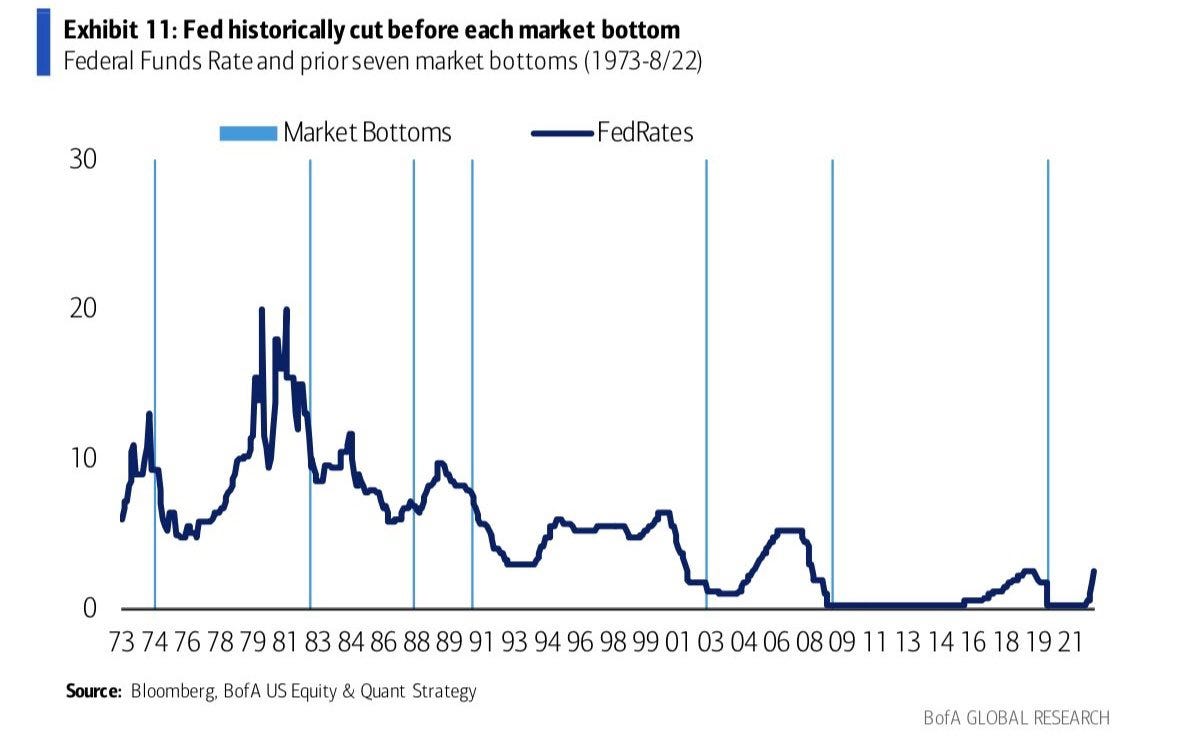
Graphic: Retrieved from Callum Thomas. Via Bank of America Corporation (NYSE: BAC). Market bottoms often appear when the Federal Reserve (Fed) begins cutting interest rates.
Positioning
Demand for protection and re-entry into shorts was the context for selling that culminated in an S&P 500 (INDEX: SPX) low at $3,900.00 last week.
It’s at this level, “where the demand for put options was concentrated,” analysis providers like SpotGamma saw “support” and, “absent an exogenous catalyst,” S&P 500 stability.
From thereon, into the end of the week, SpotGamma adds that “positive delta hedging flows” bolstered a “market move away from the $3,900.00 support.” Tools like SpotGamma’s HIRO showed volatility selling and this validated a SpotGamma call for “follow-on bullishness.”
Graphic: Retrieved from SpotGamma. Updated September 7, 2022.
Nonetheless, in light of the above fundamental and positioning contexts, after derivatives expiries this month, the stage is likely set for larger two-way ranges.
Technical
As of 7:20 AM ET, Monday’s regular session (9:30 AM – 4:00 PM ET), in the S&P 500, is likely to open in the upper part of a balanced overnight inventory, outside of prior-range and -value, suggesting a potential for immediate directional opportunity.
In the best case, the S&P 500 trades higher.
Any activity above the $4,107.00 POC puts into play the $4,136.75 MCPOC. Initiative trade beyond the MCPOC could reach as high as the $4,189.25 LVNode and $4,231.00 VPOC, or higher.
In the worst case, the S&P 500 trades lower.
Any activity below the $4,107.00 POC puts into play the $4,071.00 VPOC. Initiative trade beyond the VPOC could reach as low as the $4,018.75 HVNode and $3,991.00 VPOC, or lower.
Click here to load today’s key levels into the web-based TradingView charting platform. Note that all levels are derived using the 65-minute timeframe. New links are produced, daily.
Graphic: 65-minute profile chart of the Micro E-mini S&P 500 Futures.
Definitions
Volume Areas: A structurally sound market will build on areas of high volume (HVNodes). Should the market trend for long periods of time, it will lack sound structure, identified as low volume areas (LVNodes). LVNodes denote directional conviction and ought to offer support on any test.
If participants were to auction and find acceptance into areas of prior low volume (LVNodes), then future discovery ought to be volatile and quick as participants look to HVNodes for favorable entry or exit.
POCs: POCs are valuable as they denote areas where two-sided trade was most prevalent in a prior day session. Participants will respond to future tests of value as they offer favorable entry and exit.
MCPOCs: POCs are valuable as they denote areas where two-sided trade was most prevalent over numerous day sessions. Participants will respond to future tests of value as they offer favorable entry and exit.
About
After years of self-education, strategy development, mentorship, and trial-and-error, Renato Leonard Capelj began trading full-time and founded Physik Invest to detail his methods, research, and performance in the markets.
Capelj also develops insights around impactful options market dynamics at SpotGamma and is a Benzinga reporter.
In no way should the materials herein be construed as advice. Derivatives carry a substantial risk of loss. All content is for informational purposes only.
The daily brief is a free glimpse into the prevailing fundamental and technical drivers of U.S. equity market products. Join the 850+ that read this report daily, below!
Graphic updated 8:00 AM ET. Sentiment Risk-On if expected /ES open is above the prior day’s range. /ES levels are derived from the profile graphic at the bottom of the following section. Levels may have changed since initially quoted; click here for the latest levels. SqueezeMetrics Dark Pool Index (DIX) and Gamma (GEX) calculations are based on where the prior day’s reading falls with respect to the MAX and MIN of all occurrences available. A higher DIX is bullish. At the same time, the lower the GEX, the more (expected) volatility. Learn the implications of volatility, direction, and moneyness. Breadth reflects a reading of the prior day’s NYSE Advance/Decline indicator. VIX reflects a current reading of the CBOE Volatility Index (INDEX: VIX) from 0-100.
Fundamental
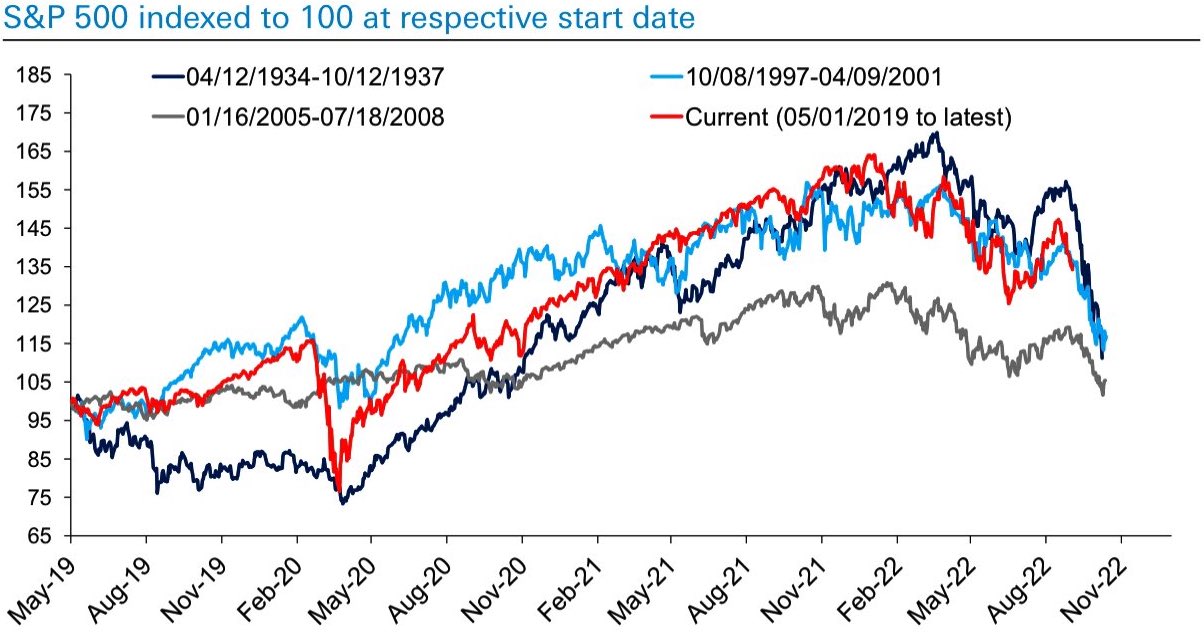
As much as it may be a so-called chart crime to overlap past market environments and project or forecast what may happen, it’s quite eerie that today’s path of returns appears similar to that of 1394-1937, 2005-2008, and 1997-2001, for example.
Graphic: Retrieved from Deutsche Bank AG (NYSE: DB).
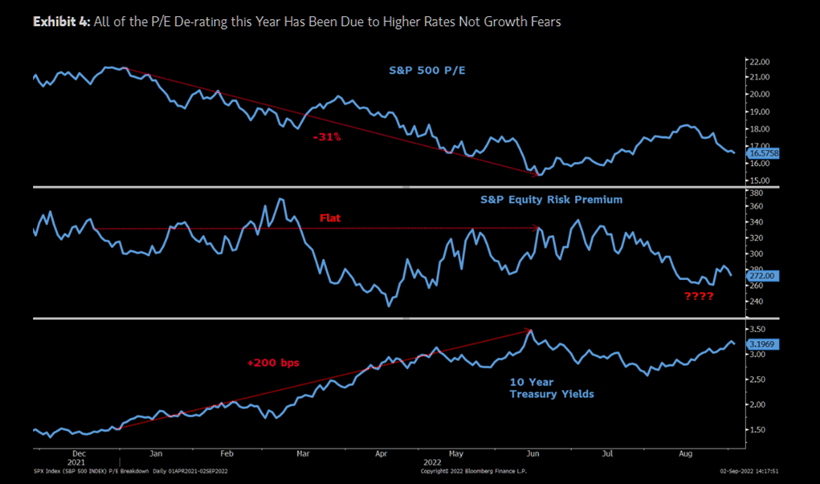
Moreover, this time around, it’s the case that markets have fallen on participants’ pricing of higher interest rates and quantitative tightening (QT).
Graphic: Retrieved from The Market Ear. Via Guggenheim Partners.
Some argue there is more to go on the pricing of a potential economic slowing happening here, in the U.S., abroad in China, and beyond.
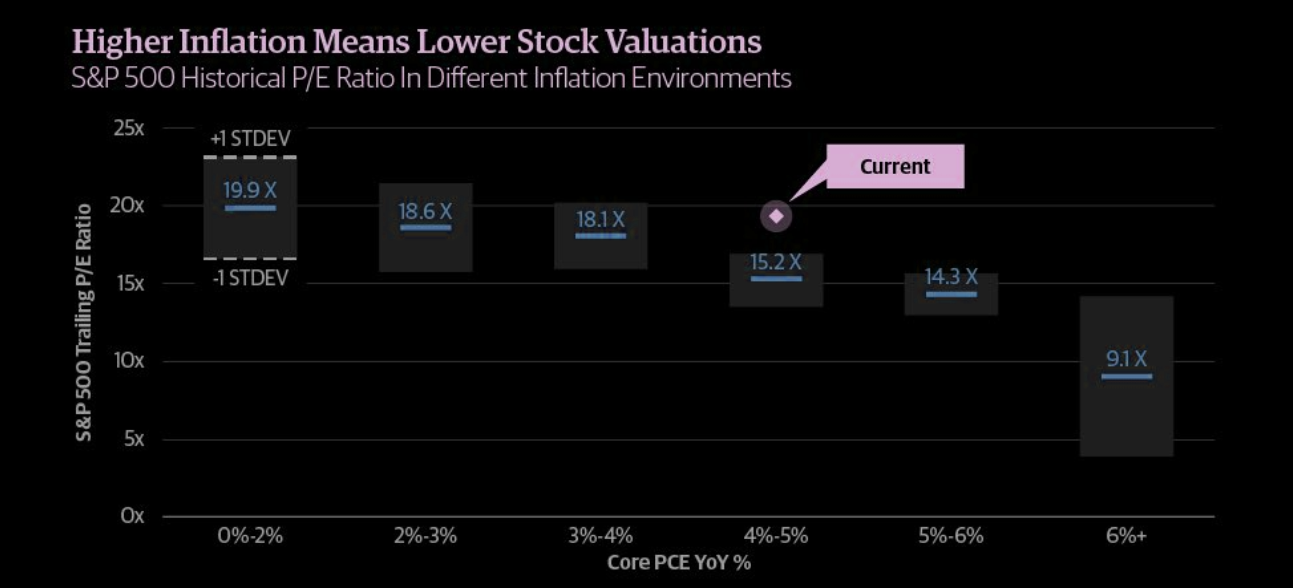
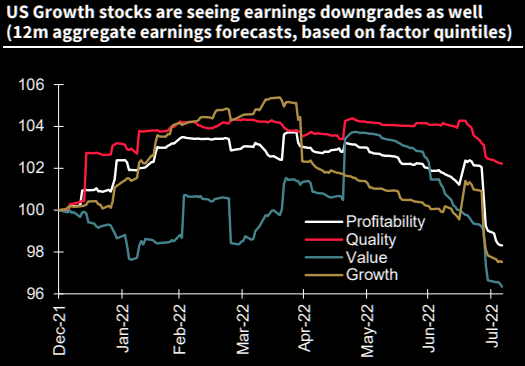
Graphic: Retrieved from Bloomberg. “Earnings are related to the economic cycle, but not tightly, and expectations for next year are intertwined with macroeconomic concerns.”
Notwithstanding, and we will end the fundamental section with this, today, Credit Suisse Group AG’s (NYSE: CS) Jonathan Golub puts forth the following:
“Although revisions are negative, projected EPS growth rates remain positive for the remainder of 2022-23. While 3Q growth has fallen to 4.7%, EPS should expand 9-10%, assuming similar beats as experienced in 2Q. Historically, earnings hold up best when inflation is elevated. Many investors are interpreting the recent decline in estimates as a harbinger to recession. Our work shows that in high inflationary periods (1973, 1980, 1981) earnings peak just 2 months prior to a recession’s onset. With EPS growth projections still positive, revisions would have to fall much more to signal an economic contraction.”
Positioning
Referring traders to a recent case study (HERE) on how to play this market environment, as well as the impacts of implied volatility (IVOL) compression September 8 (HERE).
After a period of sideways-to-lower, markets are rebounding, boosted by IVOL compression and traders’ re-positioning ahead of potential including inflation and monetary policy updates.
Notwithstanding, as Kai Volatility’s Cem Karsan well explained to Charles Schwab Corporation’s (NYSE: SCHW) TD Ameritrade Network, traders must look out for the “window of real risk.”
The energy for a downside move “is significant” after this year’s decimation of “skew and volatility,” he said. “Hedging for convexity is in the 5th percentile.”
This is because participants hedged heading into the decline, and sold skew as the markets explored lower. After the current period of volatility supply passes, Karsan added, and markets were to trade lower, there is the risk of a reach for protection and a fatter tail.
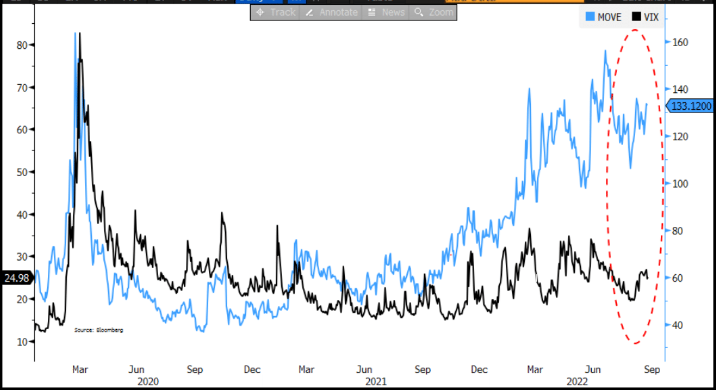
Graphic: Merrill Lynch Options Volatility Estimate (INDEX: MOVE), a measure of volatility for the US Treasury market, versus the Cboe Volatility Index (INDEX: VIX), a measure of volatility for the equity market, diverged this year. This is, in part, due to the supply of volatility in equities.
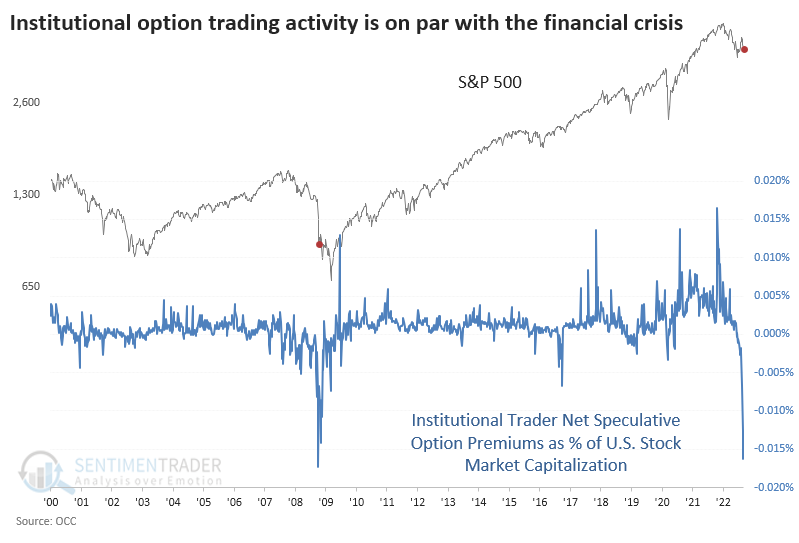
Should nothing happen, then the unwind of the recent speculation amongst “family offices and institutions front-running the speculative hedges that are more than 50 units,” will add support.
Graphic: Retrieved from SentimenTrader on September 7, 2022.
Technical
As of 6:40 AM ET, Friday’s regular session (9:30 AM – 4:00 PM ET), in the S&P 500, is likely to open in the upper part of a positively skewed overnight inventory, outside of prior-range and -value, suggesting a potential for immediate directional opportunity.
In the best case, the S&P 500 trades higher.
Any activity above the $4,069.25 HVNode puts into play the $4,107.00 VPOC. Initiative trade beyond the VPOC could reach as high as the $4,136.75 MCPOC and $4,189.25 LVNode, or higher.
In the worst case, the S&P 500 trades lower.
Any activity below the $4,069.25 HVNode puts into play the $4,018.75 HVNode. Initiative trade beyond the HVNode could reach as low as the $3,991.00 VPOC and $3,952.75 LVNode, or lower.
Click here to load today’s key levels into the web-based TradingView charting platform. Note that all levels are derived using the 65-minute timeframe. New links are produced, daily.
Graphic: 65-minute profile chart of the Micro E-mini S&P 500 Futures.
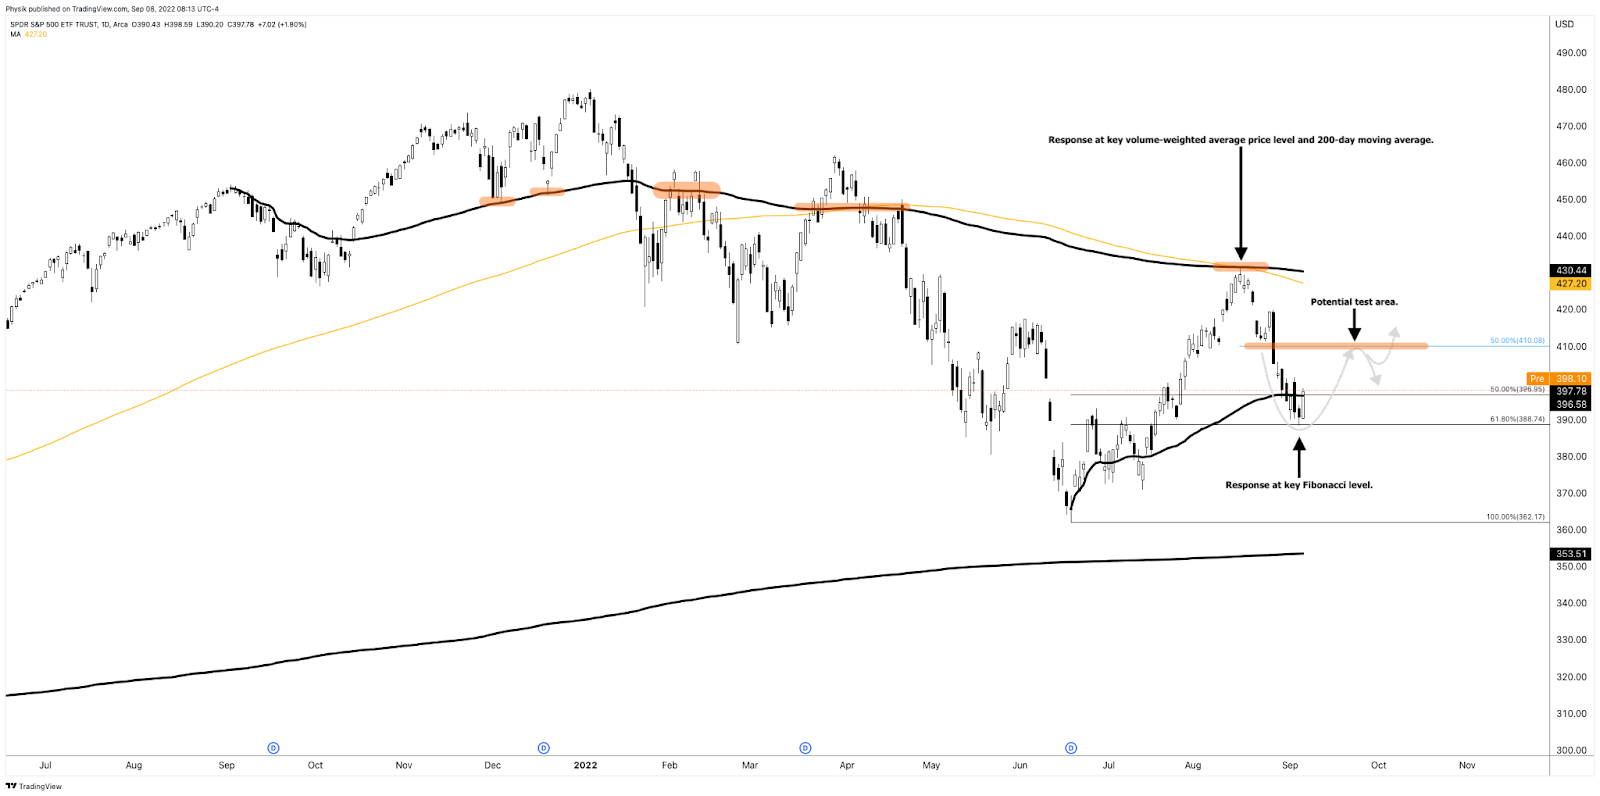
Considerations: Responsiveness near key-technical areas (that are discernable visually on a chart), suggests technically-driven traders with short time horizons are very active.
Such traders often lack the wherewithal to defend retests and, additionally, the type of trade may be indicative of the other time frame participants waiting for more information to initiate trades.
Graphic: Updated 9/8/2022. The daily chart of the SPDR S&P 500 ETF Trust (NYSE: SPY).
Definitions
Volume Areas: A structurally sound market will build on areas of high volume (HVNodes). Should the market trend for long periods of time, it will lack sound structure, identified as low volume areas (LVNodes). LVNodes denote directional conviction and ought to offer support on any test.
If participants were to auction and find acceptance into areas of prior low volume (LVNodes), then future discovery ought to be volatile and quick as participants look to HVNodes for favorable entry or exit.
POCs: POCs are valuable as they denote areas where two-sided trade was most prevalent in a prior day session. Participants will respond to future tests of value as they offer favorable entry and exit.
MCPOCs: POCs are valuable as they denote areas where two-sided trade was most prevalent over numerous day sessions. Participants will respond to future tests of value as they offer favorable entry and exit.
Volume-Weighted Average Prices (VWAPs): A metric highly regarded by chief investment officers, among other participants, for quality of trade. Additionally, liquidity algorithms are benchmarked and programmed to buy and sell around VWAPs.
About
After years of self-education, strategy development, mentorship, and trial-and-error, Renato Leonard Capelj began trading full-time and founded Physik Invest to detail his methods, research, and performance in the markets.
Capelj also develops insights around impactful options market dynamics at SpotGamma and is a Benzinga reporter.
In no way should the materials herein be construed as advice. Derivatives carry a substantial risk of loss. All content is for informational purposes only.
The daily brief is a free glimpse into the prevailing fundamental and technical drivers of U.S. equity market products. Join the 850+ that read this report daily, below!
Graphic updated 7:15 AM ET. Sentiment Neutral if expected /ES open is inside of the prior day’s range. /ES levels are derived from the profile graphic at the bottom of the following section. Levels may have changed since initially quoted; click here for the latest levels. SqueezeMetrics Dark Pool Index (DIX) and Gamma (GEX) calculations are based on where the prior day’s reading falls with respect to the MAX and MIN of all occurrences available. A higher DIX is bullish. At the same time, the lower the GEX, the more (expected) volatility. Learn the implications of volatility, direction, and moneyness. Breadth reflects a reading of the prior day’s NYSE Advance/Decline indicator. VIX reflects a current reading of the CBOE Volatility Index (INDEX: VIX) from 0-100.
Fundamental
Please pardon the light letter, team.
The Federal Reserve (Fed) Chair Jerome Powell will speak on monetary policy today at 9:10 AM ET. He is likely to embolden the tone set forth yesterday by the Fed’s Lael Brainard who said that higher rates for far longer seem necessary at this juncture.
The base case calls for a 75 basis point hike to interest rates this month, followed by 50 basis points in November, according to Goldman Sachs Group Inc (NYSE: GS) forecasts.
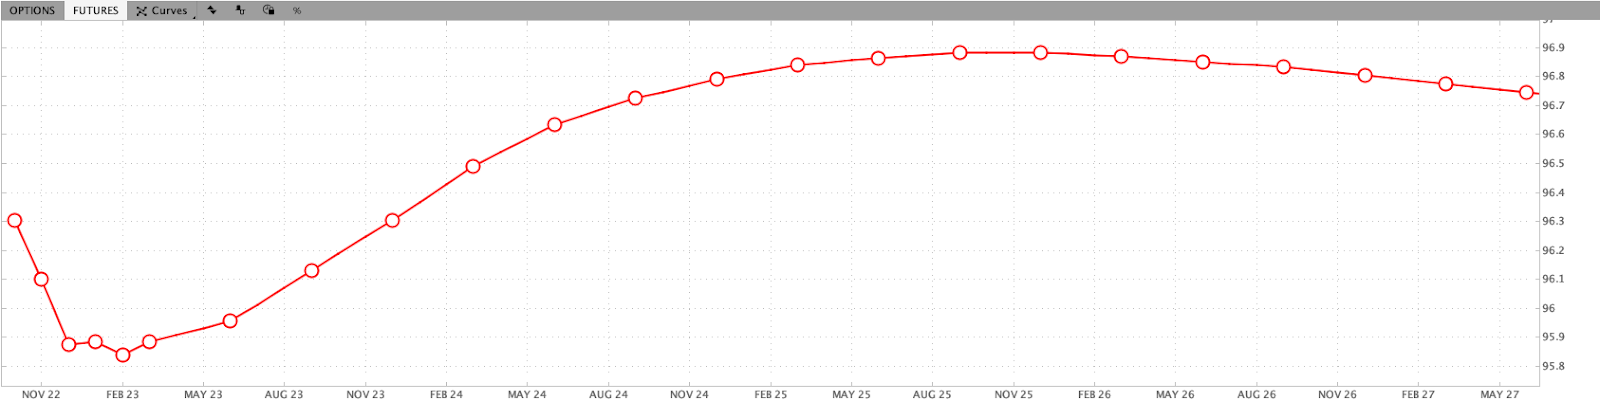
A quick check of the Eurodollar – which reflects the interest offered on U.S. dollar-denominated deposits held at banks outside of the U.S. (i.e., participants’ outlook on interest rates) – shows a peak in the overnight rate at 4.155% in February of 2023. From thereon, rate cuts are implied.
Graphic: Via Charles Schwab Corporation-owned (NYSE: SCHW) TD Ameritrade’s Thinkorswim.
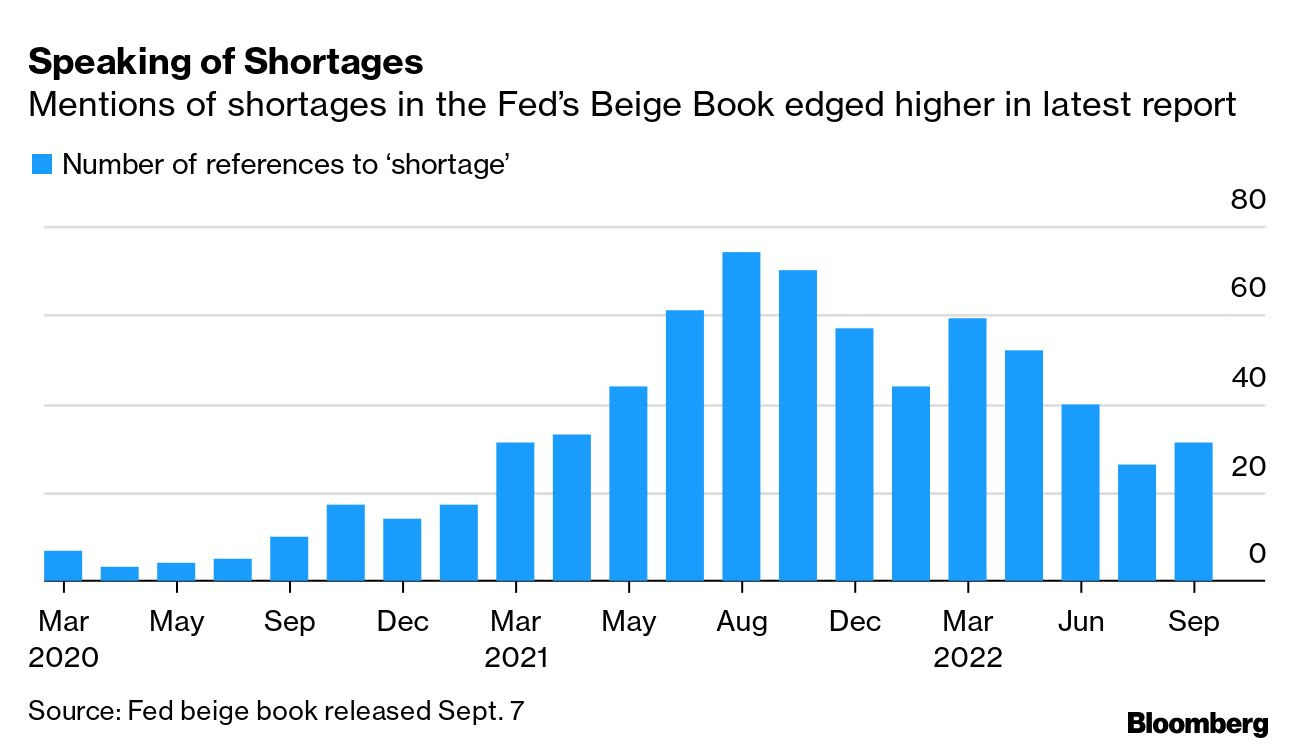
It’s the case that monetary policies implemented resulted in too many dollars (still) chasing too few goods. We spoke on supply side dislocations last week and put forth that, from a monetary perspective, the Fed, among its peers like the ECB, can only and will tighten to stem inflationary pressures that are (to remain) structural.
Graphic: Retrieved from Bloomberg. “The number of references to the word ‘shortage’ in the Fed’s latest Beige Book report edged higher after declining for three straight reports, according to a Bloomberg tally. Job markets remained tight and labor shortages weighed on several sectors. That plus continued supply-chain snarls hampered manufacturing, the Fed said.”
It is the case that the economy is on a path that is “L”-shaped (i.e., vertical drop in activity via recession, and flatline for a period of time as rates remain higher for longer to prevent a sharp rise in inflation, again).
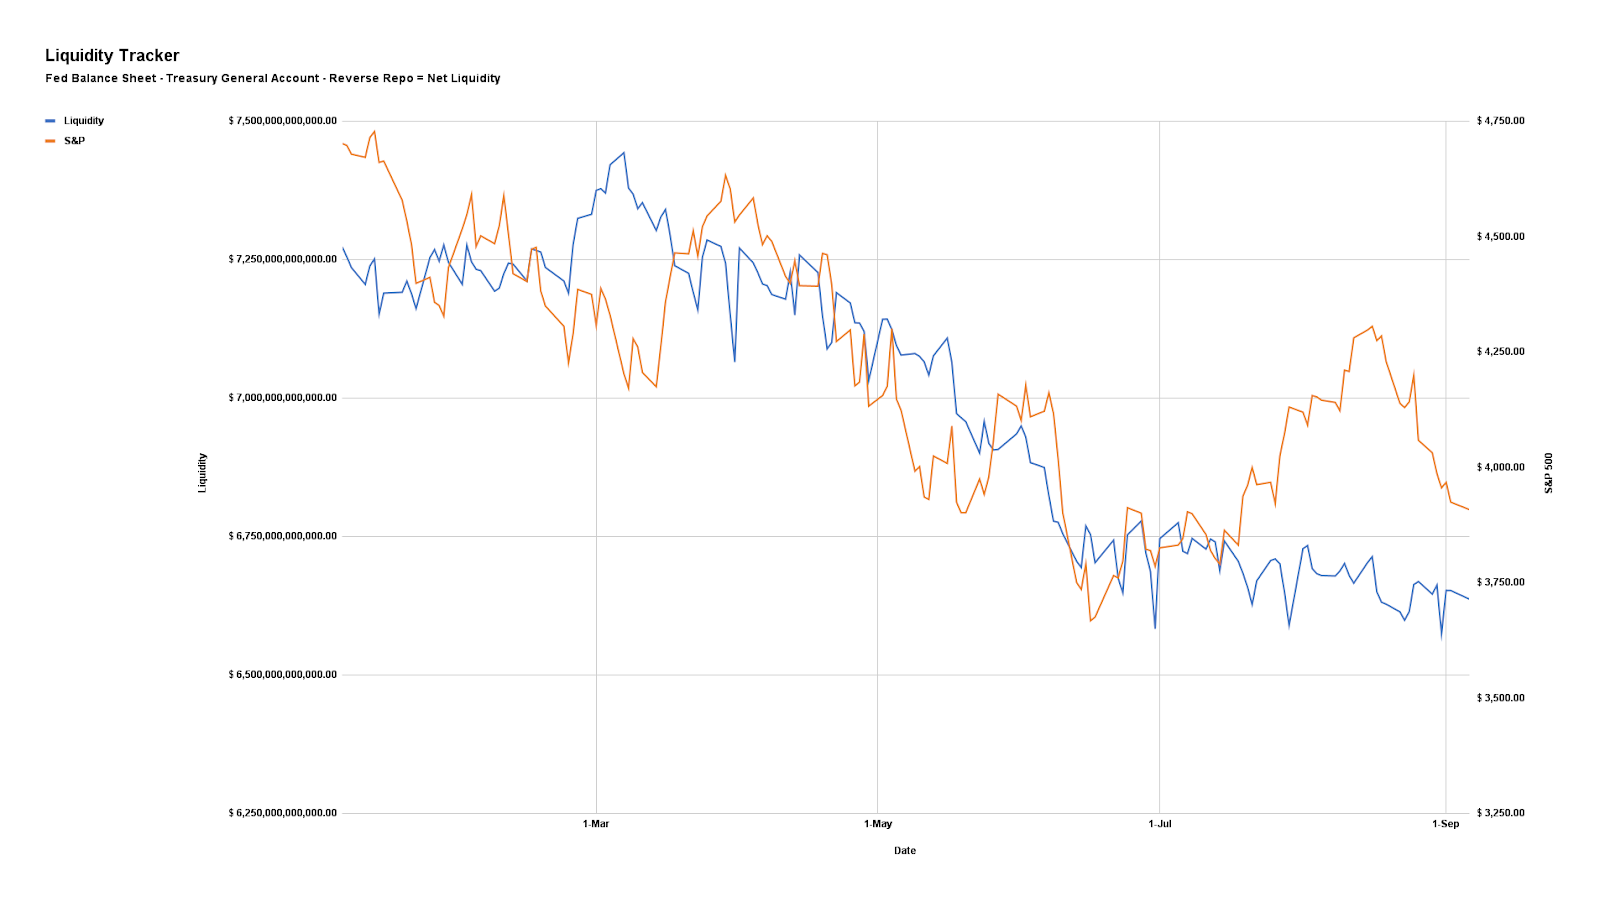
Zoltan Pozsar of Credit Suisse Group AG (NYSE: CS) puts forth that policymakers now have to “generate a round of negative wealth effects to lower demand such that it becomes more in line with the new realities of supply.”
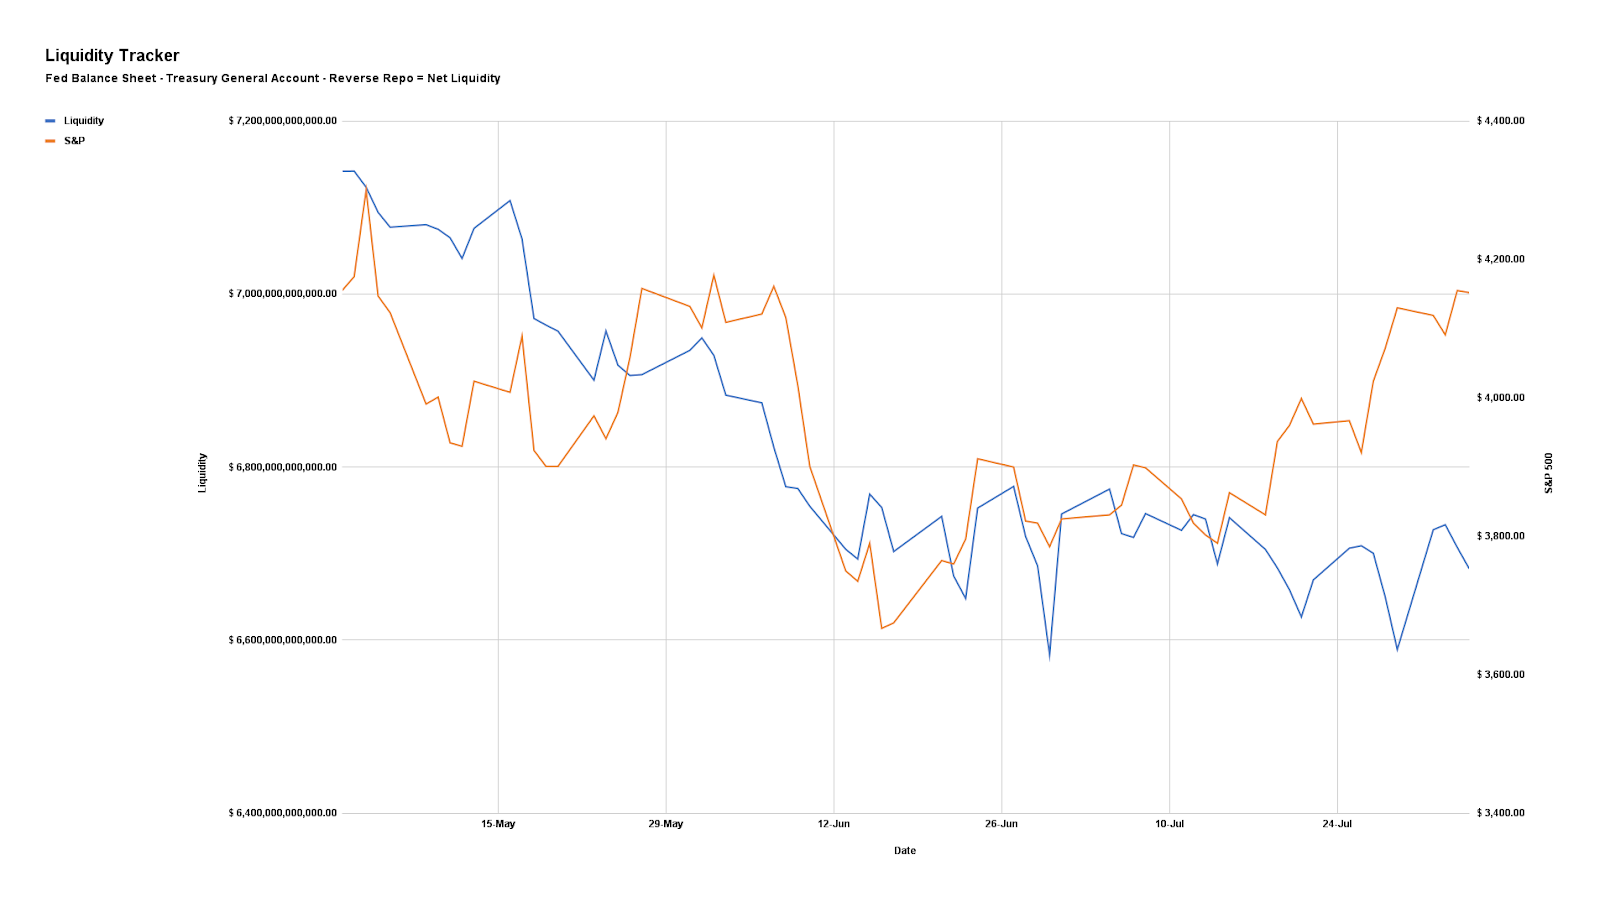
Graphic: Via Physik Invest. Data compiled by @jkonopas623. Fed Balance Sheet data, here. Treasury General Account Data, here. Reverse Repo data, here. NL = BS – TGA – RRP.
Technical
Implied volatility (IVOL) is wound and markets are in an environment characterized by two-way ranges that are larger. Yesterday, we unpacked one way traders could have played the entry into this environment.
Further, as SpotGamma puts it well, a positive response to Powell’s remarks, into and through events such as the next update on consumer prices and the Federal Open Market Committee (FOMC) meeting, opens the door to IVOL compression and this would be “a boost for equities.”
That’s because the Delta risk counterparties are exposed to by holding short put options, for instance, reduces with falling IVOL. Accordingly, since the short puts carry less positive Delta, the counterparty reduces its negative Delta exposure via the underlying future or stock, which can support markets.
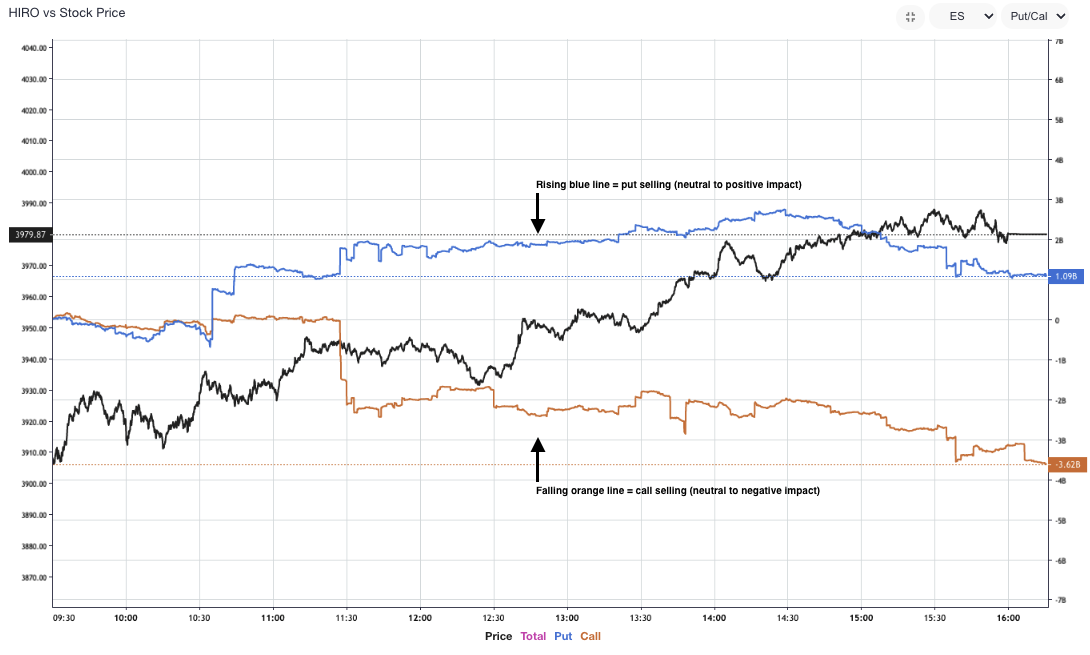
Graphic: Retrieved via SpotGamma’s Hedging Impact of Real-Time Options (HIRO) indicator. S&P 500 volatility selling coincides with a drop in IVOL and a price rise in the underlying.
Technical
As of 7:15 AM ET, Thursday’s regular session (9:30 AM – 4:00 PM ET), in the S&P 500, is likely to open in the middle part of a balanced overnight inventory, inside of prior-range and -value, suggesting a limited potential for immediate directional opportunity.
In the best case, the S&P 500 trades higher.
Any activity above the $3,988.25 HVNode puts into play the $4,018.75 HVNode. Initiative trade beyond the latter could reach as high as the $4,064.00 RTH High and $4,107.00 VPOC, or higher.
In the worst case, the S&P 500 trades lower.
Any activity below the $3,988.25 HVNode puts into play the $3,952.75 LVNode. Initiative trade beyond the LVNode could reach as low as the $3,925.00 VPOC and $3,884.25 LVNode, or lower.
Click here to load today’s key levels into the web-based TradingView charting platform. Note that all levels are derived using the 65-minute timeframe. New links are produced, daily.
Graphic: 65-minute profile chart of the Micro E-mini S&P 500 Futures.
Considerations: Responsiveness near key-technical areas (that are discernable visually on a chart), suggests technically-driven traders with short time horizons are very active.
Such traders often lack the wherewithal to defend retests and, additionally, the type of trade may be indicative of the other time frame participants waiting for more information to initiate trades.
Graphic: Daily chart of the SPDR S&P 500 ETF Trust (NYSE: SPY).
Definitions
Volume Areas: A structurally sound market will build on areas of high volume (HVNodes). Should the market trend for long periods of time, it will lack sound structure, identified as low volume areas (LVNodes). LVNodes denote directional conviction and ought to offer support on any test.
If participants were to auction and find acceptance into areas of prior low volume (LVNodes), then future discovery ought to be volatile and quick as participants look to HVNodes for favorable entry or exit.
POCs: POCs are valuable as they denote areas where two-sided trade was most prevalent in a prior day session. Participants will respond to future tests of value as they offer favorable entry and exit.
MCPOCs: POCs are valuable as they denote areas where two-sided trade was most prevalent over numerous day sessions. Participants will respond to future tests of value as they offer favorable entry and exit.
Volume-Weighted Average Prices (VWAPs): A metric highly regarded by chief investment officers, among other participants, for quality of trade. Additionally, liquidity algorithms are benchmarked and programmed to buy and sell around VWAPs.
About
After years of self-education, strategy development, mentorship, and trial-and-error, Renato Leonard Capelj began trading full-time and founded Physik Invest to detail his methods, research, and performance in the markets.
Capelj also develops insights around impactful options market dynamics at SpotGamma and is a Benzinga reporter.
In no way should the materials herein be construed as advice. Derivatives carry a substantial risk of loss. All content is for informational purposes only.
The daily brief is a free glimpse into the prevailing fundamental and technical drivers of U.S. equity market products. Join the 800+ that read this report daily, below!
Graphic updated 7:30 AM ET. Sentiment Neutral if expected /ES open is inside of the prior day’s range. /ES levels are derived from the profile graphic at the bottom of the following section. Levels may have changed since initially quoted; click here for the latest levels. SqueezeMetrics Dark Pool Index (DIX) and Gamma (GEX) calculations are based on where the prior day’s reading falls with respect to the MAX and MIN of all occurrences available. A higher DIX is bullish. At the same time, the lower the GEX, the more (expected) volatility. Learn the implications of volatility, direction, and moneyness. Breadth reflects a reading of the prior day’s NYSE Advance/Decline indicator. VIX reflects a current reading of the CBOE Volatility Index (INDEX: VIX) from 0-100.
Fundamental
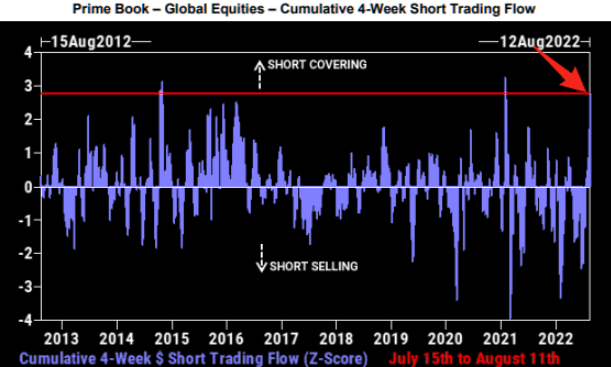
According to Goldman Sachs Group Inc (NYSE: GS) Prime Services, this is the third largest short-covering rally in three years.
Graphic: Retrieved from The Market Ear. Via Goldman Sachs Group Inc.
The rally, as discussed in past commentaries, is, in part, the result of “volatility-target funds” and “trend-following funds” getting back into the market as volatility falls, sentiment and data on jobs improve, as well as cooler-than-expected inflation figures.
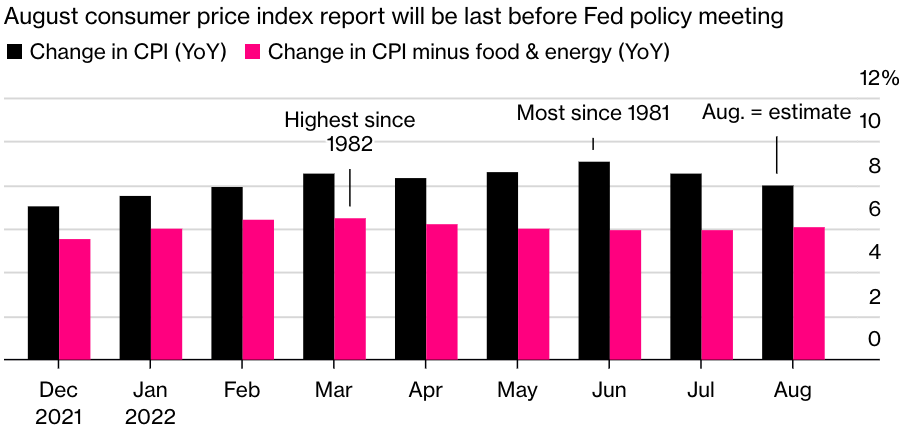
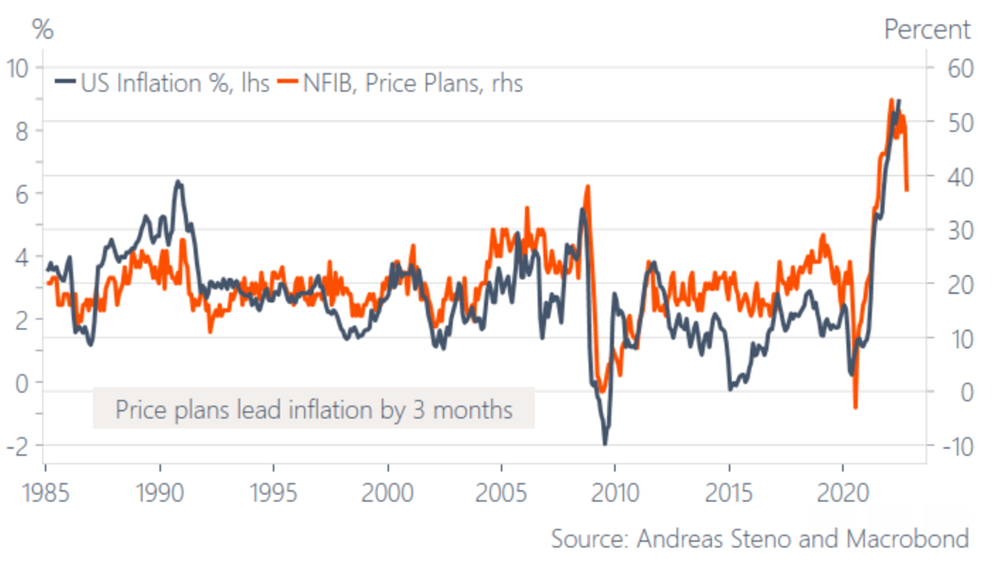
Graphic: Retrieved from Stenos Signals. “Unless SMEs are lying, inflation has peaked for now … Will it change the market psychology?”
“The machines seem hell-bent on pushing the financial conditions easing trade,” said Dennis DeBusschere, the founder of 22V Research.
“Machines are eating the words from the Fed speakers for breakfast.”
Graphic: Retrieved from Bloomberg. “The issue is the giant pool of systematic funds that moves in and out of the market based on how turbulent prices are. With peace at hand of late amid a four-week rally, so-called volatility-target funds and similar strategies such as risk parity are buying between $2 billion to $4 billion of stocks per day, according to an estimate by JPMorgan Chase & Co.’s Kate Gandolfo.”
Notwithstanding, JPMorgan Chase & Co (NYSE: JPM) estimates overall CTA exposures remain subdued. To incite ultra-impactful “buy signals” the S&P 500 would have to rise to $4,400.00.
This “would prompt CTAs to step up buying” and, potentially, turn “‘max long’ on stocks, buying probably $100 billion to $200 billion across various trend-following strategies.”
Though the S&P 500 has yet to retake the $4,400.00 level, likely to remain as support until the end of the week, at least, are options hedging flows, which we talked about last week.
“That can last perhaps another 100 days if volatility stays low,” JPM’s Kate Gandolfo suggested.
For context, at least at the index level, customers are short call, long put against their equity. In a rising market, the call side solicits increased hedging on the part of counterparties.
If counterparties are long the call, and the market is rising (falling), they must sell (buy) underlying to re-hedge. This can further contain realized volatility and support the market.
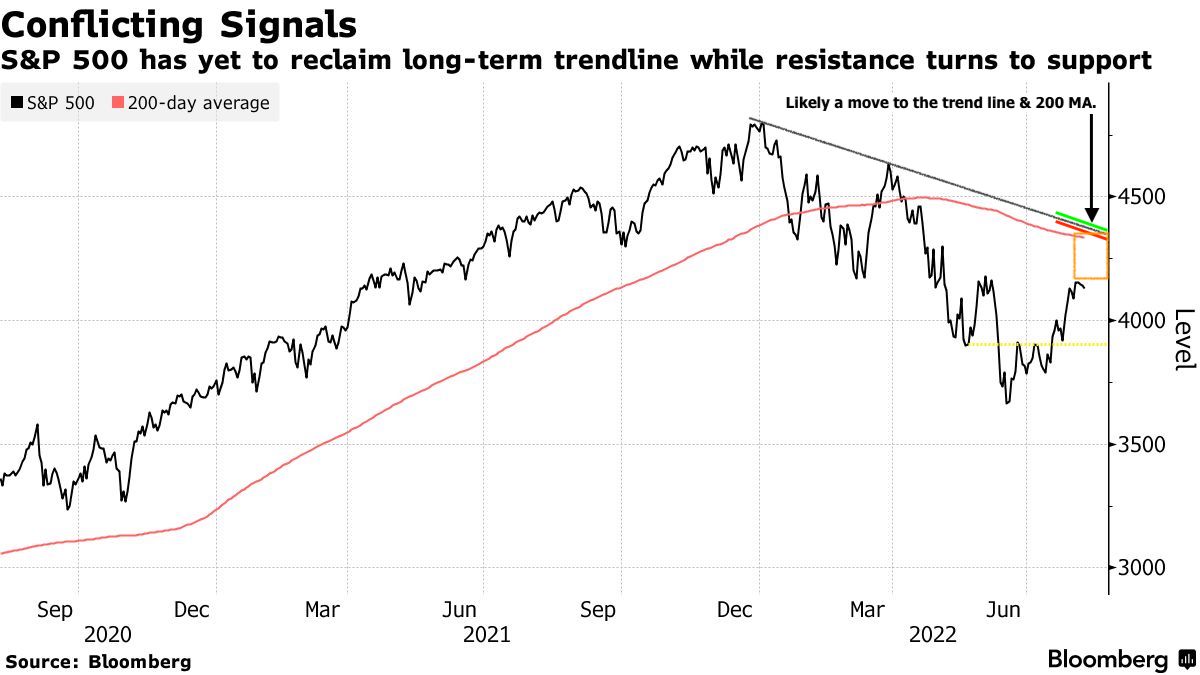
To act on this information, you are best off shrinking your timeframe and using if/then statements to put on trades. For instance, if the market rises past the downtrend line in the S&P 500, then the 2022 equity bear market is over. We should bias ourselves long, at that point.
Graphic: Retrieved from Bloomberg. Drawn on by Physik Invest.
Accordingly, over a larger horizon, its growth impulses, as well as the availability of credit and liquidity determine whether a market’s movements have legs.
Accordingly, “in the 1970s, the peak in inflation proved THE timing to load up on risk assets, but the missing link is a bottoming growth cycle,” Andreas Steno Larsen explained.
“The swiftly weakening growth cycle may rather be the EXACT reason why inflation has started to fade.”
In fact, Credit Suisse Group AG’s (NYSE: CS) Zoltan Pozsar sees inflation as a longer-lasting structural issue as “the pillars of the low inflation world – [de-globalization and populism] – are changing.”
As Crossmark Global Investments’ Victoria Fernandez puts it well, “We have probably reached peak inflation, but the stickiness of the inflation that remains (i.e., rents) keeps pressure on the Fed and therefore the markets.”
“We expected a summer rally due to better-than-expected earnings, but we aren’t satisfied that this is sustainable. A soft landing is still achievable, but we still anticipate volatility with so many unknowns out there.”
Graphic: Retrieved from Callum Thomas’ Weekly S&P 500 ChartStorm. The “seasonal/cycle outlook is for a lower low or retest of the lows over the next three months as we are in the worst two months of the year and are smack dab in the *Weak Spot* of the 4-Year Cycle”
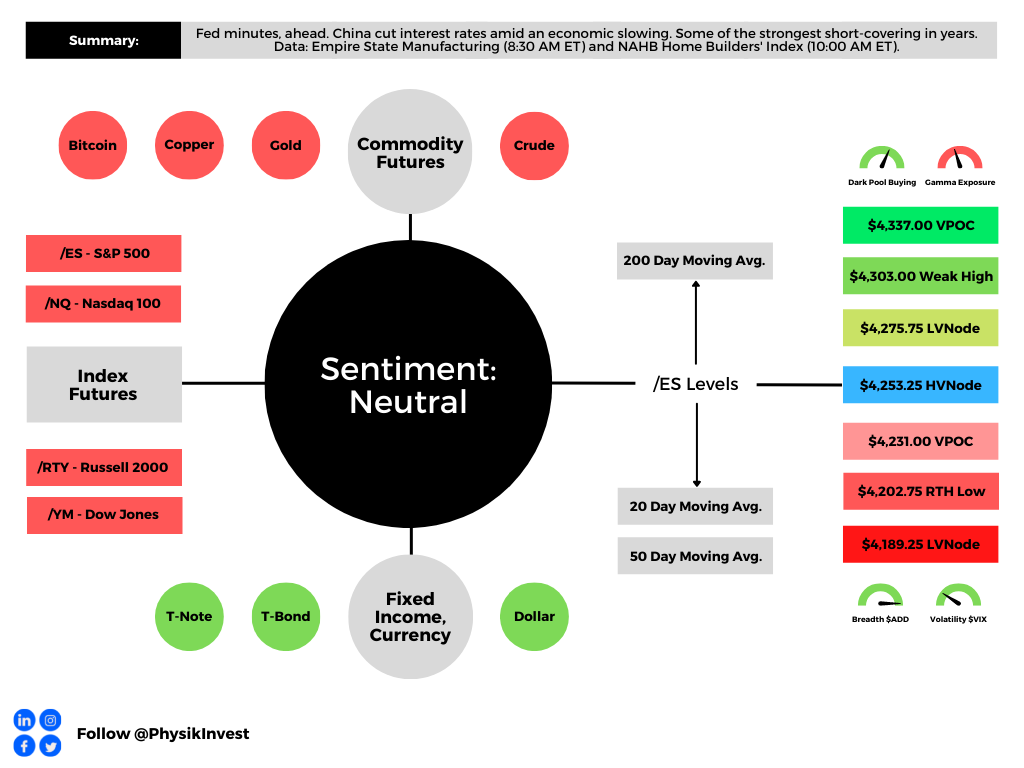
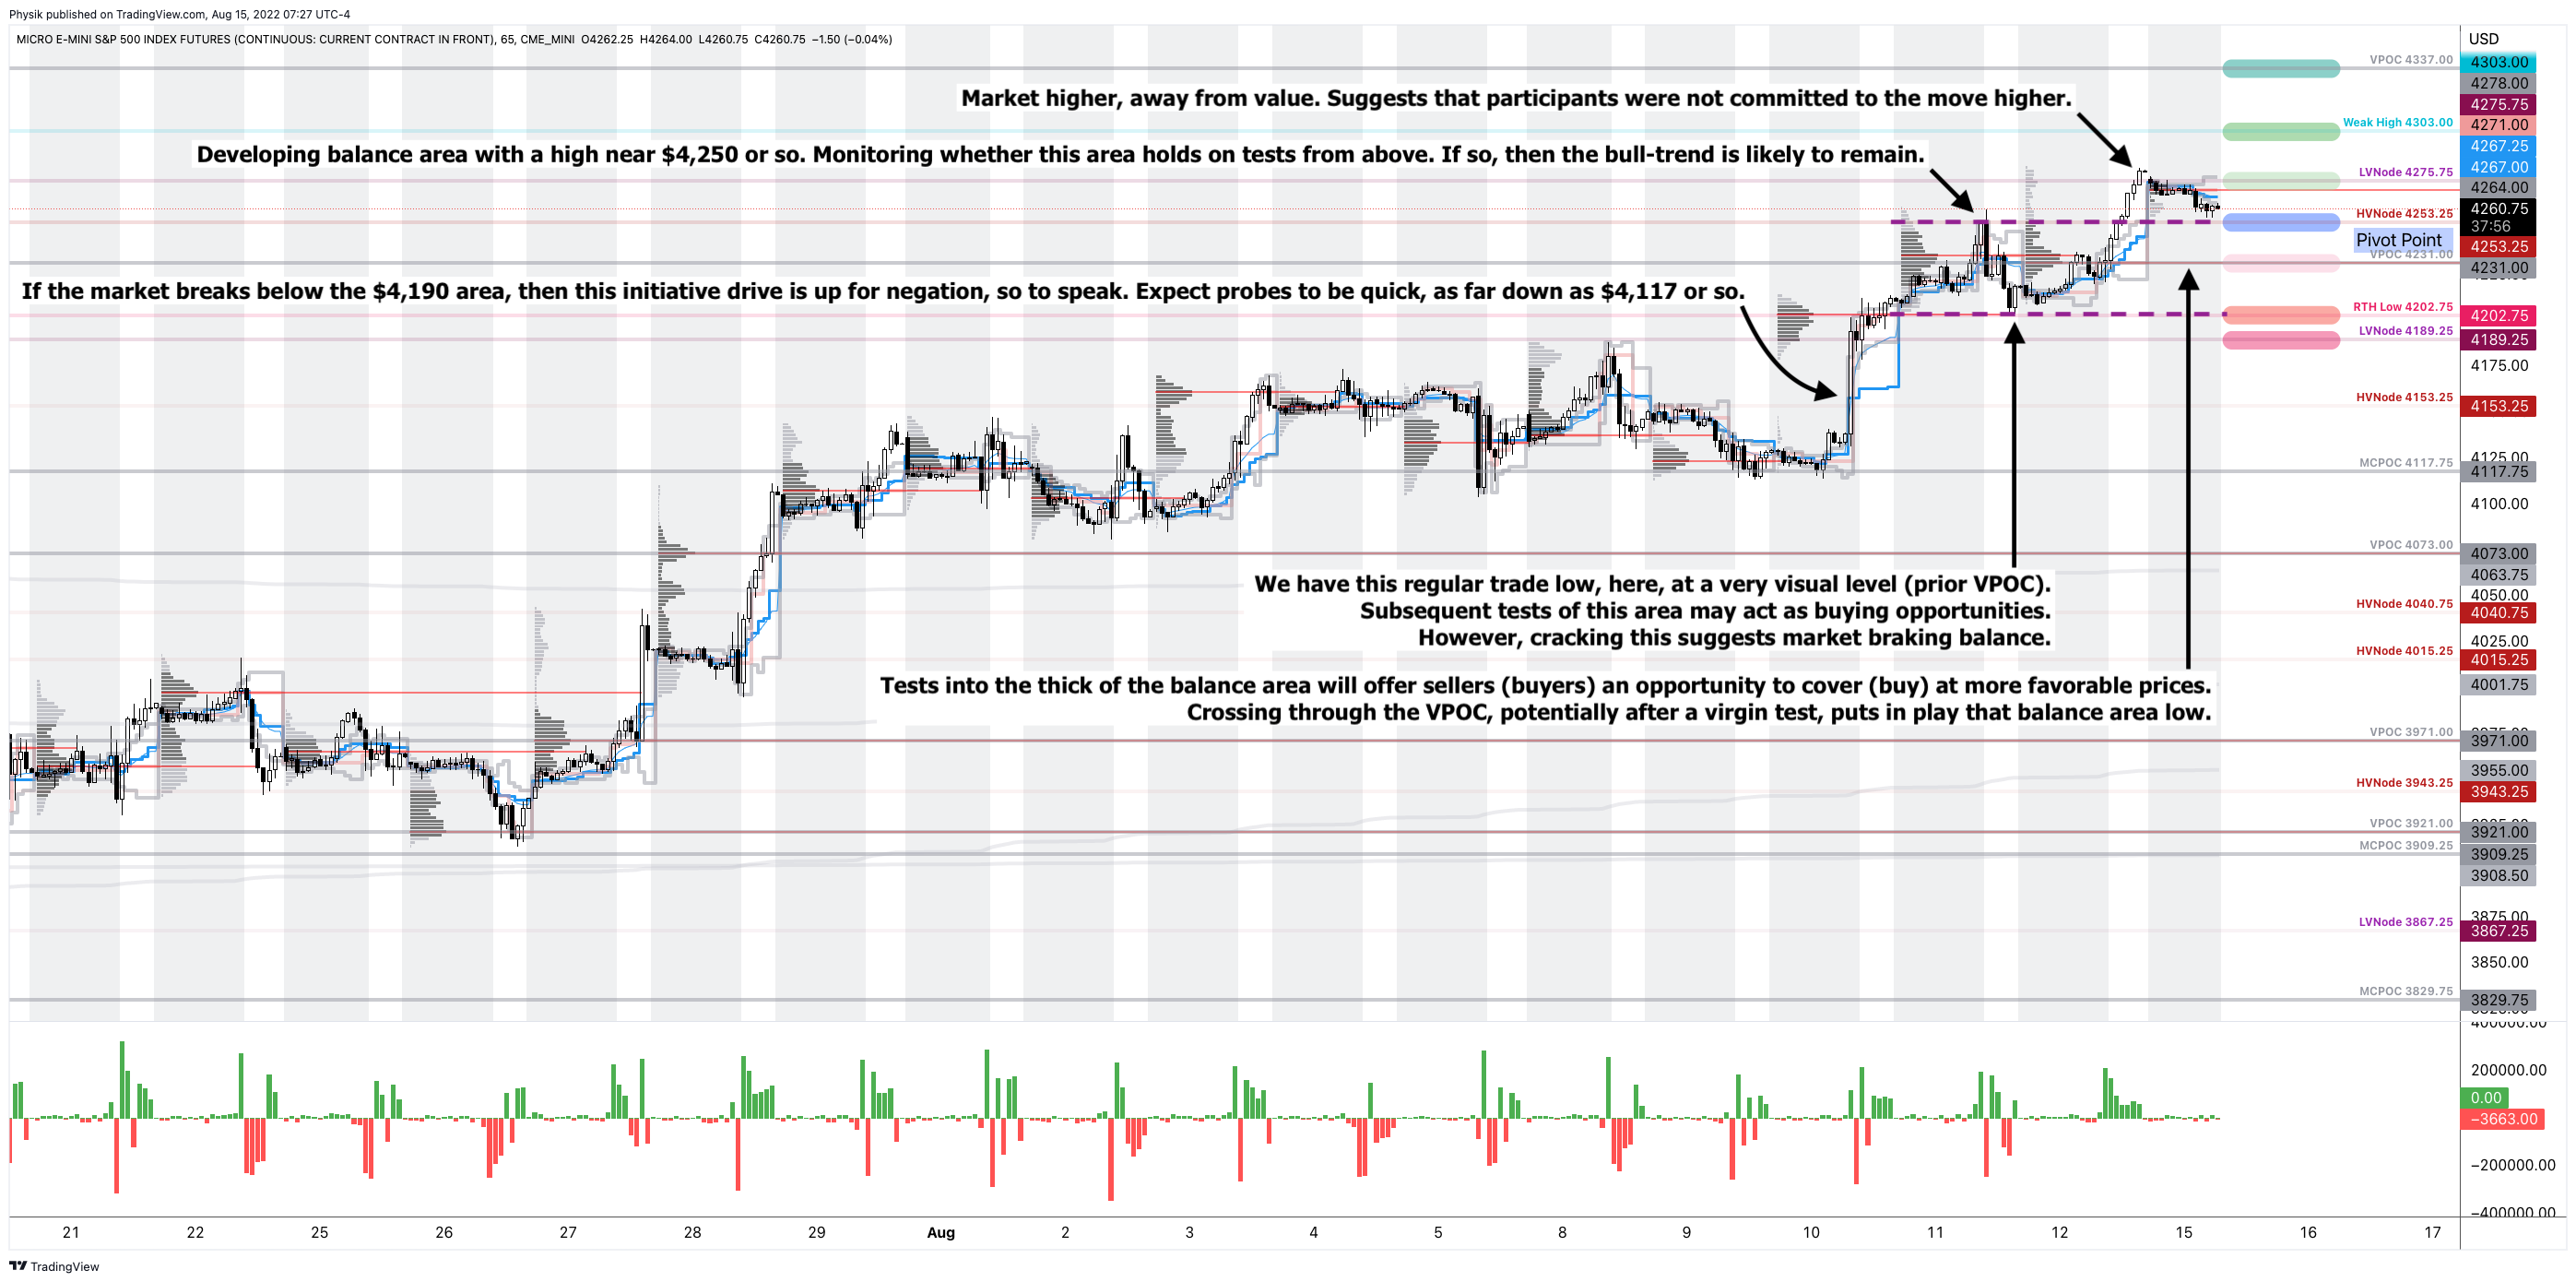
As of 7:30 AM ET, Monday’s regular session (9:30 AM – 4:00 PM ET), in the S&P 500, is likely to open in the lower part of a negatively skewed overnight inventory, inside of prior-range and -value, suggesting a limited potential for immediate directional opportunity.
In the best case, the S&P 500 trades higher.
Any activity above the $4,253.25 HVNode puts into play the $4,275.75 LVNode. Initiative trade beyond the LVNode could reach as high as the $4,303.00 Weak High and $4,337.00 VPOC, or higher.
In the worst case, the S&P 500 trades lower.
Any activity below the $4,253.25 HVNode puts into play the $4,231.00 VPOC. Initiative trade beyond the VPOC could reach as low as the $4,202.75 RTH Low and $4,189.25 LVNode, or lower.
Click here to load today’s key levels into the web-based TradingView charting platform. Note that all levels are derived using the 65-minute timeframe. New links are produced, daily.
Graphic: 65-minute profile chart of the Micro E-mini S&P 500 Futures.
Definitions
Volume Areas: A structurally sound market will build on areas of high volume (HVNodes). Should the market trend for long periods of time, it will lack sound structure, identified as low volume areas (LVNodes). LVNodes denote directional conviction and ought to offer support on any test.
If participants were to auction and find acceptance into areas of prior low volume (LVNodes), then future discovery ought to be volatile and quick as participants look to HVNodes for favorable entry or exit.
POCs: POCs are valuable as they denote areas where two-sided trade was most prevalent in a prior day session. Participants will respond to future tests of value as they offer favorable entry and exit.
MCPOCs: POCs are valuable as they denote areas where two-sided trade was most prevalent over numerous day sessions. Participants will respond to future tests of value as they offer favorable entry and exit.
Volume-Weighted Average Prices (VWAPs): A metric highly regarded by chief investment officers, among other participants, for quality of trade. Additionally, liquidity algorithms are benchmarked and programmed to buy and sell around VWAPs.
About
After years of self-education, strategy development, mentorship, and trial-and-error, Renato Leonard Capelj began trading full-time and founded Physik Invest to detail his methods, research, and performance in the markets.
Capelj also develops insights around impactful options market dynamics at SpotGamma and is a Benzinga reporter.
In no way should the materials herein be construed as advice. Derivatives carry a substantial risk of loss. All content is for informational purposes only.
The daily brief is a free glimpse into the prevailing fundamental and technical drivers of U.S. equity market products. Join the 750+ that read this report daily, below!
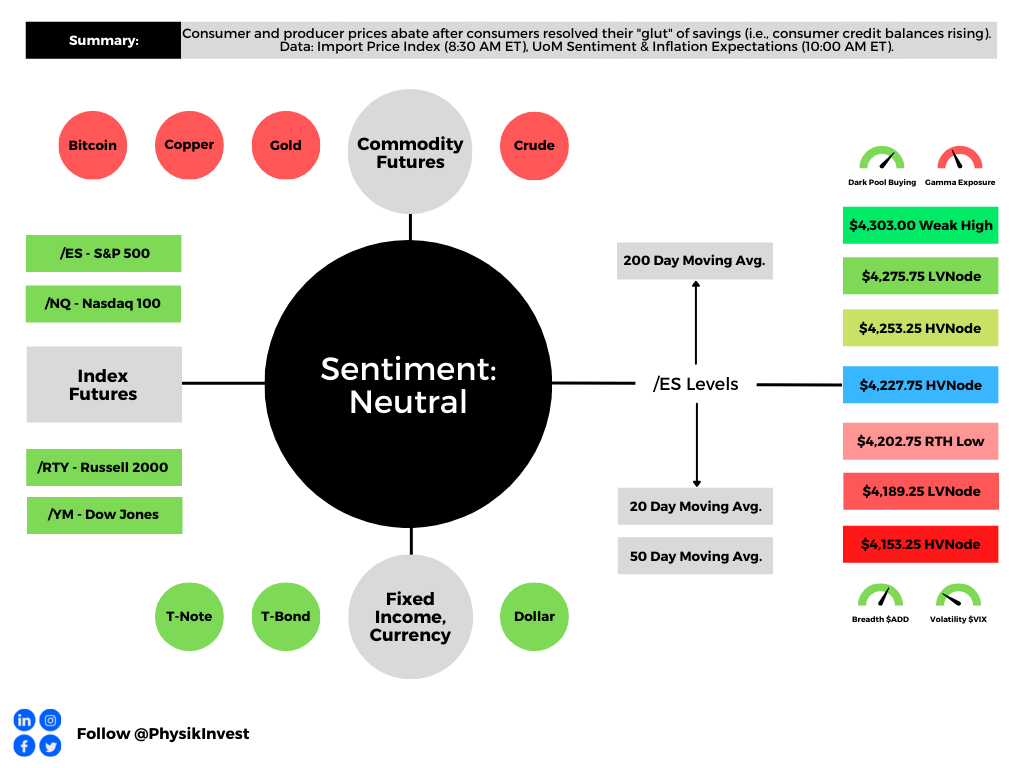
Graphic updated 7:00 AM ET. Sentiment Neutral if expected /ES open is inside of the prior day’s range. /ES levels are derived from the profile graphic at the bottom of the following section. Levels may have changed since initially quoted; click here for the latest levels. SqueezeMetrics Dark Pool Index (DIX) and Gamma (GEX) calculations are based on where the prior day’s reading falls with respect to the MAX and MIN of all occurrences available. A higher DIX is bullish. At the same time, the lower the GEX, the more (expected) volatility. Learn the implications of volatility, direction, and moneyness. Breadth reflects a reading of the prior day’s NYSE Advance/Decline indicator. VIX reflects a current reading of the CBOE Volatility Index (INDEX: VIX) from 0-100.
Fundamental
We’ll skip the fundamentals section, today, and do an in-depth review, sometime next week.
Positioning
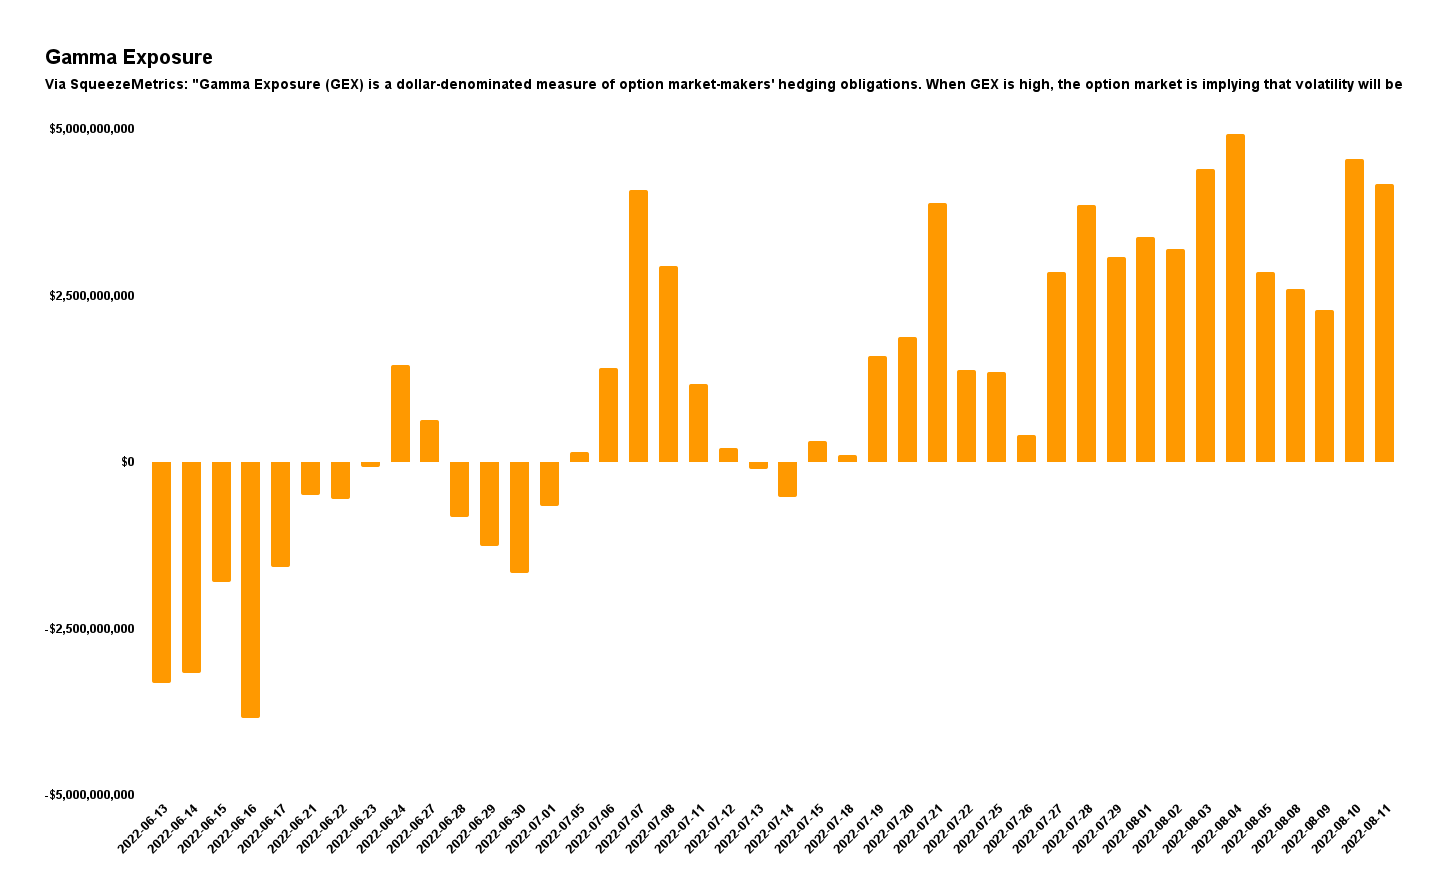
As of 7:00 AM ET, Friday’s expected volatility, via the Cboe Volatility Index (INDEX: VIX), sits at ~1.06%. Net gamma exposures generally rising may promote tighter trading ranges.
Graphic: Via Physik Invest. Data retrieved from SqueezeMetrics.
As stated yesterday, it may be beneficial for traders to shift their focus to dynamic structures. In other words, be a buyer of options structures (i.e., replace static directional exposures or Delta with those that are dynamic).
This is (1) due to where realized (RVOL) and implied (IVOL) volatility measures, and skew.
Graphic: Retrieved from Interactive Brokers Group Inc’s (NASDAQ: IBKR) Trader Workstation.
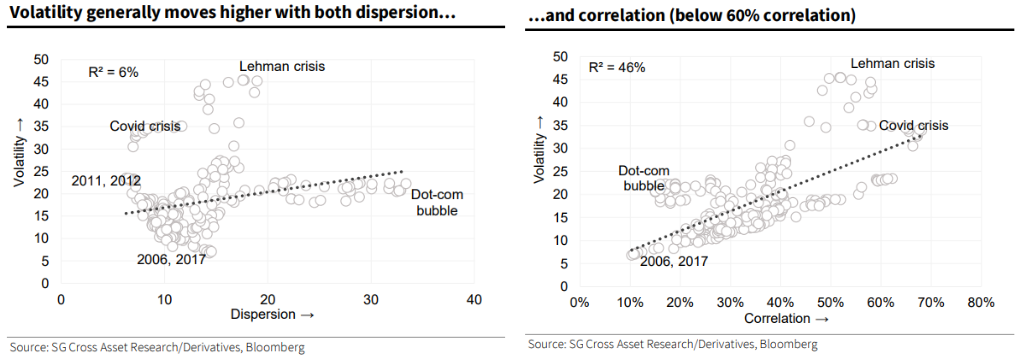
As well as (2) increased average stock correlation and lower return dispersion which, per Societe Generale SA (OTC: SCGLY) research, make stock picking hard(er).
It can be the case that Delta hedging becomes easier, too, as one asset, in a more correlated environment, can better offset the first-order sensitivities elsewhere.
Graphic: Retrieved from Bloomberg. Via Societe Generale.
The reason why?
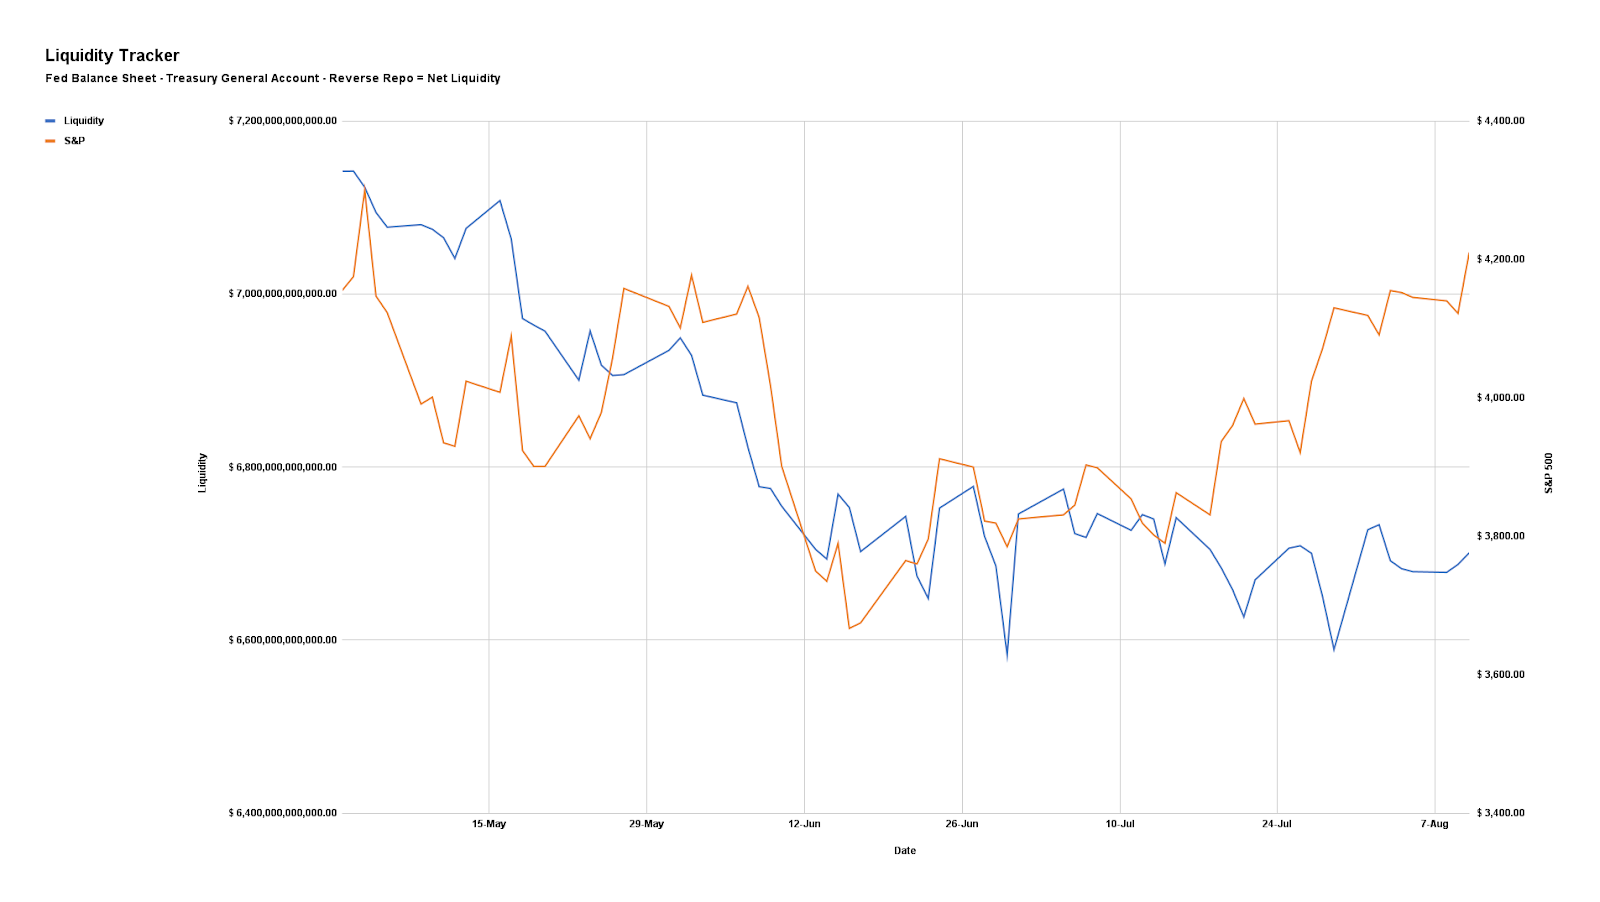
In regards to the correlation and dispersion remark, that’s more to do with the risk-off sentiment and the impact of tightening liquidity affecting all risk assets, basically.
Graphic: Via PhysikInvest. Data compiled by @jkonopas623. Fed Balance Sheet data, here. Treasury General Account Data, here. Reverse Repo data, here. NL = BS – TGA – RRP.
Regarding the volatility issue (RVOL, IVOL, and skew), that’s more to do with hedging trends.
Essentially, the monetization and counterparty hedging of existing customer hedges, as well as the sale of short-dated volatility, particularly in some of the single names where there was “rich” volatility, into the fall, lent to lackluster performance in IVOL and index mean reversion.
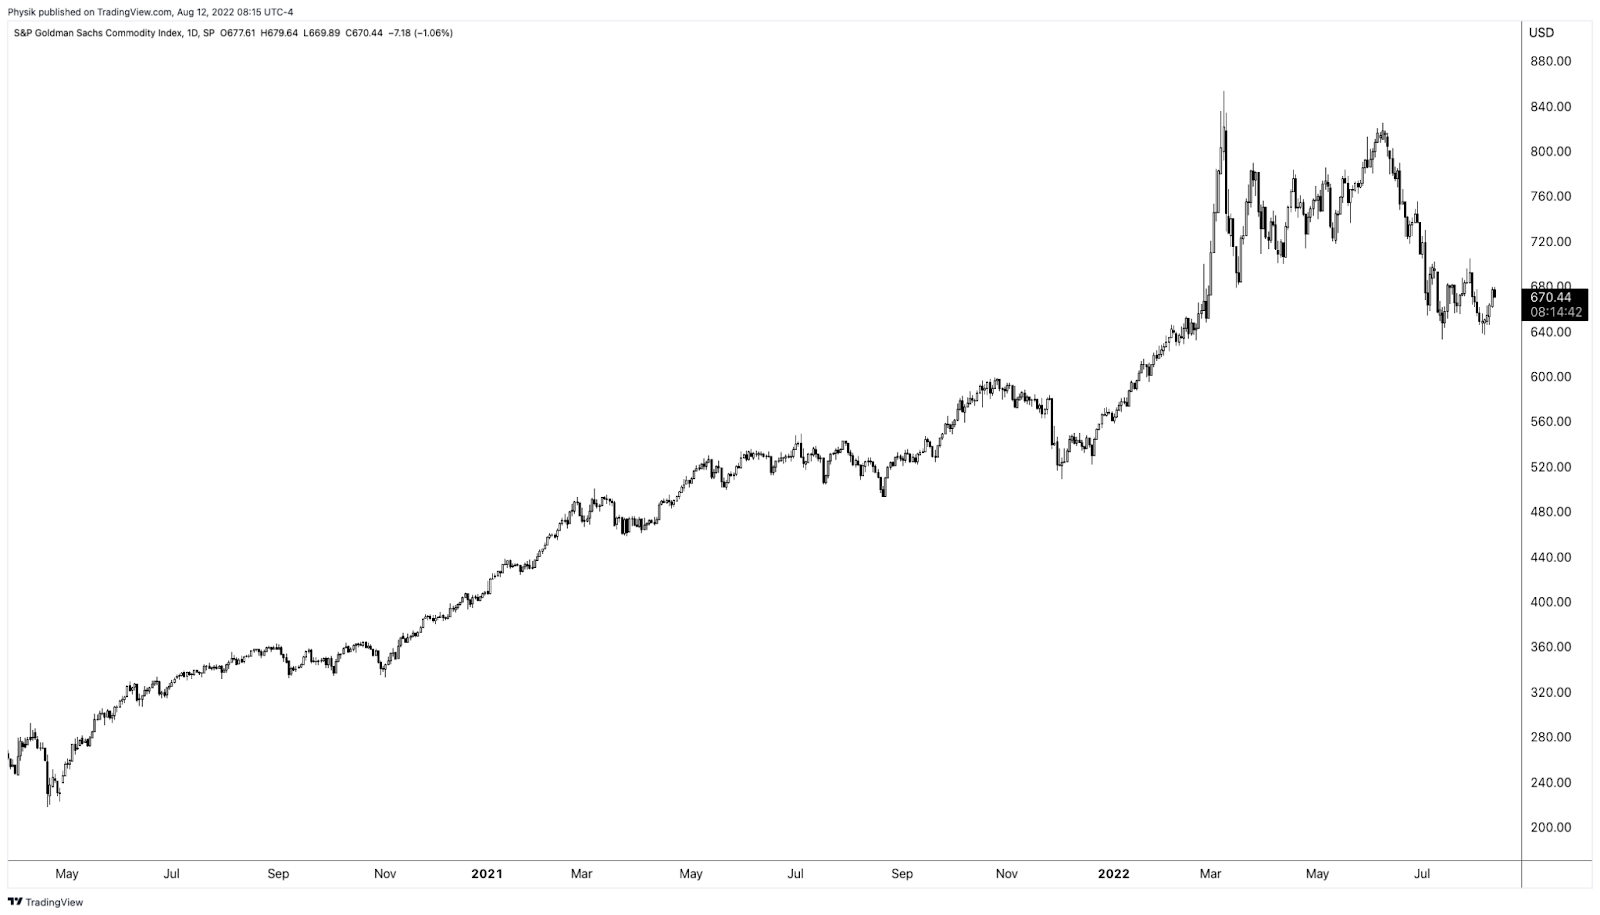
Accordingly, “if commodities are not performing … as a hedge, that opens the door,” to markets falling and traders demand equity volatility hedges, per The Ambrus Group’s Kris Sidial.
Learn about options dealer flows, inflation, and investing in a changing world with Cem Karsan.
Graphic: Retrieved by Physik Invest from TradingView. S&P Goldman Sachs Commodity Index.
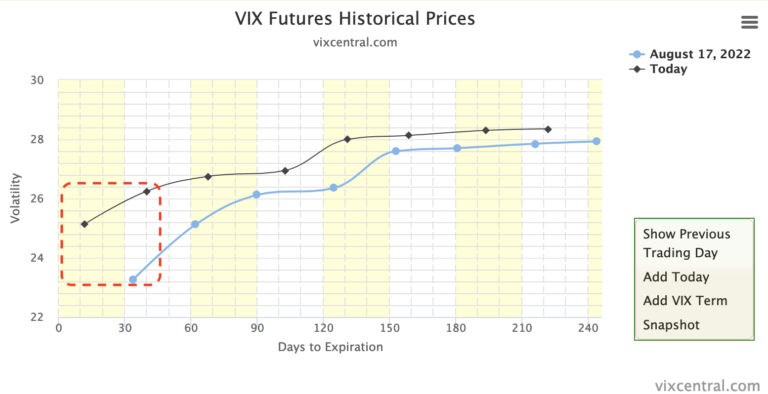
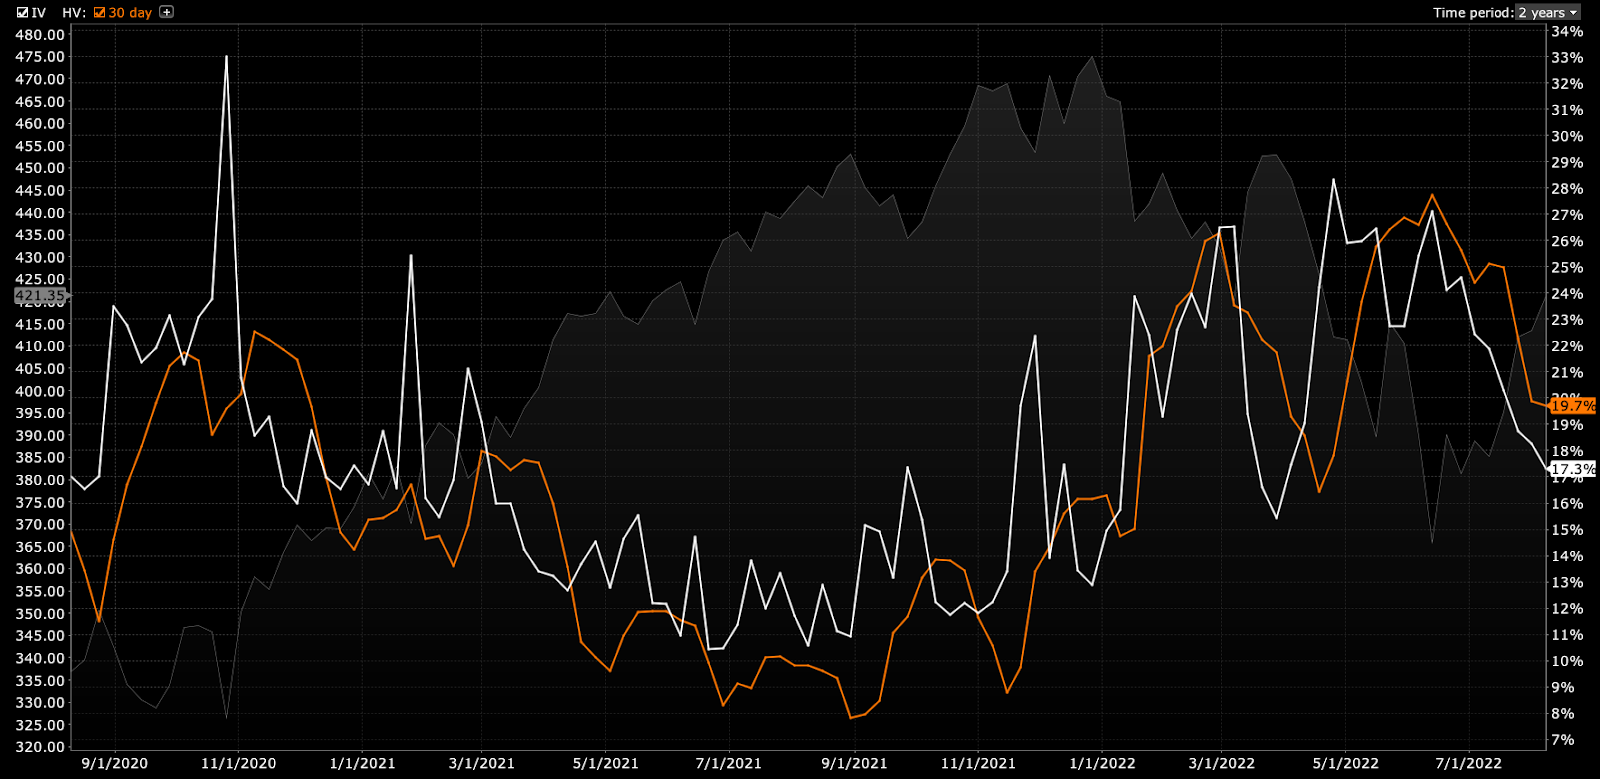
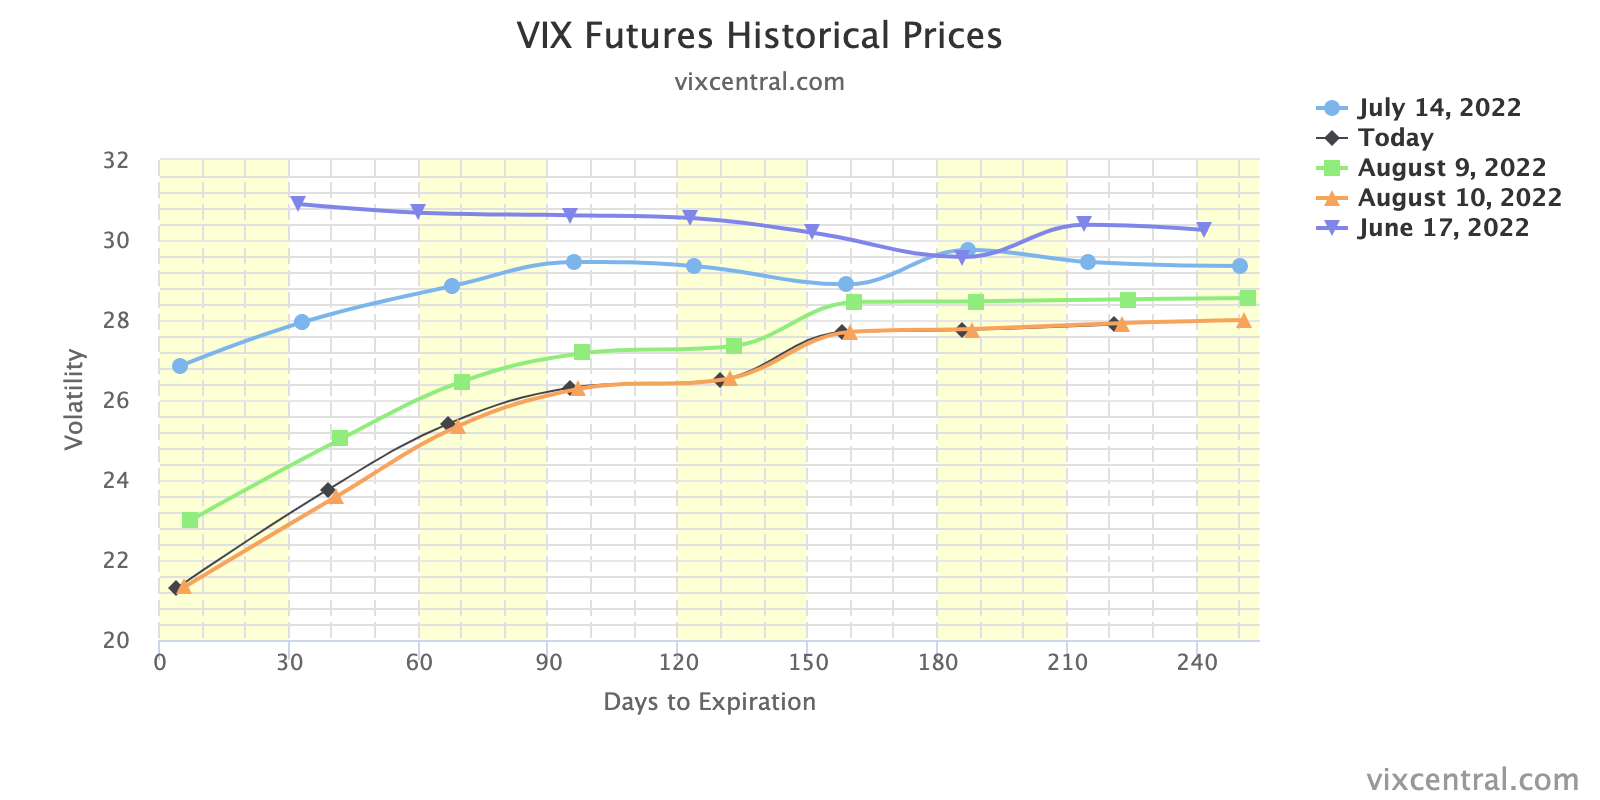
Adding, per to SpotGamma, “a lot of the boost from volatility compression has played out. With IVOL at a lower bound, it may be opportune to replace static Delta bets for those that are dynamic (i.e., long option exposures) and have less to lose in this lower volatility environment.”
Graphic: Retrieved from Vix Central. The term structure of IVOL.
“In a case where market participants see the Fed keeping its commitment to aggressive monetary policy action, negative Delta options exposures may outperform static short equity (bets on the downside).”
Graphic: Retrieved from Bloomberg. “Thursday’s message was that on mature reflection, the progress on the economy didn’t justify taking the stock market any higher than it was at the start of the day.”
If bullish, sample structures to consider, given a smiley skew, include low- or zero-cost bullish call ratio spreads, against the trend resistances in products like the S&P 500 (INDEX: SPX).
Graphic: Retrieved from Bloomberg. Drawn on by Physik Invest.
Technical
As of 7:00 AM ET, Friday’s regular session (9:30 AM – 4:00 PM ET), in the S&P 500, is likely to open in the middle part of a nearly balanced overnight inventory, inside of prior-range and -value, suggesting a limited potential for immediate directional opportunity.
In the best case, the S&P 500 trades higher.
Any activity above the $4,227.75 HVNode puts into play the $4,253.25 HVNode. Initiative trade beyond the latter could reach as high as the $4,275.75 LVNode and $4,303.00 Weak High, or higher.
In the worst case, the S&P 500 trades lower.
Any activity below the $4,227.75 HVNode puts into play the $4,202.75 RTH Low. Initiative trade beyond the RTH Low could reach as low as the $4,189.25 LVNode and $4,153.25 HVNode, or lower.
Click here to load today’s key levels into the web-based TradingView charting platform. Note that all levels are derived using the 65-minute timeframe. New links are produced, daily.
Graphic: 65-minute profile chart of the Micro E-mini S&P 500 Futures.
Definitions
Volume Areas: A structurally sound market will build on areas of high volume (HVNodes). Should the market trend for long periods of time, it will lack sound structure, identified as low volume areas (LVNodes). LVNodes denote directional conviction and ought to offer support on any test.
If participants were to auction and find acceptance into areas of prior low volume (LVNodes), then future discovery ought to be volatile and quick as participants look to HVNodes for favorable entry or exit.
POCs: POCs are valuable as they denote areas where two-sided trade was most prevalent in a prior day session. Participants will respond to future tests of value as they offer favorable entry and exit.
MCPOCs: POCs are valuable as they denote areas where two-sided trade was most prevalent over numerous day sessions. Participants will respond to future tests of value as they offer favorable entry and exit.
Volume-Weighted Average Prices (VWAPs): A metric highly regarded by chief investment officers, among other participants, for quality of trade. Additionally, liquidity algorithms are benchmarked and programmed to buy and sell around VWAPs.
About
After years of self-education, strategy development, mentorship, and trial-and-error, Renato Leonard Capelj began trading full-time and founded Physik Invest to detail his methods, research, and performance in the markets.
Capelj also develops insights around impactful options market dynamics at SpotGamma and is a Benzinga reporter.
In no way should the materials herein be construed as advice. Derivatives carry a substantial risk of loss. All content is for informational purposes only.
The daily brief is a free glimpse into the prevailing fundamental and technical drivers of U.S. equity market products. Join the 750+ that read this report daily, below!
Graphic updated 6:35 AM ET. Sentiment Neutral if expected /ES open is inside of the prior day’s range. /ES levels are derived from the profile graphic at the bottom of the following section. Levels may have changed since initially quoted; click here for the latest levels. SqueezeMetrics Dark Pool Index (DIX) and Gamma (GEX) calculations are based on where the prior day’s reading falls with respect to the MAX and MIN of all occurrences available. A higher DIX is bullish. At the same time, the lower the GEX, the more (expected) volatility. Learn the implications of volatility, direction, and moneyness. Breadth reflects a reading of the prior day’s NYSE Advance/Decline indicator. VIX reflects a current reading of the CBOE Volatility Index (INDEX: VIX) from 0-100.
Fundamental
Pardon the light read, today!
Jefferies Financial Group Inc (NYSE: JEF) analyses suggest that after the S&P 500’s nearly two standard deviation rally, outcomes are quite large in both directions.
However, “when the six-month performance into the rally is negative, there is a much greater chance of negative outcomes,” The Market Ear summarizes.
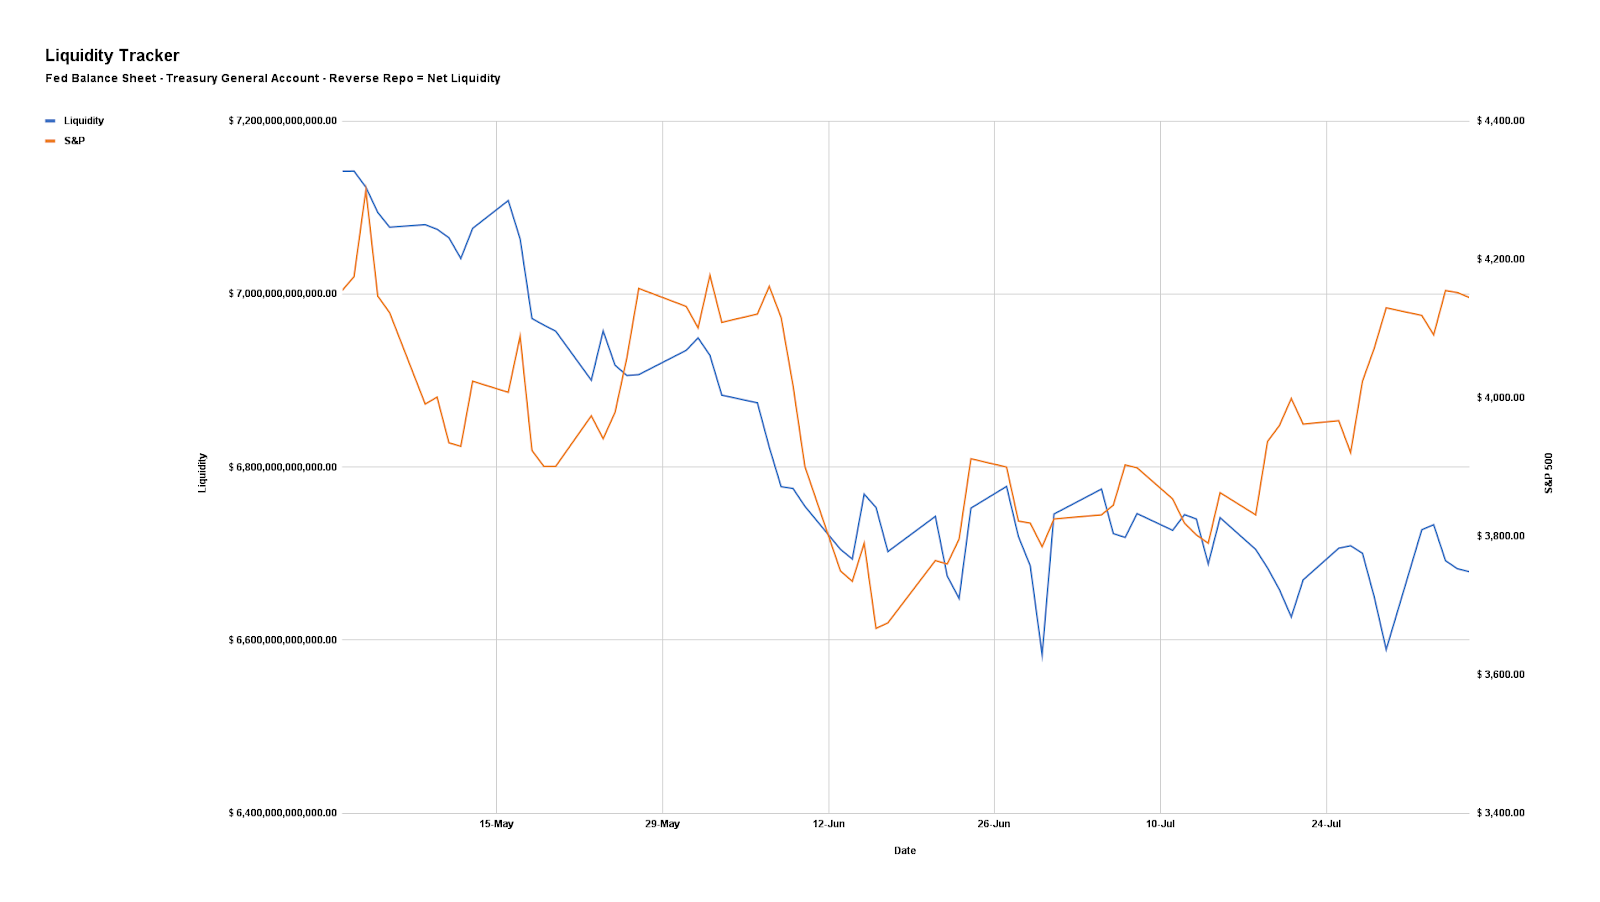
Graphic: Via Physik Invest. Data compiled by @jkonopas623. Fed Balance Sheet data, here. Treasury General Account Data, here. Reverse Repo data, here. NL = BS – TGA – RRP.
What is bolstering this relief rally?
This relief is the product of a “knee-jerk re-leveraging flow,” as explained by some, bolstered by a “cohort of quantitative-based investment strategies [buying] equities when volatility is lower.”
From hereon, some, like JPMorgan Chase & Co (NYSE: JPM) strategists, see equities rising on “robust corporate earnings [and] … better-than-feared economic data,” all the while others, from Morgan Stanley (NYSE: MS) and Goldman Sachs Group Inc (NYSE: GS), don’t see corporate profit margins expanding into 2023 because of “sticky cost pressures and receding demand.”
Graphic: Retrieved from The Market Ear. Via MS Research. Margins are in trouble “over the next several quarters … [as this is] the mirror image of what happened in 2020-21 when companies had extreme pricing power and costs were lagging.”
That said, however, MS explains said that “the next leg lower may have to wait until September when [their] negative operating leverage thesis is more reflected in earnings estimates.”
Graphic: Retrieved from The Market Ear. Via Societe Generale SA (OTC: SCGLY). “Not only are central banks not there to backstop markets as they have been in recent years, but Growth stock profits are proving somewhat fragile as well.”
The outlooks by corporates are far more positive, though, it appears.
Tesla Inc (NASDAQ: TSLA) CEO Elon Musk explained the trend in commodity prices is down, “which suggests we are past peak inflation.” This is as Loews Corporation (NYSE: L) CEO Jim Tisch says that the “significant reduction in inflation in the coming 6 to 12 months” should help avoid a “truly damaging wage-price inflation spiral that was so problematic in the 1970s.”
Full employment, healing supply chains, and easier consumer spending is among the factors balancing commitments to tighten and, potentially, put the economy on an “L” trajectory (i.e., drop and flatline for a period), as explained in our August 3 letter.
Graphic: Retrieved from Bloomberg. Data via Realtor.com. “The [Fed’s] effort to curb inflation by raising benchmark interest rates has put the brakes on the pandemic housing frenzy.”
Positioning
As of 6:35 AM ET, Tuesday’s expected volatility, via the Cboe Volatility Index (INDEX: VIX), sits at ~1.14%. Net gamma exposures decreasing may promote larger trading ranges.
Given the market environment, read the August 5 letter for an in-depth take on how to position for the next move higher or lower, while lowering costs (and potential losses), if wrong.
Technical
As of 6:25 AM ET, Tuesday’s regular session (9:30 AM – 4:00 PM ET), in the S&P 500, is likely to open in the lower part of a negatively skewed overnight inventory, inside of prior-range and -value, suggesting a limited potential for immediate directional opportunity.
In the best case, the S&P 500 trades higher.
Any activity above the $4,153.25 HVNode puts into play the $4,189.25 LVNode. Initiative trade beyond the LVNode could reach as high as the $4,227.75 HVNode and $4,259.75 LVNode, or higher.
In the worst case, the S&P 500 trades lower.
Any activity below the $4,153.25 HVNode puts into play the $4,117.75 MCPOC. Initiative trade beyond the MCPOC could reach as low as the $4,073.00 VPOC and $4,040.75 HVNode, or lower.
Click here to load today’s key levels into the web-based TradingView charting platform. Note that all levels are derived using the 65-minute timeframe. New links are produced, daily.
Graphic: Updated 8/8/2022. 65-minute profile chart of the Micro E-mini S&P 500 Futures.
Considerations: Responsiveness near key-technical areas (that are discernable visually on a chart), suggests technically-driven traders with short time horizons are very active.
Such traders often lack the wherewithal to defend retests and, additionally, the type of trade may be indicative of the other time frame participants waiting for more information to initiate trades.
Definitions
Volume Areas: A structurally sound market will build on areas of high volume (HVNodes). Should the market trend for long periods of time, it will lack sound structure, identified as low volume areas (LVNodes). LVNodes denote directional conviction and ought to offer support on any test.
If participants were to auction and find acceptance into areas of prior low volume (LVNodes), then future discovery ought to be volatile and quick as participants look to HVNodes for favorable entry or exit.
POCs: POCs are valuable as they denote areas where two-sided trade was most prevalent in a prior day session. Participants will respond to future tests of value as they offer favorable entry and exit.
MCPOCs: POCs are valuable as they denote areas where two-sided trade was most prevalent over numerous day sessions. Participants will respond to future tests of value as they offer favorable entry and exit.
Volume-Weighted Average Prices (VWAPs): A metric highly regarded by chief investment officers, among other participants, for quality of trade. Additionally, liquidity algorithms are benchmarked and programmed to buy and sell around VWAPs.
About
After years of self-education, strategy development, mentorship, and trial-and-error, Renato Leonard Capelj began trading full-time and founded Physik Invest to detail his methods, research, and performance in the markets.
Capelj also develops insights around impactful options market dynamics at SpotGamma and is a Benzinga reporter.
In no way should the materials herein be construed as advice. Derivatives carry a substantial risk of loss. All content is for informational purposes only.
The daily brief is a free glimpse into the prevailing fundamental and technical drivers of U.S. equity market products. Join the 750+ that read this report daily, below!
Graphic updated 7:45 AM ET. Sentiment Risk-On if expected /ES open is above the prior day’s range. /ES levels are derived from the profile graphic at the bottom of the following section. Levels may have changed since initially quoted; click here for the latest levels. SqueezeMetrics Dark Pool Index (DIX) and Gamma (GEX) calculations are based on where the prior day’s reading falls with respect to the MAX and MIN of all occurrences available. A higher DIX is bullish. At the same time, the lower the GEX, the more (expected) volatility. Learn the implications of volatility, direction, and moneyness. Breadth reflects a reading of the prior day’s NYSE Advance/Decline indicator. VIX reflects a current reading of the CBOE Volatility Index (INDEX: VIX) from 0-100.
Fundamental
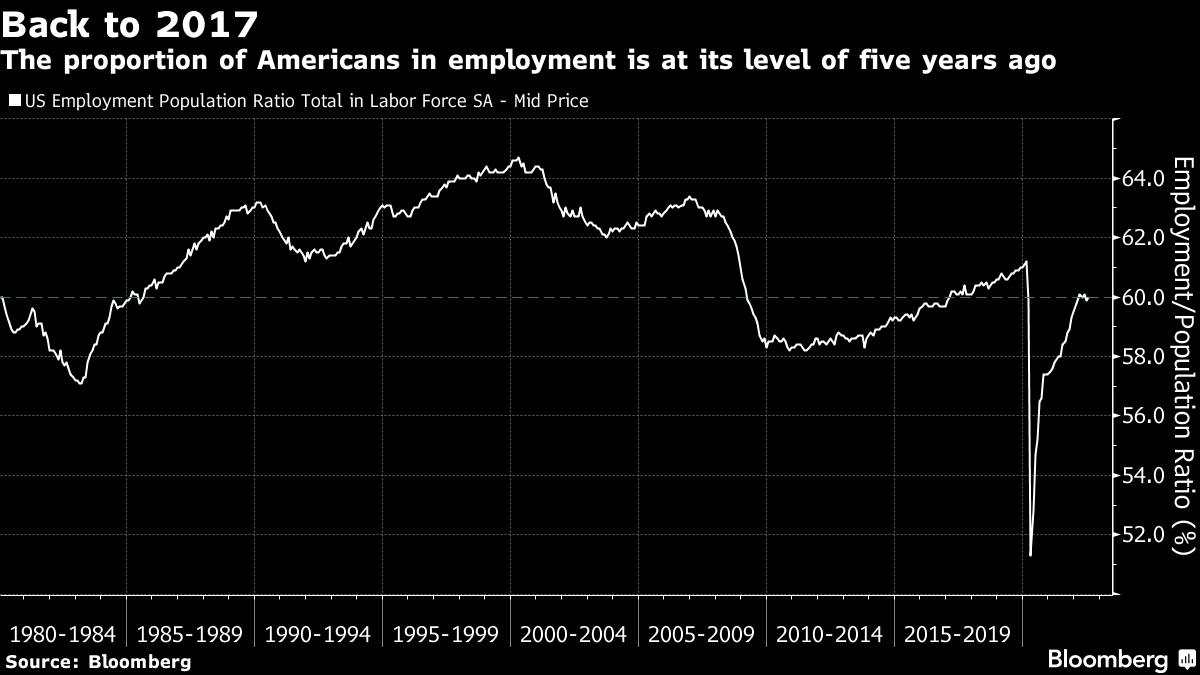
In a non-farm payroll update, it was shown that the US added more than two times the jobs many economists thought it would.
“Some of this is driven by a reduced participation rate – a smaller portion of the population seeking work and showing up in unemployment data,” Bloomberg’s John Authers explained.
Graphic: Retrieved from Bloomberg.
“It now becomes much easier for the Federal Reserve (Fed) to [continue] rais[ing] rates. If the employment market is still strengthening, while inflation remains its highest in decades, it’s hard to see why it shouldn’t.”
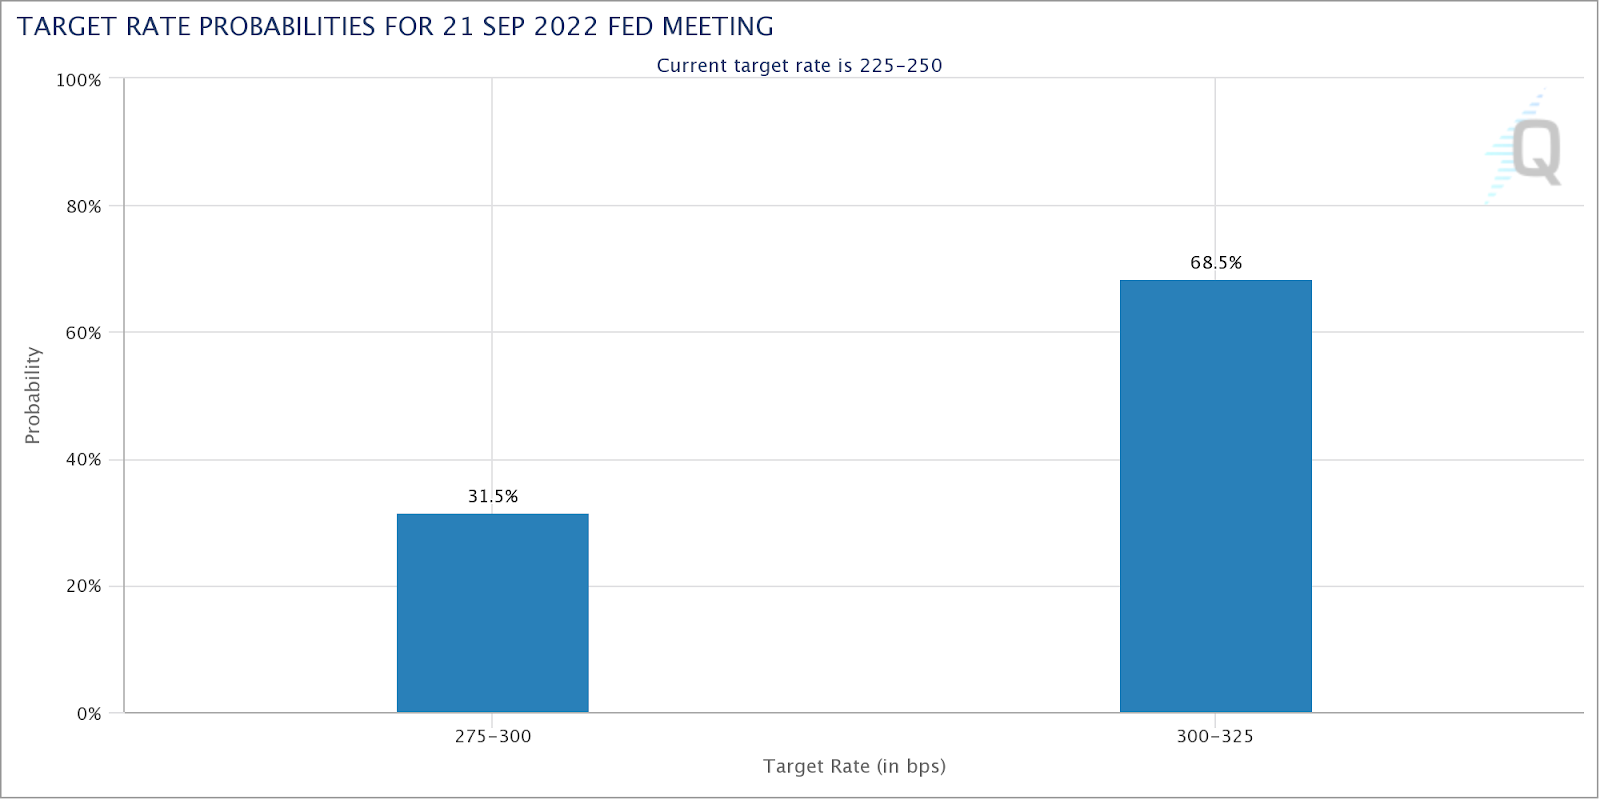
Accordingly, market participants are pricing a greater than 50% chance of the target Fed Funds rate increasing by 75 to 100 basis points to a target range of 300 and 325 basis points, up from 225 and 250 right now.
Graphic: Retrieved from CME Group Inc’s (NASDAQ: CME) FedWatch tool.
Therefore, in addition to this (projected tax increases, the expected high coupon issuance/QT doubling in September and Q4, and the like), the “knee jerk re-leveraging flow [is likely to] not survive,” per Damped Spring’s Andy Constan.
Additionally, Morgan Stanley (NYSE: MS) and Goldman Sachs Group Inc’s (NYSE: GS) strategists, both express an outlook at odds with the recent market rally on the back of “better-than-feared second-quarter earnings.”
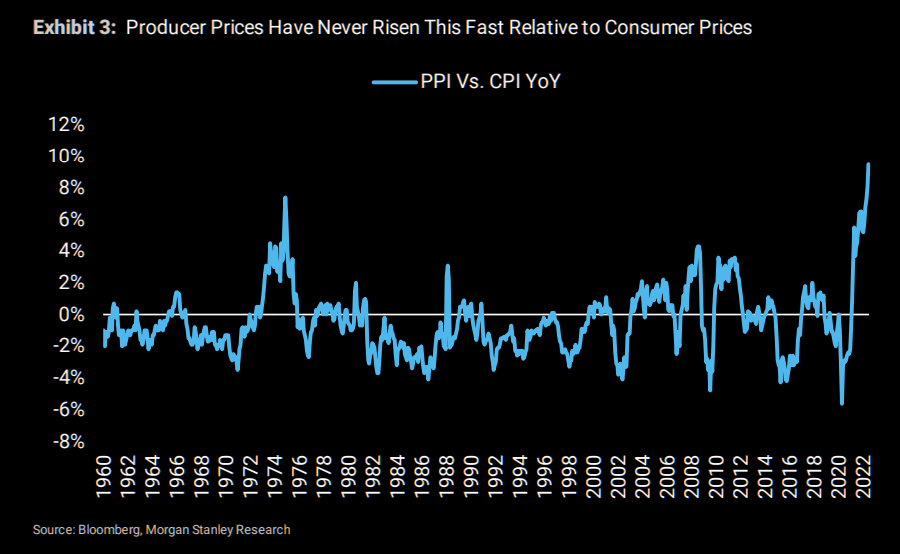
Per MS’s Michael Wilson, the expectation profit margins will continue to expand into 2023 is “unrealistic due to sticky cost pressures and receding demand.”
“While prices to the end consumer are still rising at a rapid clip, prices for producers are rising at double the pace.”
GS’s David Kostin concurs and expects net margins to drop ~25 basis points in every sector led by energy, health care, and materials, Bloomberg summarizes.
Graphic: Via Physik Invest. Data compiled by @jkonopas623. Fed Balance Sheet data, here. Treasury General Account Data, here. Reverse Repo data, here. NL = BS – TGA – RRP.
On the topic of geopolitical conflict, which we talked a lot about in the August 3 letter, the US’s Nancy Pelosi visited Taiwan last week prompting Chinese military exercises in the region.
Overall, it is likely not in China’s best interest to press the conflict much further,” Authers puts forth. “Taiwan’s role in the world’s electronics industry means that the global economic impact of any conflict could dwarf the disruptions of the last two years sparked by the pandemic.”
These disruptions would pain the world, including China.
Positioning
As of 6:40 AM ET, Monday’s expected volatility, via the Cboe Volatility Index (INDEX: VIX), sits at ~1.13%. Net gamma exposures decreasing may help with an expansion of range.
Given where realized (RVOL) and implied (IVOL) volatility measures are, as well as skew, it is beneficial to be a buyer of complex options structures (e.g., back spread).
For concision, we quote SpotGamma: “It’s the case when the fuel from a drop in option implied volatility is spent, as well as the sticky open interest at current prices rolls off, that options-related hedging does less to keep markets pinned.”
Technical
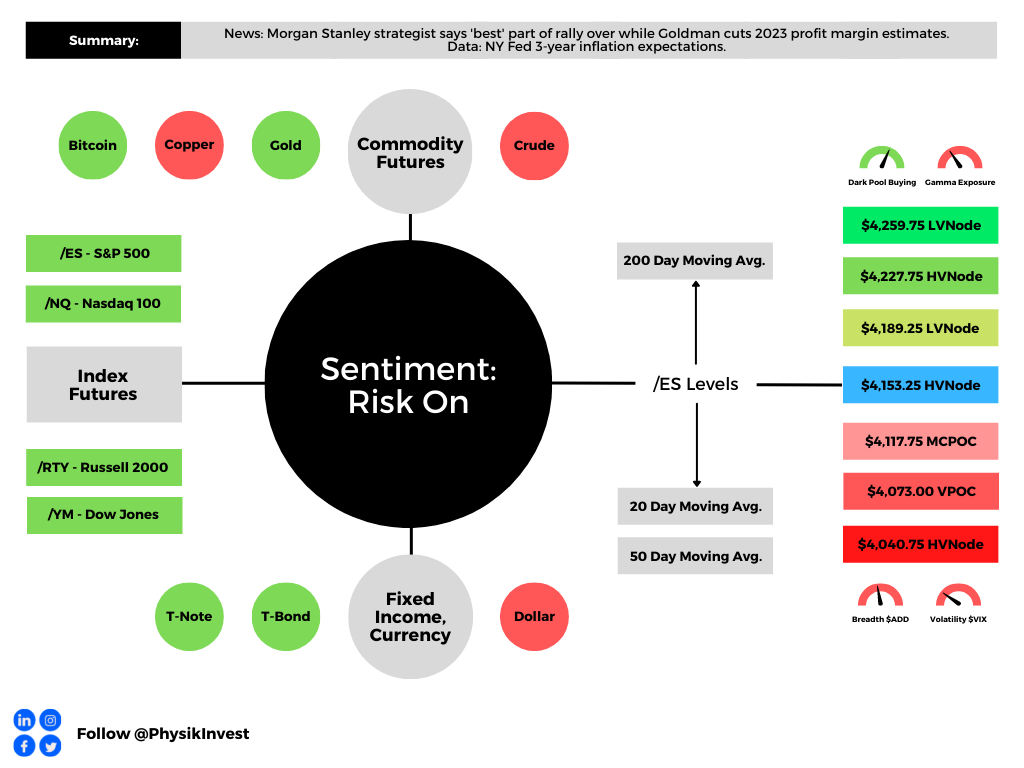
As of 6:40 AM ET, Monday’s regular session (9:30 AM – 4:00 PM ET), in the S&P 500, is likely to open in the upper part of a positively skewed overnight inventory, outside of prior-range and -value, suggesting a potential for immediate directional opportunity.
In the best case, the S&P 500 trades higher.
Any activity above the $4,153.25 HVNode puts into play the $4,189.25 LVNode. Initiative trade beyond the LVNode could reach as high as the $4,227.75 HVNode and $4,259.75 LVNode, or higher.
In the worst case, the S&P 500 trades lower.
Any activity below the $4,153.25 HVNode puts into play the $4,117.75 MCPOC. Initiative trade beyond the MCPOC could reach as low as the $4,073.00 VPOC and $4,040.75 HVNode, or lower.
Click here to load today’s key levels into the web-based TradingView charting platform. Note that all levels are derived using the 65-minute timeframe. New links are produced, daily.
Graphic: 65-minute profile chart of the Micro E-mini S&P 500 Futures.
Considerations: Responsiveness near key-technical areas (that are discernable visually on a chart), suggests technically-driven traders with short time horizons are very active.
Such traders often lack the wherewithal to defend retests and, additionally, the type of trade may be indicative of the other time frame participants waiting for more information to initiate trades.
Definitions
Volume Areas: A structurally sound market will build on areas of high volume (HVNodes). Should the market trend for long periods of time, it will lack sound structure, identified as low volume areas (LVNodes). LVNodes denote directional conviction and ought to offer support on any test.
If participants were to auction and find acceptance into areas of prior low volume (LVNodes), then future discovery ought to be volatile and quick as participants look to HVNodes for favorable entry or exit.
POCs: POCs are valuable as they denote areas where two-sided trade was most prevalent in a prior day session. Participants will respond to future tests of value as they offer favorable entry and exit.
MCPOCs: POCs are valuable as they denote areas where two-sided trade was most prevalent over numerous day sessions. Participants will respond to future tests of value as they offer favorable entry and exit.
Volume-Weighted Average Prices (VWAPs): A metric highly regarded by chief investment officers, among other participants, for quality of trade. Additionally, liquidity algorithms are benchmarked and programmed to buy and sell around VWAPs.
About
After years of self-education, strategy development, mentorship, and trial-and-error, Renato Leonard Capelj began trading full-time and founded Physik Invest to detail his methods, research, and performance in the markets.
Capelj also develops insights around impactful options market dynamics at SpotGamma and is a Benzinga reporter.
In no way should the materials herein be construed as advice. Derivatives carry a substantial risk of loss. All content is for informational purposes only.