
The daily brief is a free glimpse into the prevailing fundamental and technical drivers of U.S. equity market products. Join the 850+ that read this report daily, below!
Fundamental
As much as it may be a so-called chart crime to overlap past market environments and project or forecast what may happen, it’s quite eerie that today’s path of returns appears similar to that of 1394-1937, 2005-2008, and 1997-2001, for example.
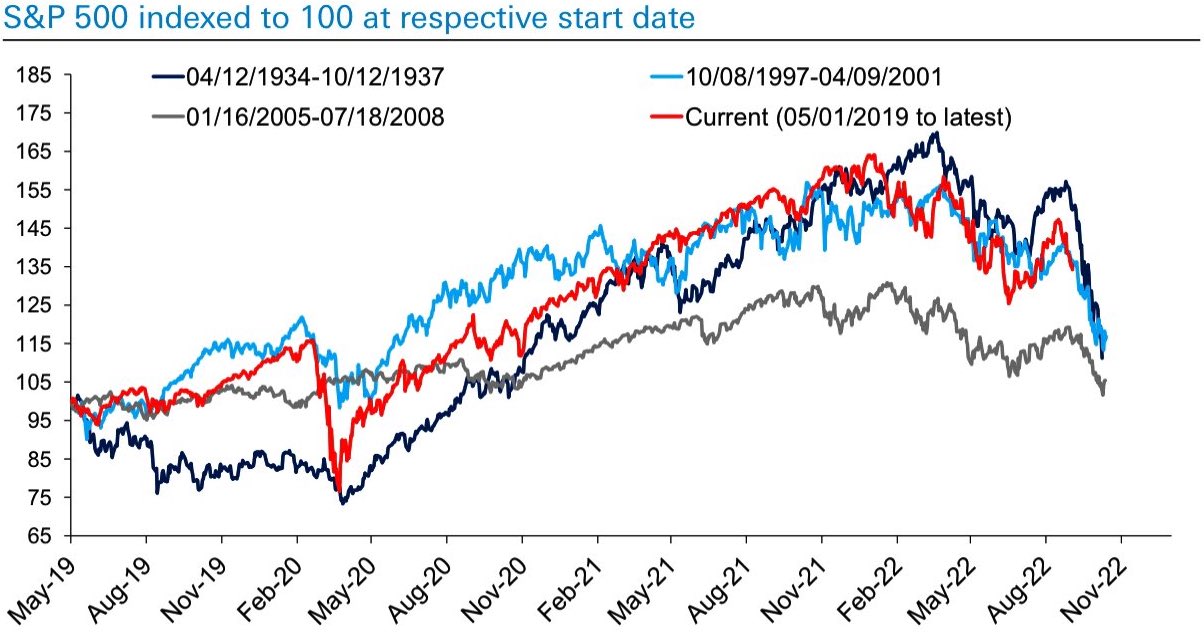
Moreover, this time around, it’s the case that markets have fallen on participants’ pricing of higher interest rates and quantitative tightening (QT).
Some argue there is more to go on the pricing of a potential economic slowing happening here, in the U.S., abroad in China, and beyond.
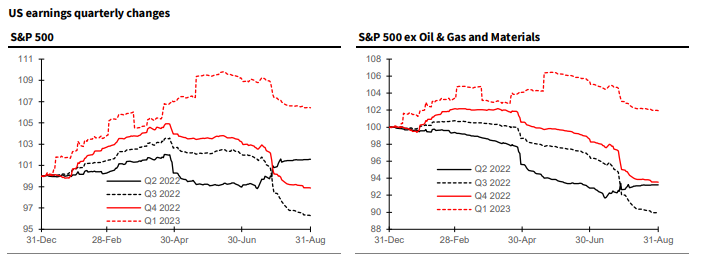
Notwithstanding, and we will end the fundamental section with this, today, Credit Suisse Group AG’s (NYSE: CS) Jonathan Golub puts forth the following:
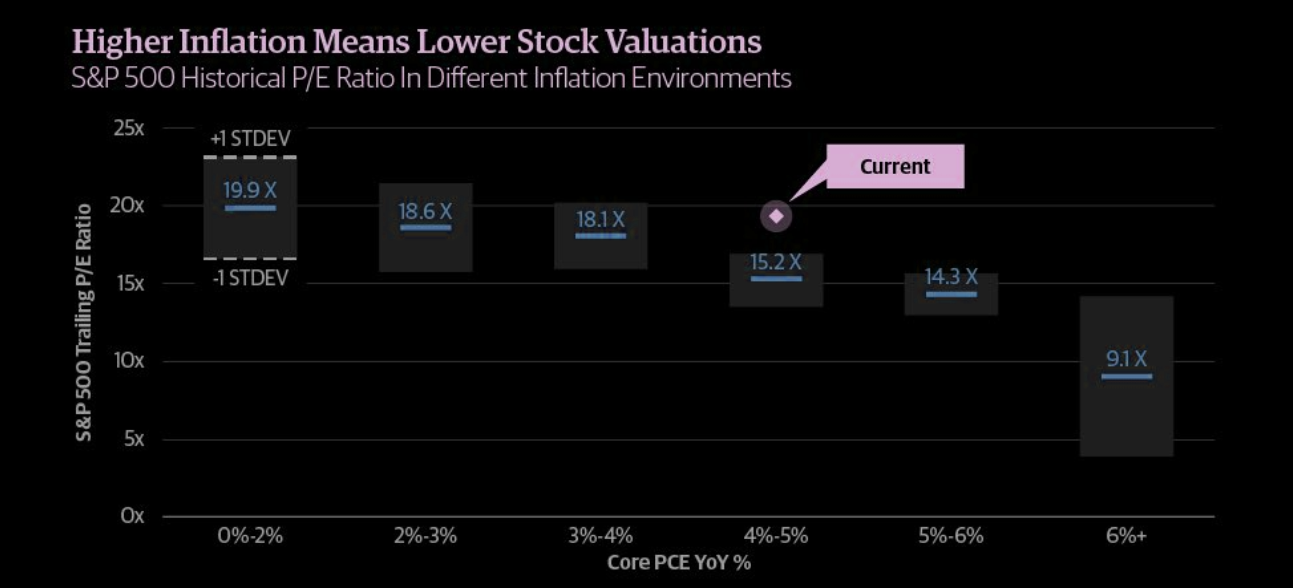
“Although revisions are negative, projected EPS growth rates remain positive for the remainder of 2022-23. While 3Q growth has fallen to 4.7%, EPS should expand 9-10%, assuming similar beats as experienced in 2Q. Historically, earnings hold up best when inflation is elevated. Many investors are interpreting the recent decline in estimates as a harbinger to recession. Our work shows that in high inflationary periods (1973, 1980, 1981) earnings peak just 2 months prior to a recession’s onset. With EPS growth projections still positive, revisions would have to fall much more to signal an economic contraction.”
Positioning
Referring traders to a recent case study (HERE) on how to play this market environment, as well as the impacts of implied volatility (IVOL) compression September 8 (HERE).
After a period of sideways-to-lower, markets are rebounding, boosted by IVOL compression and traders’ re-positioning ahead of potential including inflation and monetary policy updates.
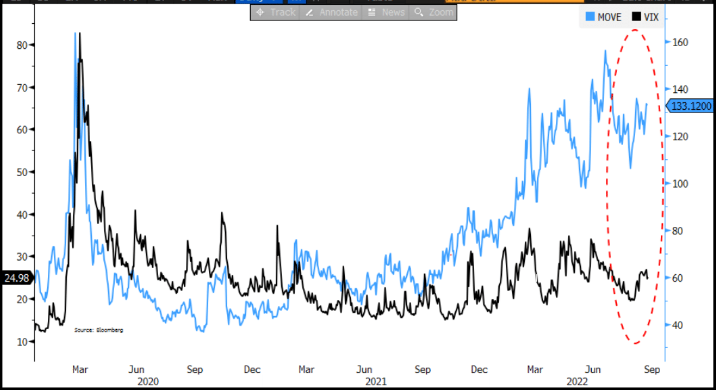
Notwithstanding, as Kai Volatility’s Cem Karsan well explained to Charles Schwab Corporation’s (NYSE: SCHW) TD Ameritrade Network, traders must look out for the “window of real risk.”
The energy for a downside move “is significant” after this year’s decimation of “skew and volatility,” he said. “Hedging for convexity is in the 5th percentile.”
This is because participants hedged heading into the decline, and sold skew as the markets explored lower. After the current period of volatility supply passes, Karsan added, and markets were to trade lower, there is the risk of a reach for protection and a fatter tail.
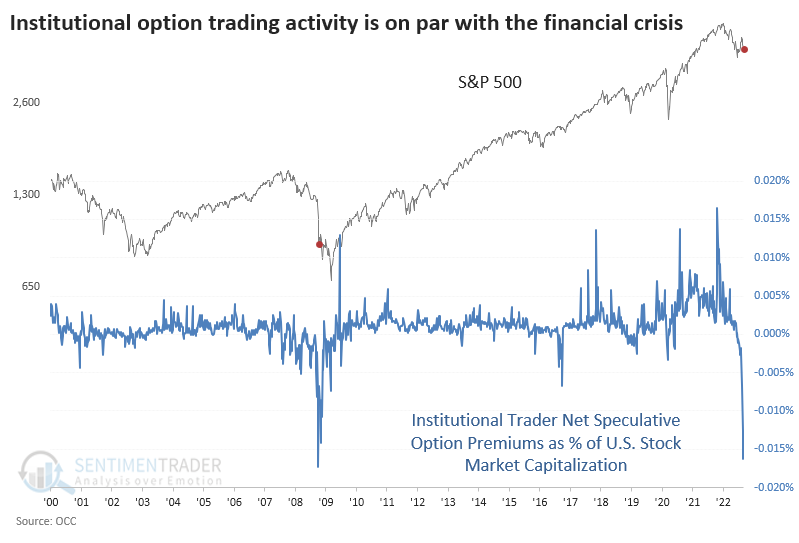
Should nothing happen, then the unwind of the recent speculation amongst “family offices and institutions front-running the speculative hedges that are more than 50 units,” will add support.
Technical
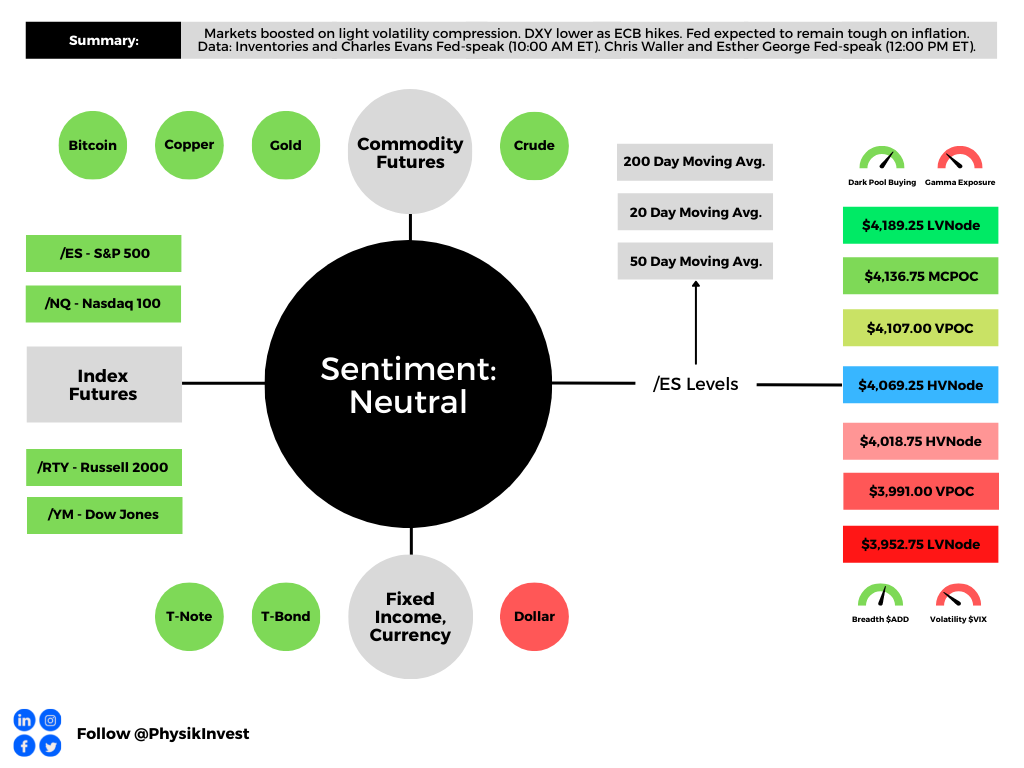
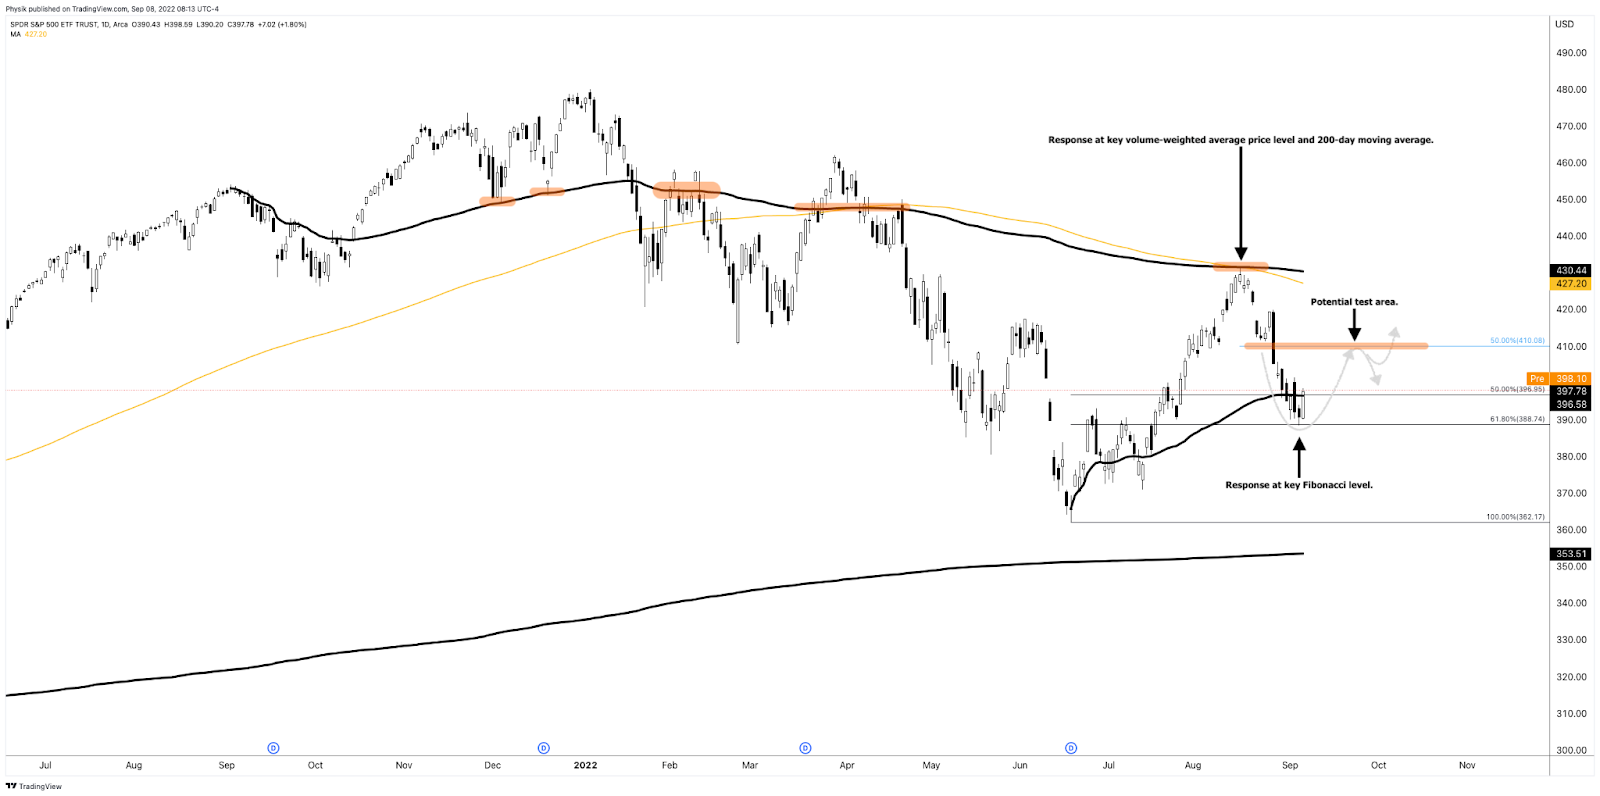
As of 6:40 AM ET, Friday’s regular session (9:30 AM – 4:00 PM ET), in the S&P 500, is likely to open in the upper part of a positively skewed overnight inventory, outside of prior-range and -value, suggesting a potential for immediate directional opportunity.
In the best case, the S&P 500 trades higher.
Any activity above the $4,069.25 HVNode puts into play the $4,107.00 VPOC. Initiative trade beyond the VPOC could reach as high as the $4,136.75 MCPOC and $4,189.25 LVNode, or higher.
In the worst case, the S&P 500 trades lower.
Any activity below the $4,069.25 HVNode puts into play the $4,018.75 HVNode. Initiative trade beyond the HVNode could reach as low as the $3,991.00 VPOC and $3,952.75 LVNode, or lower.
Click here to load today’s key levels into the web-based TradingView charting platform. Note that all levels are derived using the 65-minute timeframe. New links are produced, daily.

Considerations: Responsiveness near key-technical areas (that are discernable visually on a chart), suggests technically-driven traders with short time horizons are very active.
Such traders often lack the wherewithal to defend retests and, additionally, the type of trade may be indicative of the other time frame participants waiting for more information to initiate trades.
Definitions
Volume Areas: A structurally sound market will build on areas of high volume (HVNodes). Should the market trend for long periods of time, it will lack sound structure, identified as low volume areas (LVNodes). LVNodes denote directional conviction and ought to offer support on any test.
If participants were to auction and find acceptance into areas of prior low volume (LVNodes), then future discovery ought to be volatile and quick as participants look to HVNodes for favorable entry or exit.
POCs: POCs are valuable as they denote areas where two-sided trade was most prevalent in a prior day session. Participants will respond to future tests of value as they offer favorable entry and exit.
MCPOCs: POCs are valuable as they denote areas where two-sided trade was most prevalent over numerous day sessions. Participants will respond to future tests of value as they offer favorable entry and exit.
Volume-Weighted Average Prices (VWAPs): A metric highly regarded by chief investment officers, among other participants, for quality of trade. Additionally, liquidity algorithms are benchmarked and programmed to buy and sell around VWAPs.
About
After years of self-education, strategy development, mentorship, and trial-and-error, Renato Leonard Capelj began trading full-time and founded Physik Invest to detail his methods, research, and performance in the markets.
Capelj also develops insights around impactful options market dynamics at SpotGamma and is a Benzinga reporter.
Some of his works include conversations with ARK Invest’s Catherine Wood, investors Kevin O’Leary and John Chambers, FTX’s Sam Bankman-Fried, ex-Bridgewater Associate Andy Constan, Kai Volatility’s Cem Karsan, The Ambrus Group’s Kris Sidial, among many others.
Disclaimer
In no way should the materials herein be construed as advice. Derivatives carry a substantial risk of loss. All content is for informational purposes only.


