Categories
Commentary

Daily Brief For August 5, 2022

The daily brief is a free glimpse into the prevailing fundamental and technical drivers of U.S. equity market products. Join the 750+ that read this report daily, below!
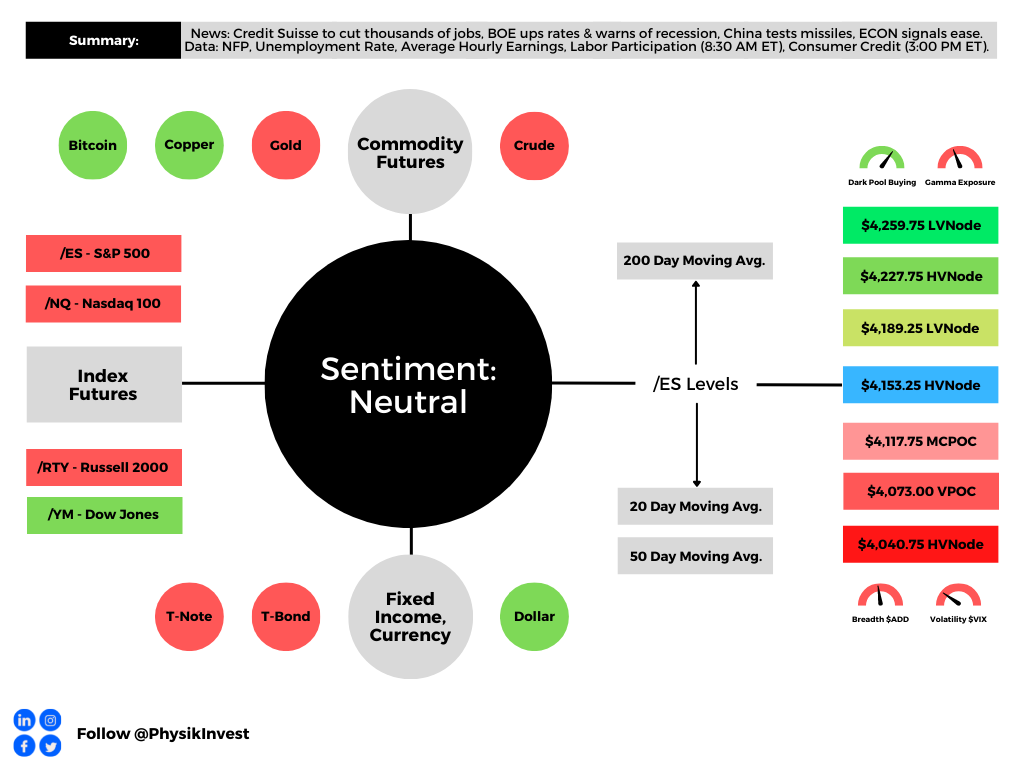
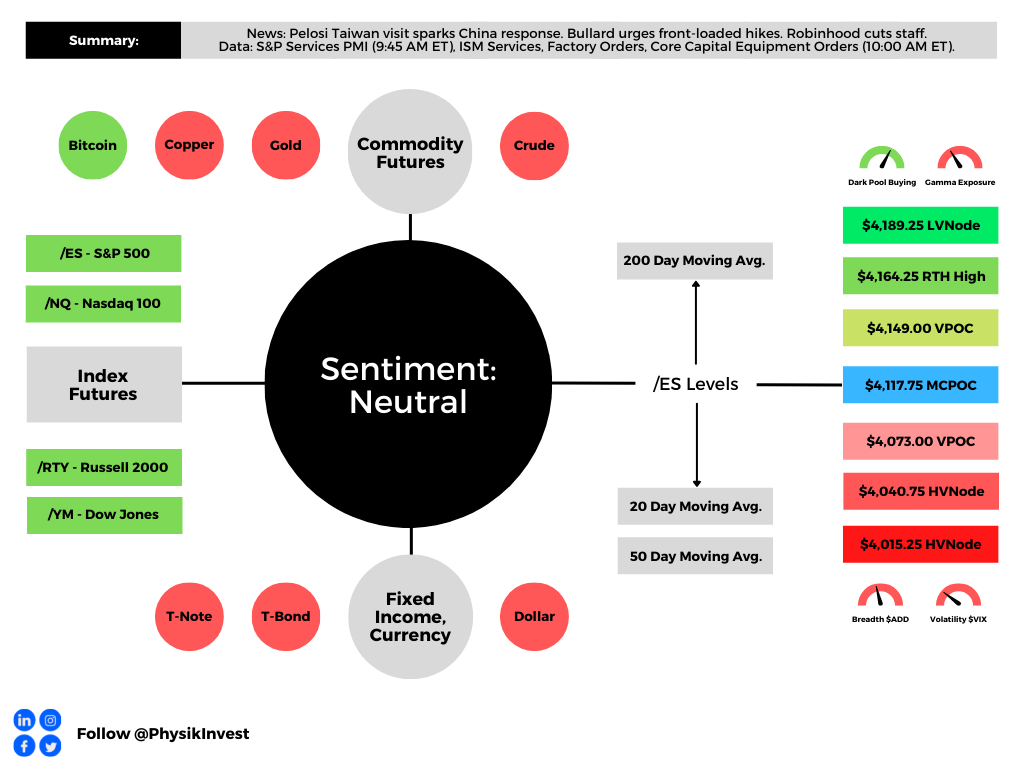
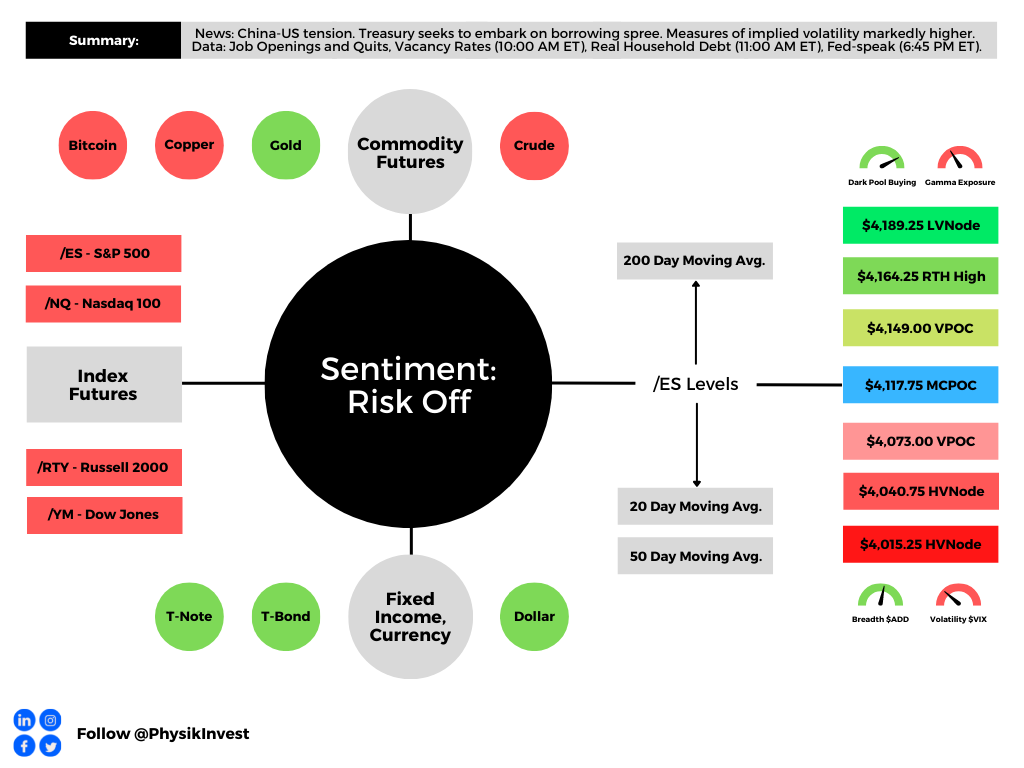
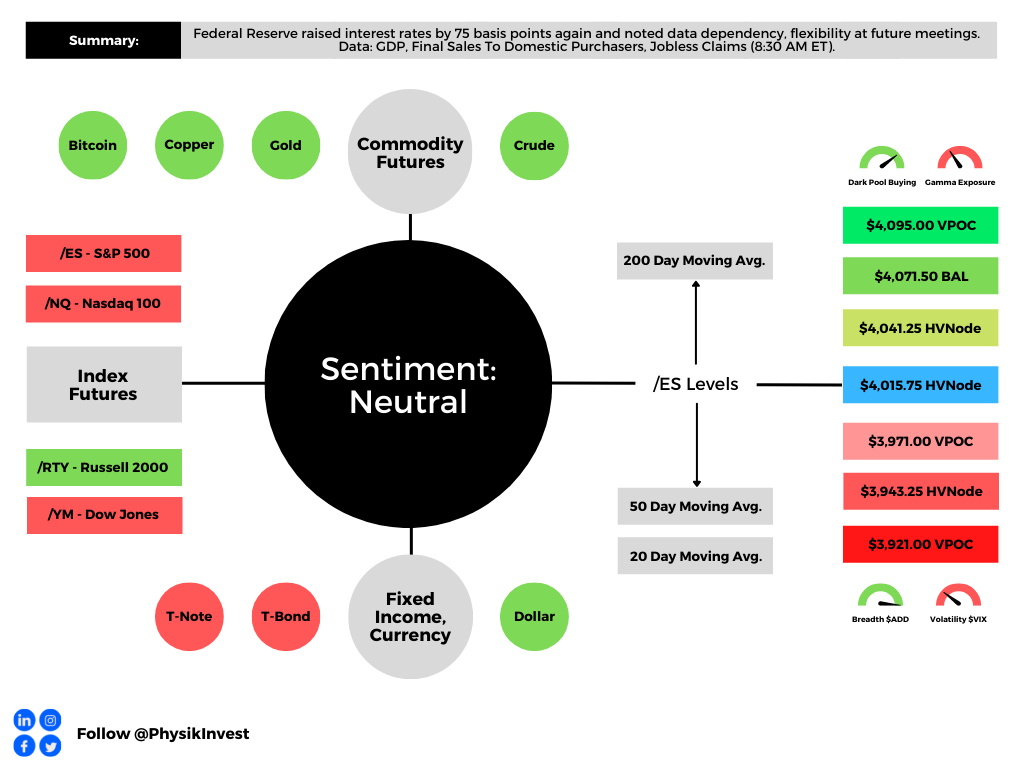
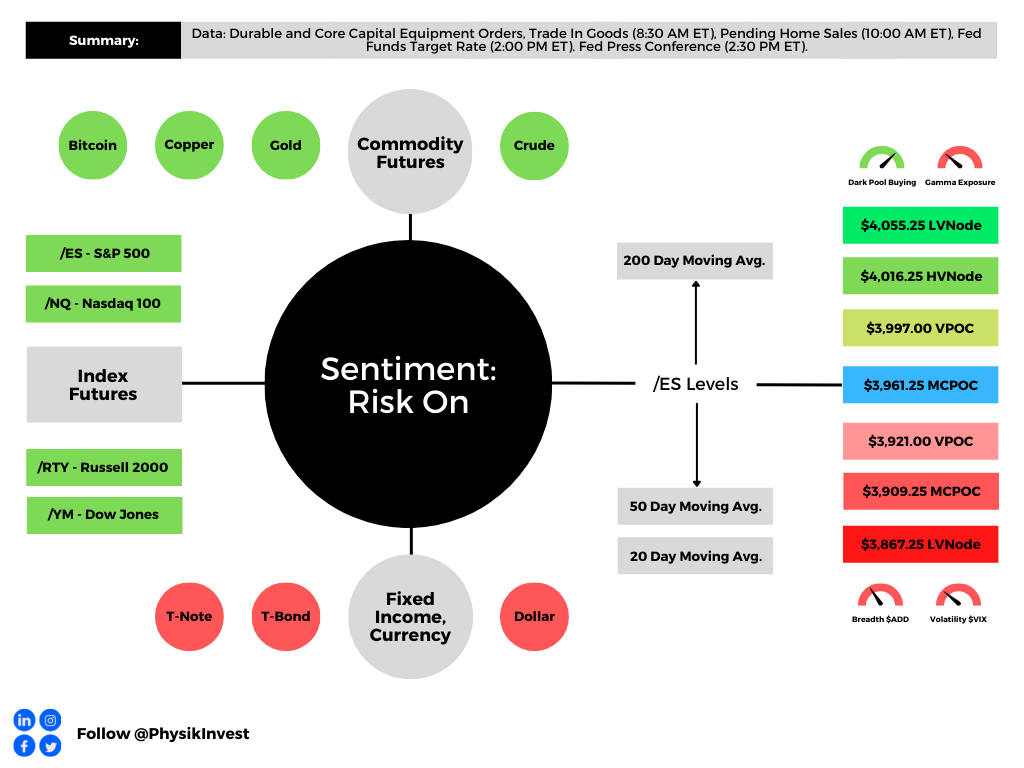
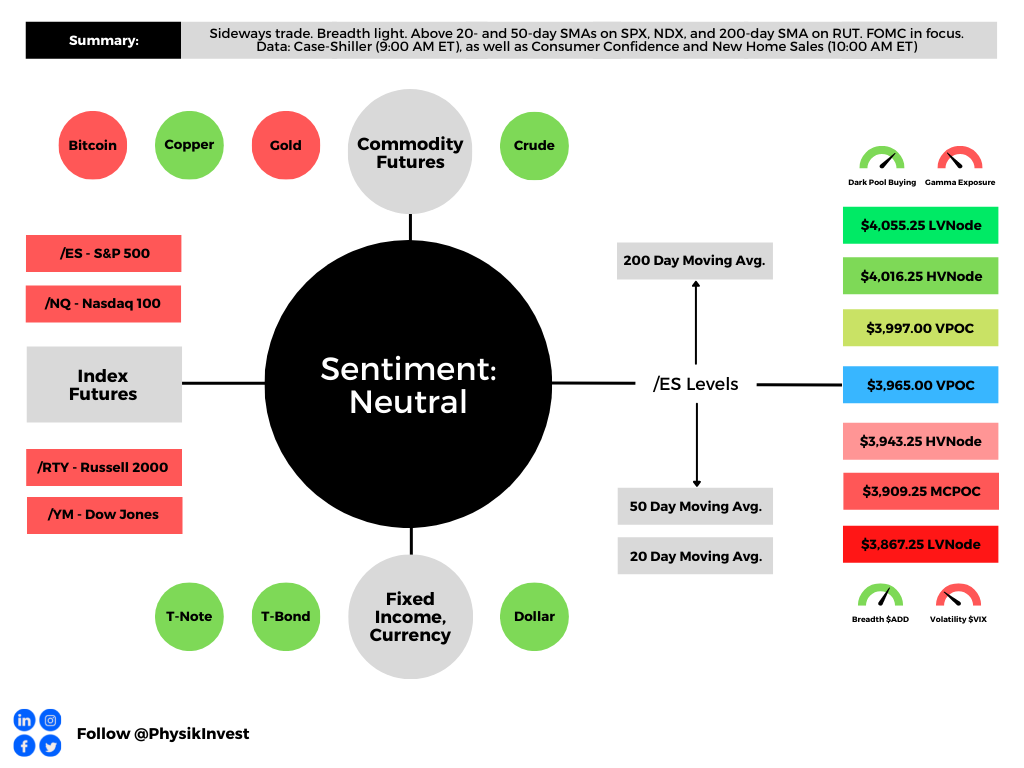
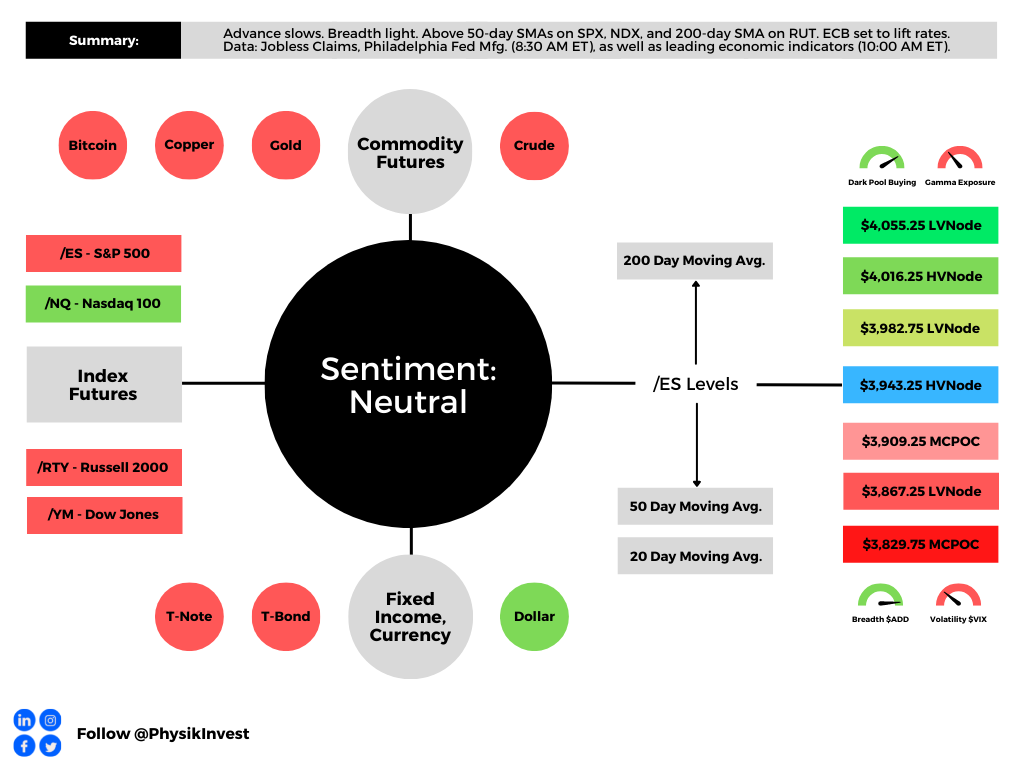
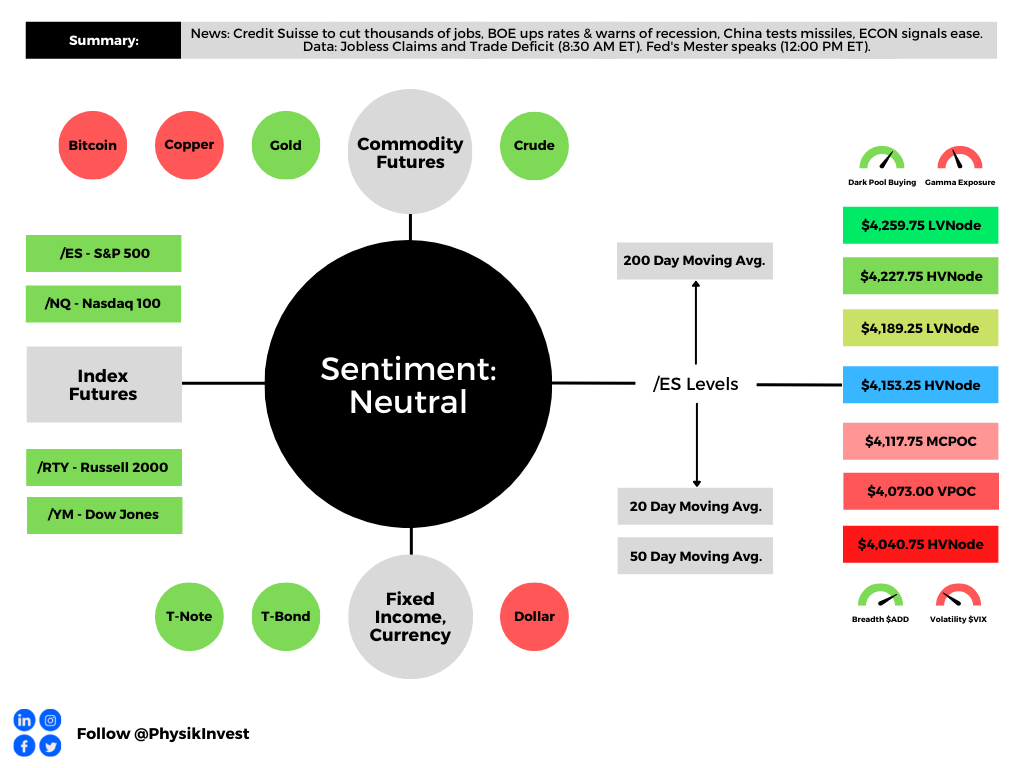
Graphic updated 7:00 AM ET. Sentiment Neutral if expected /ES open is inside of the prior day’s range. /ES levels are derived from the profile graphic at the bottom of the following section. Levels may have changed since initially quoted; click here for the latest levels. SqueezeMetrics Dark Pool Index (DIX) and Gamma (GEX) calculations are based on where the prior day’s reading falls with respect to the MAX and MIN of all occurrences available. A higher DIX is bullish. At the same time, the lower the GEX, the more (expected) volatility. Learn the implications of volatility, direction, and moneyness. Breadth reflects a reading of the prior day’s NYSE Advance/Decline indicator. VIX reflects a current reading of the CBOE Volatility Index (INDEX: VIX) from 0-100.

Fundamental

Shortened fundamentals section, today.

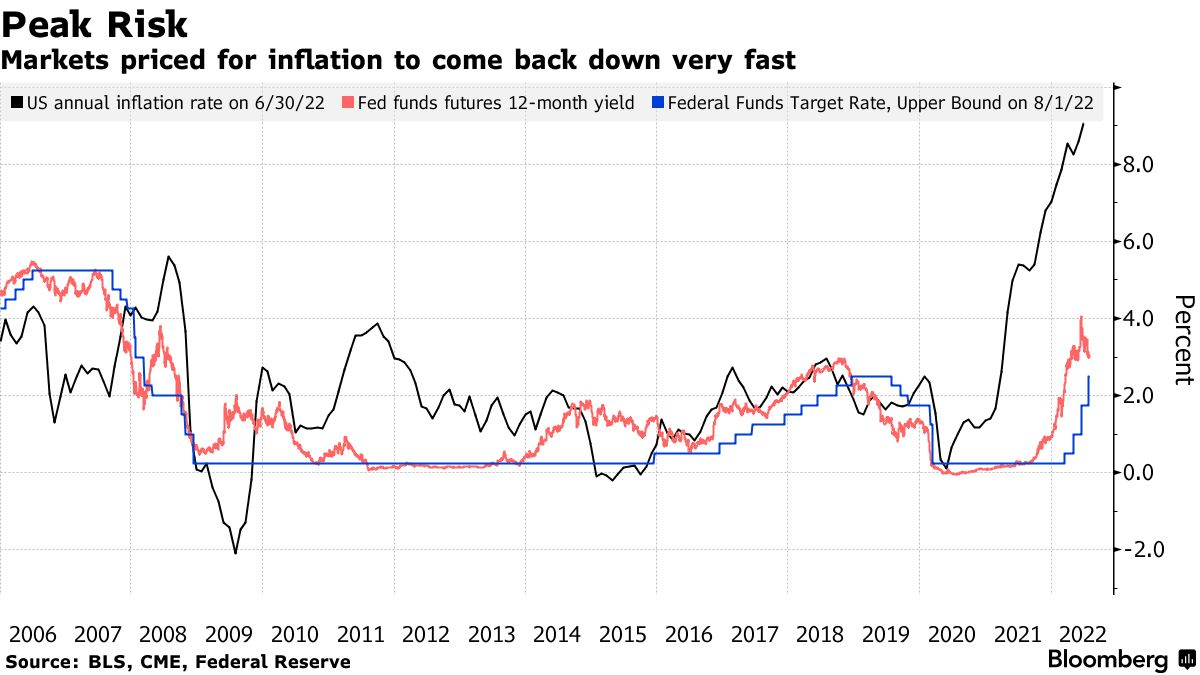
It’s the case that from mid-2020 to late-2021, as well explained by Damped Spring’s Andy Constan, the decline in risk premiums boosted assets, across the board.

Then, when “the drumbeats of quantitative tightening (QT) sounded on December 29,” the expansion in risk premiums bolstered a rotation out of risk.

Per Constan, conditions are unchanged. 

The “knee jerk re-leveraging flow [] will not survive the high coupon issuance/QT doubling of the September and Q4. Fade the [fear of missing out] until Turkey day when Santa comes to town.”
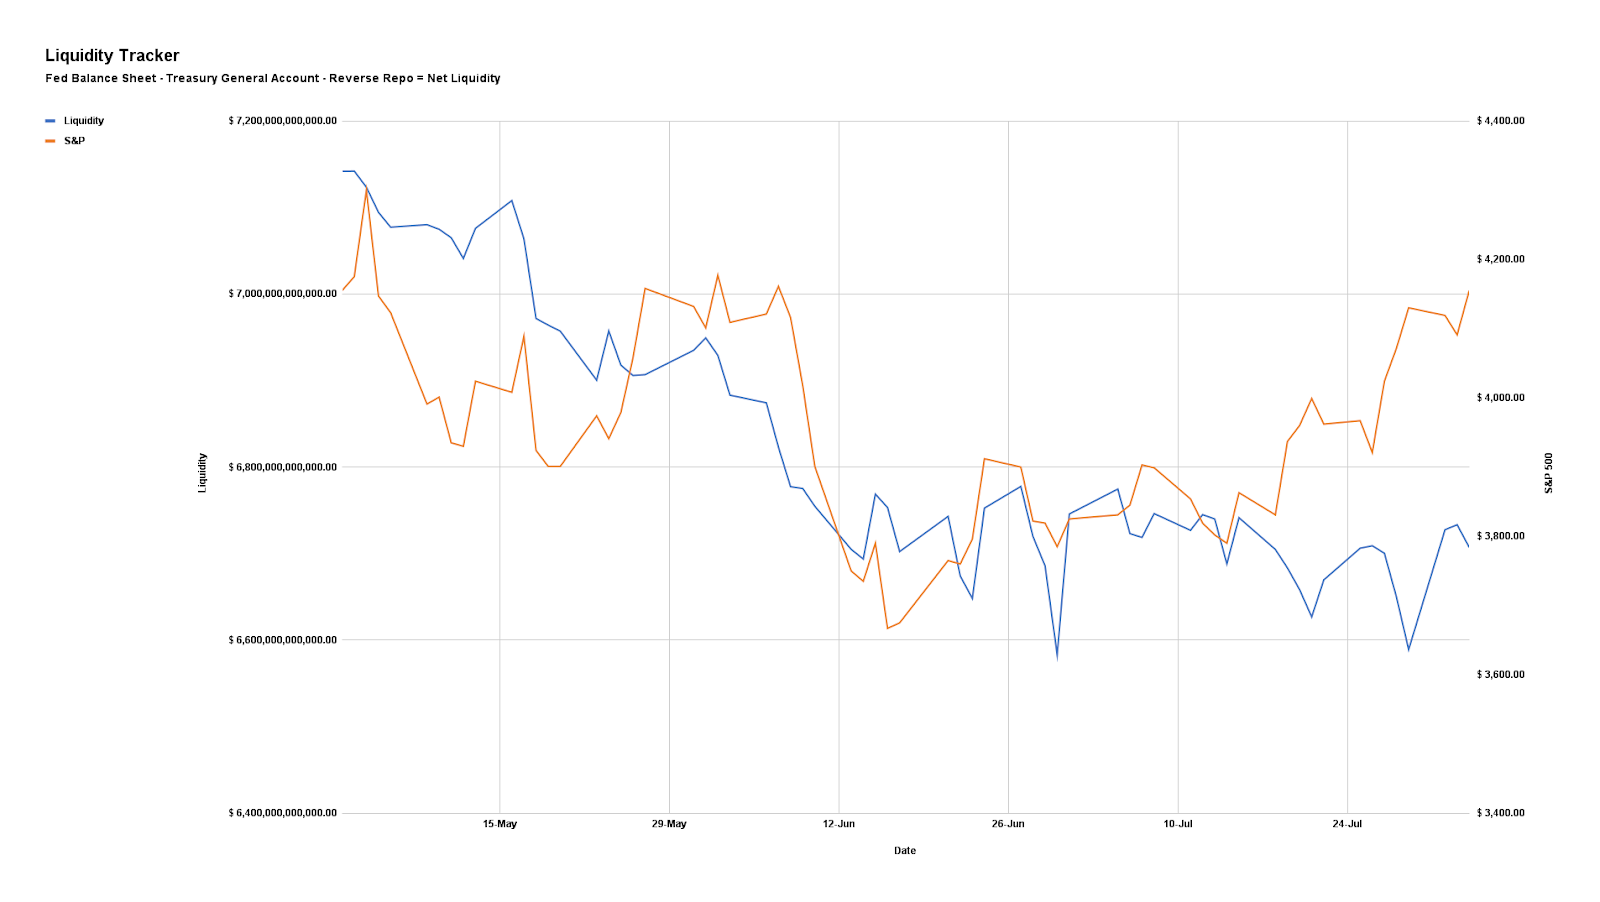
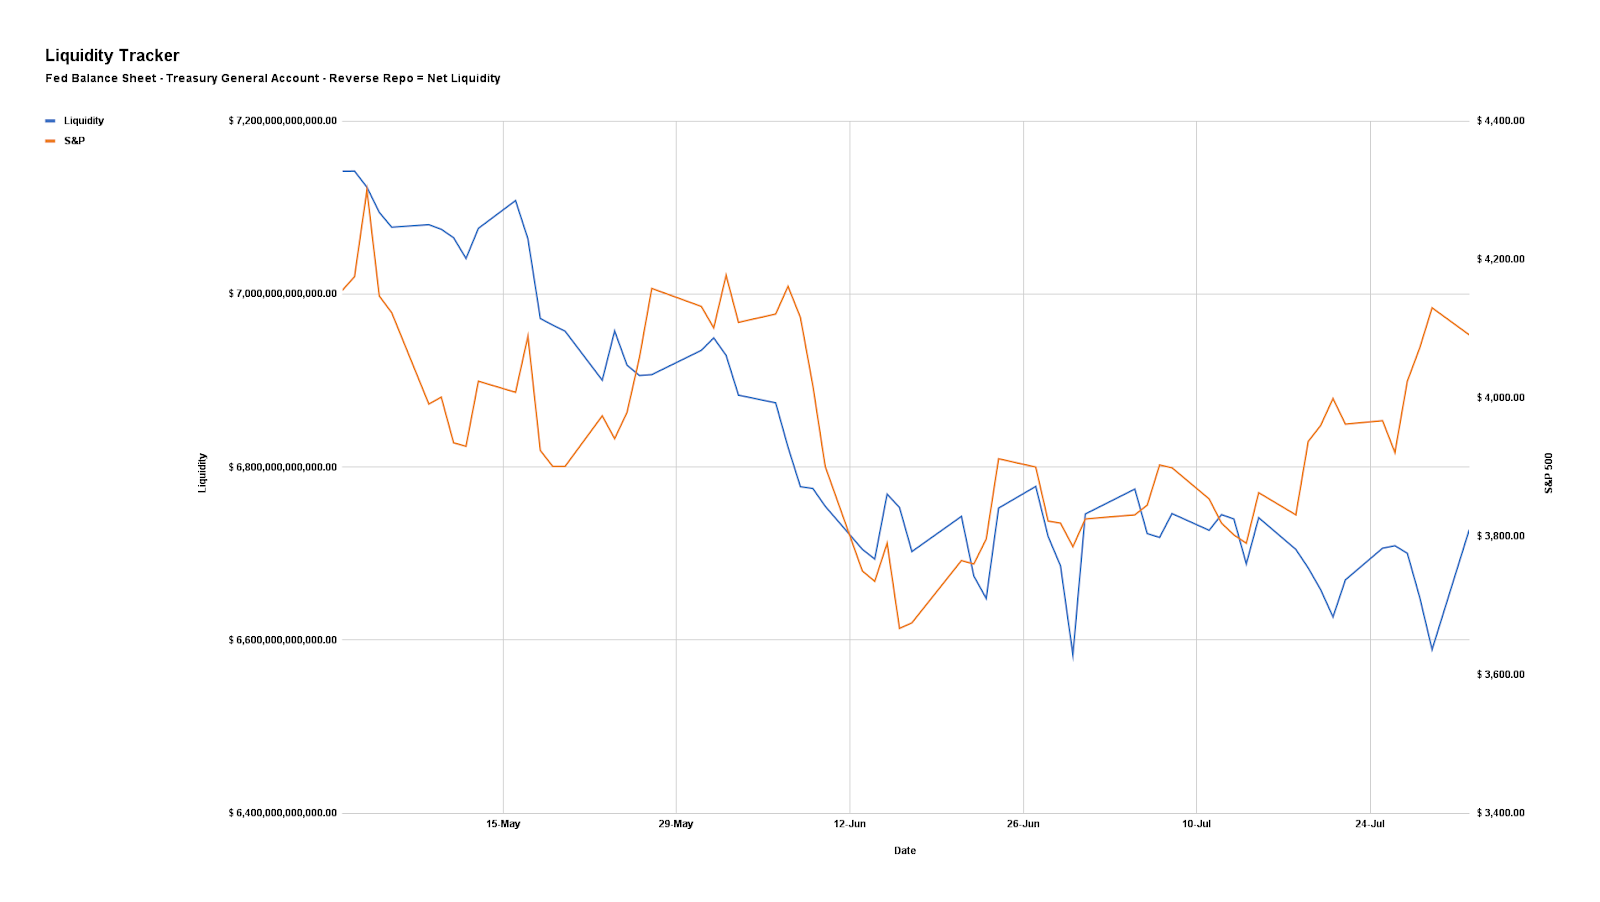
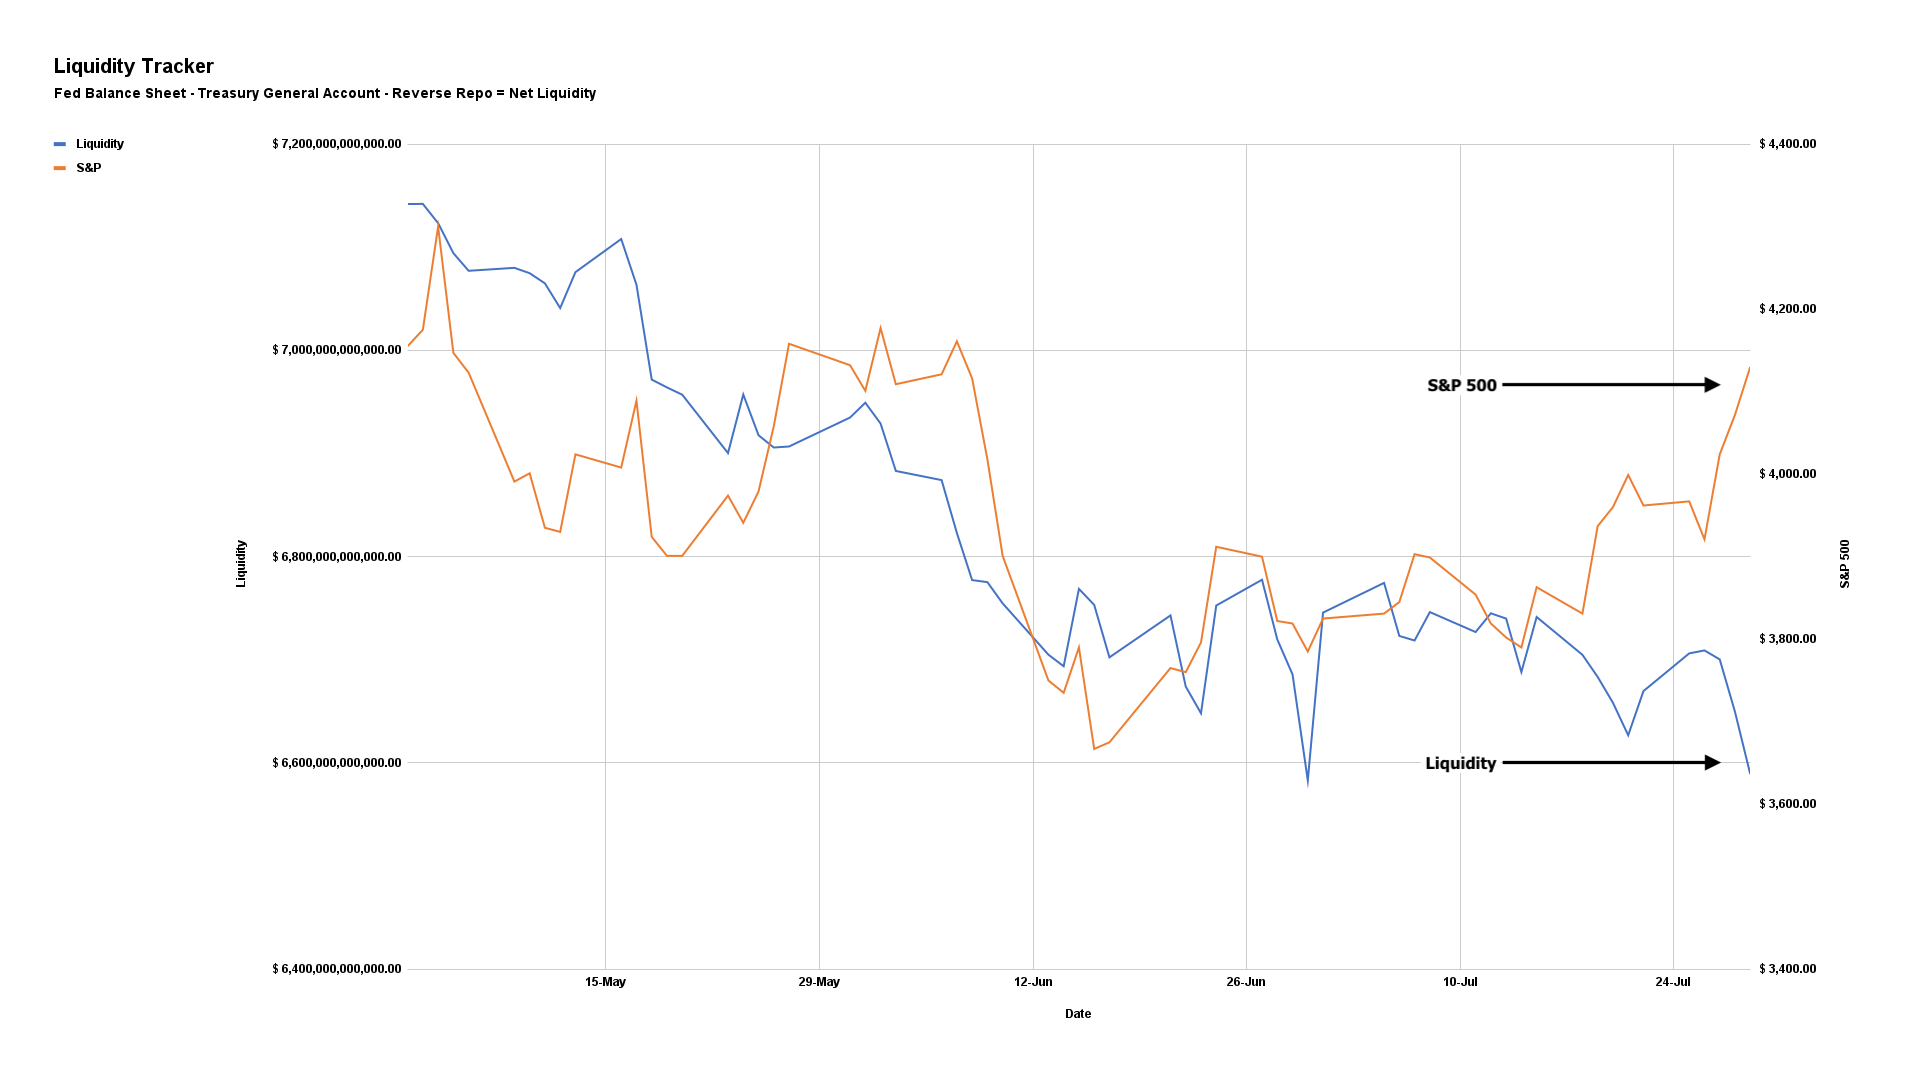
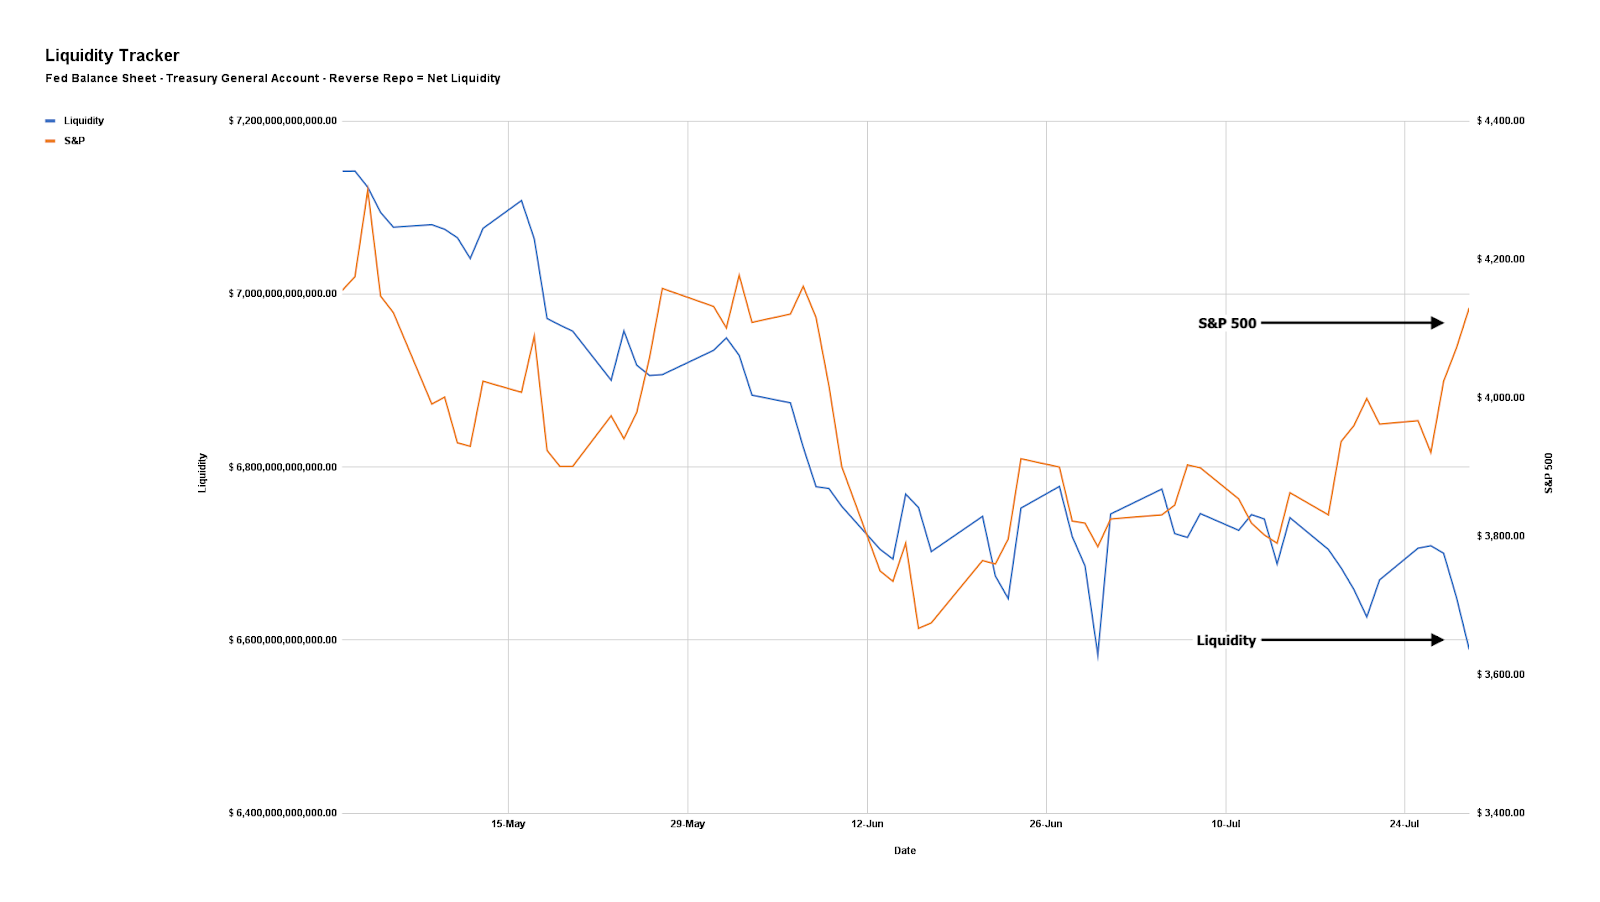
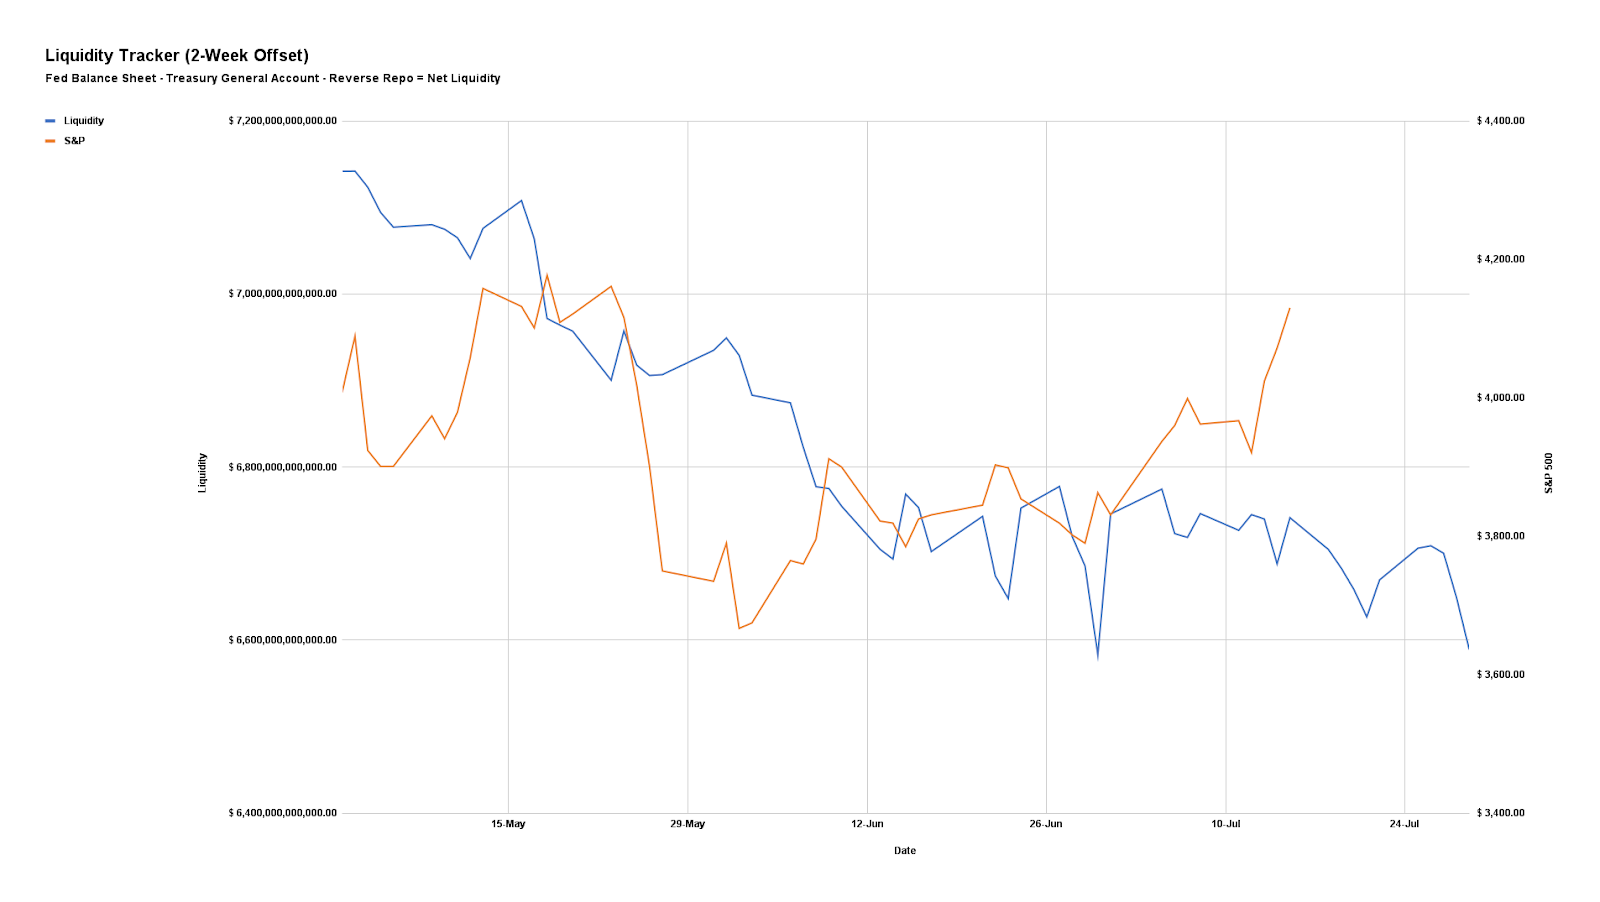
Graphic: Via Physik Invest. Data compiled by @jkonopas623. Fed Balance Sheet data, here. Treasury General Account Data, here. Reverse Repo data, here. NL = BS – TGA – RRP.

Positioning

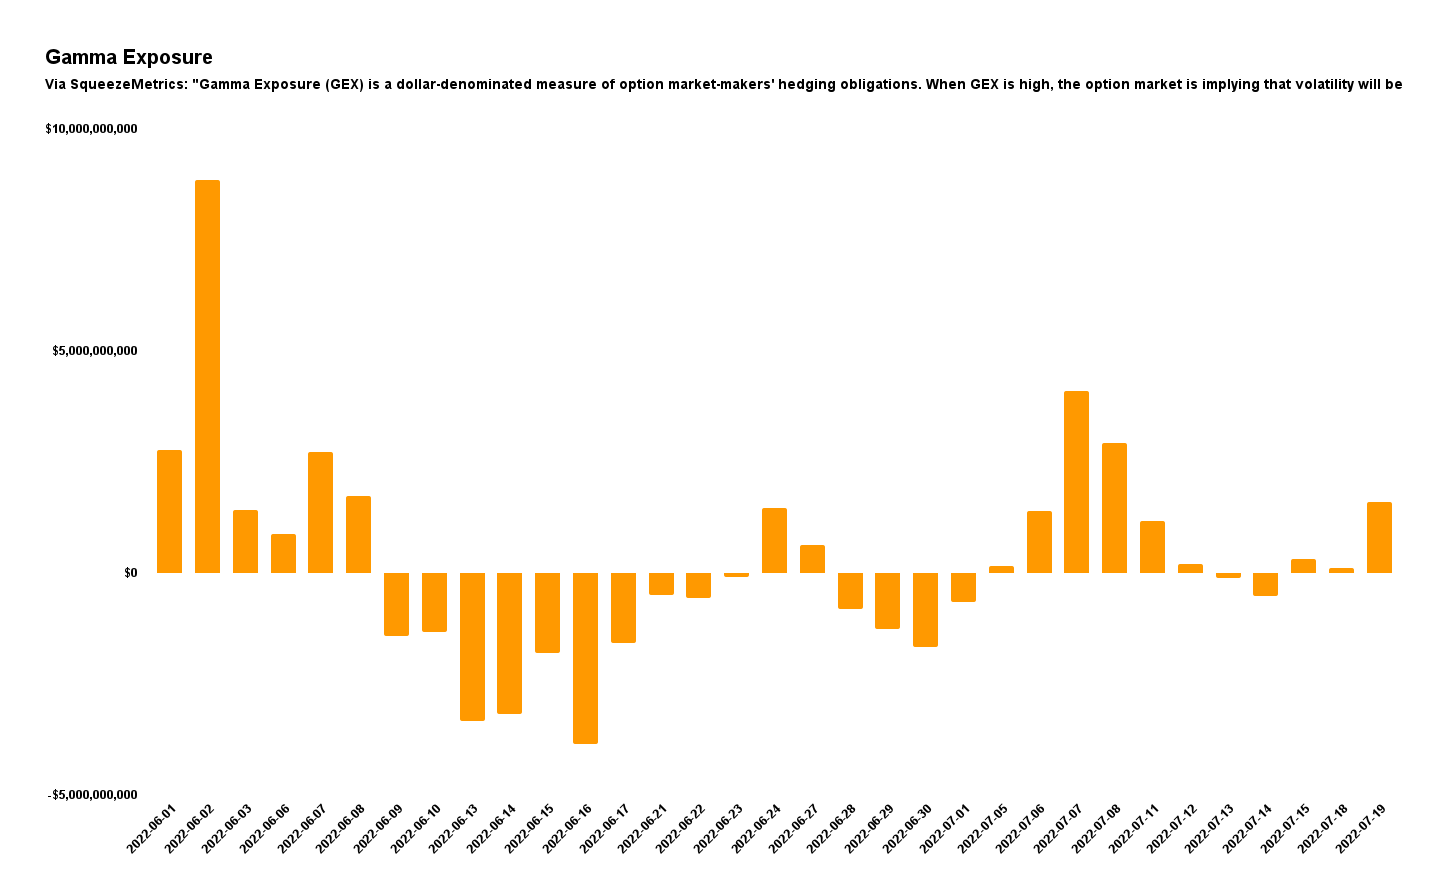
As of 7:00 AM ET, Thursday’s expected volatility, via the Cboe Volatility Index (INDEX: VIX), sits at ~1.14%. Net gamma exposures are increasing which may promote tighter ranges.

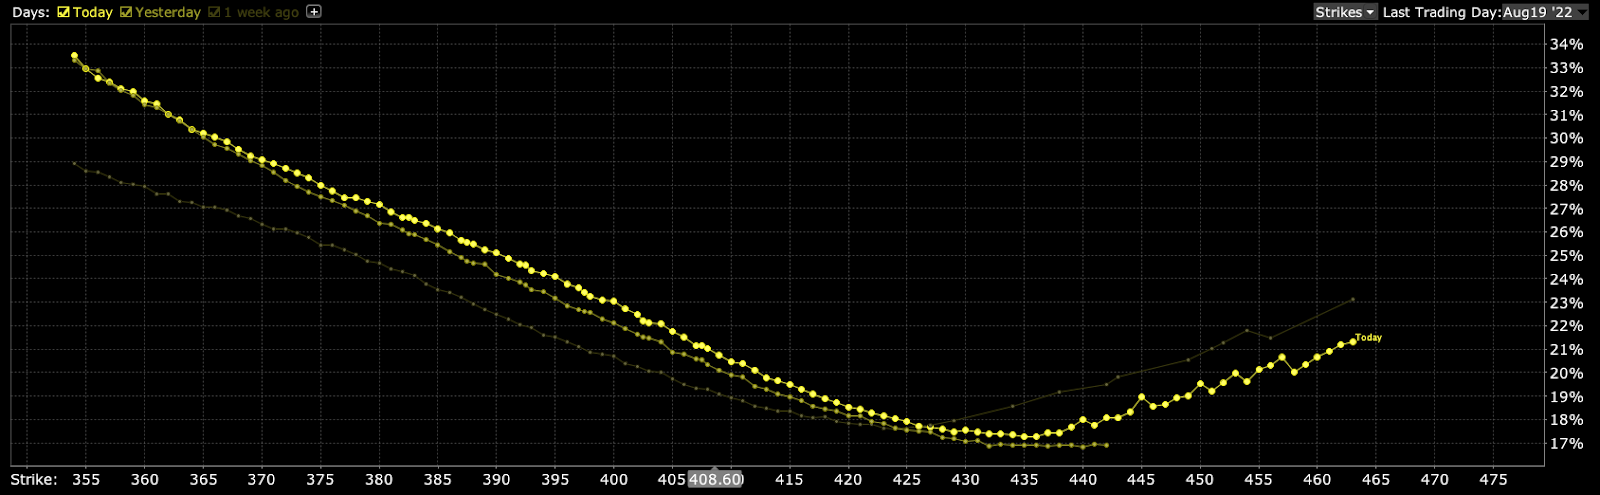
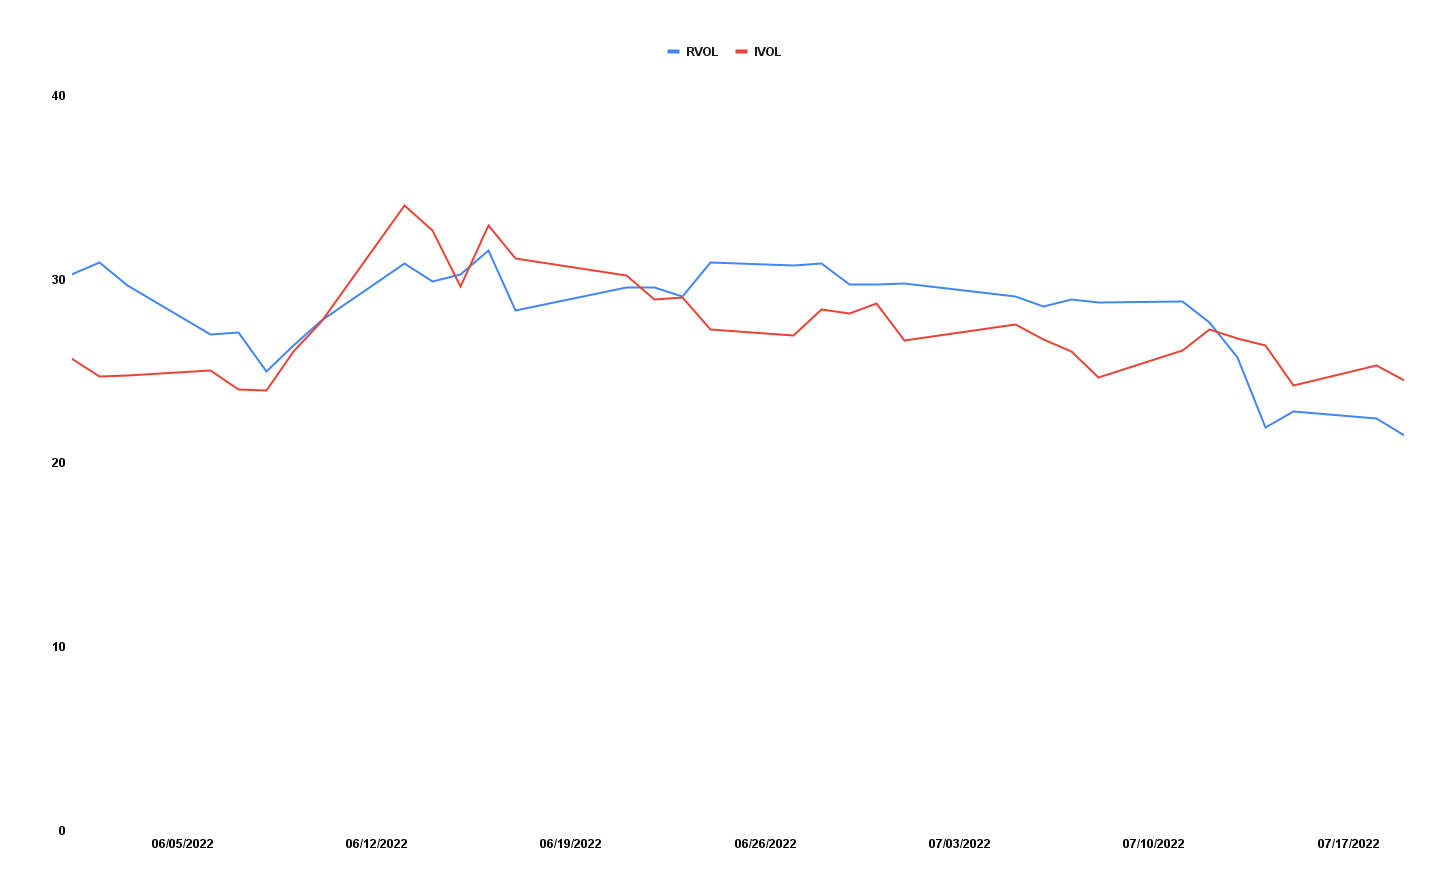
Further, given where realized (RVOL) and implied (IVOL) volatility are, as well as skew, it is beneficial to be a buyer of options structures (e.g., put back spread and/or call ratio spread).

Here is some context.

Per past letters, such as the Daily Brief for August 2, the monetization and counterparty hedging of existing customer volatility (i.e., options) hedges, as well as the sale of short-dated volatility, particularly in some single stocks where there was “rich” volatility into the fall, lent to lackluster performance in IVOL and index mean reversion.
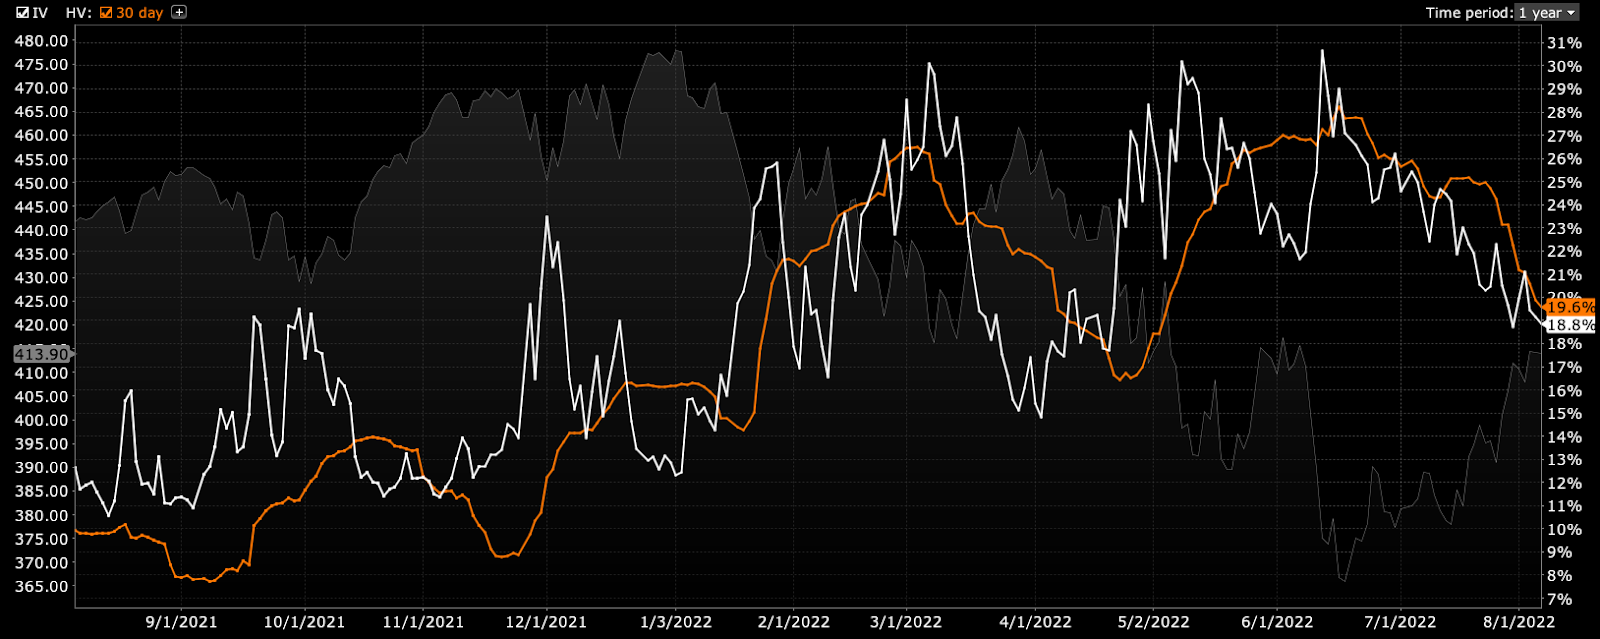
Graphic: RVOL (orange) versus IVOL (white) on the S&P 500 (INDEX: SPX).

These forces have only grown and are, presently, adding to the stickiness of the move higher. 
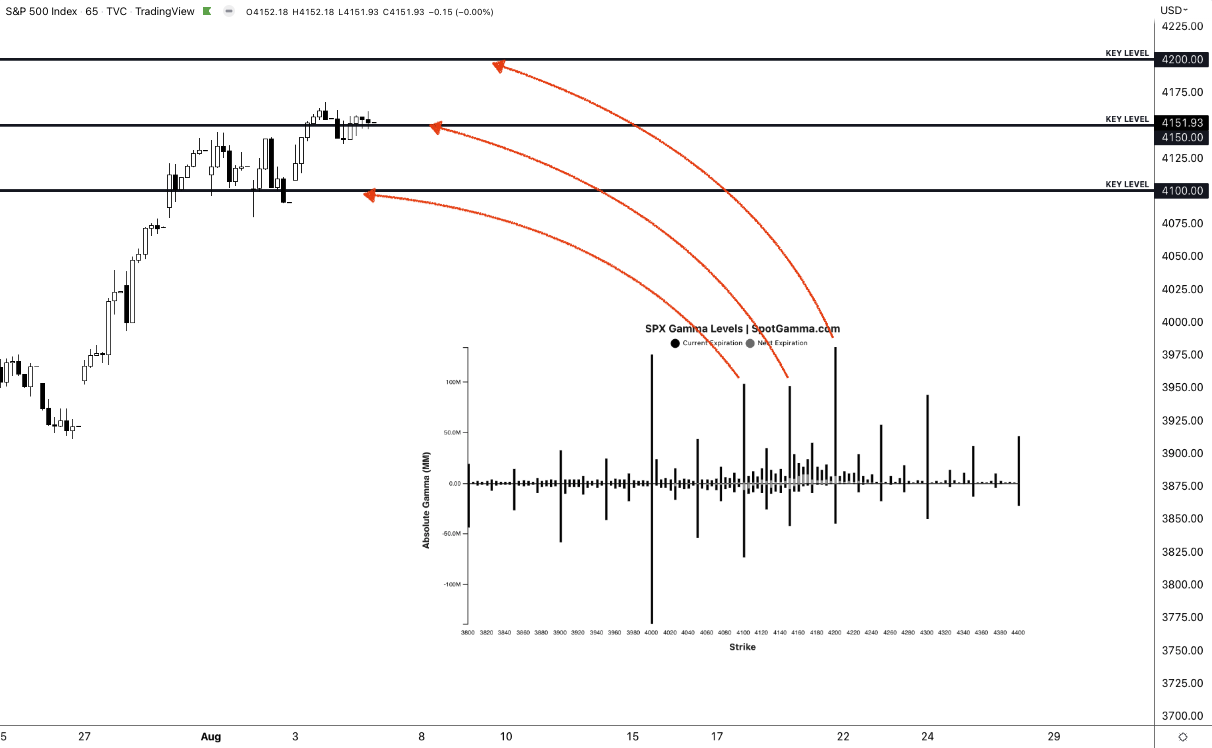
Graphic: Retrieved from SpotGamma on 8/4/2022.

Why? 

Well – though naive – if we take participants as trading similar to the way they do historically (i.e., buying stocks and hedging by selling calls and buying puts), the counterparty is left with a bullish trade (i.e., short put, long call). 

Depending on (A) where the market is in relation to this exposure, as well as (B) where this exposure is more concentrated, the call or put side may solicit increased hedging activities.

Today, with markets trading higher and participants becoming increasingly active on the call side, the counterparties have a trade that is (becoming increasingly) bullish; positive delta (i.e., exposure to direction) and gamma (i.e., rate of change of exposure to direction) are growing.

Further, knowing that participants are concentrating their bets on options close to current market prices, which are very short-dated (and with little time to expiration), the counterparty’s exposure is way more sensitive to changes in direction because options can go from having a lot of value to very little in a small window (of time and movement). 

In other words, it is a fact that an option that is at the money can go from having a near 50% chance of expiring in the money to 0%. However, if the time to expiry is shorter, then the speed at which these options may go from a near 50% chance of expiring in the money to 0% rises.

That’s probably one of the simplest ways one could explain put it.

Therefore (with activity becoming more concentrated at options strikes near current price, all the while IVOL continues to fall), into weakness, counterparties lean toward buying (selling) dips (rips).

Adding:

If you (like a counterparty) own a call option and want no exposure to the positive payoff when the market moves higher, you sell the underlying asset (e.g., stock, future).

If the market is sideways and slightly lower, while volatility is generally trending lower, as it is recently, and your option declines in value, then you must rebalance your hedge. So, you would buy (cover) some of your existing short stock and futures position to rebalance your deltas.

That’s supportive.

Read: SqueezeMetrics’ “The Implied Order Book” for more regarding the impact of options trade on underlying liquidity.

Moreover, the trends above may be coming to an end as entities are squeezed out of trades that aren’t working (i.e., participants continue to rotate out of poor-performing volatility and commodities). 

Accordingly, Kai Volatility’s Cem Karsan explains that markets can, now, as that suppressive options activity fades, potentially, “really begin to respond to the core macro factors.”

Here’s why.

Should markets experience a shock (e.g., China and U.S. tensions escalate), the new demand for hedges may result in an “untethering” in IVOL, which was “one of the most supportive things into the decline,” Karsan explained.

That means that now is the best time to rotate into call options that are outperforming “their delta to the upside.”

Graphic: Via Banco Santander SA (NYSE: SAN) research, the return profile, at expiry, of a classic 1×2 (long 1, short 2 further away) ratio spread.

You may ask: what’s bolstering some of the market’s strength, in the shorter term?

In spite of negative macro narratives, as IVOL continues to decline and options, in general, are less sought after per their poor performance, what’s providing an added boost is the “cohort of quantitative-based investment strategies [buying] equities when volatility is lower,” according to statements by the Wall Street Journal.

“This year, these so-called systematic strategies have exited the market to historically low levels, meaning they have plenty of buying power.”

Much more next week! Talk soon.

Technical

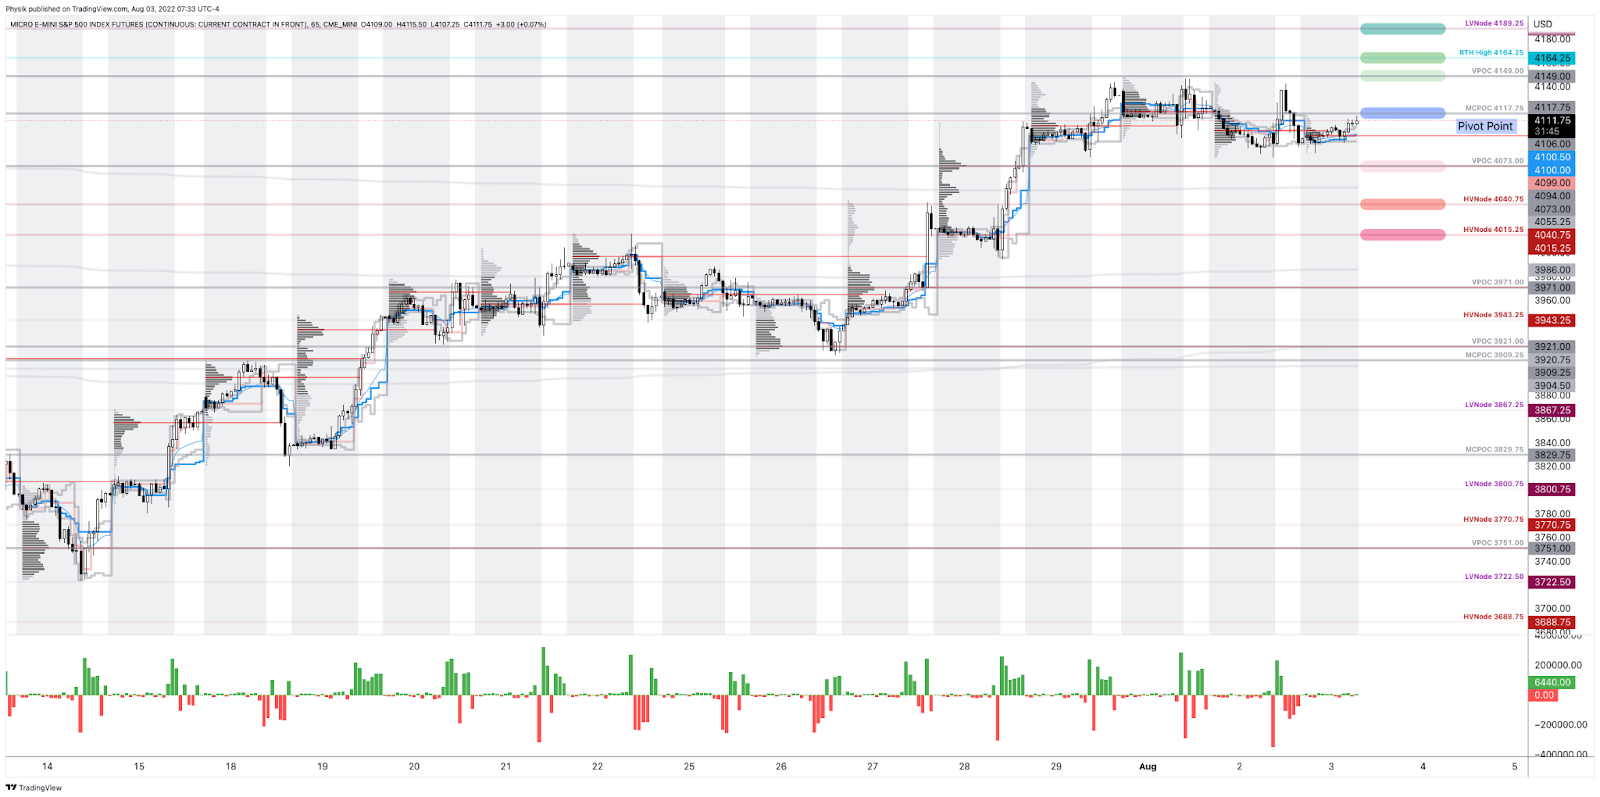
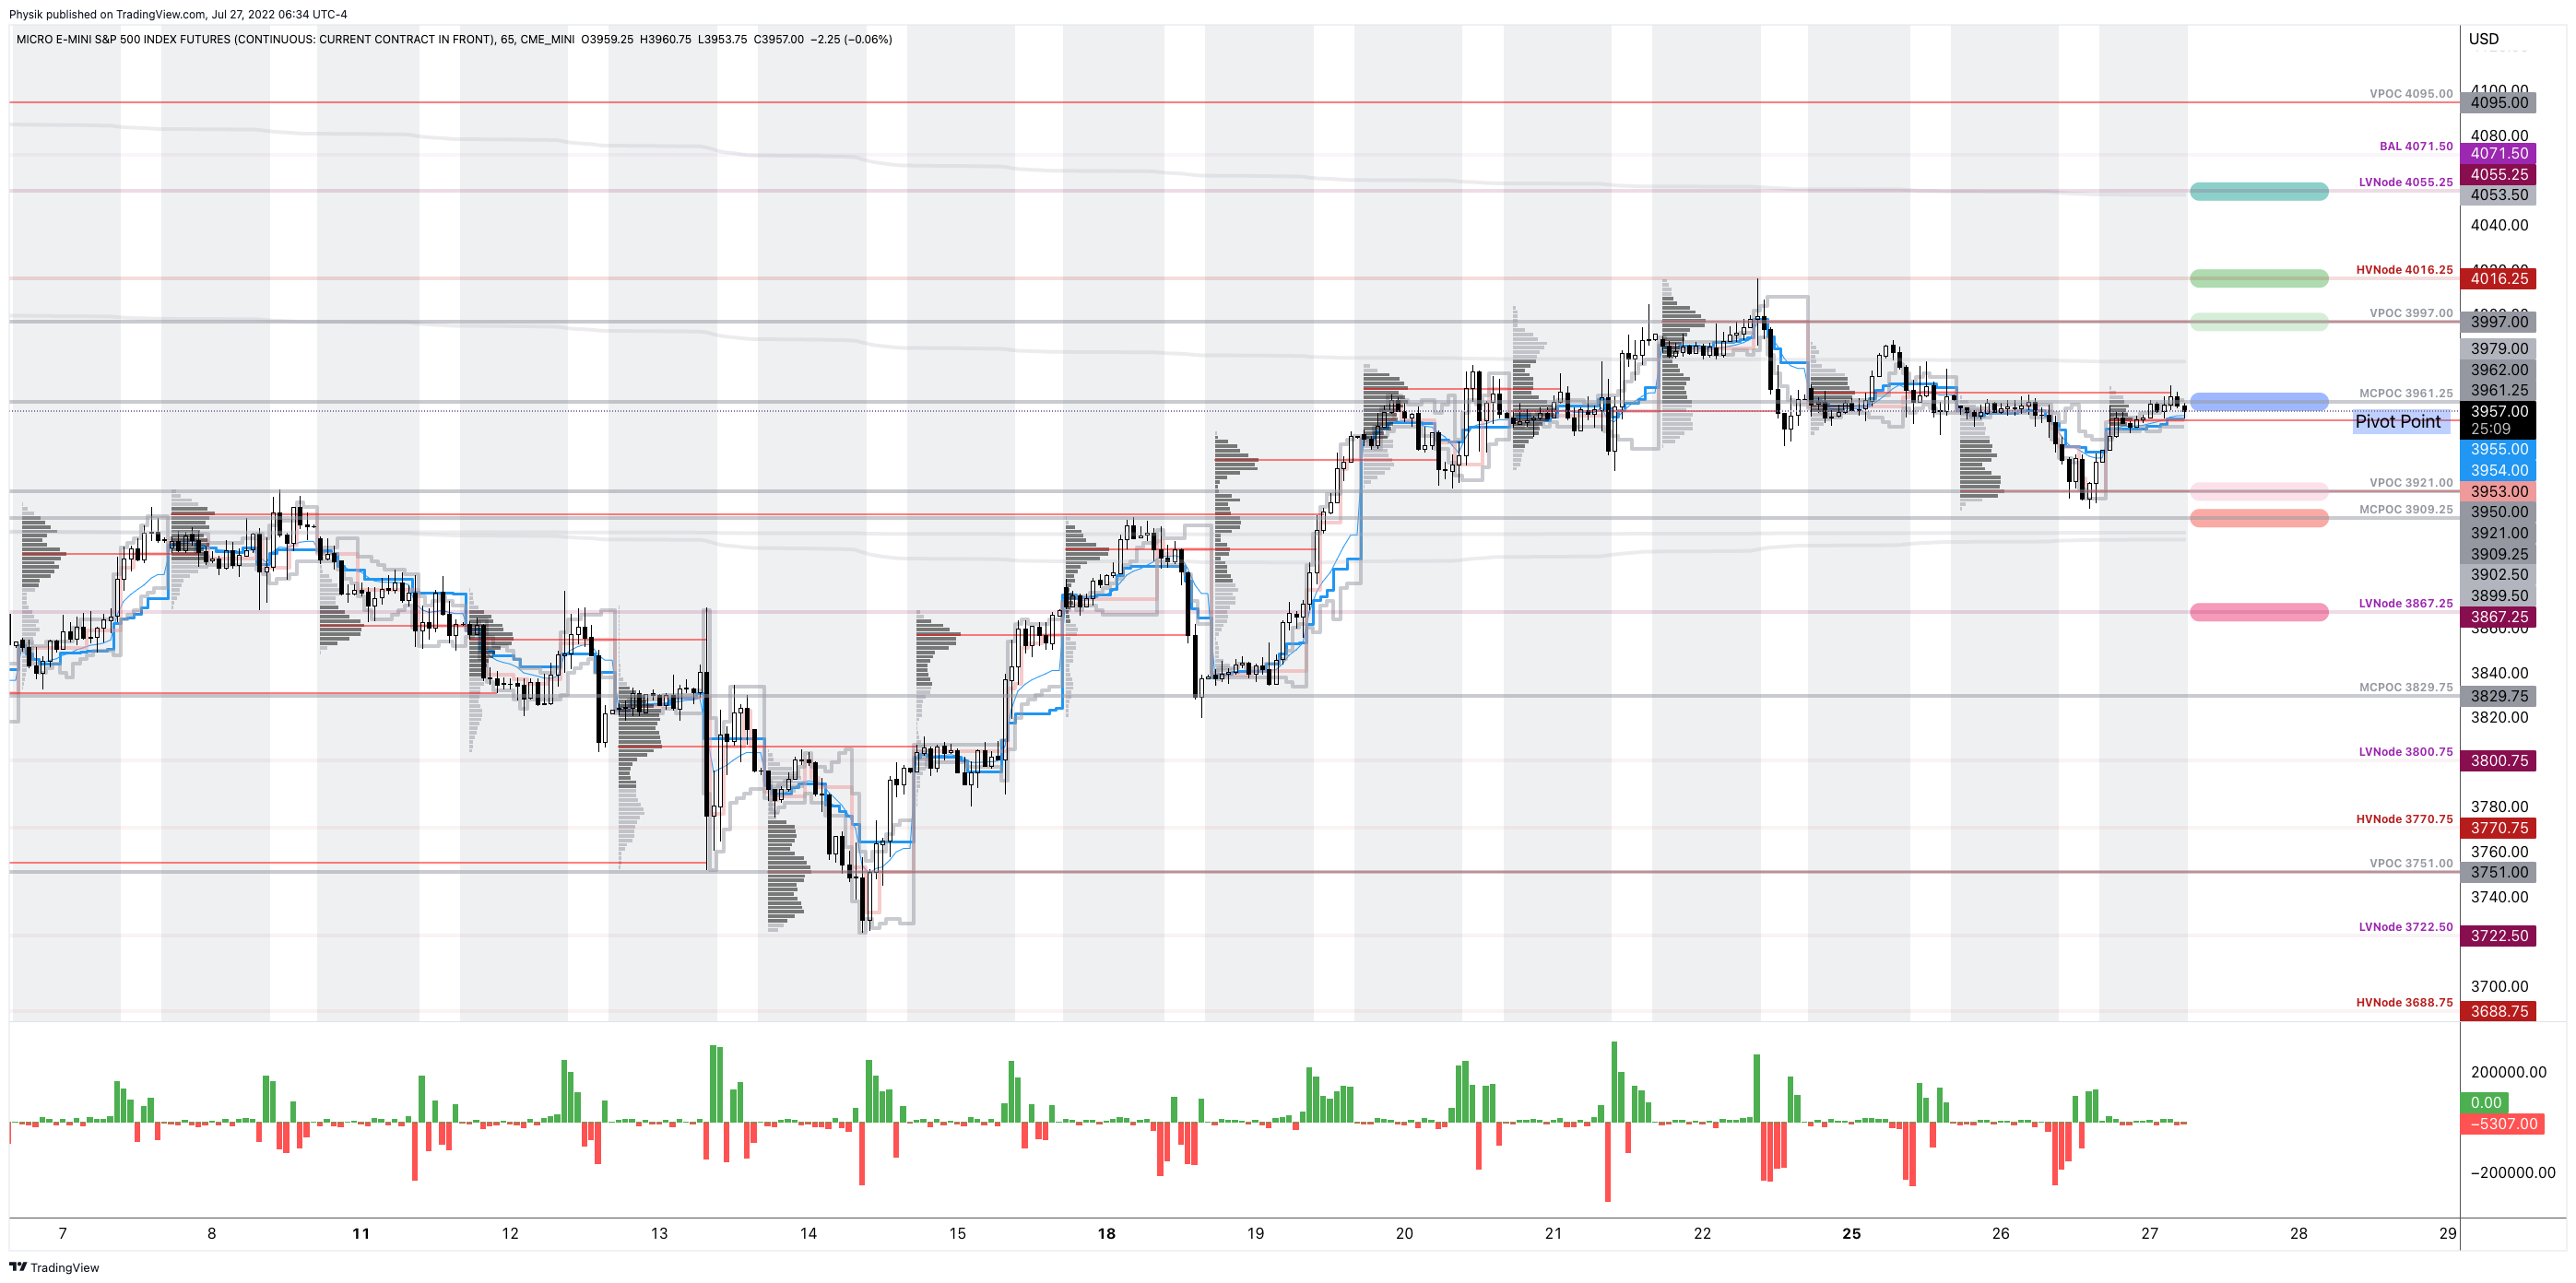
As of 7:00 AM ET, Thursday’s regular session (9:30 AM – 4:00 PM ET), in the S&P 500, is likely to open in the middle part of a balanced overnight inventory, just inside of prior-range and -value, suggesting a limited potential for immediate directional opportunity.

In the best case, the S&P 500 trades higher.

Any activity above the $4,153.25 HVNode puts into play the $4,189.25 LVNode. Initiative trade beyond the LVNode could reach as high as the $4,227.75 HVNode and $4,259.75 LVNode, or higher.

In the worst case, the S&P 500 trades lower.

Any activity below the $4,153.25 HVNode puts into play the $4,117.75 MCPOC. Initiative trade beyond the MCPOC could reach as low as the $4,073.00 VPOC and $4,040.75 HVNode, or lower.

Click here to load today’s key levels into the web-based TradingView charting platform. Note that all levels are derived using the 65-minute timeframe. New links are produced, daily.
Graphic: 65-minute profile chart of the Micro E-mini S&P 500 Futures.

Considerations: Responsiveness near key-technical areas (that are discernable visually on a chart), suggests technically-driven traders with short time horizons are very active. 

Such traders often lack the wherewithal to defend retests and, additionally, the type of trade may be indicative of the other time frame participants waiting for more information to initiate trades.

Definitions

Volume Areas: A structurally sound market will build on areas of high volume (HVNodes). Should the market trend for long periods of time, it will lack sound structure, identified as low volume areas (LVNodes). LVNodes denote directional conviction and ought to offer support on any test. 

If participants were to auction and find acceptance into areas of prior low volume (LVNodes), then future discovery ought to be volatile and quick as participants look to HVNodes for favorable entry or exit.

POCs: POCs are valuable as they denote areas where two-sided trade was most prevalent in a prior day session. Participants will respond to future tests of value as they offer favorable entry and exit.

MCPOCs: POCs are valuable as they denote areas where two-sided trade was most prevalent over numerous day sessions. Participants will respond to future tests of value as they offer favorable entry and exit.

Volume-Weighted Average Prices (VWAPs): A metric highly regarded by chief investment officers, among other participants, for quality of trade. Additionally, liquidity algorithms are benchmarked and programmed to buy and sell around VWAPs.

About

After years of self-education, strategy development, mentorship, and trial-and-error, Renato Leonard Capelj began trading full-time and founded Physik Invest to detail his methods, research, and performance in the markets.

Capelj also develops insights around impactful options market dynamics at SpotGamma and is a Benzinga reporter.

Some of his works include conversations with ARK Invest’s Catherine Wood, investors Kevin O’Leary and John Chambers, FTX’s Sam Bankman-Fried, ex-Bridgewater Associate Andy Constan, Kai Volatility’s Cem Karsan, The Ambrus Group’s Kris Sidial, among many others.

Disclaimer

In no way should the materials herein be construed as advice. Derivatives carry a substantial risk of loss. All content is for informational purposes only.

Categories
Commentary

Daily Brief For August 4, 2022

The daily brief is a free glimpse into the prevailing fundamental and technical drivers of U.S. equity market products. Join the 750+ that read this report daily, below!

Graphic updated 7:10 AM ET. Sentiment Neutral if expected /ES open is inside of the prior day’s range. /ES levels are derived from the profile graphic at the bottom of the following section. Levels may have changed since initially quoted; click here for the latest levels. SqueezeMetrics Dark Pool Index (DIX) and Gamma (GEX) calculations are based on where the prior day’s reading falls with respect to the MAX and MIN of all occurrences available. A higher DIX is bullish. At the same time, the lower the GEX, the more (expected) volatility. Learn the implications of volatility, direction, and moneyness. Breadth reflects a reading of the prior day’s NYSE Advance/Decline indicator. VIX reflects a current reading of the CBOE Volatility Index (INDEX: VIX) from 0-100.

Fundamental

A heavy week content-wise. 

Monday, we talked about some of the big narratives participants are seeking to price. Tuesday and Wednesday we elaborated, providing information on the calculation of net liquidity and its relationship with equity index prices, as well as the probable paths the economy may traverse.

Today, we’ll add context with respect to some of the big headlines heading into today’s trade.

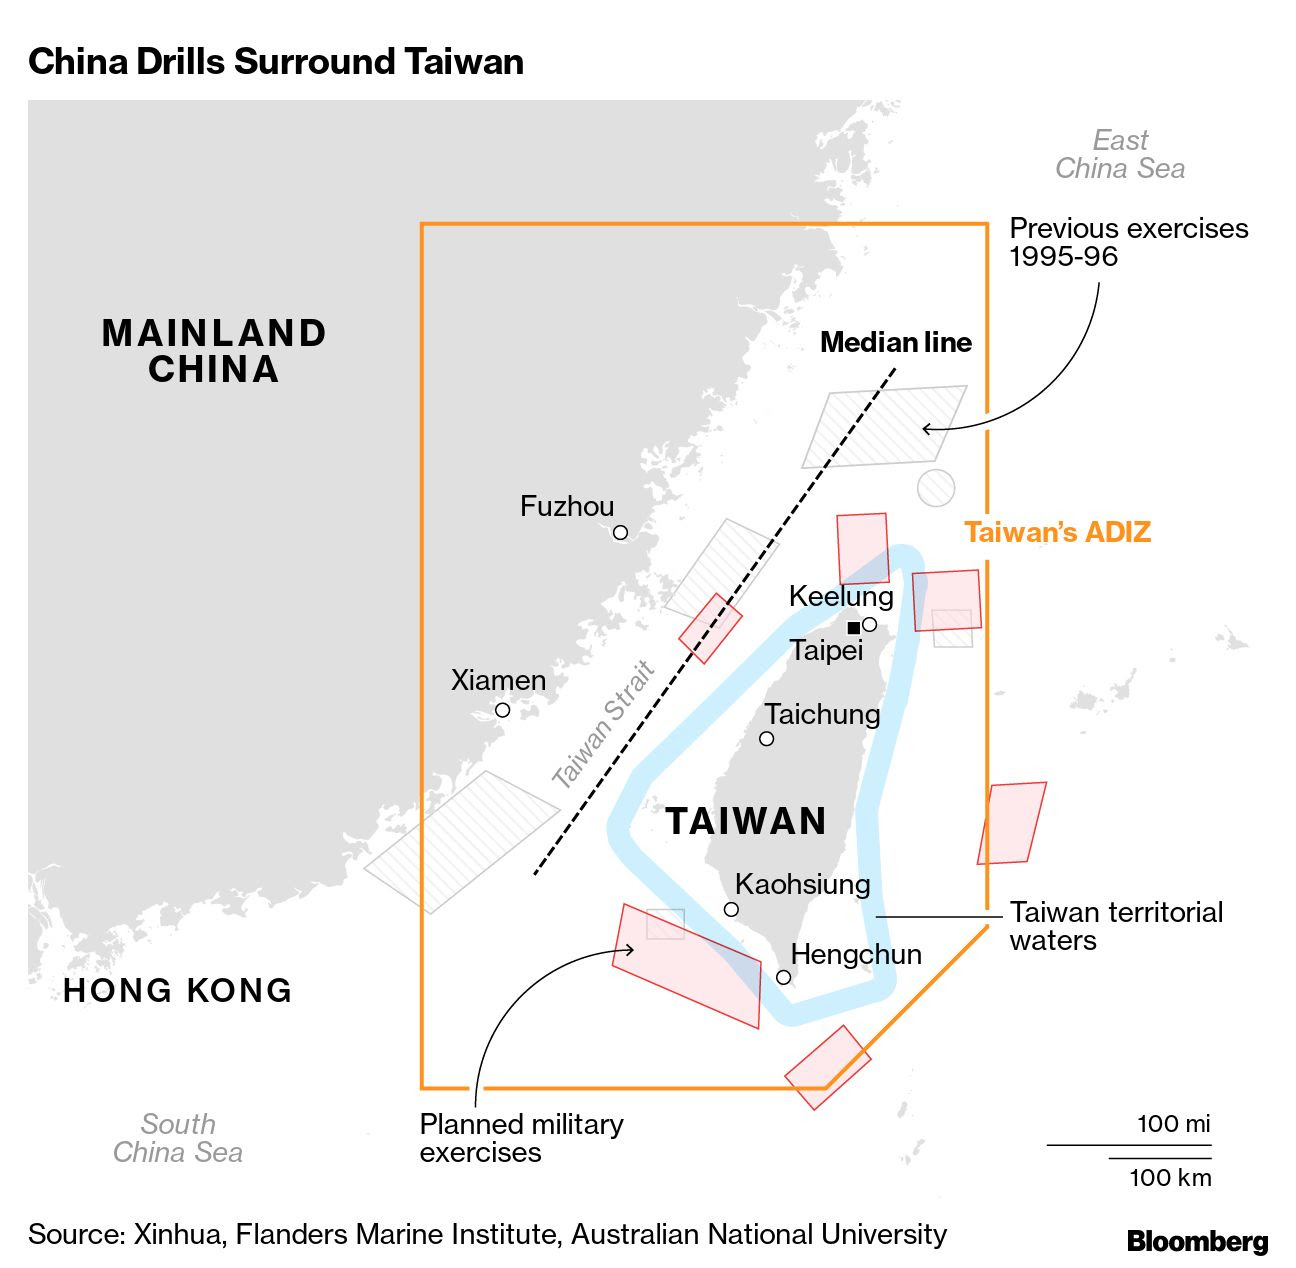
At the top of the list is geopolitical tension. US House Speaker Nancy Pelosi traveled to Taiwan. 

It’s the case that “China views Taiwan as a breakaway island” subject to mainland rules. The visit by Pelosi, who, per NPR, “has long been a critic of China and an advocate for Taiwan’s democracy,” China viewed as a provocation.

Accordingly, China responded with trade boycotts and military exercises such as the firing of 11 missiles into the sea around Taiwan.

Graphic: Retrieved from Bloomberg.

White House officials, per Bloomberg, were said to be “fuming” at Pelosi. In response, the Biden administration was seeking to put brakes on friendlier US and Taiwan policies.

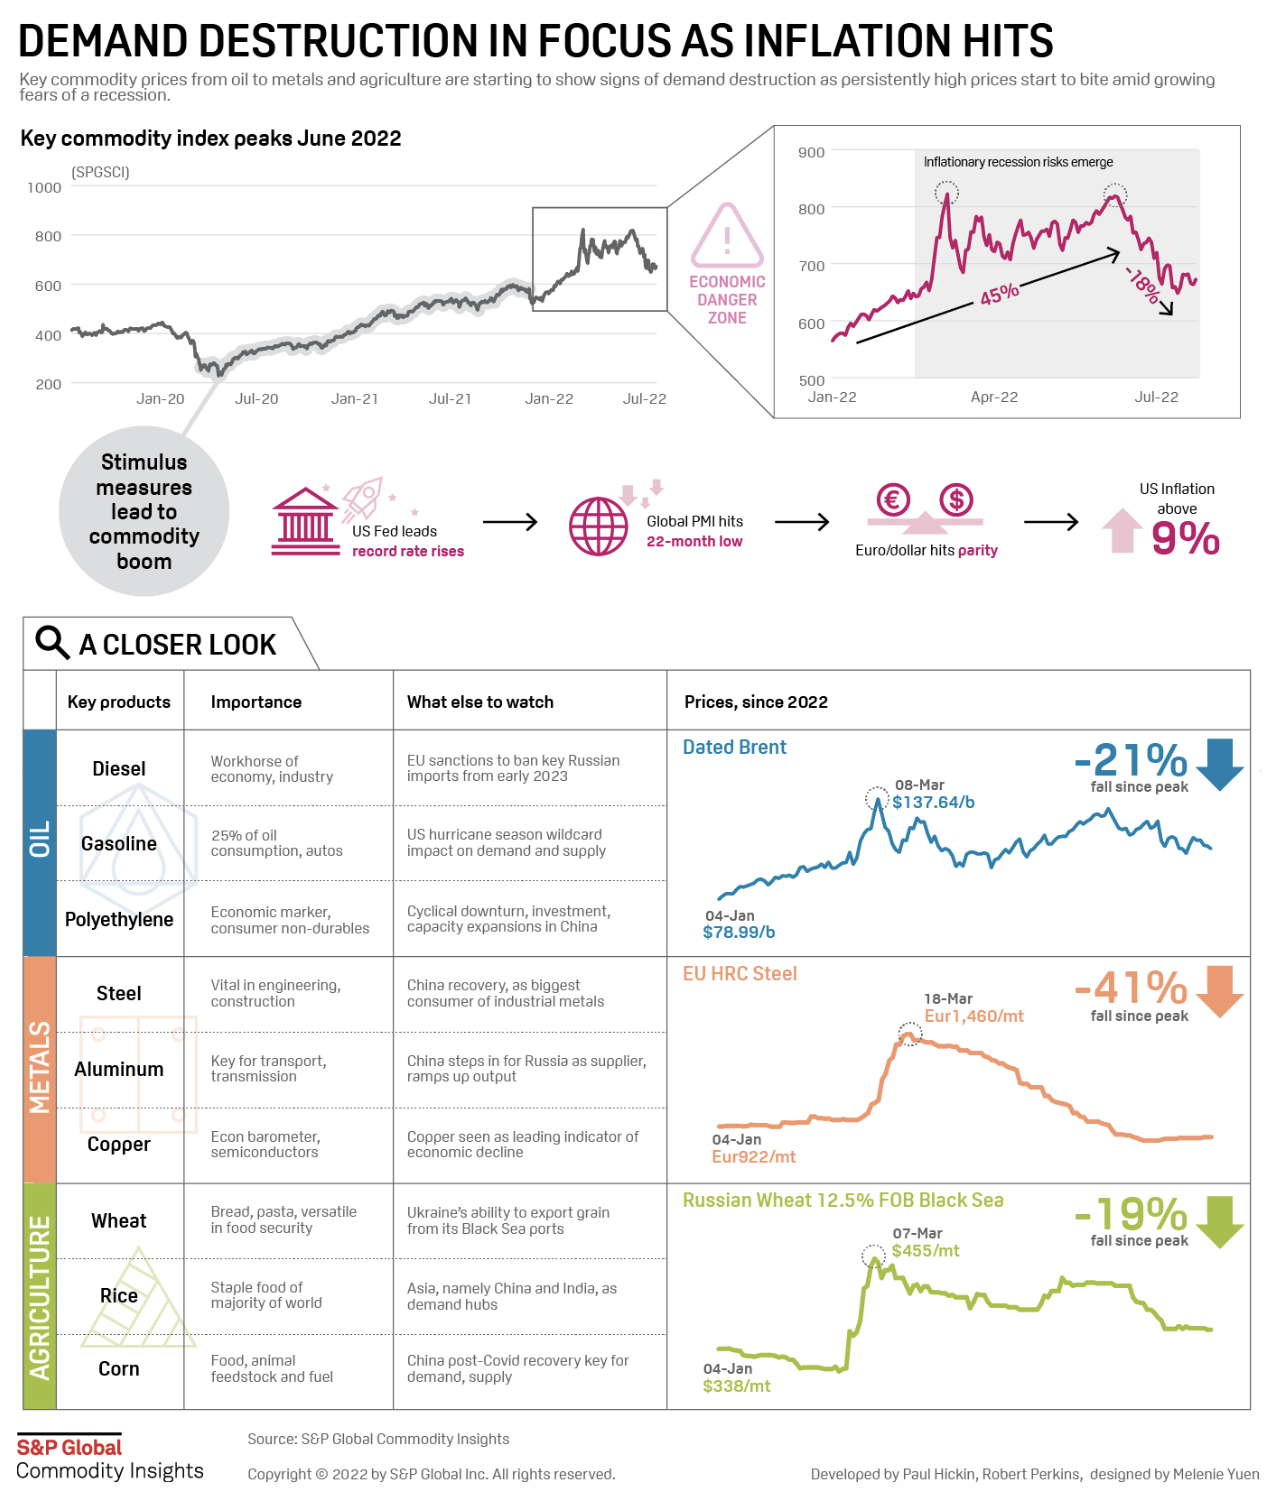
In other news, an ISM Services reading climbed unexpectedly, easing the concern of economic slowing while other data showed material and commodity prices falling.

Graphic: Retrieved from S&P Global Inc’s (NYSE: SPGI) commodity insights.

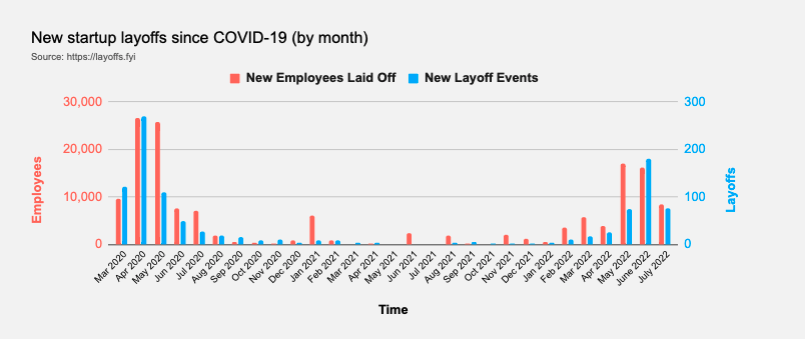
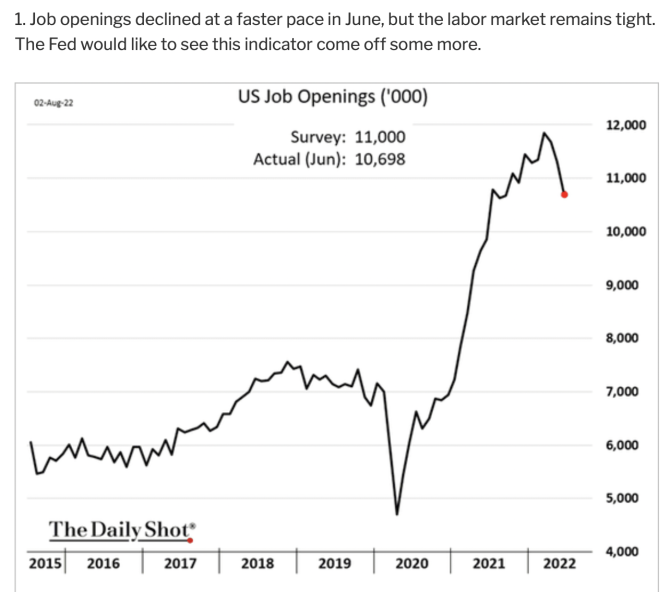
Still, more firms, from the likes of Credit Suisse Group AG (NYSE: CS) to Robinhood Markets Inc (NASDAQ: HOOD), are seeking to cut thousands of jobs and restructure.

Graphic: Retrieved from The Daily Shot.

And, though equity markets are enjoying some relief, profit forecasts continue to be cut, and broad measures of the supply of money are falling.

Graphic: Via Physik Invest. Data compiled by @jkonopas623. Fed Balance Sheet data, here. Treasury General Account Data, here. Reverse Repo data, here. NL = BS – TGA – RRP.

Additionally, many maintain that conditions are set to get tighter with the Bank of England raising rates the most since 1995 and a Fed funds rate of 5-6% not out of the realm of possibilities.

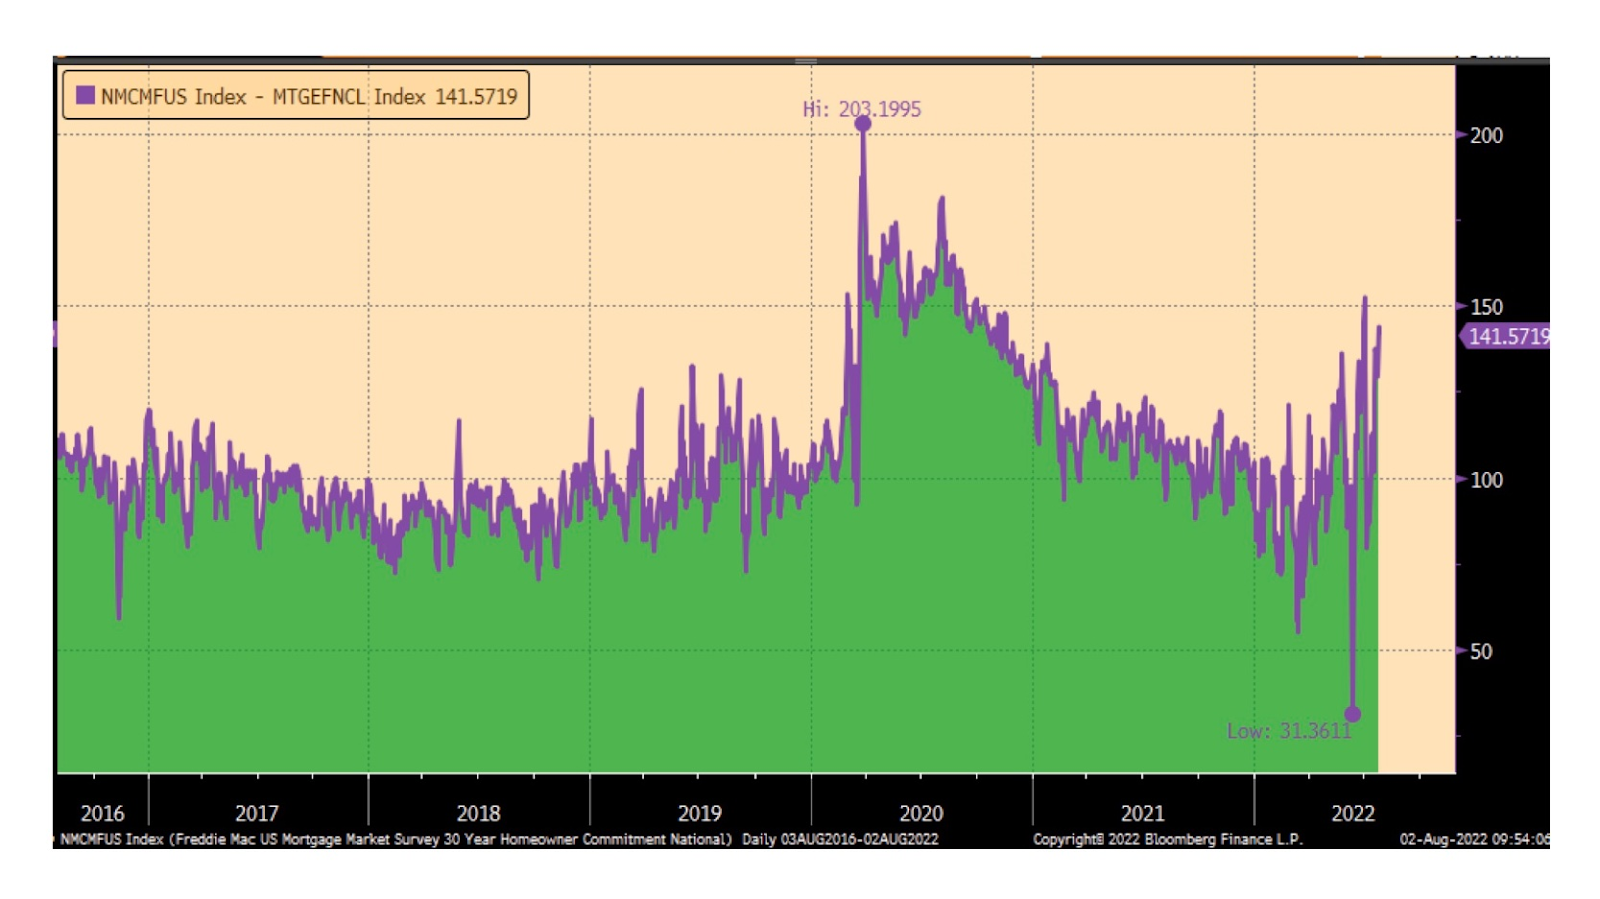
Graphic: Retrieved from @ConvexityMaven. “Home buyers don’t panic, retail Mortgage rates should soon be under 4.90%. MBS (mortgage bonds) usually trade ~75bp above the 10yr swap rate  (~85bp above the UST10yr rate). The retail Home loan rate should be ~100bp above MBS rate (chart). Mortgage brokers will be begging soon.

Positioning

As of 7:10 AM ET, Thursday’s expected volatility, via the Cboe Volatility Index (INDEX: VIX), sits at ~1.14%. Net gamma exposures increasing may promote tighter ranges at higher price levels.

Context: Customers concentrate bets at and above current S&P 500 (INDEX: SPX) prices. 

Taking the naive view and assuming this activity is, indeed, aligned with historical trends (i.e., customers sell calls and use those proceeds to finance protection, down below), then counterparts are likely taking on exposure to more long call positions, which they hedge by selling underlying. Into strength, some more underlying will be sold. Into weakness, some underlying will be bought. This activity can promote mean-reversion at higher prices.
Graphic: Retrieved from SpotGamma. Changes in call open interest.

As well put in our August 3 letter, given where realized (RVOL) and implied (IVOL) volatility are, as well as skew, it is beneficial to be a buyer of options structures (e.g., put back spread).

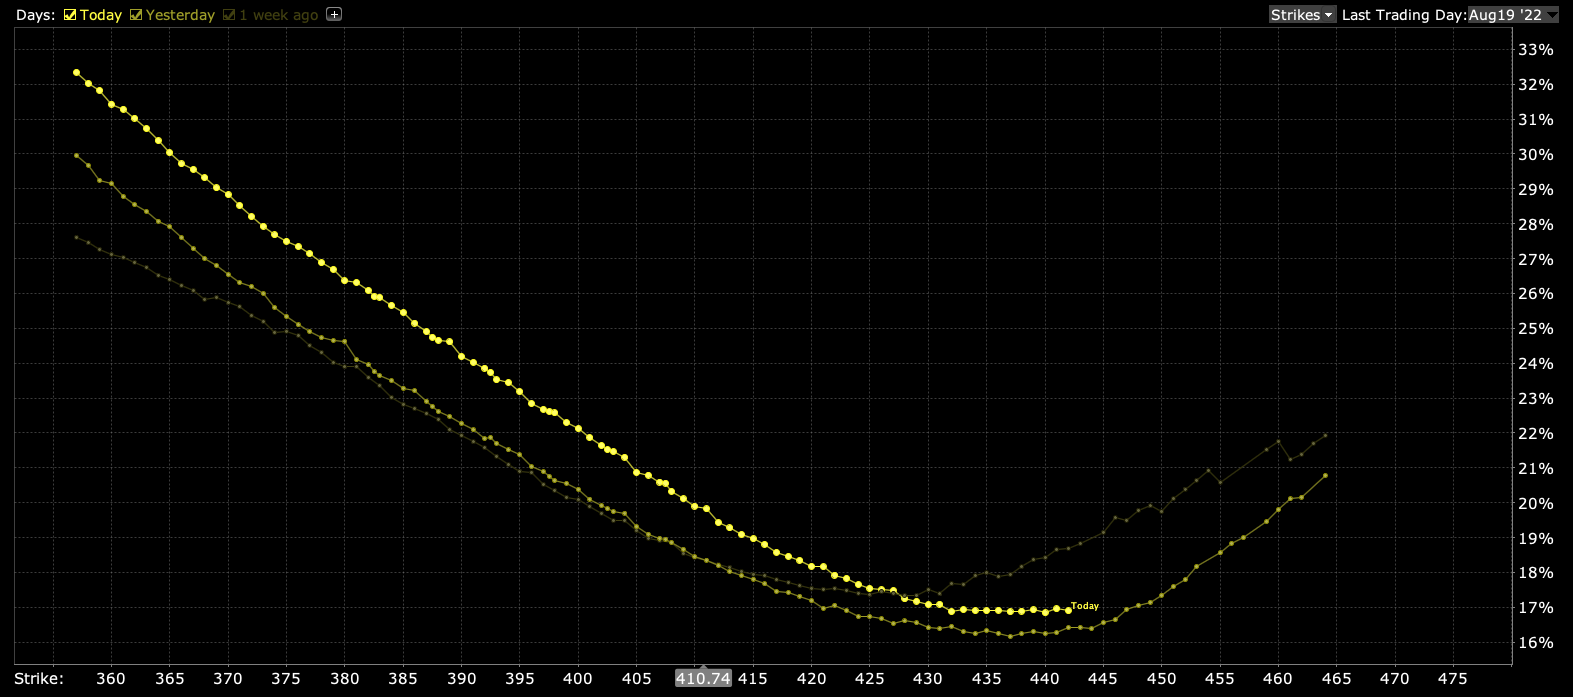
Graphic: Updated 8/3/2022. Time-lapse skew on the S&P 500 (INDEX: SPX) for Tuesday, Monday, and one week ago. Retrieved from Interactive Brokers Group Inc’s (NASDAQ: IBKR) Trader Workstation.

According to SpotGamma, “data suggests markets have entered into a period of normalization” and “IVOL likely reached a lower bound (see the bid skew).”

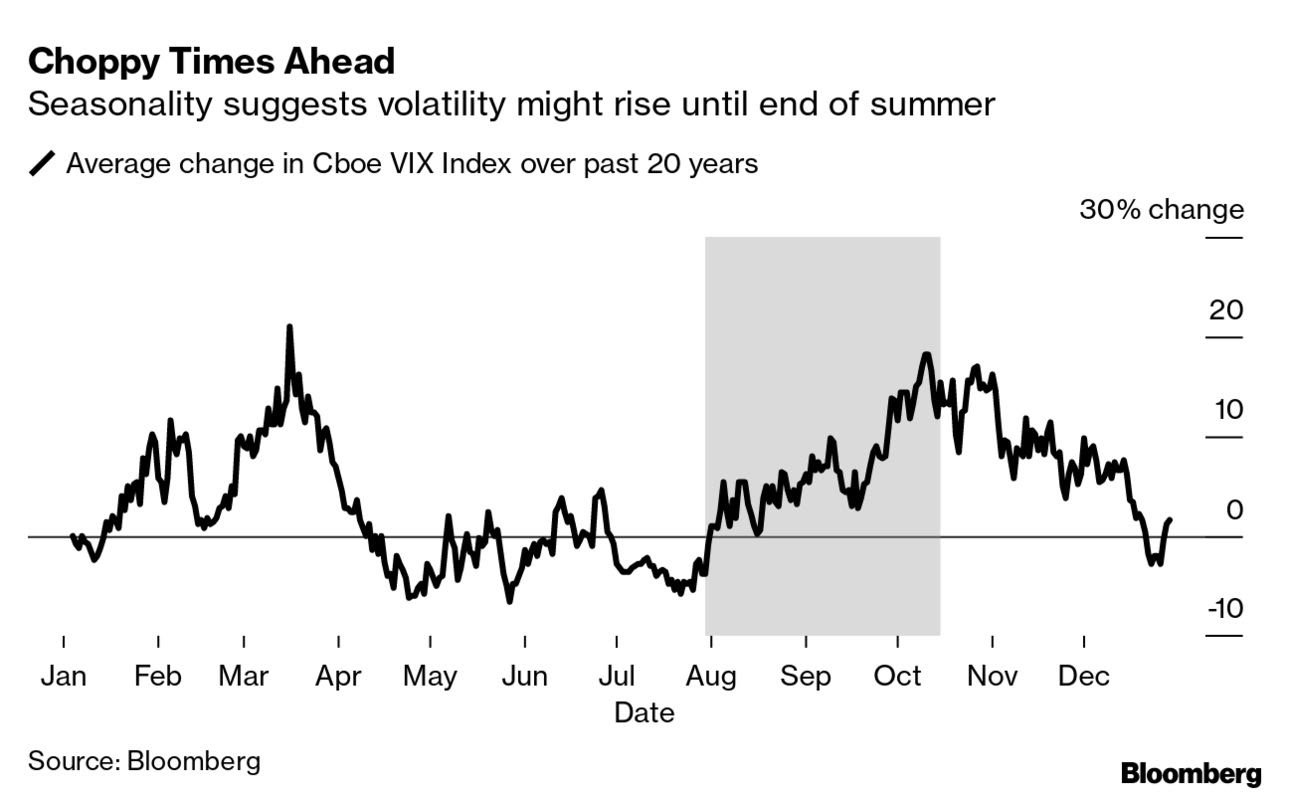
Graphic: Retrieved from Bloomberg. “The CBOE VIX index shows price swings usually rise in the summer and early autumn, and the S&P 500 is now entering its period of the worst historical returns over the past 25 years.”

“To maintain a risk-on (rally) environment, traders would need to position themselves into call options, now, further up in price, farther out in time, which they seem to be doing, albeit in not overly significant quantities.”

Notwithstanding, as SpotGamma adds, “with participants getting rid of commodity inflation and long volatility hedges that performed poorly, [this] (1) leaves equity markets more susceptible to the whims of potentially negative underlying macro forces and (2) leaves volatility markets more prone to jumps.”

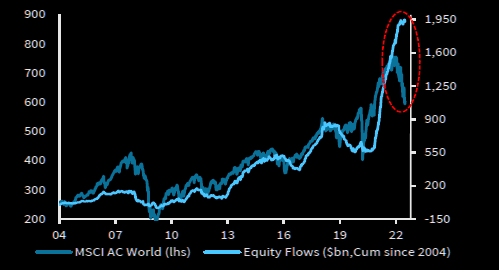
Thus far, it’s the case that we’re far more than halfway through a dot-com type collapse that’s happened “underneath the surface of the indices,” per Simplify Asset Management’s Mike Green. Should those strong passive flows falter, that likely takes from some of the support in the largest of index constituents.

Graphic: Retrieved from The Market Ear. Via Barclays PLC (NYSE: BCS).

Were the latter to happen, you’d want protection in the form of structures that would enable you to monetize on some sort-of non-linear repricing in volatility (e.g., butterflies and back spreads), should participants seek protection in a way they haven’t this year.

If nothing were to happen, the bid in skew would, at least, assist those structures in maintaining their value better, essentially.

Technical

As of 7:00 AM ET, Thursday’s regular session (9:30 AM – 4:00 PM ET), in the S&P 500, is likely to open in the upper part of a positively skewed overnight inventory, just inside of prior-range and -value, suggesting a limited potential for immediate directional opportunity.

In the best case, the S&P 500 trades higher.

Any activity above the $4,153.25 HVNode puts into play the $4,189.25 LVNode. Initiative trade beyond the LVNode could reach as high as the $4,227.75 HVNode and $4,259.75 LVNode, or higher.

In the worst case, the S&P 500 trades lower.

Any activity below the $4,153.25 HVNode puts into play the $4,117.75 MCPOC. Initiative trade beyond the MCPOC could reach as low as the $4,073.00 VPOC and $4,040.75 HVNode, or lower.

Click here to load today’s key levels into the web-based TradingView charting platform. Note that all levels are derived using the 65-minute timeframe. New links are produced, daily.
Graphic: 65-minute profile chart of the Micro E-mini S&P 500 Futures.

Considerations: Responsiveness near key-technical areas (that are discernable visually on a chart), suggests technically-driven traders with short time horizons are very active. 

Such traders often lack the wherewithal to defend retests and, additionally, the type of trade may be indicative of the other time frame participants waiting for more information to initiate trades.

Definitions

Volume Areas: A structurally sound market will build on areas of high volume (HVNodes). Should the market trend for long periods of time, it will lack sound structure, identified as low volume areas (LVNodes). LVNodes denote directional conviction and ought to offer support on any test. 

If participants were to auction and find acceptance into areas of prior low volume (LVNodes), then future discovery ought to be volatile and quick as participants look to HVNodes for favorable entry or exit.

POCs: POCs are valuable as they denote areas where two-sided trade was most prevalent in a prior day session. Participants will respond to future tests of value as they offer favorable entry and exit.

MCPOCs: POCs are valuable as they denote areas where two-sided trade was most prevalent over numerous day sessions. Participants will respond to future tests of value as they offer favorable entry and exit.

Volume-Weighted Average Prices (VWAPs): A metric highly regarded by chief investment officers, among other participants, for quality of trade. Additionally, liquidity algorithms are benchmarked and programmed to buy and sell around VWAPs.

About

After years of self-education, strategy development, mentorship, and trial-and-error, Renato Leonard Capelj began trading full-time and founded Physik Invest to detail his methods, research, and performance in the markets.

Capelj also develops insights around impactful options market dynamics at SpotGamma and is a Benzinga reporter.

Some of his works include conversations with ARK Invest’s Catherine Wood, investors Kevin O’Leary and John Chambers, FTX’s Sam Bankman-Fried, ex-Bridgewater Associate Andy Constan, Kai Volatility’s Cem Karsan, The Ambrus Group’s Kris Sidial, among many others.

Disclaimer

In no way should the materials herein be construed as advice. Derivatives carry a substantial risk of loss. All content is for informational purposes only.

Categories
Commentary

Daily Brief For August 3, 2022

The daily brief is a free glimpse into the prevailing fundamental and technical drivers of U.S. equity market products. Join the 700+ that read this report daily, below!

Graphic updated 9:15 AM ET. Sentiment Neutral if expected /ES open is inside of the prior day’s range. /ES levels are derived from the profile graphic at the bottom of the following section. Levels may have changed since initially quoted; click here for the latest levels. SqueezeMetrics Dark Pool Index (DIX) and Gamma (GEX) calculations are based on where the prior day’s reading falls with respect to the MAX and MIN of all occurrences available. A higher DIX is bullish. At the same time, the lower the GEX, the more (expected) volatility. Learn the implications of volatility, direction, and moneyness. Breadth reflects a reading of the prior day’s NYSE Advance/Decline indicator. VIX reflects a current reading of the CBOE Volatility Index (INDEX: VIX) from 0-100.

Fundamental

Our August 1 letter assessed, mainly, the impacts of a burgeoning economic war that is hot as well put by a recent note authored by Credit Suisse Group AG’s (NYSE: CS) Zoltan Pozsar.

Read: Dr. Pippa Malmgren’s “A Hot War In Cold Places,” which was quoted by Credit Suisse’s Pozsar. Additionally, check out our archives for more analysis of Malmgren’s perspectives.

“Great powers are waging hot wars involving the flow of technologies, goods, and commodities,” the big “contributors to inflation,” a longer-lasting structural issue, Pozar puts forth.

Further, it is the case that “the pillars of the low inflation world are changing,” and geopolitics are the factors bolstering longer-lasting uncertainty and risk premia.

What was the case, before?

Previously, central bankers were waging wars “against deflationary impulses coming from the globalization of cheap resources (labor, goods, and commodities),” which we covered before.

Now, central bankers have a more difficult task stemming inflationary impulses coming from a complex and non-linear economic war between the U.S., China, and Russia that will do more, long-term, to “weaken the pillars of the globalized, low inflation world.”

So: 

  • Deflation, on globalization (and outward supply shifts), was fought with asset price inflation. 
  • Inflation, on de-globalization (and inward supply shifts), is fought with asset price deflation.

Exacerbating the de-globalization pulse on popular sovereignty, which I had the honor of talking on with Andy Constan, recently, are “wealth gains sapping labor force participation” and trends such as ESG, among other things. 

“It’s a mess: it’s easier to deal with the politics of wage setting than it is to ‘grow’ people – even in The Matrix, that’s possible only over time. Until then, we are stuck with a labor shortage, and President Biden’s top labor lawyer is the anti-Reagan: she’s encouraging the unionization of workers from Amazon to Starbucks…as opposed to firing them,” Pozsar explains.

For context, among the factors that helped Chairman Volcker stem inflation were new energy investment and the weakening of unions.

Accordingly, in a move from “generating demand structurally to soak up an excess supply of cheap stuff, to curbing demand structurally to adjust to shortages,” the prevailing tightening effort is not cyclical, as in corresponding to a business cycle. It’s structural.

It requires the sharp, “inward shift of supply curves across multiple fronts (labor, goods, and commodities),” putting the economy on an “L”-shaped path (i.e., a vertical drop in activity via recession, and flatline for a period of time as rates remain higher for longer to prevent a sharp rise in inflation, again).

Market participants, because of this, should be thinking about how deep (i.e., long-lasting) a recession is needed to curb inflation (rather than if a recession will happen at all); necessary is the purge of the “Super Size Me” mentality, Pozsar explains, and slow “interest-rate sensitive parts of the economy (housing and durables),” as well as reduce “demand for labor in services, … a function of the level of wealth across a range of assets (housing, stocks, as well as crypto).

“[W]hat the Fed is telling us when it flat-out dismisses two-quarters of negative GDP growth is that it isn’t focusing as much on the rate-sensitive parts of the economy as it did in the past,” Pozsar well summarizes, adding that 5-6% rates are not out of the realm of possibilities.

“Instead, it is focusing much more on the services economy and the labor market, which still remain strong. And therein lies the cautionary tale for the market.”

Looking out further in time, after inflation has been stemmed, the question is how the economy accelerates, again, and achieves stable growth. That depends on the West developing its own supply of things so “that ‘L’ becomes ‘L/’ and … that recovery [will be driven by] fiscally funded industrial policy.”

Graphic: Retrieved from Bloomberg. “Interest rates may be kept high for a while to ensure that rate cuts won’t cause an economic rebound (an ‘L’ and not a ‘V’), which might trigger a renewed bout of inflation,” Pozsar wrote in his note. “The risks are such that Powell will try his very best to curb inflation, even at the cost of a ‘depression’ and not getting reappointed.”

Positioning

Regarding the topic of liquidity – money available for circulation – which was discussed in-depth Tuesday, August 2, below is an updated chart of our Liquidity Tracker. Conditions are mostly unchanged.

Graphic: Via Physik Invest. Data compiled by @jkonopas623. Fed Balance Sheet data, here. Treasury General Account Data, here. Reverse Repo data, here. NL = BS – TGA – RRP.

Moreover, in terms of options-related positioning, as of 8:50 AM ET, Wednesday’s expected volatility, via the Cboe Volatility Index (INDEX: VIX), sits at ~1.21%. Net gamma exposures increasing may promote tighter ranges.

Given where realized (RVOL) and implied (IVOL) volatility measures are, as well as skew, it is beneficial to be a buyer of complex options structures (e.g., put back spread).

The reason why? 

Well, as discussed in-depth Tuesday, prevailing policy narratives are likely to bolster risk premia “everywhere else,” and that does more to support our recent positioning analyses and the case for an “untethering” in equity implied volatility (IVOL), “one of the most supportive things into the decline,” per statements by Kai Volatility’s Cem Karsan.

Basically, given the macro risk, IVOL is likely at a lower bound (as validated by the S&P 500 trading higher and downside skew holding a bid) and, per The Ambrus Group’s Kris Sidial, “if you wanted to go out and hedge, the opportunity is still there in the equity space.”

Through downside protection (e.g., butterfly and back spreads) you can position yourself to monetize on the sort-of non-linear repricing in volatility we’re alluding there is potential for. The bid in skew is helping those structures maintain their value better, essentially.

Graphic: Time-lapse skew on the S&P 500 (INDEX: SPX) for Tuesday, Monday, and one week ago. Retrieved from Interactive Brokers Group Inc’s (NASDAQ: IBKR) Trader Workstation.

Technical

As of 6:30 AM ET, Tuesday’s regular session (9:30 AM – 4:00 PM ET), in the S&P 500, is likely to open in the upper part of a positively skewed overnight inventory, inside of prior-range and -value, suggesting a limited potential for immediate directional opportunity.

In the best case, the S&P 500 trades higher.

Any activity above the $4,117.75 MCPOC puts into play the $4,149.00 VPOC. Initiative trade beyond the VPOC could reach as high as the $4,164.25 RTH High and $4,189.25 LVNode, or higher.

In the worst case, the S&P 500 trades lower.

Any activity below the $4,117.75 MCPOC puts into play the $4,073.00 VPOC. Initiative trade beyond the VPOC could reach as low as the $4,040.75 and $4,015.25 HVNodes, or lower.

Click here to load today’s key levels into the web-based TradingView charting platform. Note that all levels are derived using the 65-minute timeframe. New links are produced, daily.
Graphic: 65-minute profile chart of the Micro E-mini S&P 500 Futures.

Definitions

Volume Areas: A structurally sound market will build on areas of high volume (HVNodes). Should the market trend for long periods of time, it will lack sound structure, identified as low volume areas (LVNodes). LVNodes denote directional conviction and ought to offer support on any test. 

If participants were to auction and find acceptance into areas of prior low volume (LVNodes), then future discovery ought to be volatile and quick as participants look to HVNodes for favorable entry or exit.

POCs: POCs are valuable as they denote areas where two-sided trade was most prevalent in a prior day session. Participants will respond to future tests of value as they offer favorable entry and exit.

MCPOCs: POCs are valuable as they denote areas where two-sided trade was most prevalent over numerous day sessions. Participants will respond to future tests of value as they offer favorable entry and exit.

Volume-Weighted Average Prices (VWAPs): A metric highly regarded by chief investment officers, among other participants, for quality of trade. Additionally, liquidity algorithms are benchmarked and programmed to buy and sell around VWAPs.

About

After years of self-education, strategy development, mentorship, and trial-and-error, Renato Leonard Capelj began trading full-time and founded Physik Invest to detail his methods, research, and performance in the markets.

Capelj also develops insights around impactful options market dynamics at SpotGamma and is a Benzinga reporter.

Some of his works include conversations with ARK Invest’s Catherine Wood, investors Kevin O’Leary and John Chambers, FTX’s Sam Bankman-Fried, ex-Bridgewater Associate Andy Constan, Kai Volatility’s Cem Karsan, The Ambrus Group’s Kris Sidial, among many others.

Disclaimer

In no way should the materials herein be construed as advice. Derivatives carry a substantial risk of loss. All content is for informational purposes only.

Categories
Commentary

Daily Brief For August 2, 2022

The daily brief is a free glimpse into the prevailing fundamental and technical drivers of U.S. equity market products. Join the 700+ that read this report daily, below!

Graphic updated 6:30 AM ET. Sentiment Risk-Off if expected /ES open is below the prior day’s range. /ES levels are derived from the profile graphic at the bottom of the following section. Levels may have changed since initially quoted; click here for the latest levels. SqueezeMetrics Dark Pool Index (DIX) and Gamma (GEX) calculations are based on where the prior day’s reading falls with respect to the MAX and MIN of all occurrences available. A higher DIX is bullish. At the same time, the lower the GEX, the more (expected) volatility. Learn the implications of volatility, direction, and moneyness. Breadth reflects a reading of the prior day’s NYSE Advance/Decline indicator. VIX reflects a current reading of the CBOE Volatility Index (INDEX: VIX) from 0-100.

Fundamental

The U.S. Treasury upped its borrowing estimate by $262 billion as federal revenue projections shifted.

Here’s why this matters.

Per Damped Spring’s Andy Constan, on an “overwhelming high issuance in Q1,” markets sold, and on “light issuance, once QT start[ed], plus some crazy tax receipts in Q3,” markets rallied.

With the Treasury’s debt managers seeking to borrow more than $400 billion through September, compared to the original estimate of $180 billion or so, anticipated is added borrowing through new marketable debt issuances.

“This is the reason I dumped my long equities after 3:00 when the news hit,” Constan added.

Overall, this news is important because it has an impact on the money available for circulation.

To explain, after the Federal Reserve (Fed) bean upping the size of its balance sheet (BS) in an unprecedented way in 2020, the deployment of this money – liquidity – boosted risk-asset prices and the cost of living.

We can measure the availability of this liquidity, as well showcased by Max Anderson, online. 

Graphic: Via Physik Invest. Data compiled by @jkonopas623. Fed Balance Sheet data, here. Treasury General Account Data, here. Reverse Repo data, here. NL = BS – TGA – RRP.

So, what’s going on, now?

To rein inflation, and undo some of its intervention, the Treasury issued fewer short-dated T-bills, and the Fed raised rates on Reverso Repo (RRP), “the next best low-duration-risk alternative.”

This has sucked over $2 trillion out of the economy, “six times more than ever done before.”

That said, unlike in the past, however, “relative changes in [the] Treasury General Account (TGA) and RRP” are way bigger than changes in the size of the BS. 

As a result, the game changes. 

The “changes in TGA and RRP have taken over as the primary drivers [of] Net Liquidity,” the money available to circulate in the economy. “[S]ince 2020, the Treasury and Reverse Repo [control] that. Not the size of Fed’s balance sheet.”

That’s per the tight correlation between Net Liquidity and the S&P 500. Offsetting the two by two weeks (i.e., using the path of Net Liquidity to forecast the path of the S&P 500 by two weeks in advance) reveals a tight correlation.

As Anderson puts it, “when there’s a change in Liquidity, it takes two weeks to propagate out into the economy and impact asset prices. And that change in Liquidity predicts next two week’s change in asset prices with 95% correlation.”

See a file containing the data and charts, here. We’ll work to improve the charts in subsequent letters.
Graphic: Via Physik Invest. Data compiled by @jkonopas623. Fed Balance Sheet data, here. Treasury General Account Data, here. Reverse Repo data, here. NL = BS – TGA – RRP.

Positioning

As of 6:30 AM ET, Tuesday’s expected volatility, via the Cboe Volatility Index (INDEX: VIX), sits at ~1.29%. Net gamma exposures increasing may promote tighter ranges.

Given where realized (RVOL) and implied (IVOL) volatility measures are, as well as skew, it is beneficial to be a buyer of complex options structures (e.g., back spreads).

The reason why? 

Pursuant to our comments on monetary policymakers ditching forward guidance, which, per the Macro Compass’ Alfonso Peccatiello leaves “no anchor for bond markets, … and higher volatility,” bolsters risk premia “everywhere else.”

As stated Monday, this does more to support our recent positioning analyses and the case for an “untethering” in equity IVOL, “one of the most supportive things into the decline,” per statements by Kai Volatility’s Cem Karsan.

Here’s some context.

As well explained in the Daily Brief for July 21, 2022, heading into the 2022 decline, institutions repositioned and hedged, even allocating to “commodity trend following,” per our Daily Brief for July 15, 2022, which worked well the first two quarters.

The monetization and counterparty hedging of existing customer hedges, as well as the sale of short-dated volatility, particularly in some of the single names where there was “rich” volatility, into the fall, lent to lackluster performance in IVOL and index mean reversion.

This trend is coming to an end as entities are squeezed out of trades that aren’t working (i.e., participants rotate out of volatility and commodities).

Per Karsan, as “volatility itself, on the equity side, becomes less and less hedged on the customer level, … [the] market can really begin to respond to the core macro factors.”

Should markets experience a shock (e.g., China and U.S. tensions escalate), the new demand for hedges may result in an “untethering” in IVOL, which was “one of the most supportive things into the decline,” Karsan said, adding that now is the best time to rotate into call options which are outperforming “their delta to the upside.”

Accordingly, given the macro risk, IVOL is likely at a lower bound (as validated by the S&P 500 trading higher and downside skew holding a bid) and, per The Ambrus Group’s Kris Sidial, “if you wanted to go out and hedge, the opportunity is still there in the equity space.”

Through downside protection (e.g., butterfly and back spreads) you can position yourself to monetize on the sort-of non-linear repricing in volatility we’re alluding there is potential for. The bid in skew is helping those structures maintain their value better, essentially.

Graphic: Time-lapse skew on the S&P 500 (INDEX: SPX) for Monday, Friday, and one week ago. Retrieved from Interactive Brokers Group Inc’s (NASDAQ: IBKR) Trader Workstation.

Technical

As of 6:30 AM ET, Tuesday’s regular session (9:30 AM – 4:00 PM ET), in the S&P 500, is likely to open in the lower part of a negatively skewed overnight inventory, outside of prior-range and -value, suggesting a potential for immediate directional opportunity.

In the best case, the S&P 500 trades higher.

Any activity above the $4,117.75 MCPOC puts into play the $4,149.00 VPOC. Initiative trade beyond the VPOC could reach as high as the $4,164.25 RTH High and $4,189.25 LVNode, or higher.

In the worst case, the S&P 500 trades lower.

Any activity below the $4,117.75 MCPOC puts into play the $4,073.00 VPOC. Initiative trade beyond the VPOC could reach as low as the $4,040.75 and $4,015.25 HVNodes, or lower.

Click here to load today’s key levels into the web-based TradingView charting platform. Note that all levels are derived using the 65-minute timeframe. New links are produced, daily.
Graphic: 65-minute profile chart of the Micro E-mini S&P 500 Futures.

Definitions

Volume Areas: A structurally sound market will build on areas of high volume (HVNodes). Should the market trend for long periods of time, it will lack sound structure, identified as low volume areas (LVNodes). LVNodes denote directional conviction and ought to offer support on any test. 

If participants were to auction and find acceptance into areas of prior low volume (LVNodes), then future discovery ought to be volatile and quick as participants look to HVNodes for favorable entry or exit.

POCs: POCs are valuable as they denote areas where two-sided trade was most prevalent in a prior day session. Participants will respond to future tests of value as they offer favorable entry and exit.

MCPOCs: POCs are valuable as they denote areas where two-sided trade was most prevalent over numerous day sessions. Participants will respond to future tests of value as they offer favorable entry and exit.

Volume-Weighted Average Prices (VWAPs): A metric highly regarded by chief investment officers, among other participants, for quality of trade. Additionally, liquidity algorithms are benchmarked and programmed to buy and sell around VWAPs.

About

After years of self-education, strategy development, mentorship, and trial-and-error, Renato Leonard Capelj began trading full-time and founded Physik Invest to detail his methods, research, and performance in the markets.

Capelj also develops insights around impactful options market dynamics at SpotGamma and is a Benzinga reporter.

Some of his works include conversations with ARK Invest’s Catherine Wood, investors Kevin O’Leary and John Chambers, FTX’s Sam Bankman-Fried, ex-Bridgewater Associate Andy Constan, Kai Volatility’s Cem Karsan, The Ambrus Group’s Kris Sidial, among many others.

Disclaimer

In no way should the materials herein be construed as advice. Derivatives carry a substantial risk of loss. All content is for informational purposes only.

Categories
Commentary

Daily Brief For July 29, 2022

The daily brief is a free glimpse into the prevailing fundamental and technical drivers of U.S. equity market products. Join the 600+ that read this report daily, below!

Graphic updated 6:30 AM ET. Sentiment Neutral if expected /ES open is inside of the prior day’s range. /ES levels are derived from the profile graphic at the bottom of the following section. Levels may have changed since initially quoted; click here for the latest levels. SqueezeMetrics Dark Pool Index (DIX) and Gamma (GEX) calculations are based on where the prior day’s reading falls with respect to the MAX and MIN of all occurrences available. A higher DIX is bullish. At the same time, the lower the GEX, the more (expected) volatility. Learn the implications of volatility, direction, and moneyness. Breadth reflects a reading of the prior day’s NYSE Advance/Decline indicator. VIX reflects a current reading of the CBOE Volatility Index (INDEX: VIX) from 0-100.
Updates: Hey, team! I’m offering some updates on the letter and gauging your thoughts, if any.

Been incredibly busy juggling what is, basically, 3 jobs. Here’s a bit about me, if interested. That said, my attention has been elsewhere, to put it simply, so the letters have taken a bit of a hit. Sorry!

The few options I’ve been faced with include (1) lowering the frequency of letters to improve quality and/or (2) continuing pace but increasing simplicity for some time.

I’m aware that many rely on the key levels I provide, daily, as well as some of the narratives and trade ideas often included in the positioning section. Therefore, I’m soliciting feedback and will follow through with the consensus, if any. Have a great weekend!

Fundamental

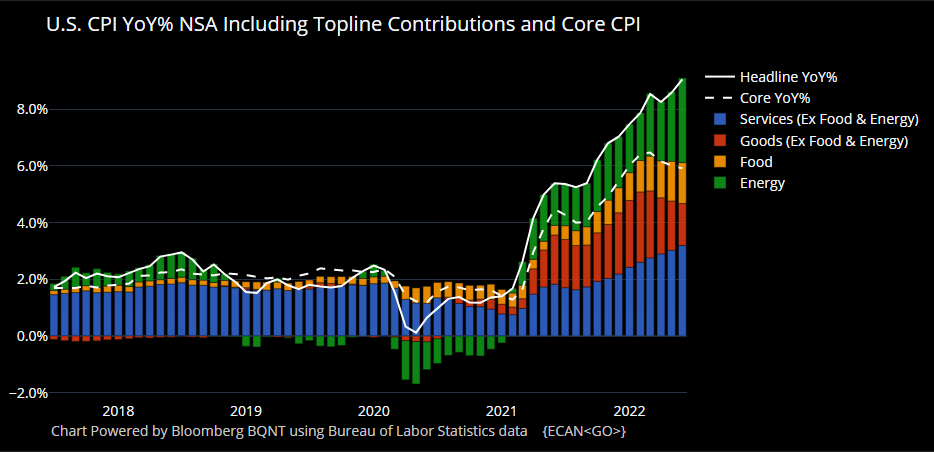
The Fed’s preferred inflation measure – the personal consumption expenditure deflator (PCE) – is set to update. Per Bloomberg, this measure grew an annualized 7.1% for the second quarter. 

This is on the heels of the Federal Reserve’s (Fed) interest rate hike aimed at reining inflation, as well as data that suggests the “drumbeat of recession” growing louder.

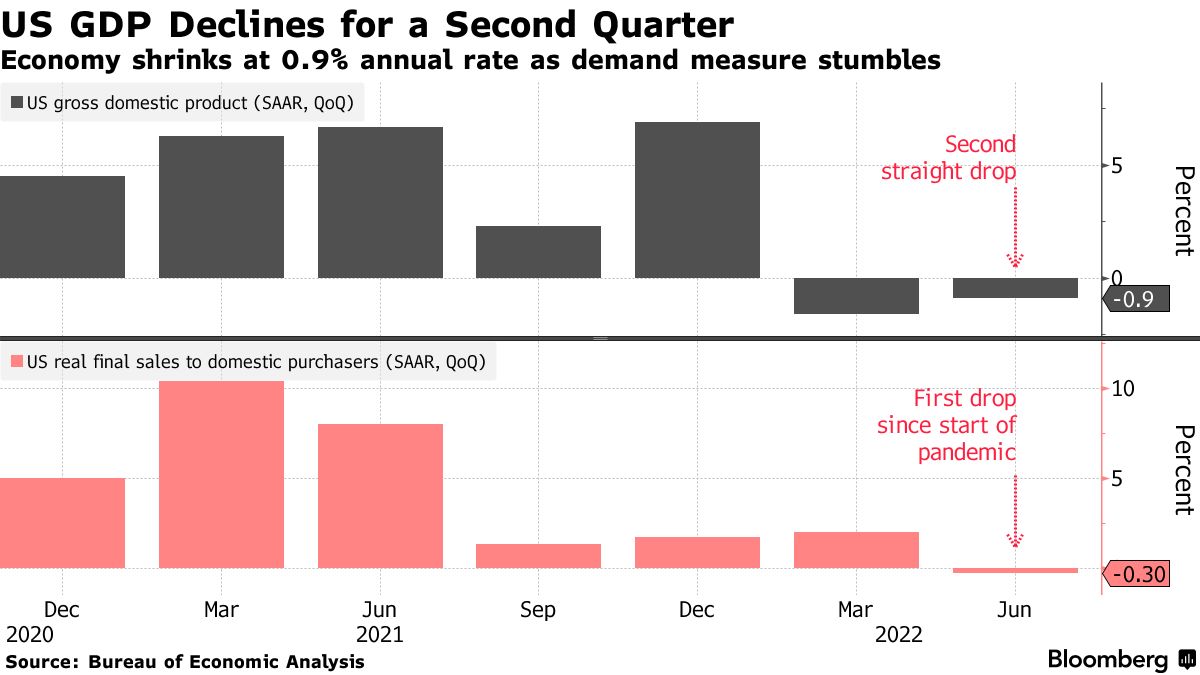
Graphic: Retrieved from Bloomberg. “GDP fell at a 0.9% annualized rate after a 1.6% decline in the first three months of the year []. Personal consumption, the biggest part of the economy, rose at a 1% pace, a deceleration from the prior period.”

Yelena Shulyatyeva and Eliza Winger, economists cited by Bloomberg, comment that the fall in GDP growth “raises the risk that the economy will fall into recession by year-end.”

However, based on the research and expert commentary set forth in past letters, the case is the economy may already be in recession.

Notwithstanding, what’s the impact on equity markets (i.e., now earnings compression)?

It’s the consensus that equity markets endured one of the sharpest de-rates in three decades as participants priced the compression in multiples on the rise in interest rates and flow of capital to capital markets – the quantitative tightening (QT) – component.

For context, beyond raising costs to borrow and innovate, higher interest rates may mean future discounted valuations are lower. Additionally, yield-hungry investors may seek less risky assets, now, given that their yields are more attractive.

Recall that in engaging in practices such as quantitative easing (QE), central banking authorities purchase assets from private sector entities through the creation of central bank reserves. The unwind of this through the QT exercise removes reserves from balance sheets either through asset sales or non-reinvestment of the principal sum of maturing securities.

In less complex terms, the Fed’s purchase of assets depressed their yields forcing investors into risk. Liquidity withdrawal ought to have the opposite effect, amplifying the impact of rate hikes.

Adding, per Joseph Wang, who we’ve quoted in the past, with bank deposits expected to drain ~1T by year-end, the competition for cash forces investors to continue “lower[ing] their selling prices to compete for the cash they want.”

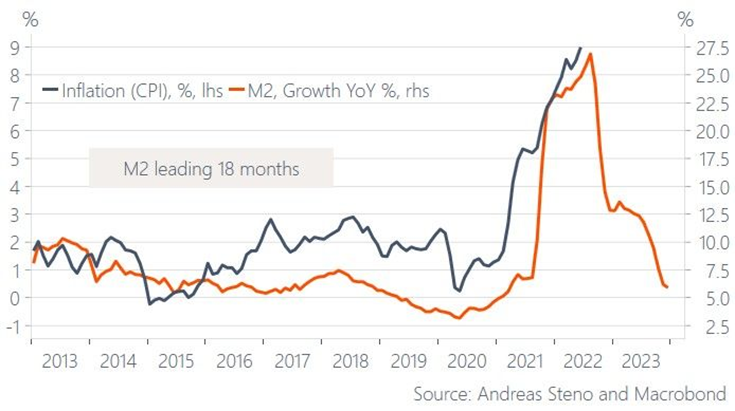
Accordingly, the “Fed will continue to hike interest rates until something breaks,” as explained by Andreas Steno Larsen. In ending forward guidance, “the Fed will rely even more on lagging indicators such as the unemployment rate and the monthly CPI report.”

Graphic: Retrieved from Andreas Steno Larsen. “Most leading indicators for inflation point (seriously) down, while early unemployment indicators are ticking up, but the Fed will not admit to it until risk assets have taken another beating.”

“Once unemployment starts increasing alongside weakening momentum in the inflation reports, it will likely be at least 3-6 months too late to pivot.”

The Eurodollar – which reflects the interest offered on U.S. dollar-denominated deposits at banks outside of the U.S. (i.e., participants’ outlook on interest rates) – curve is inverted and implies rate cuts ahead, “6-7 months from now.”

Given the above, portfolios can “stay away from highly speculative assets, own USD cash, and start allocating towards 5-10y+ government bonds,” as Alfonso Peccatiello explained well.

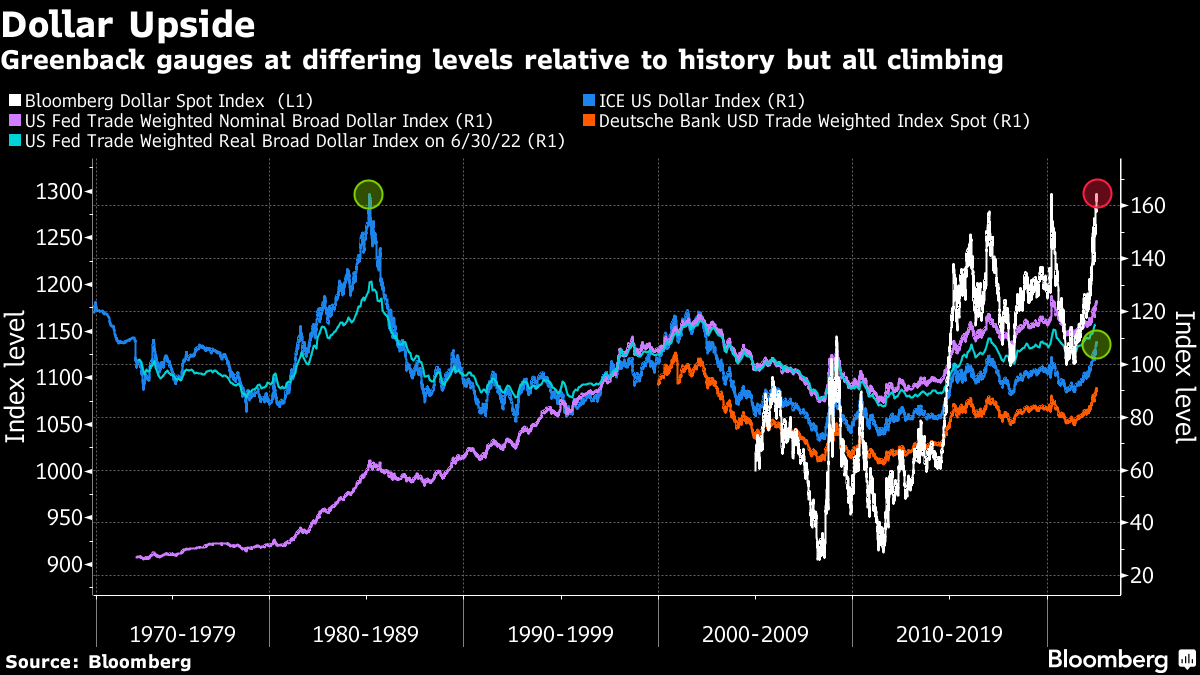
Context: A stronger dollar, on the tightening of liquidity and credit, as well as increased demand and competition for money, does more to pressure risk and, is an equity headwind. 

Additionally, per Morgan Stanley (NYSE: MS) research, "The simple math on S&P 500 earnings from currency is that for every percentage point increase on a year-on-year basis it’s [] a 0.5 hit to EPS growth.”

Positioning

For the past few sessions, we did much to unpack and understand some of the implications of participants’ market positioning.

In summation, own volatility where the market is likely to not expire. Sell it where the market is likely to expire. Just because implied (IVOL) volatility is at a high starting point does not mean it should be sold, blindly, particularly on the put side, below the market.

Read: Explanations and Applications – Moontower on Gamma.

Technical

As of 6:30 AM ET, Friday’s regular session (9:30 AM – 4:00 PM ET), in the S&P 500, is likely to open in the middle part of a balanced overnight inventory, inside of prior-range and -value, suggesting a limited potential for immediate directional opportunity.

In the best case, the S&P 500 trades higher.

Any activity above the $4,111.00 RTH High puts into play the $4,149.00 VPOC. Initiative trade beyond the $4,149.00 VPOC could reach as high as the $4,164.25 RTH High and $4,189.25 LVNode, or higher.

In the worst case, the S&P 500 trades lower.

Any activity below the $4,111.00 RTH High puts into play the $4,073.00 VPOC. Initiative trade beyond the VPOC could reach as low as the $4,041.25 and $4,015.75 HVNode, or lower.

Click here to load today’s key levels into the web-based TradingView charting platform. Note that all levels are derived using the 65-minute timeframe. New links are produced, daily.
Graphic: 65-minute profile chart of the Micro E-mini S&P 500 Futures.

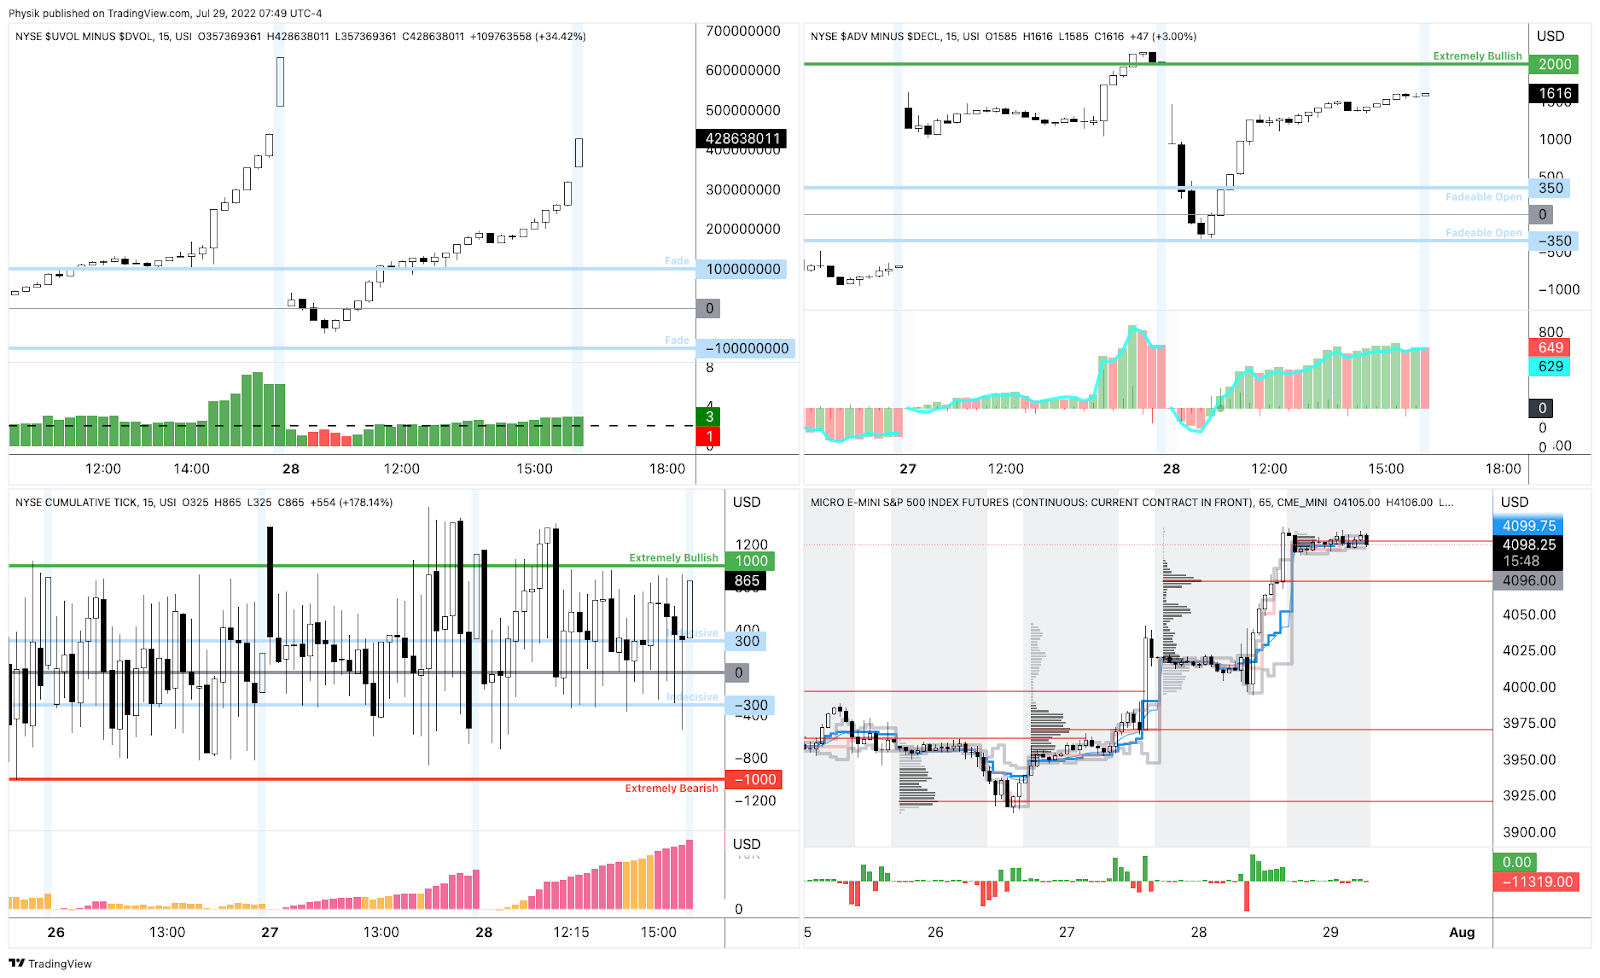
Considerations: This week’s advance was strong, based on market internals. Given this information, the rally is to not be sold, blindly.

Graphic: Market Internals (Advance/Decline, Up-Volume/Down-Volume, Tick) as Peter Reznicek at ShadowTrader teaches. Though positive, readings were weak and supportive of responsive trade, similar to what market liquidity (via Bookmap) was showing.

Definitions

Volume Areas: A structurally sound market will build on areas of high volume (HVNodes). Should the market trend for long periods of time, it will lack sound structure, identified as low volume areas (LVNodes). LVNodes denote directional conviction and ought to offer support on any test. 

If participants were to auction and find acceptance into areas of prior low volume (LVNodes), then future discovery ought to be volatile and quick as participants look to HVNodes for favorable entry or exit.

POCs: POCs are valuable as they denote areas where two-sided trade was most prevalent in a prior day session. Participants will respond to future tests of value as they offer favorable entry and exit.

MCPOCs: POCs are valuable as they denote areas where two-sided trade was most prevalent over numerous day sessions. Participants will respond to future tests of value as they offer favorable entry and exit.

Volume-Weighted Average Prices (VWAPs): A metric highly regarded by chief investment officers, among other participants, for quality of trade. Additionally, liquidity algorithms are benchmarked and programmed to buy and sell around VWAPs.

About

After years of self-education, strategy development, mentorship, and trial-and-error, Renato Leonard Capelj began trading full-time and founded Physik Invest to detail his methods, research, and performance in the markets.

Capelj also develops insights around impactful options market dynamics at SpotGamma and is a Benzinga reporter.

Some of his works include conversations with ARK Invest’s Catherine Wood, investors Kevin O’Leary and John Chambers, FTX’s Sam Bankman-Fried, ex-Bridgewater Associate Andy Constan, Kai Volatility’s Cem Karsan, The Ambrus Group’s Kris Sidial, among many others. 

Disclaimer

In no way should the materials herein be construed as advice. Derivatives carry a substantial risk of loss. All content is for informational purposes only.
Categories
Commentary

Daily Brief For July 28, 2022

The daily brief is a free glimpse into the prevailing fundamental and technical drivers of U.S. equity market products. Join the 600+ that read this report daily, below!

Graphic updated 7:00 AM ET. Sentiment Neutral if expected /ES open is inside of the prior day’s range. /ES levels are derived from the profile graphic at the bottom of the following section. Levels may have changed since initially quoted; click here for the latest levels. SqueezeMetrics Dark Pool Index (DIX) and Gamma (GEX) calculations are based on where the prior day’s reading falls with respect to the MAX and MIN of all occurrences available. A higher DIX is bullish. At the same time, the lower the GEX, the more (expected) volatility. Learn the implications of volatility, direction, and moneyness. Breadth reflects a reading of the prior day’s NYSE Advance/Decline indicator. VIX reflects a current reading of the CBOE Volatility Index (INDEX: VIX) from 0-100.

Fundamental

Key, yesterday, was the Federal Reserve’s (Fed) move to rein inflation with another 75 basis point interest rate hike. This lifted the target for the federal funds rate to 2.25-2.5%.

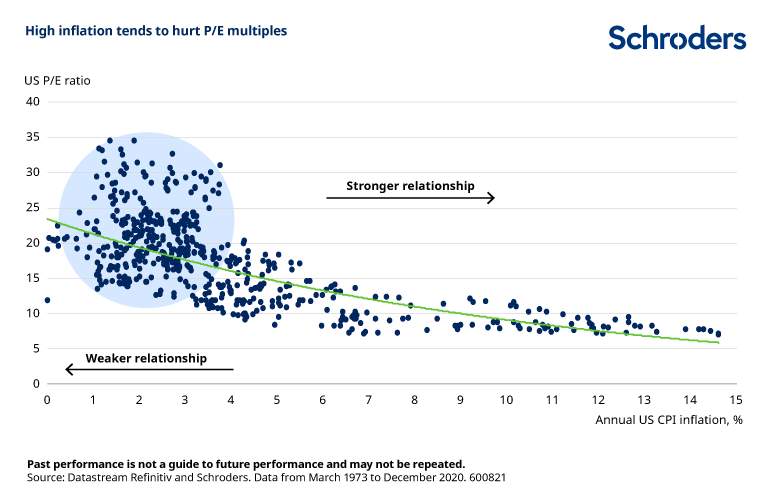
Accordingly, with inflation (which is to be dampened) a negative for stocks, a primary driver behind this year’s de-rate, already, equity markets closed sharply higher.

Graphic: Via Schroders plc (OTC: SHNWF). Taken from the Weekly S&P 500 ChartStorm.

Despite room for higher rates, the Fed explained future decisions would “depend on the data,” and that, per Bloomberg, the economy is likely “to withstand rapid monetary tightening.”

Graphic: Retrieved from Bloomberg. Tighter liquidity and credit bolster demand for money as well as the deflation of risk assets. “There used to be too little demand. Now there’s too little supply. And in a world of too little supply, the country doing the most to generate demand, which is the US, is exporting its problem—its problem being inflation,” per Harvard’s Jason Furman.

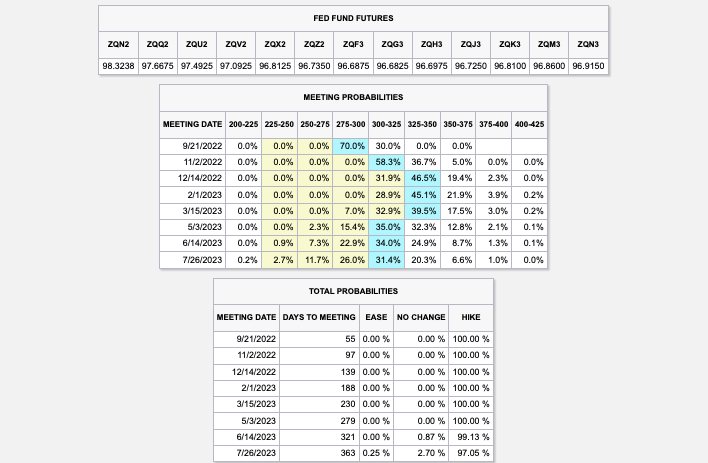
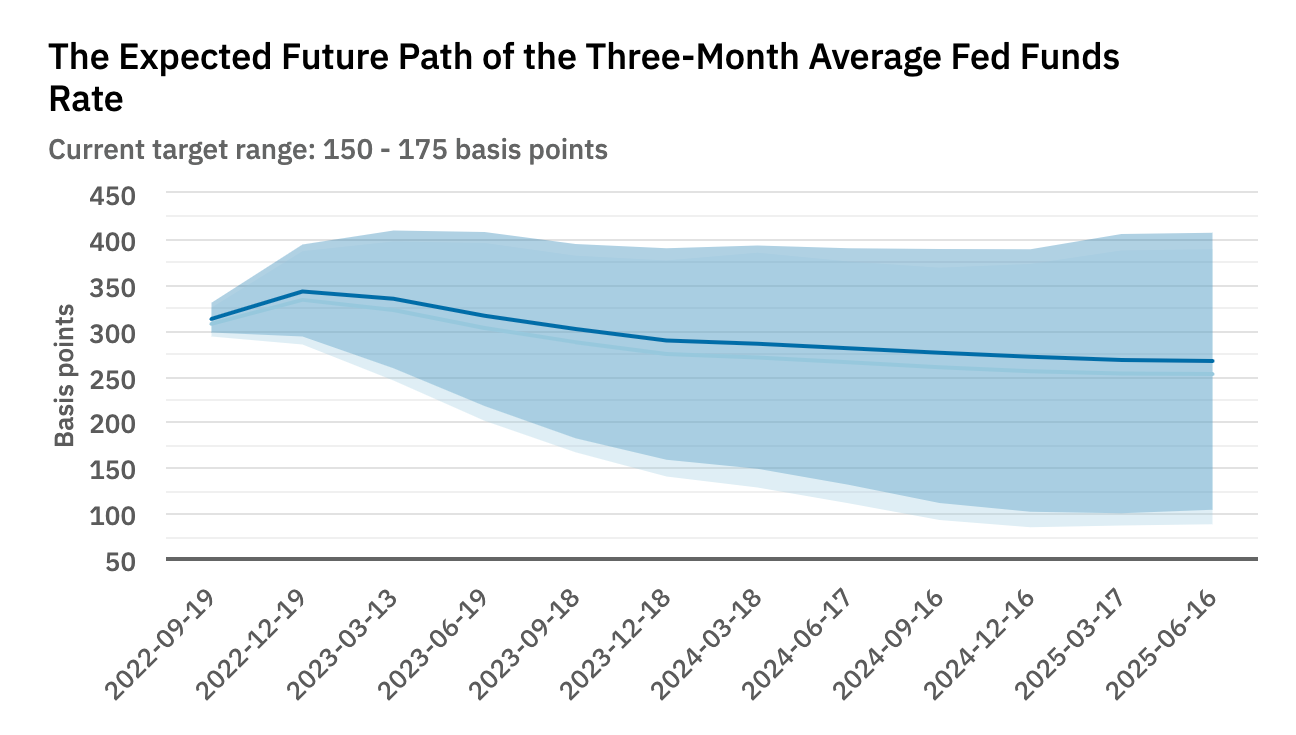
Adding, participants are, now, pricing in the potential for a federal funds rate peak in the range of 3.25-3.50% early-to-mid 2023, down from 4.00-4.75% after the last rate hike took place.

Graphic: Via CME Group Inc’s (NASDAQ: CME) FedWatch Tool.

Strategists at the likes of Bank of America Corporation (NYSE: BAC) put forth that it is likely, given an economic slowing, that the Fed, indeed, cuts rates next year and ends quantitative tightening (QT).

“The Fed is likely to stop QT with rate cuts due to the contradictory signal it sends on monetary policy and to simplify policy communications; the Fed will likely not want to be easing with rate cuts but tightening with QT,” the bank’s strategists explained. 

An end to QT would cut the supply that the “Treasury needs to issue to cover Fed redemptions. It also means the Fed may conduct secondary purchases, further limiting the amount of supply the market needs to absorb.”

This is in comparison to the narrative we discussed earlier this week, put forth by Damped Spring Advisors’ Andy Constan.

With “most of [the Fed] balance sheet reduction to be run-off” – non-reinvestment of “proceeds from maturing assets they own” – coupled with the Treasury halving “coupon issuance that the market must absorb,” Constan explained, instead, that the “Fed is done for the summer.”

This is likely to “result in less surprise and falling asset volatility” as investors realize “they are now under-risked,” which may drive a “risk premium contraction” and demand for risk assets.

Positioning

As of 6:50 AM ET, Thursday’s expected volatility, via the Cboe Volatility Index (INDEX: VIX), sits at ~1.22%. Net gamma exposures increasing may promote tighter ranges.

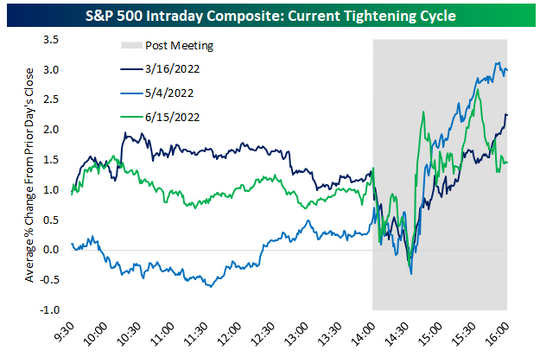
It is often, just after an event, that market movement is the result of inventory rebalances. Per Kai Volatility’s Cem Karsan, the subsequent move is to be “tied to the incremental effects on liquidity (QE/QT).” 

Graphic: Retrieved from MarketWatch.

Rising rates and the withdrawal of liquidity, coupled with the impact of inflation and an economic slowing, could prompt continued pressure on equity markets.

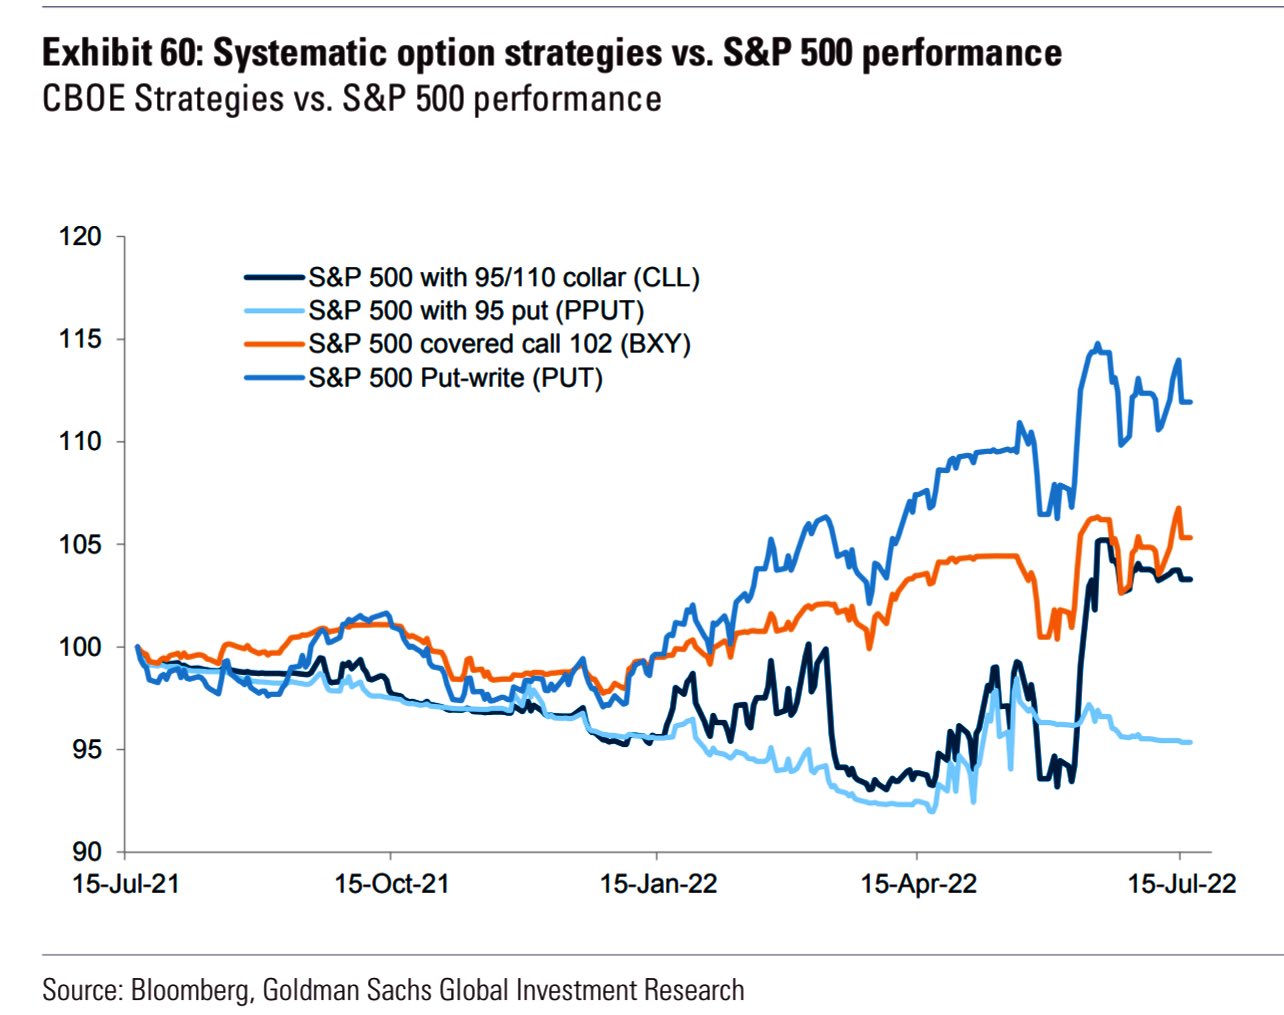
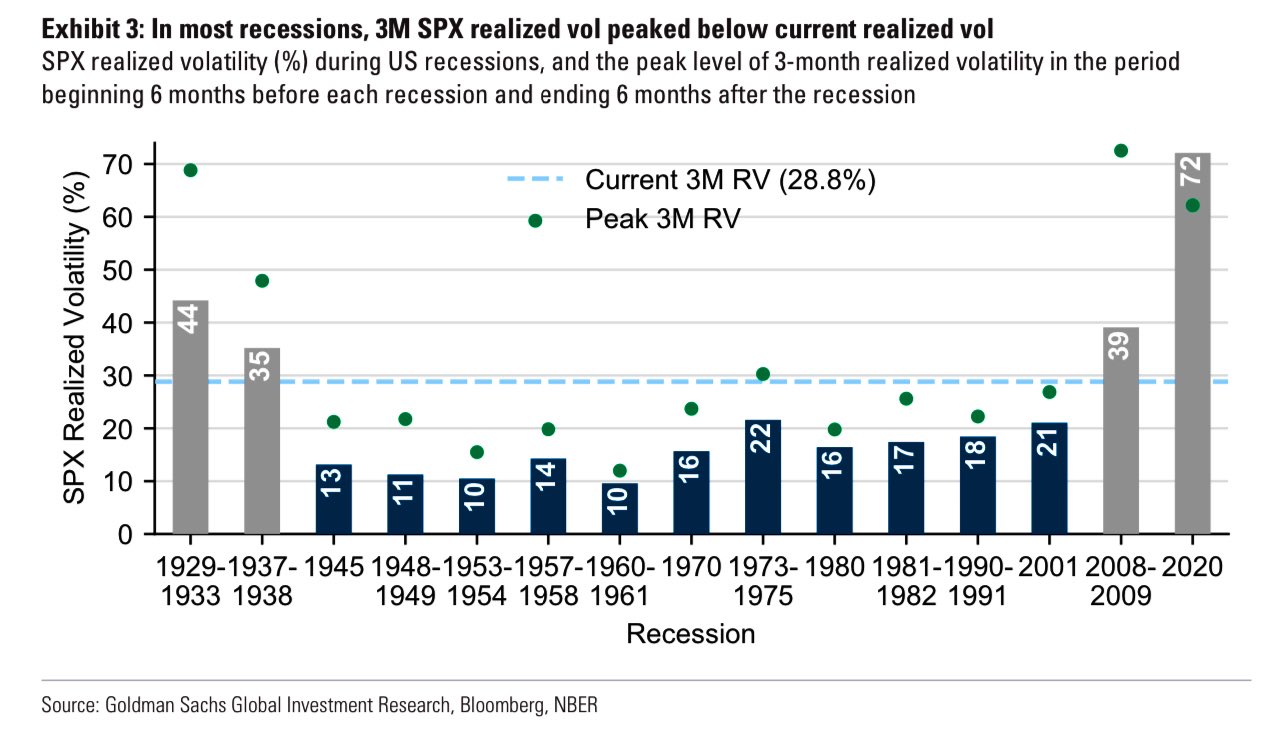
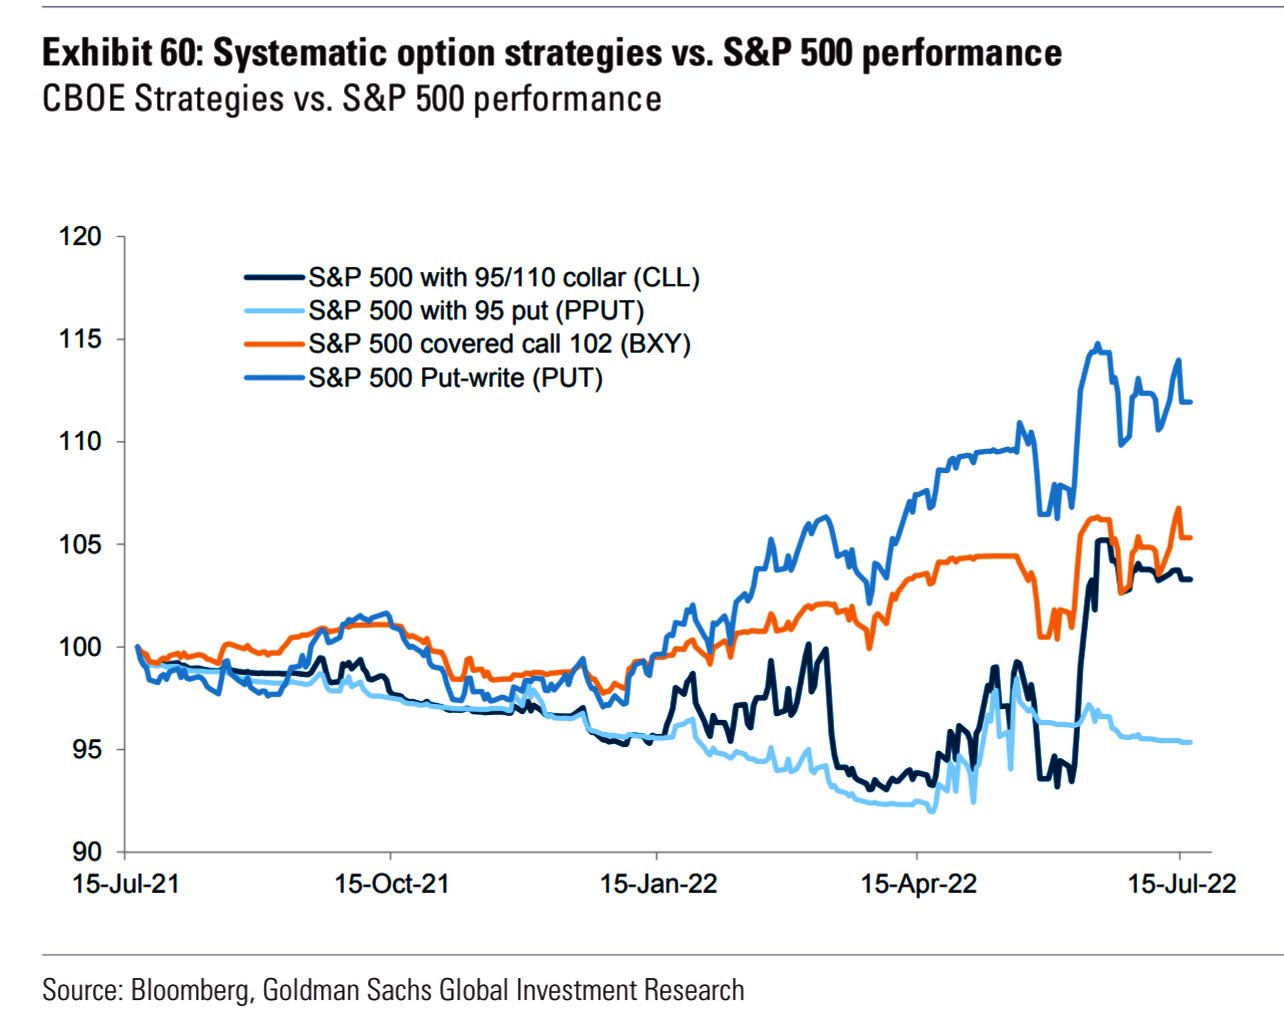
Given the macro risk, and the poor performance of implied volatility (IVOL), relative to that which markets have realized (RVOL), per The Ambrus Group’s Kris Sidial, “if you wanted to go out and hedge, the opportunity is still there in the equity space.”

Graphic: Retrieved from Goldman Sachs Group Inc (NYSE: GS).

Should investors “ditch their [old] hedges in frustration as sentiment improves, because they didn’t work properly in a falling market,” this may set up “the potential for a second-leg-down event,” in the next year, as well explained in the Systemic Individual Investor.

“During the next sell-off, panic put-buying can cause a much more violent downward spiral, because options dealers are forced to sell an increasing amount of S&P futures into an accelerating down move.”

So, what to do? 

With call options outperforming “their delta to the upside,” it continues to make much sense to replace static equity long exposure with that which is dynamic, Karsan explained.

Technical

As of 6:50 AM ET, Thursday’s regular session (9:30 AM – 4:00 PM ET), in the S&P 500, is likely to open in the middle part of a negatively skewed overnight inventory, inside of prior-range and -value, suggesting a limited potential for immediate directional opportunity.

In the best case, the S&P 500 trades higher.

Any activity above the $4,015.75 HVNode puts into play the $4,041.25 HVNode. Initiative trade beyond the $4,041.25 HVNode could reach as high as the $4,071.50 BAL and $4,095.00 VPOC, or higher.

In the worst case, the S&P 500 trades lower.

Any activity below the $4,015.75 HVNode puts into play the $3,971.00 VPOC. Initiative trade beyond the VPOC could reach as low as the $3,943.25 HVNode and $3,921.00 VPOC, or lower.

Click here to load today’s key levels into the web-based TradingView charting platform. Note that all levels are derived using the 65-minute timeframe. New links are produced, daily.
Graphic: 65-minute profile chart of the Micro E-mini S&P 500 Futures.

Definitions

Volume Areas: A structurally sound market will build on areas of high volume (HVNodes). Should the market trend for long periods of time, it will lack sound structure, identified as low volume areas (LVNodes). LVNodes denote directional conviction and ought to offer support on any test. 

If participants were to auction and find acceptance into areas of prior low volume (LVNodes), then future discovery ought to be volatile and quick as participants look to HVNodes for favorable entry or exit.

POCs: POCs are valuable as they denote areas where two-sided trade was most prevalent in a prior day session. Participants will respond to future tests of value as they offer favorable entry and exit.

MCPOCs: POCs are valuable as they denote areas where two-sided trade was most prevalent over numerous day sessions. Participants will respond to future tests of value as they offer favorable entry and exit.

Volume-Weighted Average Prices (VWAPs): A metric highly regarded by chief investment officers, among other participants, for quality of trade. Additionally, liquidity algorithms are benchmarked and programmed to buy and sell around VWAPs.

About

After years of self-education, strategy development, mentorship, and trial-and-error, Renato Leonard Capelj began trading full-time and founded Physik Invest to detail his methods, research, and performance in the markets.

Capelj also develops insights around impactful options market dynamics at SpotGamma and is a Benzinga reporter.

Some of his works include conversations with ARK Invest’s Catherine Wood, investors Kevin O’Leary and John Chambers, FTX’s Sam Bankman-Fried, ex-Bridgewater Associate Andy Constan, Kai Volatility’s Cem Karsan, The Ambrus Group’s Kris Sidial, among many others.

Disclaimer

In no way should the materials herein be construed as advice. Derivatives carry a substantial risk of loss. All content is for informational purposes only.
Categories
Commentary

Daily Brief For July 27, 2022

The daily brief is a free glimpse into the prevailing fundamental and technical drivers of U.S. equity market products. Join the 600+ that read this report daily, below!

Graphic updated 6:55 AM ET. Sentiment Risk-On if expected /ES open is above the prior day’s range. /ES levels are derived from the profile graphic at the bottom of the following section. Levels may have changed since initially quoted; click here for the latest levels. SqueezeMetrics Dark Pool Index (DIX) and Gamma (GEX) calculations are based on where the prior day’s reading falls with respect to the MAX and MIN of all occurrences available. A higher DIX is bullish. At the same time, the lower the GEX, the more (expected) volatility. Learn the implications of volatility, direction, and moneyness. Breadth reflects a reading of the prior day’s NYSE Advance/Decline indicator. VIX reflects a current reading of the CBOE Volatility Index (INDEX: VIX) from 0-100.

Fundamental

We shall unpack details from the Federal Open Market Committee (FOMC) event in the coming sessions, stay tuned.

Positioning

As of 6:40 AM ET, Wednesday’s expected volatility, via the Cboe Volatility Index (INDEX: VIX), sits at ~1.27%. Net gamma exposures lightly decreasing may promote larger trading ranges.

Graphic: Via Physik Invest. Data retrieved from SqueezeMetrics.

Should fears with respect to the Federal Open Market Committee (FOMC) announcement be assuaged, then compression in volatility may do more to support current equity price levels.

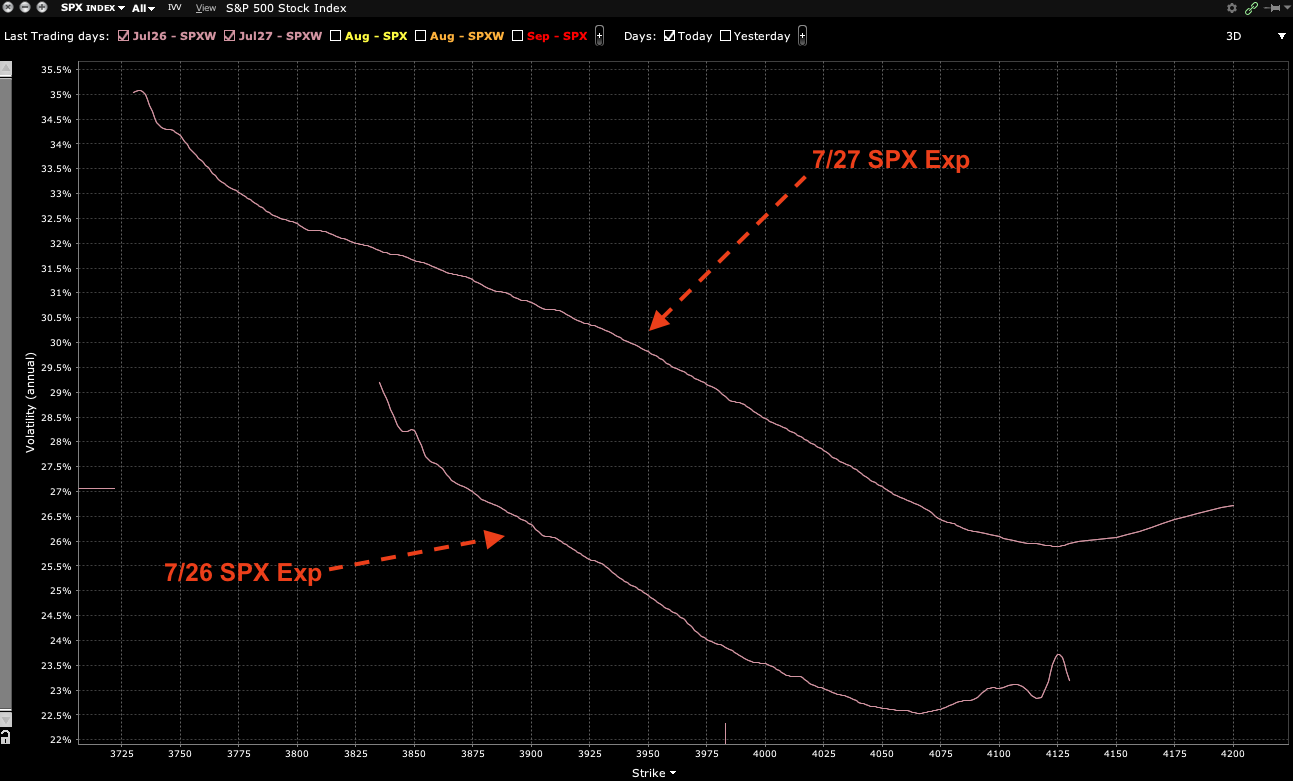
Graphic: Updated July 26, 2022. Retrieved from Interactive Brokers Group Inc’s (NASDAQ: IBKR) Trader Workstation. Posted by SpotGamma. Short-dated, pre-FOMC, volatility is sold. Longer-dated, post-FOMC volatility is bid. “Traders have likely shorting implied volatility for pre-FOMC expirations which has been supportive of equities.”

Notwithstanding, let’s unpack some trends and how they may feed into a volatility “untethering.”

In the Daily Brief for March 31, 2022, we discussed participants’ aversion to selling short-term variance. This, which did more to assuage our fear of crash risk, as well explained in the Daily Brief for March 30, 2022, was, in part, the result of COVID-era volatility that forced participants, out on the risk curve, to deleverage en masse.

As stated in March, per Banco Santander SA’s (NYSE: SAN) research, the “supply of volatility remains very subdued in a trend that has continued since the pandemic.”

“We did observe some activity in 4Q21 and 1Q this year, but almost all of that was unwinding of existing positions from earlier, and these were not new trades.”

Graphic: Via Goldman Sachs Group Inc (NYSE: GS).

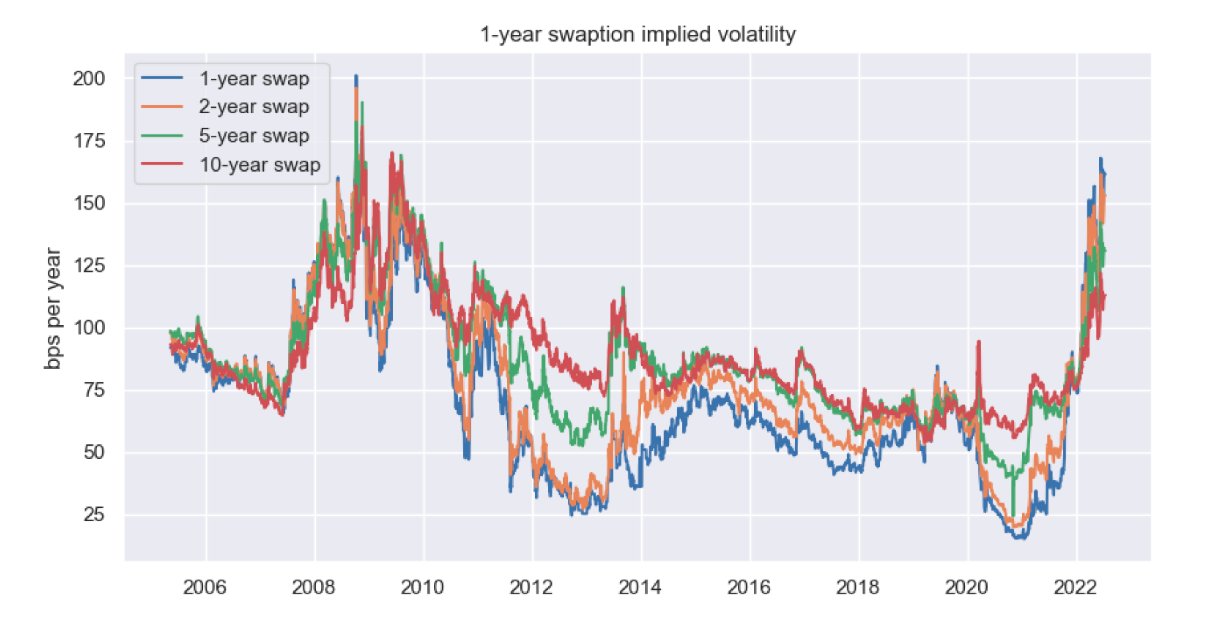
However, despite all of the “uncertainty from geopolitics and central banks,” we still saw broad equity implied volatility (IVOL) measures subdued, relative to those in rates and FX.

Graphic: Retrieved from QVR Advisors’ Benn Eifert.

Let’s unpack that muted response, further.

Well, as explained in the Daily Brief for July 21, 2022, heading into the 2022 decline, institutions repositioned and hedged, even allocating to “commodity trend following,” per our Daily Brief for July 15, 2022, which worked well the first two quarters.

The monetization and counterparty hedging of existing customer hedges, as well as the sale of short-dated volatility, particularly in some of the single names where there was “rich” volatility, into the fall, lent to lackluster performance in implied volatility and index mean reversion.

Graphic: Retrieved from Rob Emrich III. Via Goldman Sachs Group Inc (NYSE: GS).

This trend is set to come to an end as entities are squeezed out of trades that aren’t working (i.e., participants rotate out of volatility and commodities).

Graphic: Retrieved from SpotGamma. S&P 500 $3,500.00 put option values. “Like with the Boy Who Cried Wolf, people grew tired of false alarms. This year put buyers have been waiting for the wolf, but after June OPEX the villagers stopped listening.”

Per Kai Volatility’s Cem Karsan, as “volatility itself, on the equity side, becomes less and less hedged on the customer level, … [the] market can really begin to respond to the core macro factors.”

Should markets experience a shock, or trade substantially lower, the demand for hedges may result in an “untethering” in implied volatility, which was “one of the most supportive things into the decline,” Karsan said, adding that now is the best time to rotate into call options which are outperforming “their delta to the upside.”

Graphic: Time-lapse skew on the S&P 500 (INDEX: SPX) for July 25 and July 26, 2022. Retrieved from Interactive Brokers Group Inc’s (NASDAQ: IBKR) Trader Workstation.

Accordingly, given the macro risk, IVOL is likely at a lower bound and, per The Ambrus Group’s Kris Sidial, “if you wanted to go out and hedge, the opportunity is still there in the equity space.”

Technical

As of 6:30 AM ET, Wednesday’s regular session (9:30 AM – 4:00 PM ET), in the S&P 500, is likely to open in the upper part of a positively skewed overnight inventory, just outside of prior-range and -value, suggesting a potential for immediate directional opportunity.

In the best case, the S&P 500 trades higher.

Any activity above the $3,961.25 MCPOC puts into play the $3,997.00 VPOC. Initiative trade beyond the VPOC could reach as high as the $4,016.25 HVNode and $4,055.25 LVNode, or higher.

In the worst case, the S&P 500 trades lower.

Any activity below the $3,961.25 MCPOC puts into play the $3,921.00 VPOC. Initiative trade beyond the VPOC could reach as low as the $3,909.25 MCPOC and $3,867.25 LVNode, or lower.

Click here to load today’s key levels into the web-based TradingView charting platform. Note that all levels are derived using the 65-minute timeframe. New links are produced, daily.
Graphic: 65-minute profile chart of the Micro E-mini S&P 500 Futures.

Definitions

Volume Areas: A structurally sound market will build on areas of high volume (HVNodes). Should the market trend for long periods of time, it will lack sound structure, identified as low volume areas (LVNodes). LVNodes denote directional conviction and ought to offer support on any test. 

If participants were to auction and find acceptance into areas of prior low volume (LVNodes), then future discovery ought to be volatile and quick as participants look to HVNodes for favorable entry or exit.

POCs: POCs are valuable as they denote areas where two-sided trade was most prevalent in a prior day session. Participants will respond to future tests of value as they offer favorable entry and exit.

MCPOCs: POCs are valuable as they denote areas where two-sided trade was most prevalent over numerous day sessions. Participants will respond to future tests of value as they offer favorable entry and exit.

Volume-Weighted Average Prices (VWAPs): A metric highly regarded by chief investment officers, among other participants, for quality of trade. Additionally, liquidity algorithms are benchmarked and programmed to buy and sell around VWAPs.

About

After years of self-education, strategy development, mentorship, and trial-and-error, Renato Leonard Capelj began trading full-time and founded Physik Invest to detail his methods, research, and performance in the markets.

Capelj also develops insights around impactful options market dynamics at SpotGamma and is a Benzinga reporter.

Some of his works include conversations with ARK Invest’s Catherine Wood, investors Kevin O’Leary and John Chambers, FTX’s Sam Bankman-Fried, ex-Bridgewater Associate Andy Constan, Kai Volatility’s Cem Karsan, The Ambrus Group’s Kris Sidial, among many others. 

Disclaimer

In no way should the materials herein be construed as advice. Derivatives carry a substantial risk of loss. All content is for informational purposes only.
Categories
Commentary

Daily Brief For July 26, 2022

The daily brief is a free glimpse into the prevailing fundamental and technical drivers of U.S. equity market products. Join the 300+ that read this report daily, below!

Graphic updated 5:00 AM ET. Sentiment Neutral if expected /ES open is inside of the prior day’s range. /ES levels are derived from the profile graphic at the bottom of the following section. Levels may have changed since initially quoted; click here for the latest levels. SqueezeMetrics Dark Pool Index (DIX) and Gamma (GEX) calculations are based on where the prior day’s reading falls with respect to the MAX and MIN of all occurrences available. A higher DIX is bullish. At the same time, the lower the GEX, the more (expected) volatility. Learn the implications of volatility, direction, and moneyness. Breadth reflects a reading of the prior day’s NYSE Advance/Decline indicator. VIX reflects a current reading of the CBOE Volatility Index (INDEX: VIX) from 0-100.

Fundamental

What’s the theme?

It’s that policymakers are seeking to curb further escalation in inflation expectations so, per Bloomberg, “companies and workers [don’t] act in ways that would push prices ever higher.”

Graphic: Retrieved from Bloomberg.

Adding, despite the potential that the economy is already in recession (bolstered by supply chokepoints, which are “not in the central banking playbook”), per Damped Spring’s Andy Constan, risk premiums, which are the return on investments in excess of the risk-free rate, have expanded substantially on the anticipation of tightening.

Interest rates have risen and are expected to continue rising. Quantitative tightening (QT), which is more of a direct flow of capital to capital markets, on the other hand, just began.

Graphic: Retrieved from the Federal Reserve Bank of Atlanta.

In a write-up, Constan puts forth that “the obvious question is whether the frontrunning of QT has fully priced in?” 

“When looking at the sheer magnitude of the balance sheet reduction both in total reduction amounts and pace the immediate answer and one that we believe is consensus is [NO].” 

Further risk premium expansion is inevitable and, with inflation entrenched, the odds are against central banks. Notwithstanding, with the Fed planning “most of its balance sheet reduction to be run-off,” which is opting to “not reinvest the proceeds from maturing assets they own,” as well as the Treasury’s halving of “the amount of coupon issuance that the market must absorb,” Constan puts forth that the “Fed is done for the summer.”

“Our expectation is that the Fed will continue to validate the current path. That will result in less surprise and falling asset volatility” as investors realize “they are now under-risked,” which may drive a “risk premium contraction over the near term.”

Adding, on the topic of earnings, operating leverage may “provide some buffer for input costs to inflate more than revenue without hitting margin growth.” This factors into Constan’s optimism.

Positioning

As of 5:00 AM ET, Tuesday’s expected volatility, via the Cboe Volatility Index (INDEX: VIX), sits at ~1.25%. Net gamma exposures remain positive and may continue to promote tighter ranges.

Given where realized (RVOL) and implied (IVOL) volatility measures are, as well as skew, it is beneficial to be a buyer of short-dated complex options structures (e.g., low-cost call ratios).

Graphic: Retrieved from Goldman Sachs Group Inc (NYSE: GS).

The reason why? 

In short, per Kai Volatility’s Cem Karsan, the “tail risks are building” and no longer is volatility likely to be pinned by sentiment and positioning, as well as the hedging on the equity volatility.

For more, the very detailed Daily Brief for July 21, 2022, explained it best. Check that out, here.

Graphic: Retrieved from Interactive Brokers Group Inc’s (NASDAQ: IBKR) Trader Workstation. Posted by SpotGamma. Short-dated, pre-FOMC, volatility is sold. Longer-dated, post-FOMC volatility is bid. “The IV decline likely stalls ahead of Wednesday FOMC, which stalls equities.”

Technical

As of 5:00 AM ET, Tuesday’s regular session (9:30 AM – 4:00 PM ET), in the S&P 500, is likely to open in the middle part of a balanced overnight inventory, inside of prior-range and -value, suggesting a limited potential for immediate directional opportunity.

In the best case, the S&P 500 trades higher.

Any activity above the $3,965.00 VPOC puts into play the $3,997.00 VPOC. Initiative trade beyond the $3,997.00 VPOC could reach as high as the $4,016.25 HVNode and $4,055.25 LVNode, or higher.

In the worst case, the S&P 500 trades lower.

Any activity below the $3,965.00 VPOC puts into play the $3,943.25 HVNode. Initiative trade beyond the HVNode could reach as low as the $3,909.25 MCPOC and $3,867.25 LVNode, or lower.

Click here to load today’s key levels into the web-based TradingView charting platform. Note that all levels are derived using the 65-minute timeframe. New links are produced, daily.
Graphic: 65-minute profile chart of the Micro E-mini S&P 500 Futures.

Considerations: The market is in balance.

This is rotational trade that denotes current prices offer favorable entry and exit. Balance areas make it easy to spot a change in the market (i.e., the transition from two-time frame trade, or balance, to one-time frame trade, or trend). 

Modus operandi is responsive trade (i.e., fade the edges), rather than initiative trade (i.e., play the break).

Definitions

Volume Areas: A structurally sound market will build on areas of high volume (HVNodes). Should the market trend for long periods of time, it will lack sound structure, identified as low volume areas (LVNodes). LVNodes denote directional conviction and ought to offer support on any test. 

If participants were to auction and find acceptance into areas of prior low volume (LVNodes), then future discovery ought to be volatile and quick as participants look to HVNodes for favorable entry or exit.

POCs: POCs are valuable as they denote areas where two-sided trade was most prevalent in a prior day session. Participants will respond to future tests of value as they offer favorable entry and exit.

MCPOCs: POCs are valuable as they denote areas where two-sided trade was most prevalent over numerous day sessions. Participants will respond to future tests of value as they offer favorable entry and exit.

Volume-Weighted Average Prices (VWAPs): A metric highly regarded by chief investment officers, among other participants, for quality of trade. Additionally, liquidity algorithms are benchmarked and programmed to buy and sell around VWAPs.

About

After years of self-education, strategy development, mentorship, and trial-and-error, Renato Leonard Capelj began trading full-time and founded Physik Invest to detail his methods, research, and performance in the markets.

Capelj also develops insights around impactful options market dynamics at SpotGamma and is a Benzinga reporter.

Some of his works include conversations with ARK Invest’s Catherine Wood, investors Kevin O’Leary and John Chambers, FTX’s Sam Bankman-Fried, ex-Bridgewater Associate Andy Constan, Kai Volatility’s Cem Karsan, The Ambrus Group’s Kris Sidial, among many others.

Disclaimer

In no way should the materials herein be construed as advice. Derivatives carry a substantial risk of loss. All content is for informational purposes only.
Categories
Commentary

Daily Brief For July 21, 2022

The daily brief is a free glimpse into the prevailing fundamental and technical drivers of U.S. equity market products. Join the 300+ that read this report daily, below!

Graphic updated 6:30 AM ET. Sentiment Neutral if expected /ES open is inside of the prior day’s range. /ES levels are derived from the profile graphic at the bottom of the following section. Levels may have changed since initially quoted; click here for the latest levels. SqueezeMetrics Dark Pool Index (DIX) and Gamma (GEX) calculations are based on where the prior day’s reading falls with respect to the MAX and MIN of all occurrences available. A higher DIX is bullish. At the same time, the lower the GEX, the more (expected) volatility. Learn the implications of volatility, direction, and moneyness. Breadth reflects a reading of the prior day’s NYSE Advance/Decline indicator. VIX reflects a current reading of the CBOE Volatility Index (INDEX: VIX) from 0-100.

Note: Looking back, yesterday’s letter was “eh” to put it simply.

So, here’s a discussion in the positioning section that tidies up some of the past analyses we’ve made. Also, I will be off Friday, July 22, 2022, through to Tuesday, July 26, 2022. 

Thank you for all the support and I look forward to hitting next week, hard, with you! Take care!

Positioning

As of 6:30 AM ET, Thursday’s expected volatility, via the Cboe Volatility Index (INDEX: VIX), sits at ~1.25%. Net gamma exposures increasing may help tighten equity index ranges.

Graphic: Via Physik Invest. Data retrieved from SqueezeMetrics.

Given where realized (RVOL) and implied (IVOL) volatility measures are, as well as skew, it is beneficial to be a buyer of short-dated complex options structures (e.g., low-cost call ratios) that are short those options that have the most to lose in an SPX up, VIX down environment.

Graphic: Via Physik Invest. Data retrieved from the Cboe and TradingView.

The reason why? 

Kai Volatility’s Cem Karsan explained it well in a conversation he had with the Charles Schwab Inc-owned (NYSE: SCHW) TD Ameritrade Network.

Heading into the 2022 decline, institutions were well hedged. Their monetization of hedges, as well as the demand for certain equity options structures (and the hedging of them) into the fall, lent to supply and compressed volatility on a fixed strike basis, relative to that in other markets.

Graphic: Retrieved from QVR Advisors’ Benn Eifert.

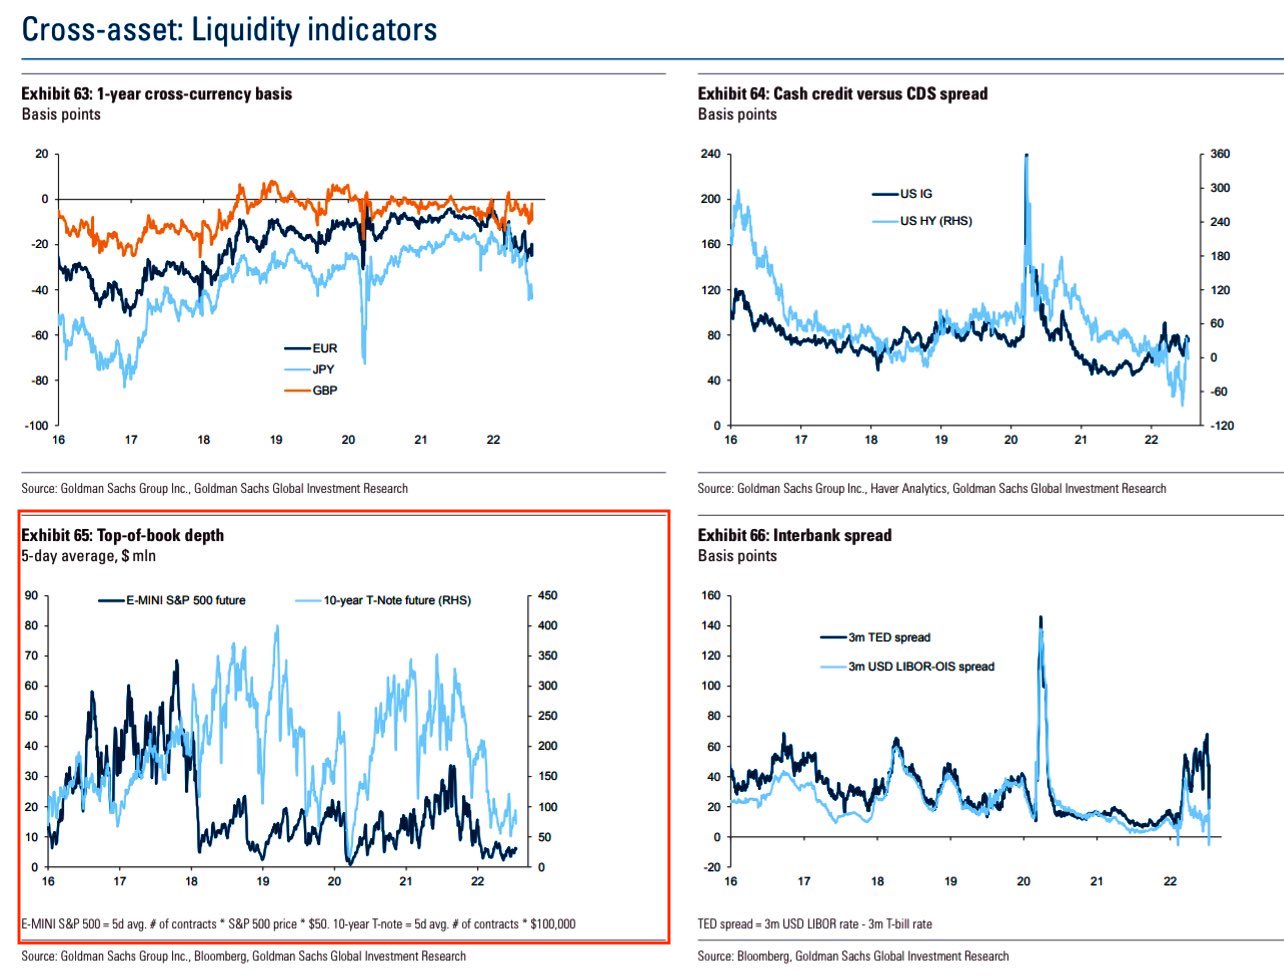
Volatility supply, coupled with the lower liquidity environment, results in hedging pressures that (matter more) and lend to index mean reversion which Karsan posits may be coming to an end.

Graphic: Retrieved from Goldman Sachs Group Inc (NYSE: GS).

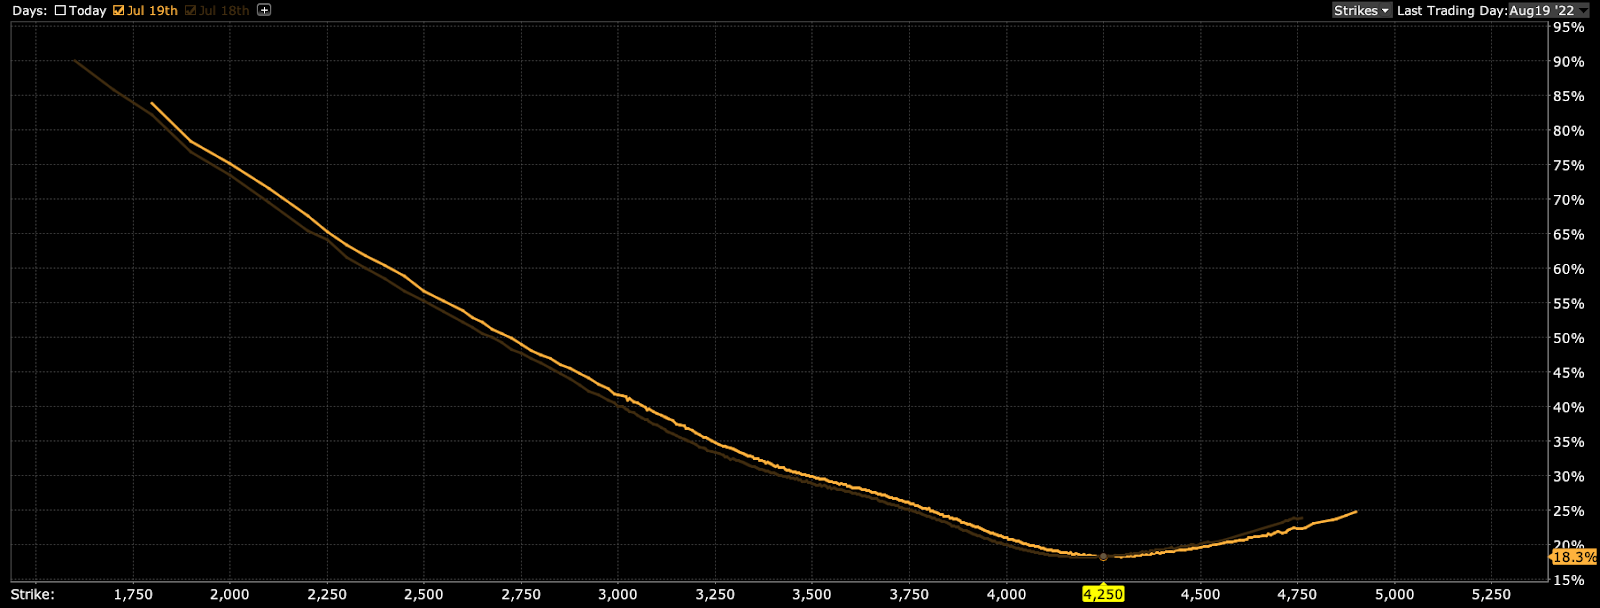
In validating his thesis, Karsan pointed to fixed strike volatility jumping in spite of the equity rally.

Graphic: Time-lapse skew on the S&P 500 (INDEX: SPX) for July 18 and July 19, 2022. Retrieved from Interactive Brokers Group Inc’s (NASDAQ: IBKR) Trader Workstation.

“This is the beginning of an untethering,” he explained. “If we see a rally here, IVOL will likely increase on a fixed strike basis. If that does, that will continue to untether index volatility which has been one of the most supportive things into the decline.”

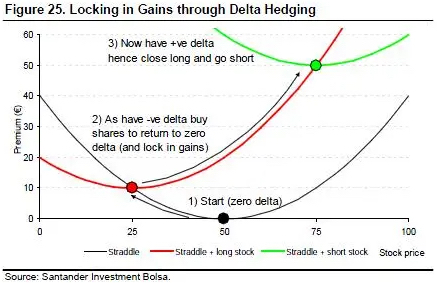
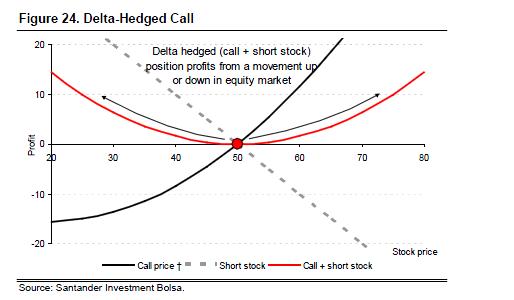
For context, on the latter remark, when volatility is supplied by the customer, the counterparty, which is on the other side, has exposure to long volatility. All else equal, on directional moves, long volatility positions will reprice for the counterparty favorably.

To re-hedge, the counterparty will buy weakness (against increased negative delta) and sell strength (against increased positive delta). Below is a naive example of the effects of delta hedging a straddle on profit and loss.

Graphic: Retrieved from Banco Santander SA (NYSE: SAN).

Moreover, these shifts are suggestive of weakening market support, in the face of a macro and geopolitical environment that’s not improving. Quantitative tightening (QT), which is “the direct input of capital to capital markets” is set to double on September 1, 2022, all the while there is likely to be compression on earnings, and a break up in risk premiums across markets.

The “tail risks are building” and no longer is volatility likely to be pinned by (1) sentiment and positioning, as well as (2) hedging on the equity volatility side, Karsan added.

Graphic: Shared by Benn Eifert of QVR Advisors.

“As you squeeze entities out on the upside of that short positioning, and volatility itself, on the equity side, becomes less and less hedged on the customer level, which we’re beginning to see, the market can really begin to respond to the core macro factors.”

With a more volatile second leg down in play, Karsan says higher prices, in spite of small blips in IVOL on a fixed strike basis, will offer participants an opportunity to “add to volatility hedges.”

Likewise, with call options outperforming “their delta to the upside,” it makes much sense to replace static equity long exposure with that which is dynamic.

“The bare minimum, if you’re long equities, is to be expressing that in calls,” Karsan ends. S&P 500 calls are at a “17.5 and 18 volatility. If we continue to slide, the VIX [likely won’t] slide below 20 in this environment, given the macro risk.”

Technical

As of 6:30 AM ET, Thursday’s regular session (9:30 AM – 4:00 PM ET), in the S&P 500, is likely to open in the middle part of a balanced overnight inventory, inside of prior-range and -value, suggesting a limited potential for immediate directional opportunity.

In the best case, the S&P 500 trades higher.

Any activity above the $3,943.25 HVNode puts into play the $3,982.75 LVNode. Initiative trade beyond the LVNode could reach as high as the $4,016.25 HVNode and $4,055.25 LVNode, or higher.

In the worst case, the S&P 500 trades lower.

Any activity below the $3,943.25 HVNode puts into play the $3,909.25 MCPOC. Initiative trade beyond the MCPOC could reach as low as the $3,867.25 LVNode and $3,829.75 MCPOC, or lower.

Click here to load today’s key levels into the web-based TradingView charting platform. Note that all levels are derived using the 65-minute timeframe. New links are produced, daily.
Graphic: Updated July 20, 2022. 65-minute profile chart of the Micro E-mini S&P 500 Futures.

Definitions

Volume Areas: A structurally sound market will build on areas of high volume (HVNodes). Should the market trend for long periods of time, it will lack sound structure, identified as low volume areas (LVNodes). LVNodes denote directional conviction and ought to offer support on any test. 

If participants were to auction and find acceptance into areas of prior low volume (LVNodes), then future discovery ought to be volatile and quick as participants look to HVNodes for favorable entry or exit.

POCs: POCs are valuable as they denote areas where two-sided trade was most prevalent in a prior day session. Participants will respond to future tests of value as they offer favorable entry and exit.

MCPOCs: POCs are valuable as they denote areas where two-sided trade was most prevalent over numerous day sessions. Participants will respond to future tests of value as they offer favorable entry and exit.

Volume-Weighted Average Prices (VWAPs): A metric highly regarded by chief investment officers, among other participants, for quality of trade. Additionally, liquidity algorithms are benchmarked and programmed to buy and sell around VWAPs.

About

After years of self-education, strategy development, mentorship, and trial-and-error, Renato Leonard Capelj began trading full-time and founded Physik Invest to detail his methods, research, and performance in the markets.

Capelj also develops insights around impactful options market dynamics at SpotGamma and is a Benzinga reporter.

Some of his works include conversations with ARK Invest’s Catherine Wood, investors Kevin O’Leary and John Chambers, FTX’s Sam Bankman-Fried, ex-Bridgewater Associate Andy Constan, Kai Volatility’s Cem Karsan, The Ambrus Group’s Kris Sidial, among many others.

Disclaimer

In no way should the materials herein be construed as advice. Derivatives carry a substantial risk of loss. All content is for informational purposes only.
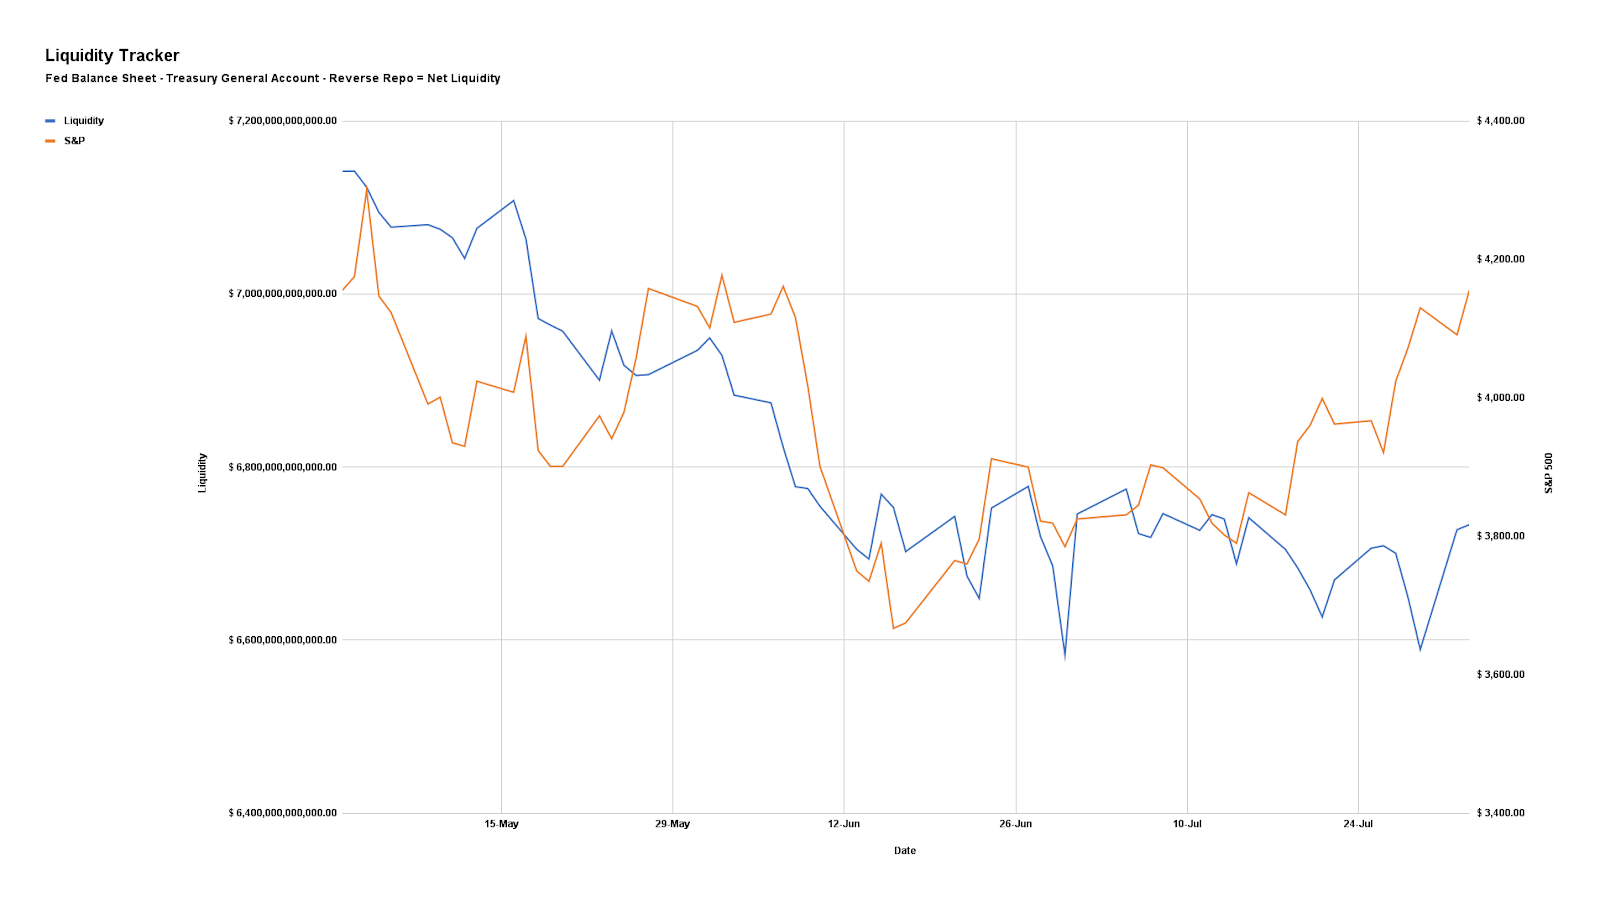
Categories
Commentary

Daily Brief For July 20, 2022

The daily brief is a free glimpse into the prevailing fundamental and technical drivers of U.S. equity market products. Join the 300+ that read this report daily, below!

Graphic updated 7:00 AM ET. Sentiment Neutral if expected /ES open is inside of the prior day’s range. /ES levels are derived from the profile graphic at the bottom of the following section. Levels may have changed since initially quoted; click here for the latest levels. SqueezeMetrics Dark Pool Index (DIX) and Gamma (GEX) calculations are based on where the prior day’s reading falls with respect to the MAX and MIN of all occurrences available. A higher DIX is bullish. At the same time, the lower the GEX, the more (expected) volatility. Learn the implications of volatility, direction, and moneyness. Breadth reflects a reading of the prior day’s NYSE Advance/Decline indicator. VIX reflects a current reading of the CBOE Volatility Index (INDEX: VIX) from 0-100.

Fundamental

Thanks to all the subscribers who have signed up in the past few days. Not sure how you got here so thank you! Also, thanks to whoever may have shared the letter to make that happen!

From here, you can expect in-depth commentaries on aspects like fundamentals, technicals, and positioning. Insights are actionable as they help me protect and grow my own capital!

Without further delay, below is what you need to know for today!

In the news was Netflix Inc’s (NASDAQ: NFLX) post-earnings jump on better-than-expected subscriber loss numbers, the Russians and Europeans agreeing on gas pipelines, mortgage boycotts spreading across China, tight food supplies, gas prices falling to some of the lowest levels in months, and China warning against a Taiwan visit by the U.S.

View: Earnings calendar.

Further, after our July 19 remark on incredibly strong pessimism likely to serve as a contrarian signal, the equity indexes pushed higher, following through key multi-week resistance.

Key levels quoted held nearly to the tick. Now, both the Nasdaq 100 (INDEX: NDX) and S&P 500 (INDEX: SPX) are above their 20- and 50-day moving averages. The Russell 2000, a laggard, made it above the 200-day moving average.

Graphic: Retrieved from Bloomberg.

The speed and ferociousness of the rally have more to do with how participants were positioned – in light of what seemed to be a worsening fundamental situation – into the break of some very visual resistances, discussed in prior letters. Read the next section for more on the positioning.

Graphic: Retrieved from Bloomberg.

Cryptocurrencies, which were recipients of the same risk-on flows equities saw, too, went higher yesterday. Per CoinMetrics data, Bitcoin’s (CRYPTO: BTC) correlation to equities is positive.

Graphic: Retrieved from Bloomberg.

For context, asset volatility had fallen on participants’ extension of moneyness to nonmonetary assets, given easy monetary policies and an environment of ample debt and leverage. These policies made it easier to borrow and make longer-duration bets on ideas with lots of promise.

This had consequences on the real economy and asset prices, accordingly, which rose and kept deflationary pressures at bay. The distinction between economies and financial markets blurred.

When the reverse happens – tighter liquidity and credit – and volatility eventually rises, demand (and competition) for money (or cash) deflates assets (e.g., equities, crypto, and the like).

Graphic: Via Schroders plc (OTC: SHNWF). Taken from the Weekly S&P 500 ChartStorm.

With U.S. market liquidity, as well as the dollar’s role as a global reserve currency, putting U.S. markets and the S&P 500 at the center of the global carry regime, a U.S. stock market drop is a recession and the direct reflection of the unwinds of carry.

It is the manifestation of a deflationary shock, and today’s sentiment reflects this.

Graphic: Retrieved from Layoffs.fyi Tracker.

Ultimately, a deflationary pulse manifesting disinflation in consumer prices may prompt the Fed (Federal Reserve) to reverse on rates and quantitative tightening (QT), the (out)flow of capital from capital markets.

Graphic: Graphic: Via Bank of America Corporation (NYSE: BAC). Retrieved from Bloomberg. “The previous low on this measure came five months before the final market low, but again this could be taken as evidence that the market has already taken enough evasive action.”

Positioning

The continued sale of volatility (as long volatility trades have not panned out), particularly across shorter time horizons, left those, on the other side, warehousing long volatility (a sort-of naive thing to say bluntly as we’re discounting customer trades being paired off with each other).

Graphic: Retrieved from Goldman Sachs Group Inc (NYSE: GS).

Nonetheless, these liquidity providers’ positions, all else equal, will maintain or increase in value if underlying(s) realize volatility (especially that far in excess of implied). To (re)hedge, those on the other side will do less to add realized (RVOL) volatility and more to suppress implied (IVOL).

Graphic: Via Banco Santander SA (NYSE: SAN). Into strength (weakness), counterparties’ long call exposures will increase (decrease) in value. To re-hedge, counterparties will buy (sell) weakness (strength).

Moreover, with RVOL creeping (and exceeding, at times) the IVOL, short volatility structures, particularly if unhedged and across short time horizons, are not doing good. The unwinding of these structures can add fuel to the directional resolve (e.g., if the customer buys back a short call, the liquidity provider sells their long call and buys back their short equity to re-hedge).

Hence, options structures that we said may be good to take advantage of the “smiley” skew (e.g., zero- or low-cost call ratio spreads) are performing much better.

Graphic: Updated 7/18/2022. Via Charles Schwab Corporation-owned (NYSE: SCHW) TD Ameritrade’s Thinkorswim. Skew resembles more of a smile, rather than a smirk.

Technical

As of 6:45 AM ET, Wednesday’s regular session (9:30 AM – 4:00 PM ET), in the S&P 500, is likely to open in the middle part of a balanced overnight inventory, inside of prior-range and -value, suggesting a limited potential for immediate directional opportunity.

In the best case, the S&P 500 trades higher.

Any activity above the $3,943.25 HVNode puts into play the $3,982.75 LVNode. Initiative trade beyond the LVNode could reach as high as the $4,016.25 HVNode and $4,055.25 LVNode, or higher.

In the worst case, the S&P 500 trades lower.

Any activity below the $3,943.25 HVNode puts into play the $3,909.25 MCPOC. Initiative trade beyond the MCPOC could reach as low as the $3,867.25 LVNode and $3,829.75 MCPOC, or lower.

Click here to load today’s key levels into the web-based TradingView charting platform. Note that all levels are derived using the 65-minute timeframe. New links are produced, daily.
Graphic: 65-minute profile chart of the Micro E-mini S&P 500 Futures.
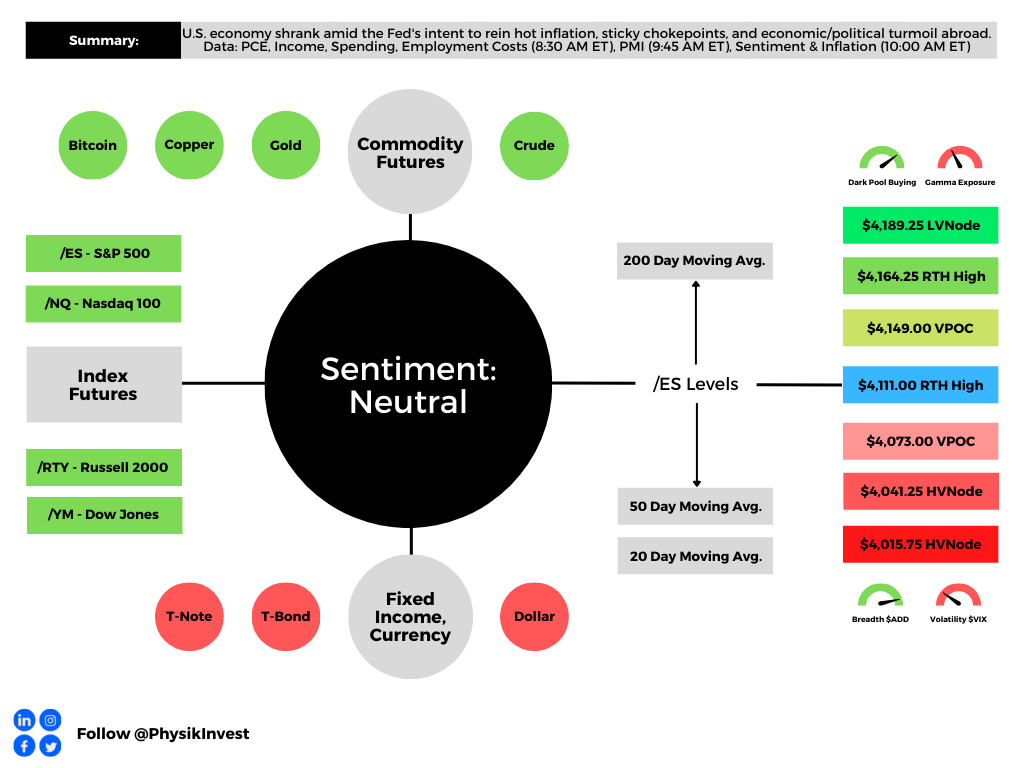
Considerations: Responsiveness near key-technical areas (that are discernable visually on a chart), suggests technically-driven traders with short time horizons are very active. 
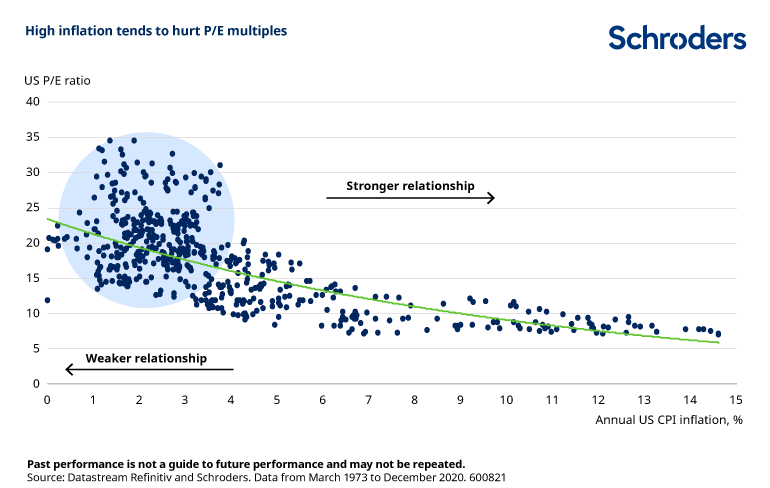
Such traders often lack the wherewithal to defend retests and, additionally, the type of trade may be indicative of the other time frame participants waiting for more information to initiate trades.

Definitions

Volume Areas: A structurally sound market will build on areas of high volume (HVNodes). Should the market trend for long periods of time, it will lack sound structure, identified as low volume areas (LVNodes). LVNodes denote directional conviction and ought to offer support on any test. 

If participants were to auction and find acceptance into areas of prior low volume (LVNodes), then future discovery ought to be volatile and quick as participants look to HVNodes for favorable entry or exit.

POCs: POCs are valuable as they denote areas where two-sided trade was most prevalent in a prior day session. Participants will respond to future tests of value as they offer favorable entry and exit.

MCPOCs: POCs are valuable as they denote areas where two-sided trade was most prevalent over numerous day sessions. Participants will respond to future tests of value as they offer favorable entry and exit.

Volume-Weighted Average Prices (VWAPs): A metric highly regarded by chief investment officers, among other participants, for quality of trade. Additionally, liquidity algorithms are benchmarked and programmed to buy and sell around VWAPs.

About

After years of self-education, strategy development, mentorship, and trial-and-error, Renato Leonard Capelj began trading full-time and founded Physik Invest to detail his methods, research, and performance in the markets.

Capelj also develops insights around impactful options market dynamics at SpotGamma and is a Benzinga reporter.

Some of his works include conversations with ARK Invest’s Catherine Wood, investors Kevin O’Leary and John Chambers, FTX’s Sam Bankman-Fried, former Bridgewater Associate Andy Constan, Kai Volatility’s Cem Karsan, The Ambrus Group’s Kris Sidial, among many others.

Disclaimer

In no way should the materials herein be construed as advice. Derivatives carry a substantial risk of loss. All content is for informational purposes only.