Physik Invest’s Daily Brief is read by thousands of subscribers. You, too, can join this community to learn about the fundamental and technical drivers of markets.
Positioning
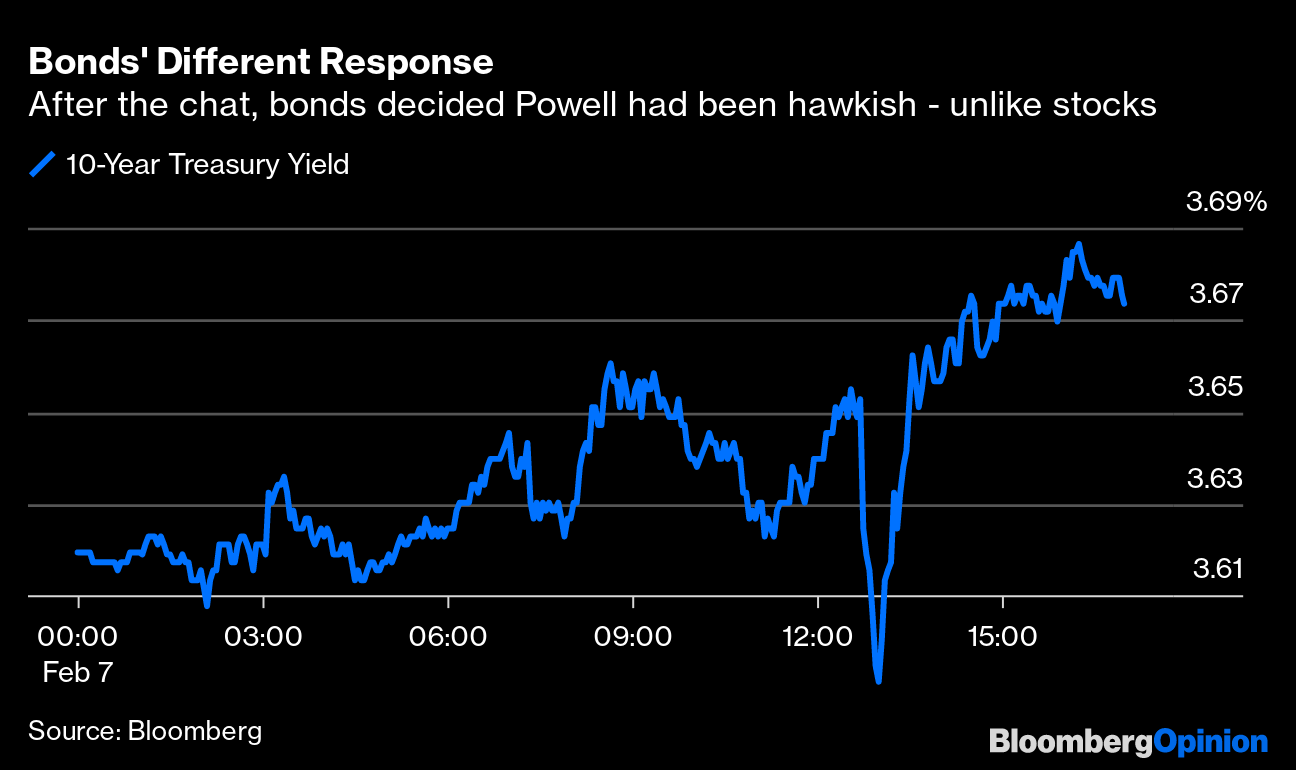
The S&P 500 (INDEX: SPX) closed higher yesterday despite the Federal Reserve’s (Fed) Jerome Powell warning rates would stay higher for longer.
According to an analysis by Interactive Brokers Group Inc’s (NASDAQ: IBKR), “it was clear that there were algos programmed to buy if [Powell] mentioned ‘disinflation.’ When [Powell] said the secret word, off we went.”

Implied volatility (IVOL) compression, as evidenced by shifts lower in the IVOL term structure and measures like the Cboe Volatility Index (INDEX: VIX) declining, was a booster, as was the trade of ultra-short-dated call options.
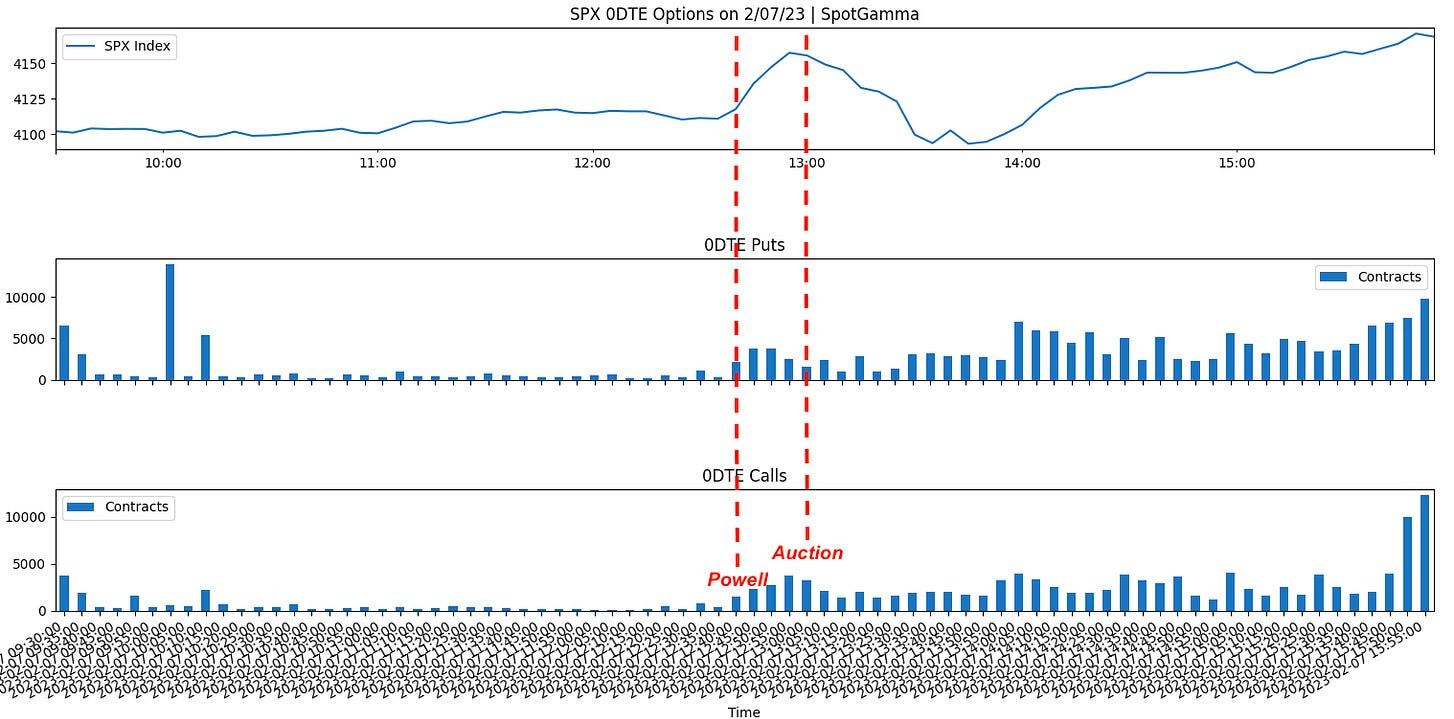
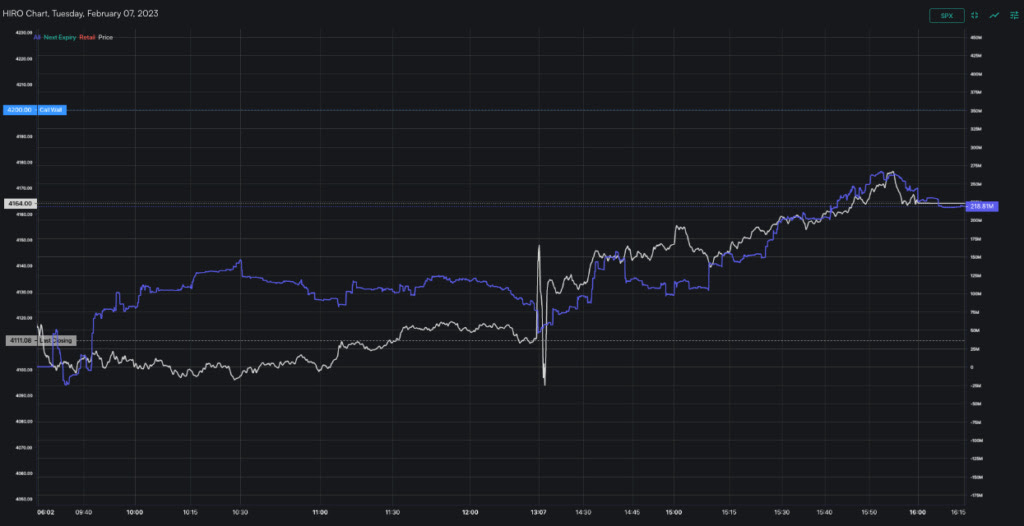
SpotGamma’s HIRO indicator showed positive delta call buying and put selling. This indicator validates the belief that IVOL compression catalyzed a rally and that follow-on strength came from traders’ demand for call options. In instances of put selling and call buying, counterparties hedge by buying underlying stocks and futures.
One way to think about what’s going on is to recall that for options to keep their value, something unexpected has to happen. When nothing unexpected happens, from a trader’s perspective, what’s the value-add of continuing to own put options, for instance? So, you sell and pressure IVOL. Consequently, dealers, who are short puts declining in value, buy back some of their short stock and/or futures hedges, and this is supportive for the market.
The bullish impact of this options activity, taken alone, is not long-lasting.
In the Daily Brief for February 3, 2023, we discussed the impact of this activity, all else equal; as time passes and/or volatility falls, the counterparties’ reaction to long call options, for example, declining in value is to sell some of the stock and futures they own as hedges. This can resist traders’ attempts to explore higher prices.
To close, it continues to make sense to position in structures that take advantage of still low longer-dated S&P 500 (INDEX: SPX) IVOL. For instance, traders can consider selling rich call verticals to finance put verticals expiring months from now.
In our recent commentaries, we reasoned why such structures are priced the way they are. Should market pressures surface, that’s a simple way to protect profits.
Technical
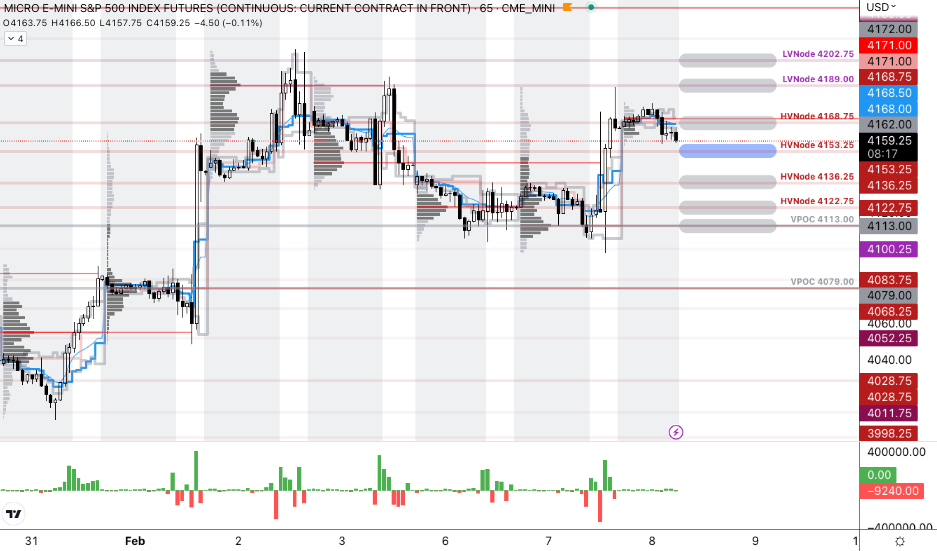
As of 6:50 AM ET, Wednesday’s regular session (9:30 AM – 4:00 PM ET), in the S&P 500, is likely to open in the lower part of a balanced overnight inventory, inside of the prior day’s range, suggesting a limited potential for immediate directional opportunity.
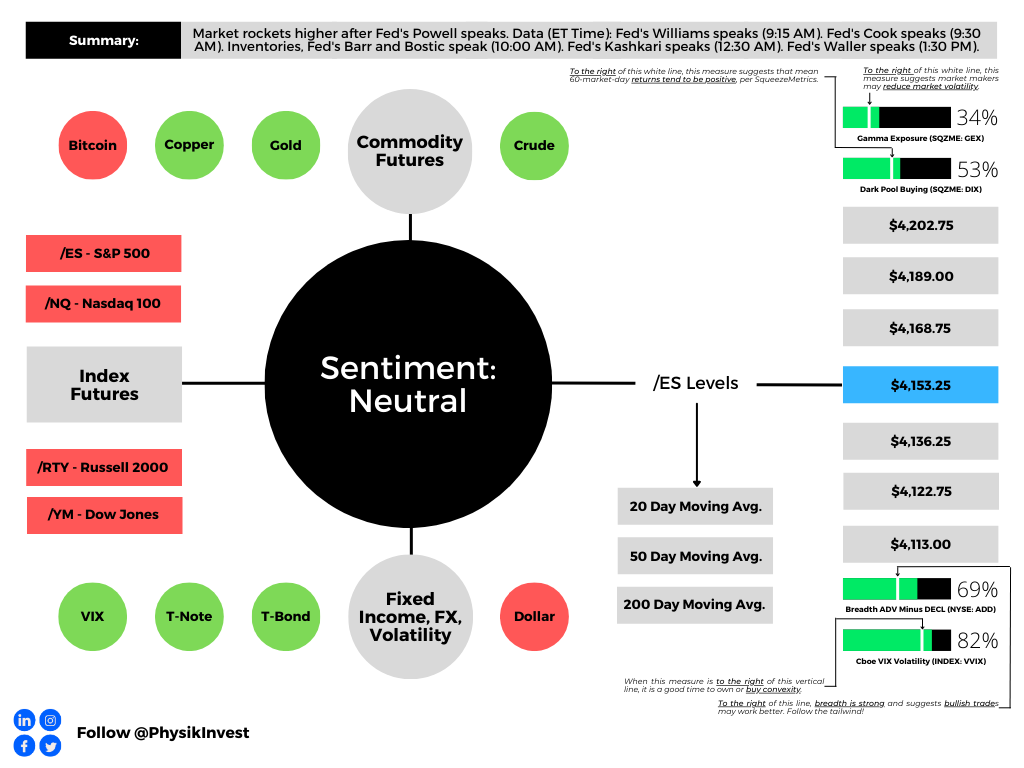
The S&P 500 pivot for today is $4,153.25.
Key levels to the upside include $4,168.75, $4,189.00, and $4,202.75.
Key levels to the downside include $4,136.25, $4,122.75, and $4,113.00.
Disclaimer: Click here to load the updated key levels via the web-based TradingView platform. New links are produced daily. Quoted levels likely hold barring an exogenous development.
Definitions
Volume Areas: Markets will build on areas of high-volume (HVNodes). Should the market trend for a period of time, this will be identified by a low-volume area (LVNodes). The LVNodes denote directional conviction and ought to offer support on any test.
If participants auction and find acceptance in an area of a prior LVNode, then future discovery ought to be volatile and quick as participants look to the nearest HVNodes for more favorable entry or exit.
POCs: Areas where two-sided trade was most prevalent in a prior day session. Participants will respond to future tests of value as they offer favorable entry and exit.
About
The author, Renato Leonard Capelj, works in finance and journalism.
Capelj spends the bulk of his time at Physik Invest, an entity through which he invests and publishes free daily analyses to thousands of subscribers. The analyses offer him and his subscribers a way to stay on the right side of the market. Separately, Capelj is an options analyst at SpotGamma and an accredited journalist.
Capelj’s past works include conversations with investor Kevin O’Leary, ARK Invest’s Catherine Wood, FTX’s Sam Bankman-Fried, Lithuania’s Minister of Economy and Innovation Aušrinė Armonaitė, former Cisco chairman and CEO John Chambers, and persons at the Clinton Global Initiative.
Connect
Direct queries to renato@physikinvest.com or find Physik Invest on Twitter, LinkedIn, Facebook, and Instagram.
Calendar
You may view this letter’s content calendar at this link.
Disclaimer
Do not construe this newsletter as advice. All content is for informational purposes.


