Categories
Commentary

Daily Brief For August 8, 2022

The daily brief is a free glimpse into the prevailing fundamental and technical drivers of U.S. equity market products. Join the 750+ that read this report daily, below!
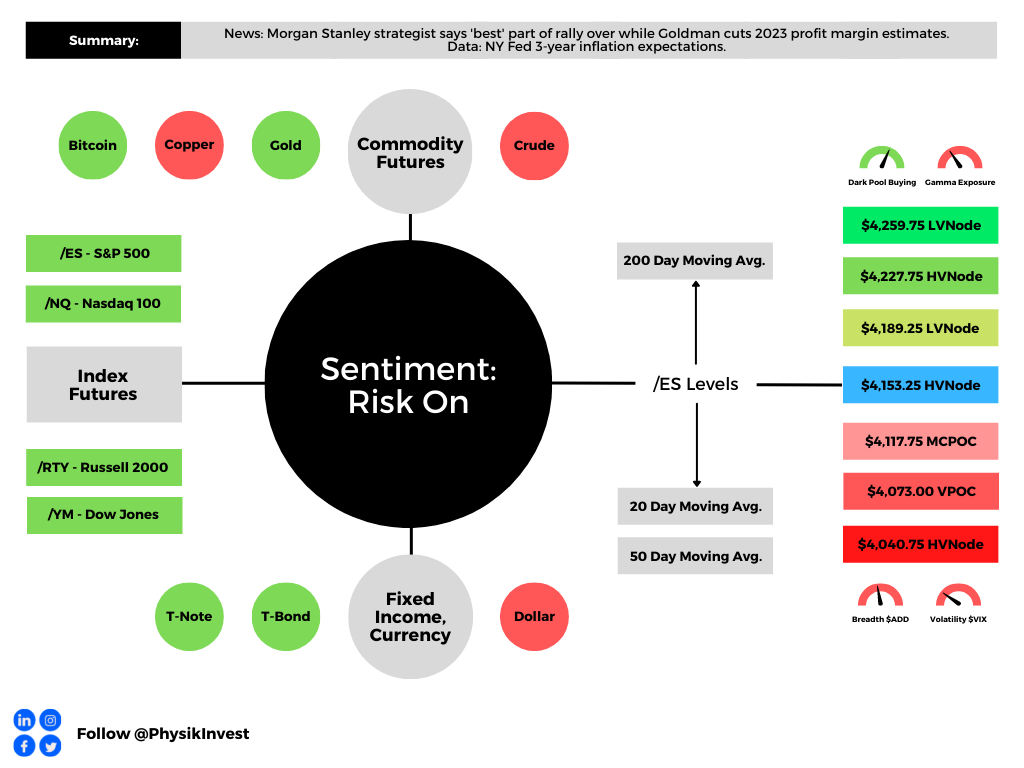
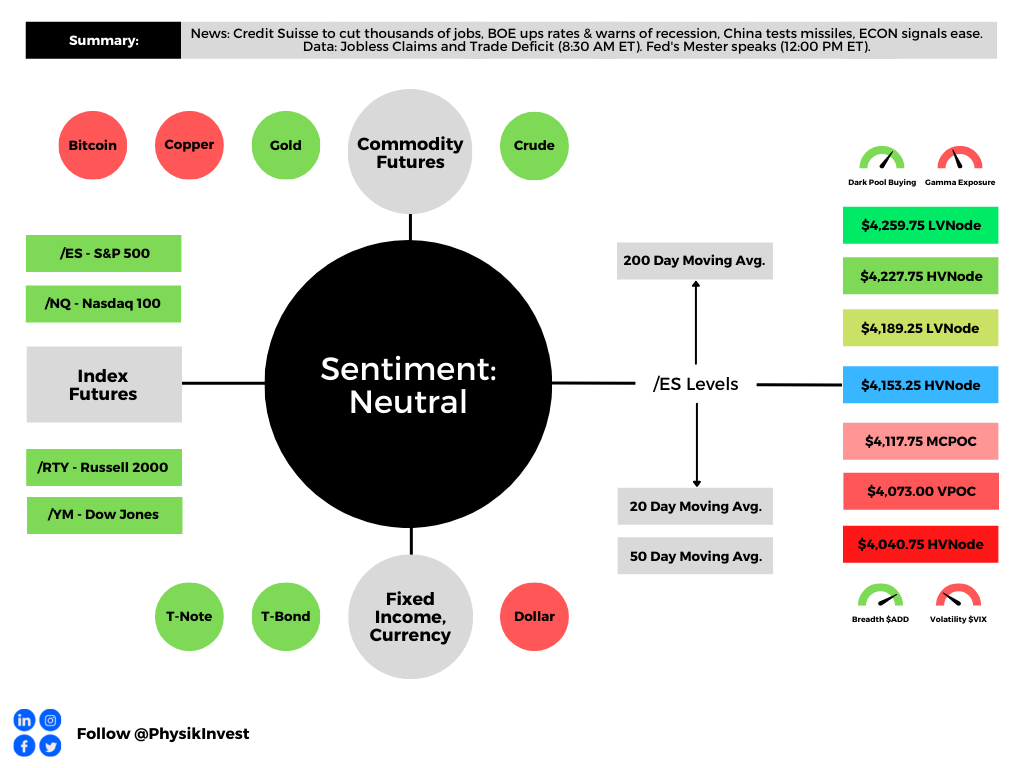
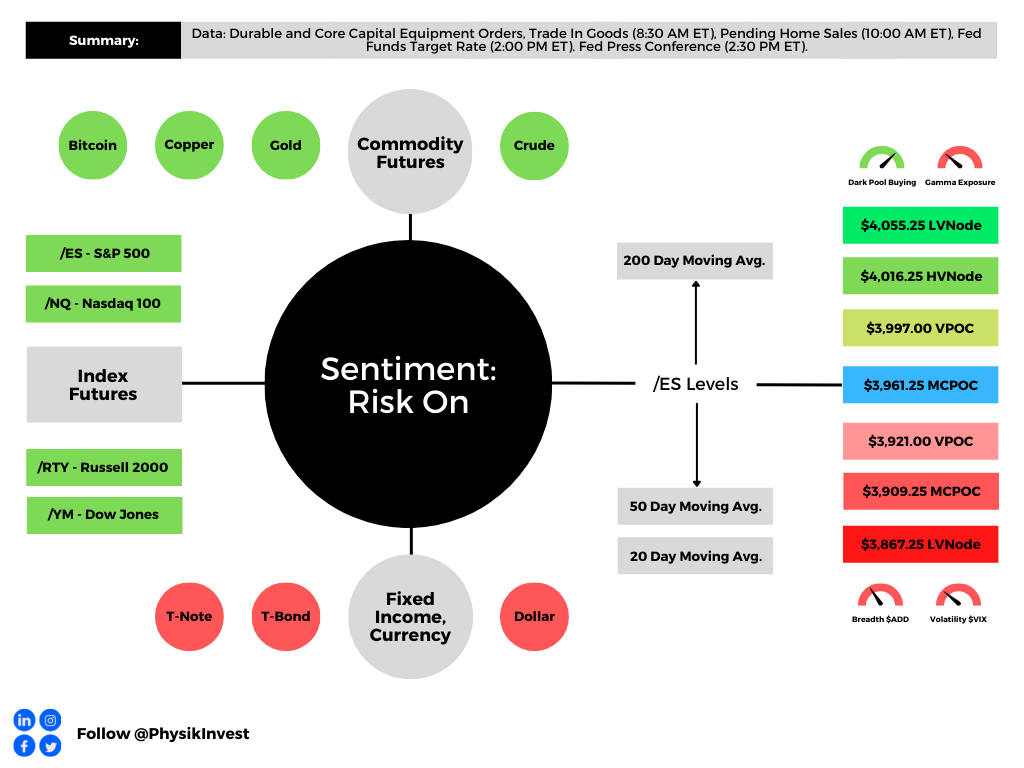
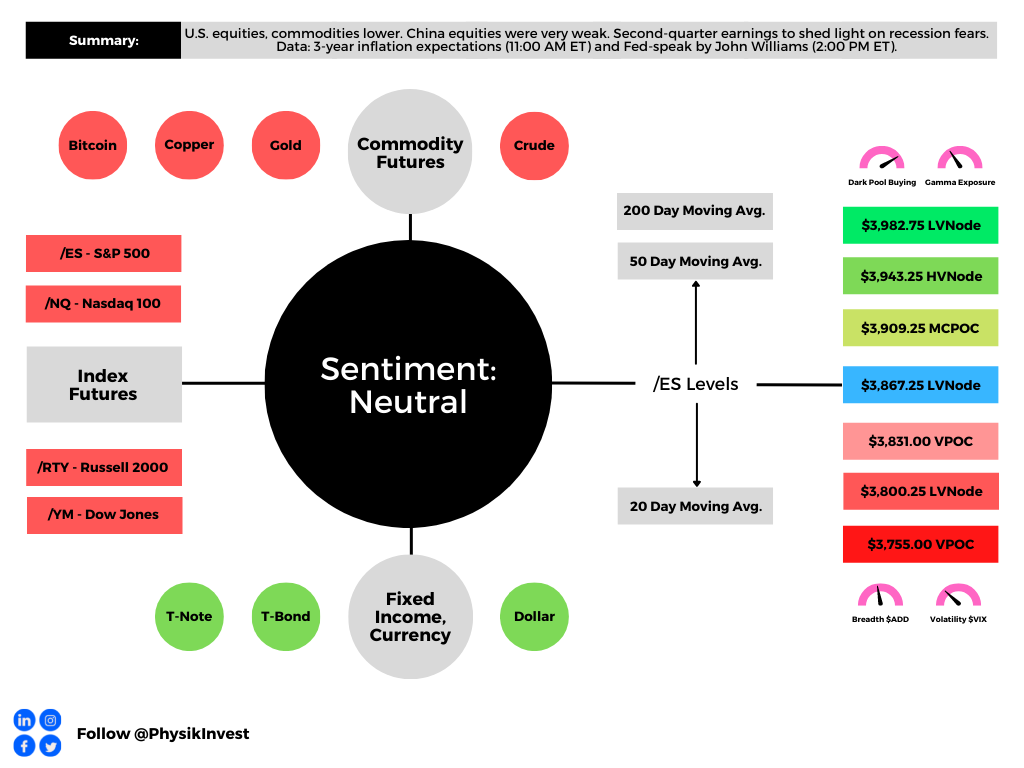
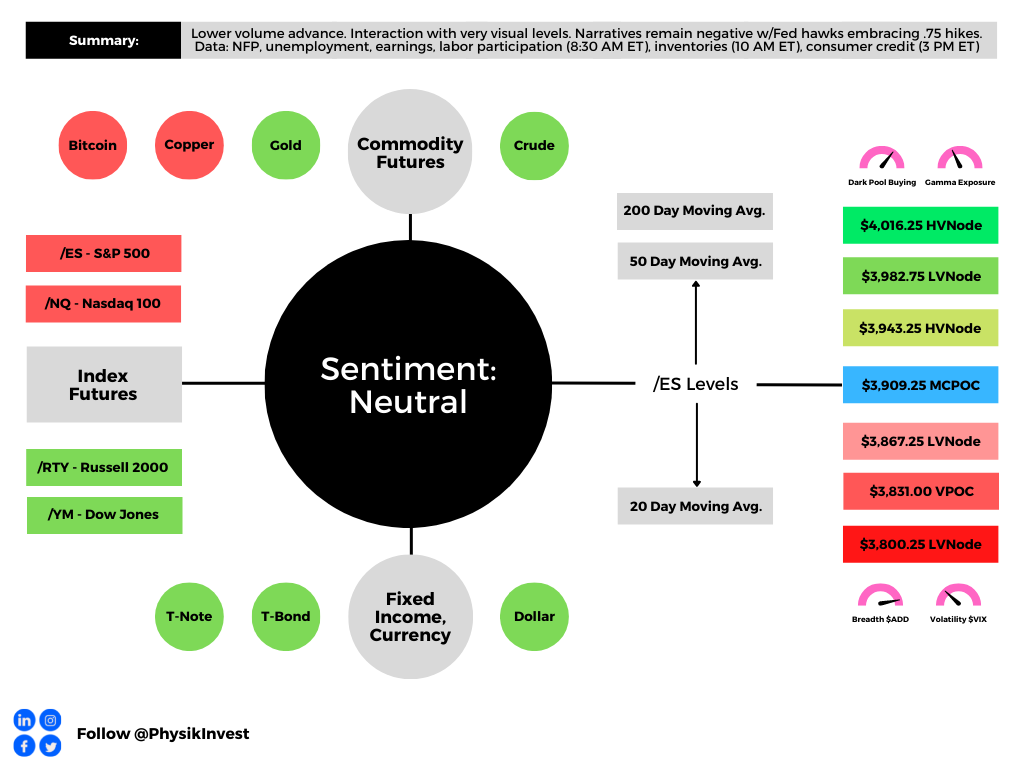
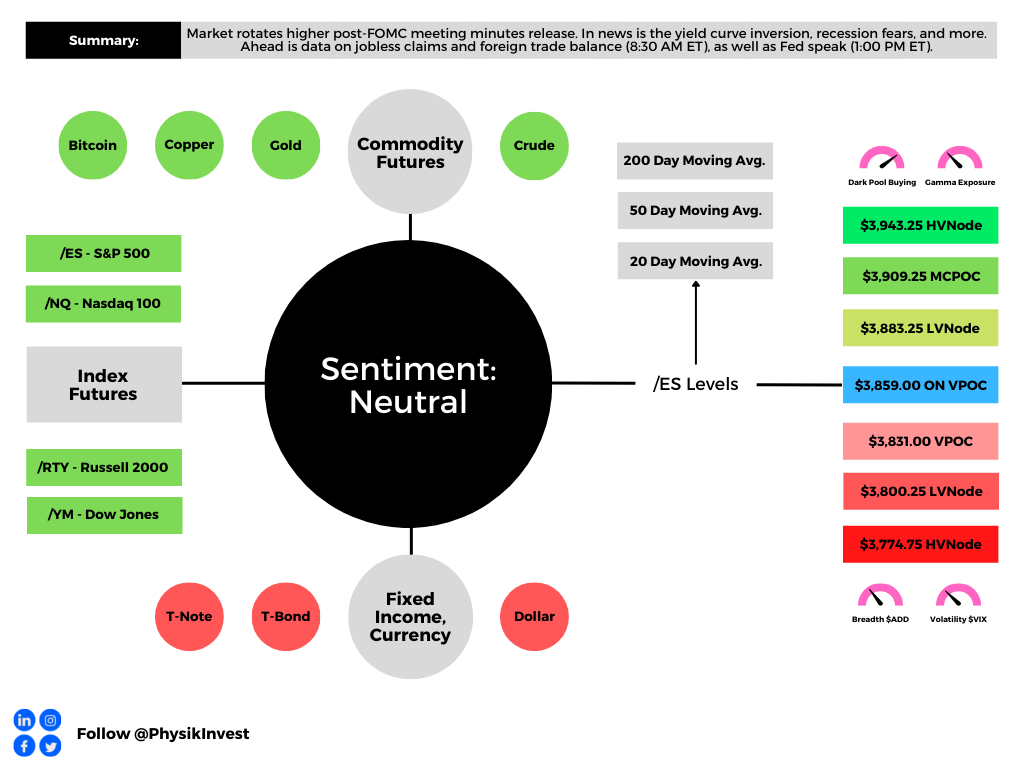
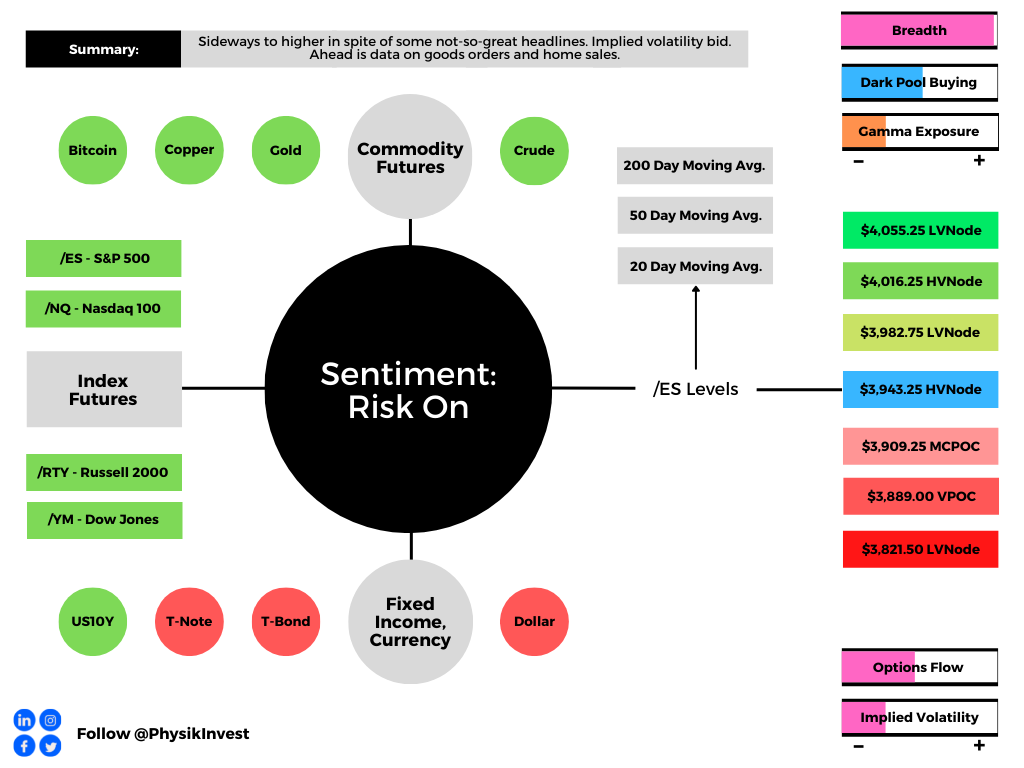
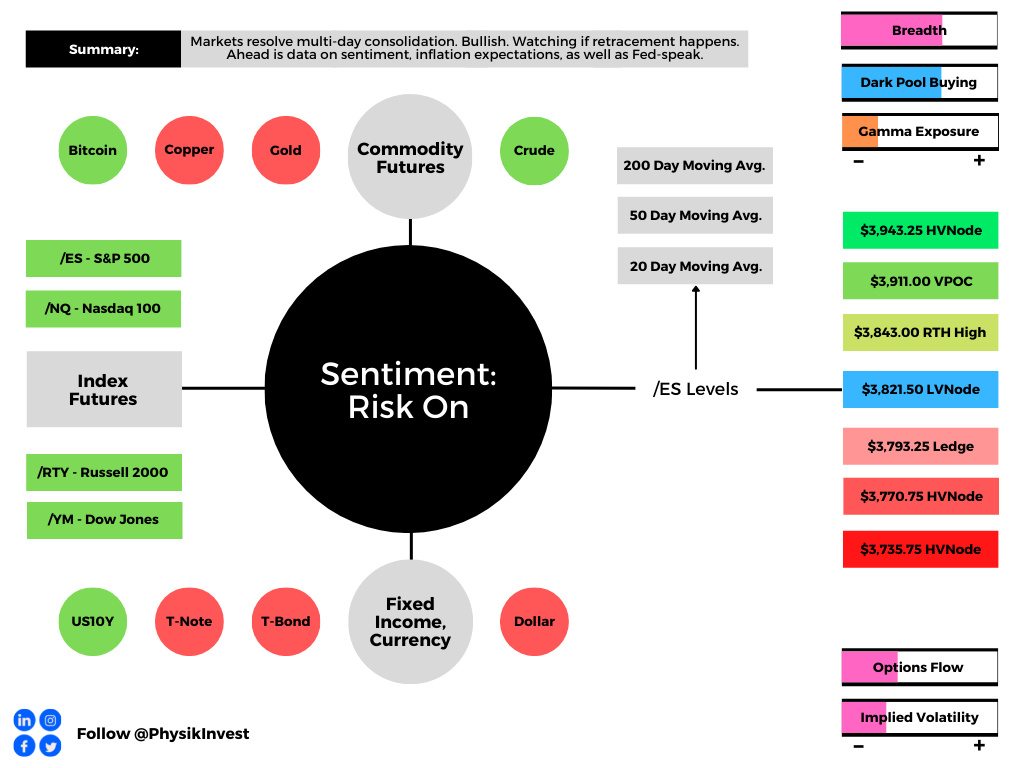
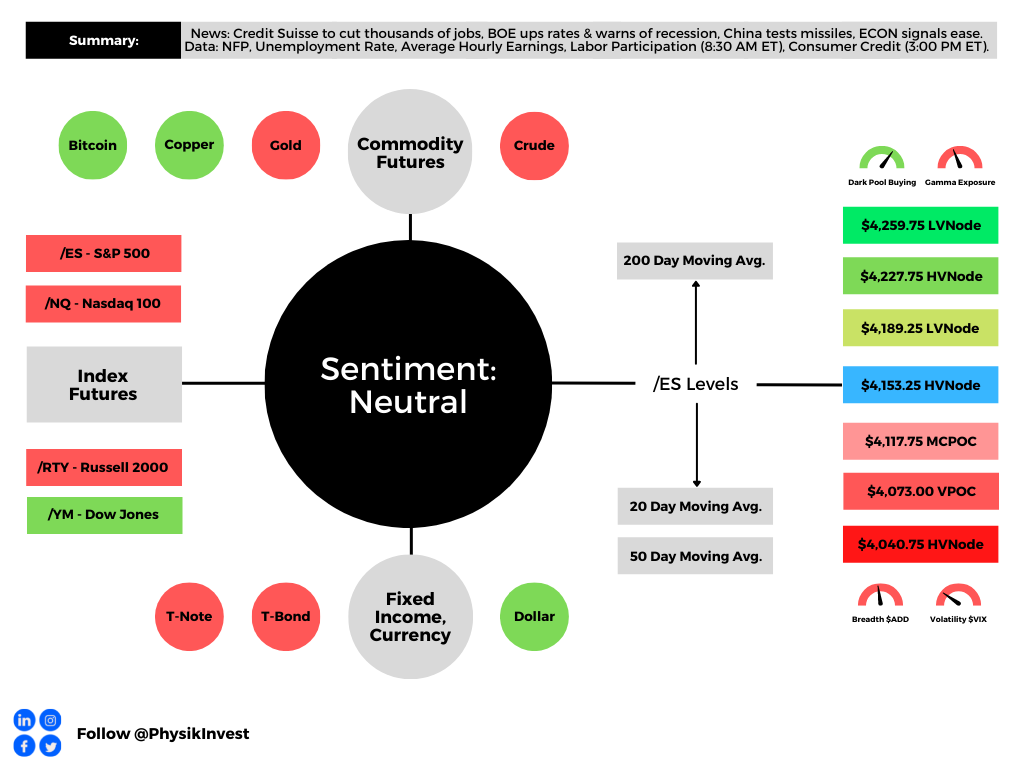
Graphic updated 7:45 AM ET. Sentiment Risk-On if expected /ES open is above the prior day’s range. /ES levels are derived from the profile graphic at the bottom of the following section. Levels may have changed since initially quoted; click here for the latest levels. SqueezeMetrics Dark Pool Index (DIX) and Gamma (GEX) calculations are based on where the prior day’s reading falls with respect to the MAX and MIN of all occurrences available. A higher DIX is bullish. At the same time, the lower the GEX, the more (expected) volatility. Learn the implications of volatility, direction, and moneyness. Breadth reflects a reading of the prior day’s NYSE Advance/Decline indicator. VIX reflects a current reading of the CBOE Volatility Index (INDEX: VIX) from 0-100.

Fundamental

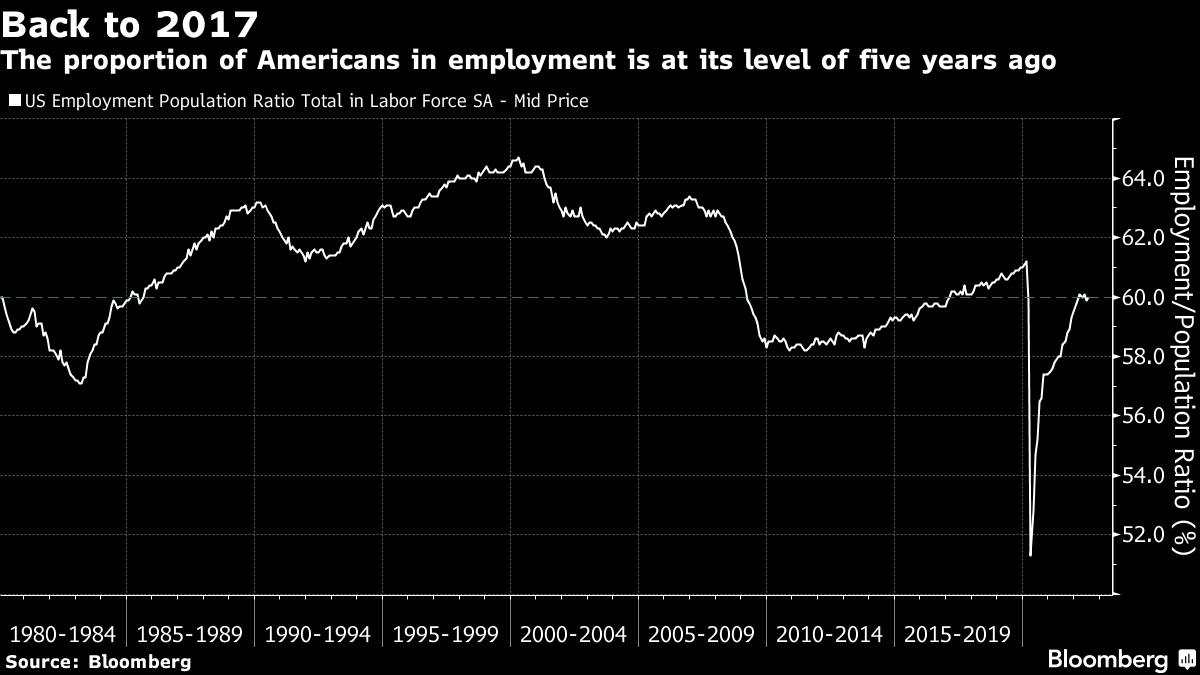
In a non-farm payroll update, it was shown that the US added more than two times the jobs many economists thought it would.

“Some of this is driven by a reduced participation rate – a smaller portion of the population seeking work and showing up in unemployment data,” Bloomberg’s John Authers explained

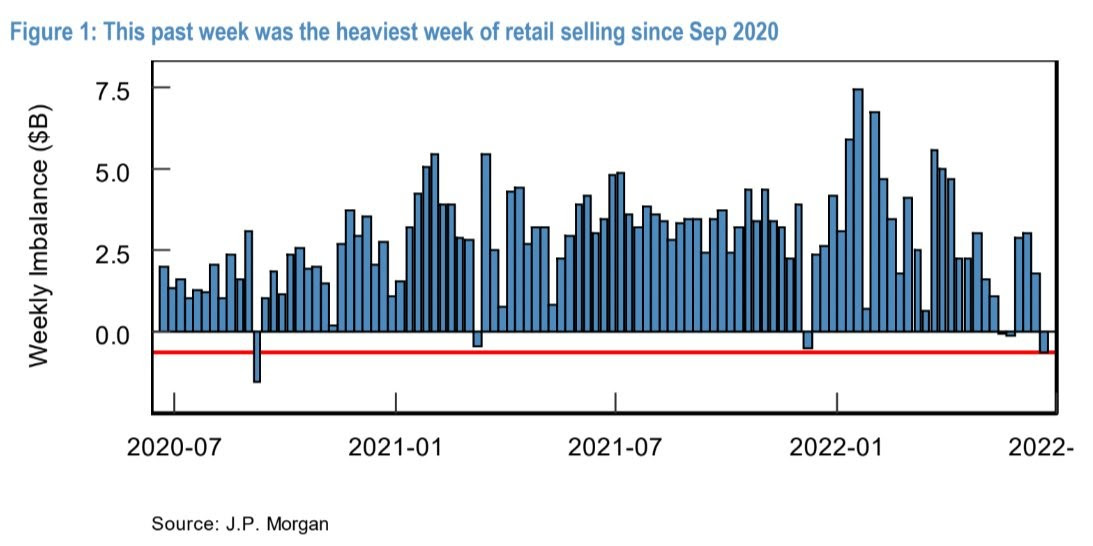
Graphic: Retrieved from Bloomberg.

“It now becomes much easier for the Federal Reserve (Fed) to [continue] rais[ing] rates. If the employment market is still strengthening, while inflation remains its highest in decades, it’s hard to see why it shouldn’t.”

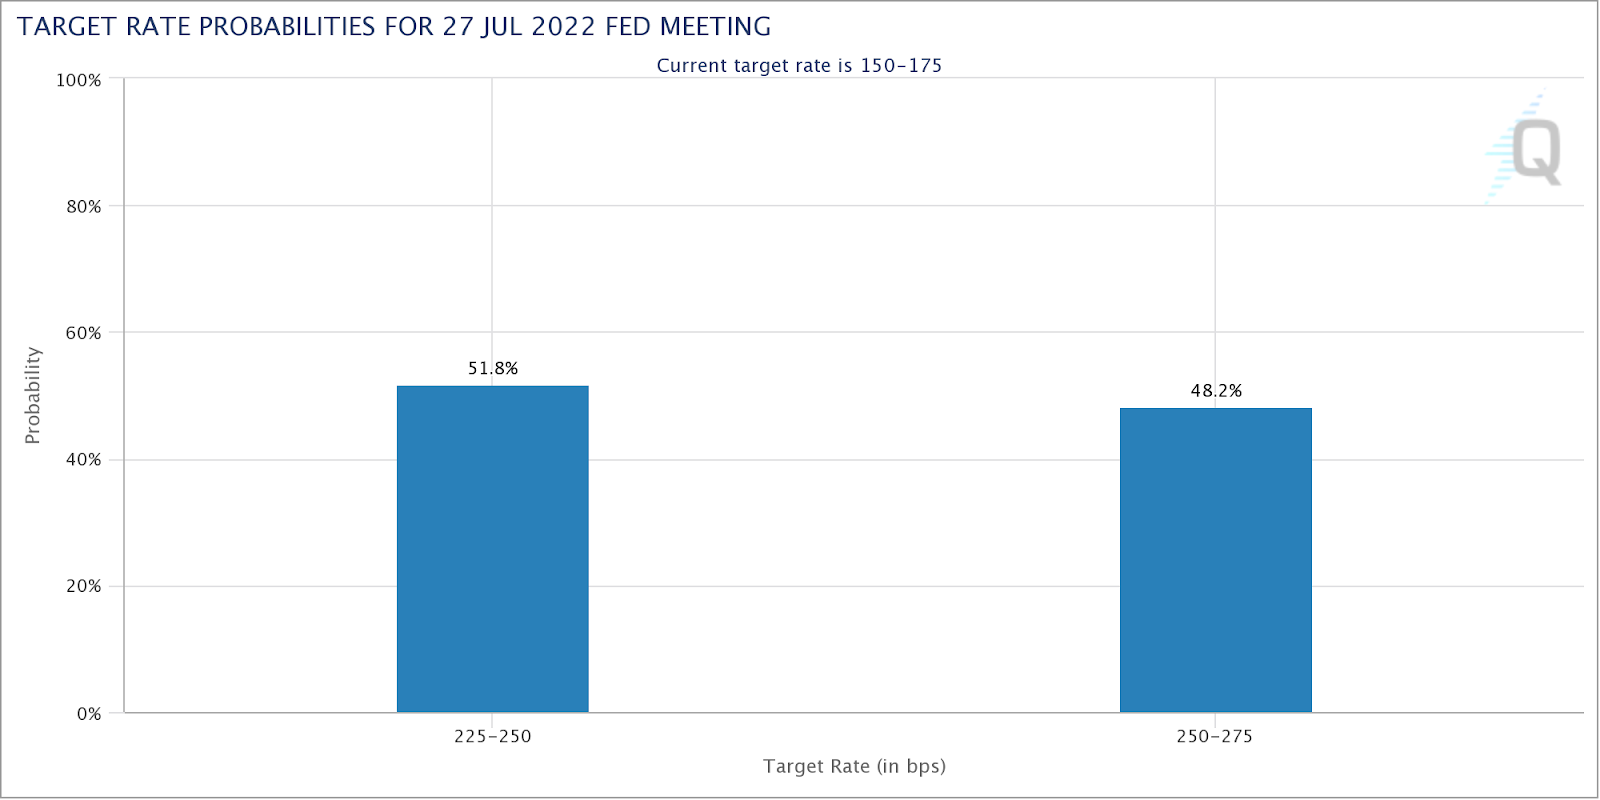
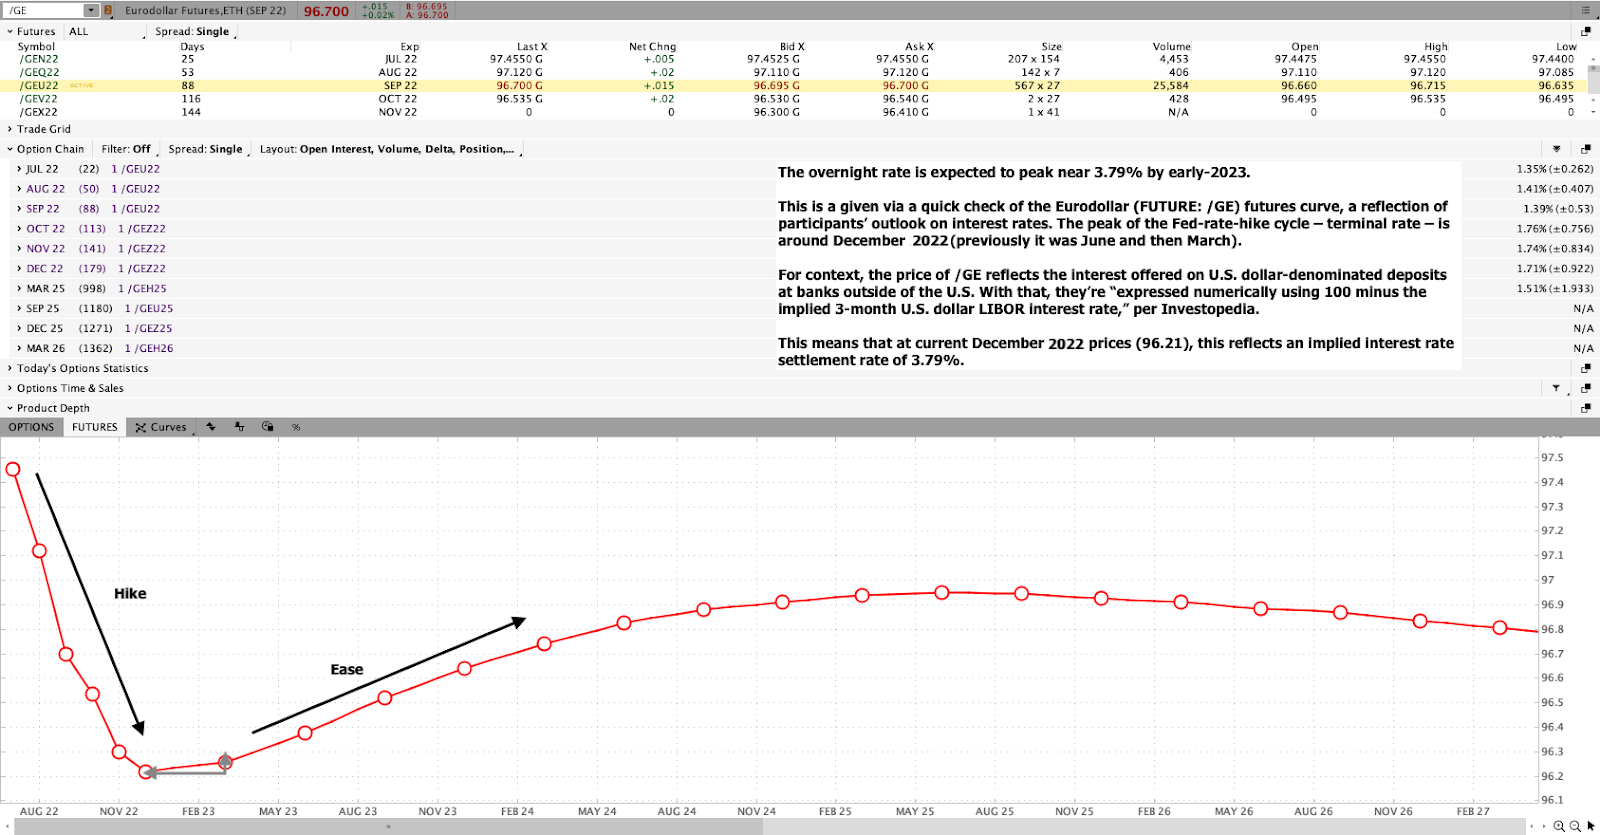
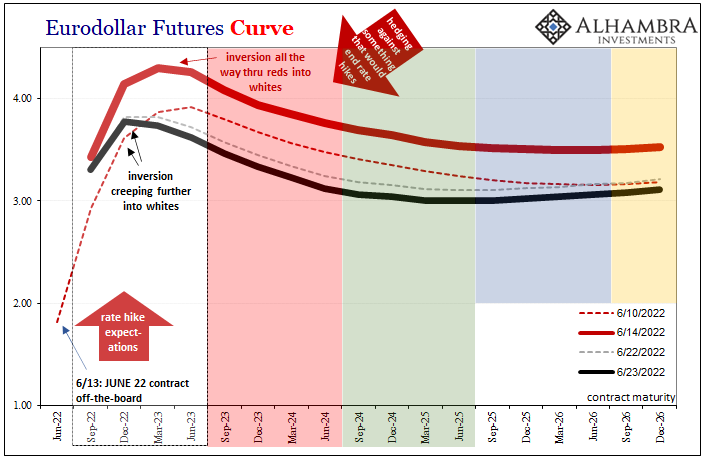
Accordingly, market participants are pricing a greater than 50% chance of the target Fed Funds rate increasing by 75 to 100 basis points to a target range of 300 and 325 basis points, up from 225 and 250 right now.
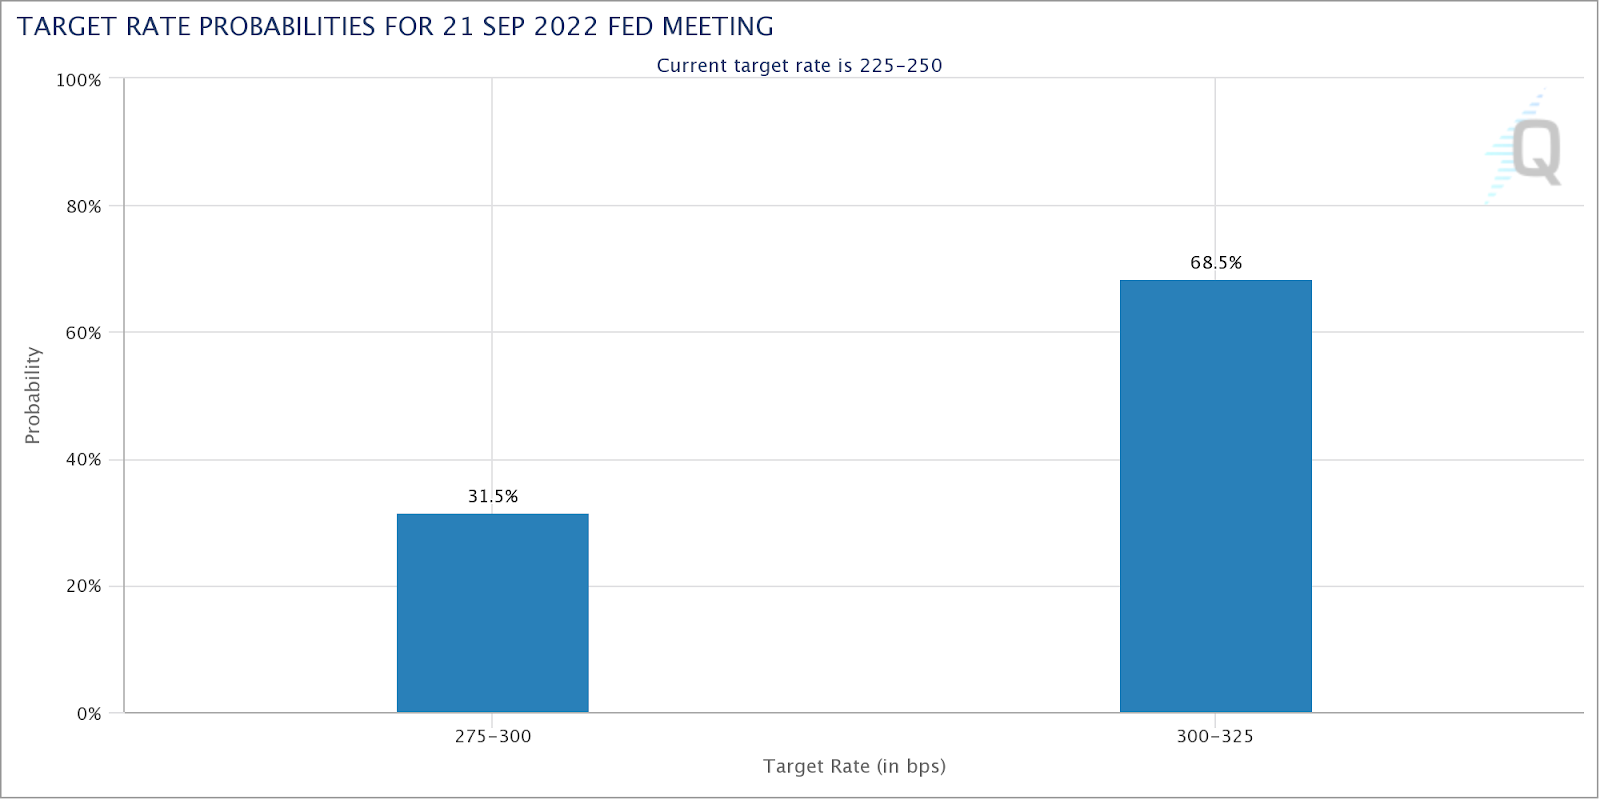
Graphic: Retrieved from CME Group Inc’s (NASDAQ: CME) FedWatch tool.

Therefore, in addition to this (projected tax increases, the expected high coupon issuance/QT doubling in September and Q4, and the like), the “knee jerk re-leveraging flow [is likely to] not survive,” per Damped Spring’s Andy Constan.

Additionally, Morgan Stanley (NYSE: MS) and Goldman Sachs Group Inc’s (NYSE: GS) strategists, both express an outlook at odds with the recent market rally on the back of “better-than-feared second-quarter earnings.”

Per MS’s Michael Wilson, the expectation profit margins will continue to expand into 2023 is “unrealistic due to sticky cost pressures and receding demand.”

“While prices to the end consumer are still rising at a rapid clip, prices for producers are rising at double the pace.”

GS’s David Kostin concurs and expects net margins to drop ~25 basis points in every sector led by energy, health care, and materials, Bloomberg summarizes.
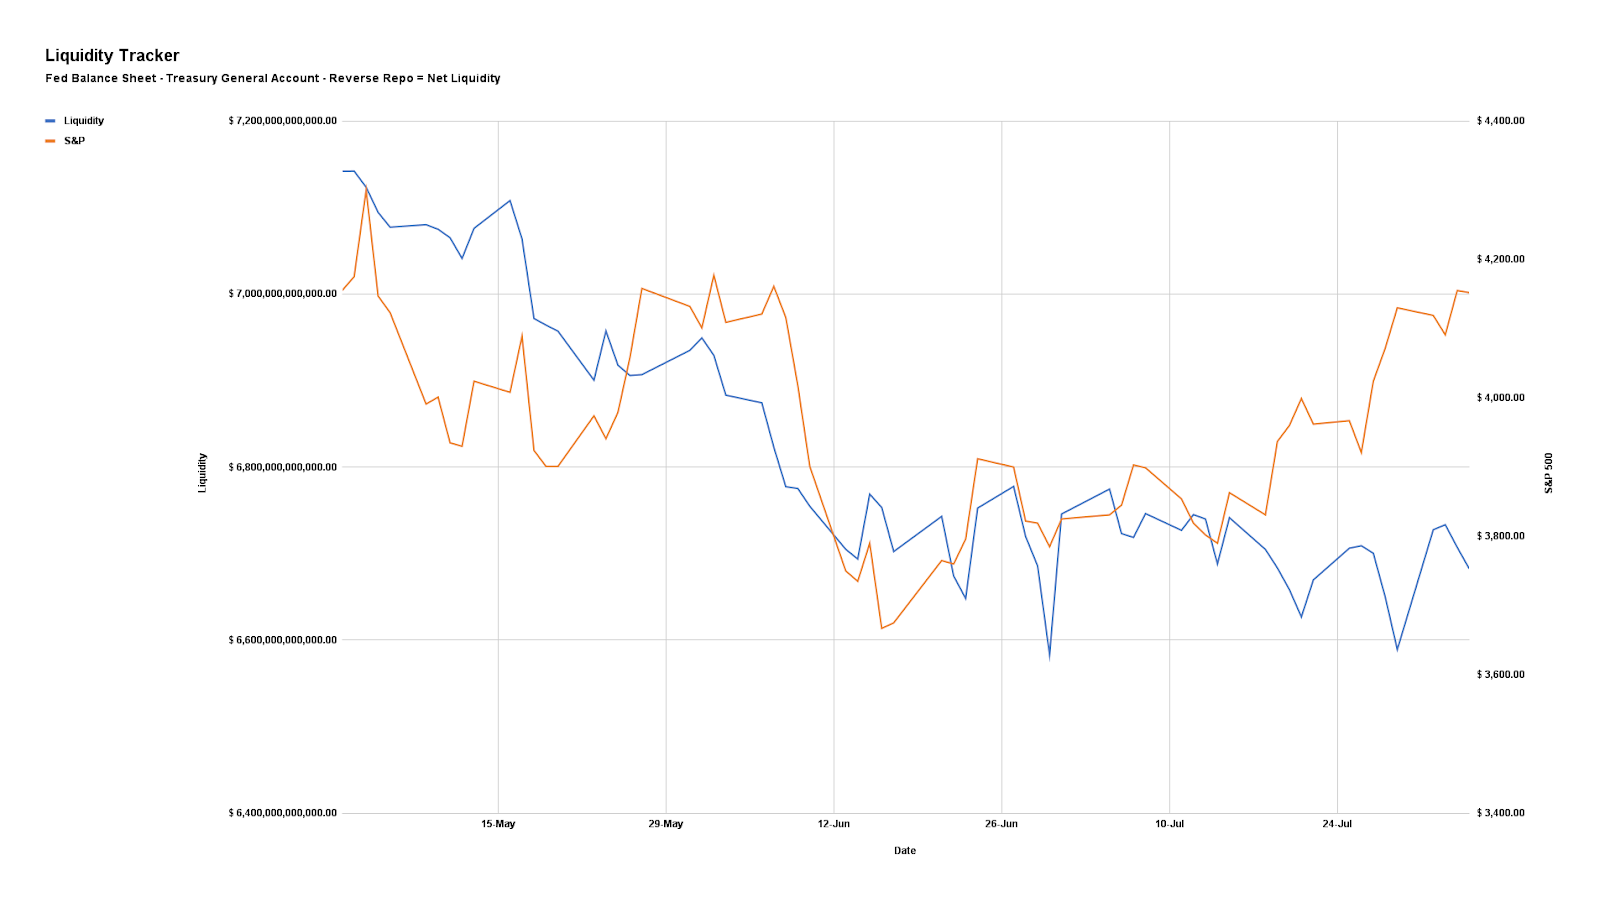
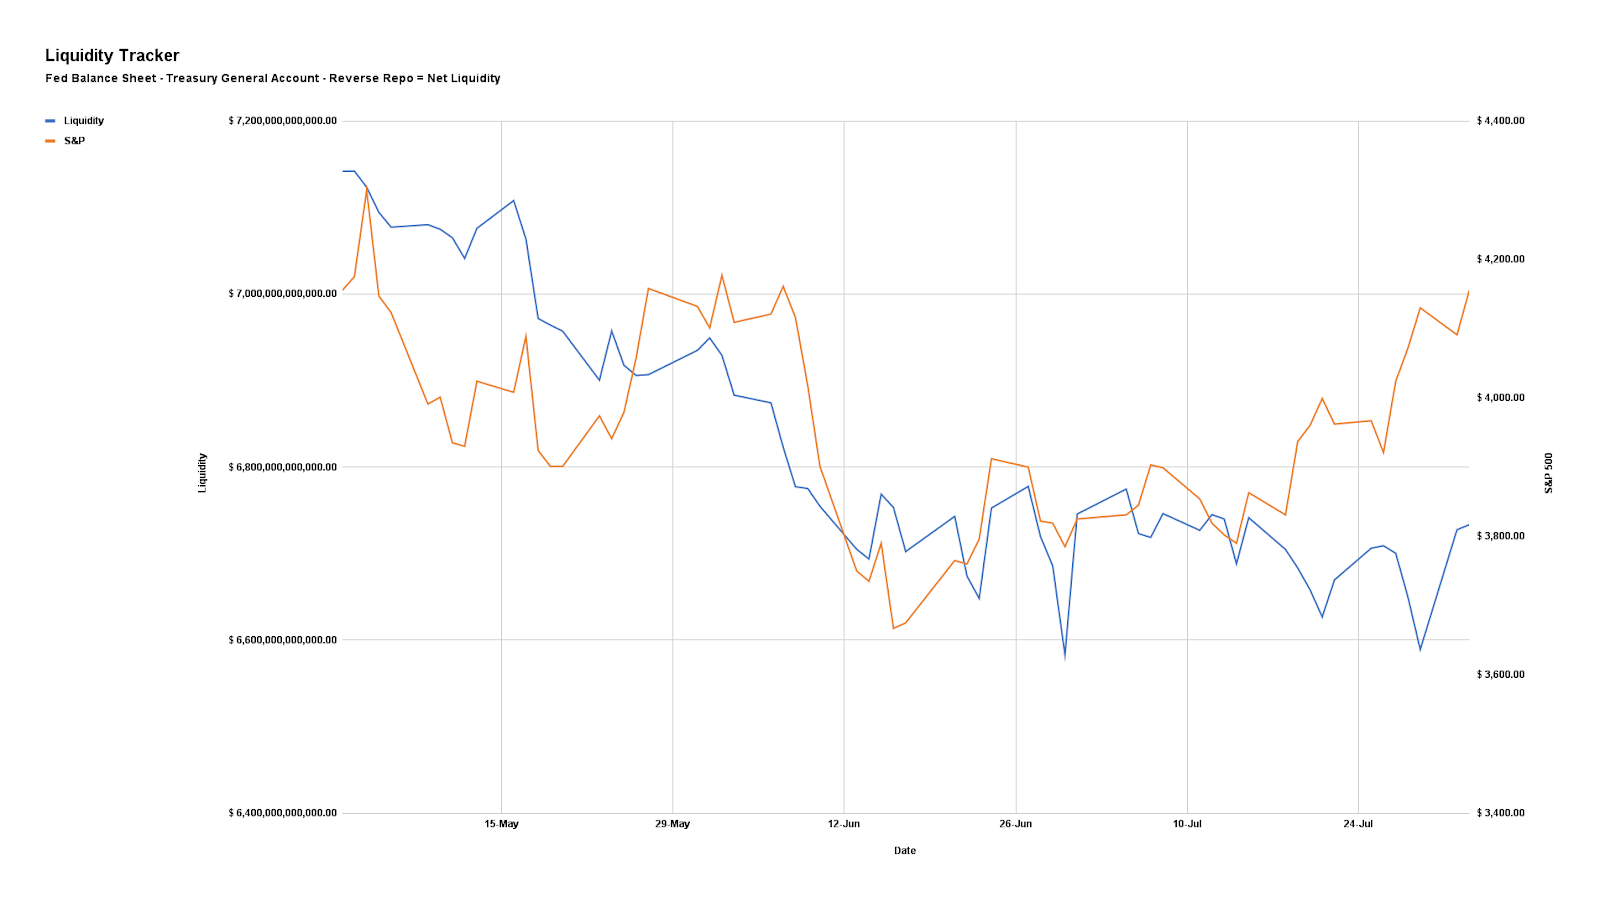
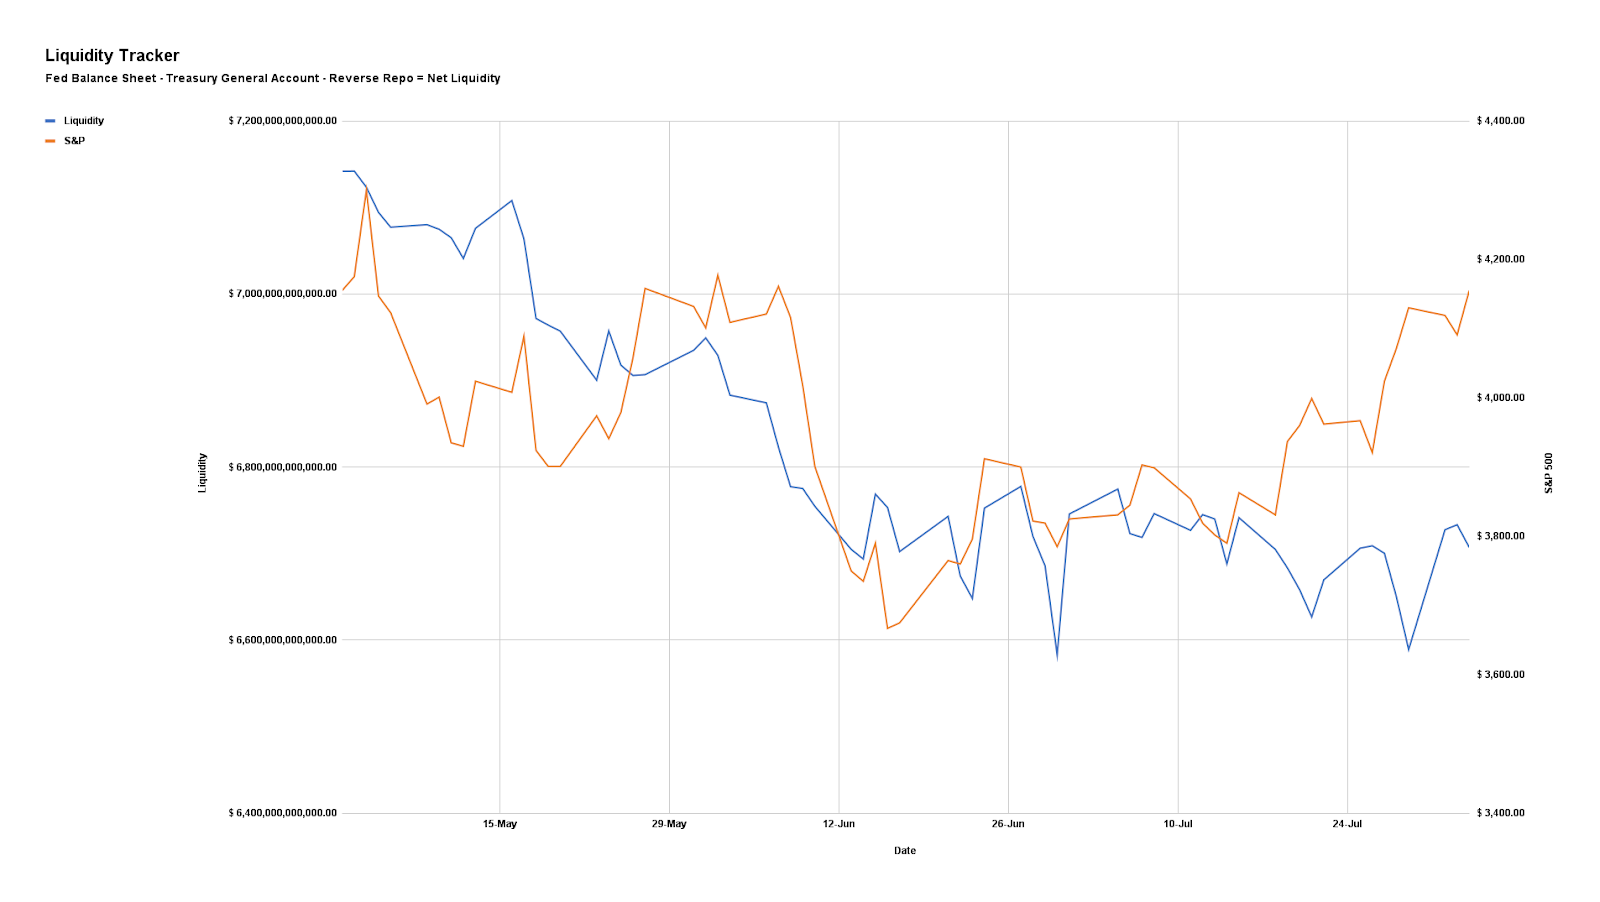
Graphic: Via Physik Invest. Data compiled by @jkonopas623. Fed Balance Sheet data, here. Treasury General Account Data, here. Reverse Repo data, here. NL = BS – TGA – RRP.

On the topic of geopolitical conflict, which we talked a lot about in the August 3 letter, the US’s Nancy Pelosi visited Taiwan last week prompting Chinese military exercises in the region.

Overall, it is likely not in China’s best interest to press the conflict much further,” Authers puts forth. “Taiwan’s role in the world’s electronics industry means that the global economic impact of any conflict could dwarf the disruptions of the last two years sparked by the pandemic.”

These disruptions would pain the world, including China.

Positioning

As of 6:40 AM ET, Monday’s expected volatility, via the Cboe Volatility Index (INDEX: VIX), sits at ~1.13%. Net gamma exposures decreasing may help with an expansion of range.

Given where realized (RVOL) and implied (IVOL) volatility measures are, as well as skew, it is beneficial to be a buyer of complex options structures (e.g., back spread).

Here’s our August 5 letter for more context.

For concision, we quote SpotGamma: “It’s the case when the fuel from a drop in option implied volatility is spent, as well as the sticky open interest at current prices rolls off, that options-related hedging does less to keep markets pinned.”

Technical

As of 6:40 AM ET, Monday’s regular session (9:30 AM – 4:00 PM ET), in the S&P 500, is likely to open in the upper part of a positively skewed overnight inventory, outside of prior-range and -value, suggesting a potential for immediate directional opportunity.

In the best case, the S&P 500 trades higher.

Any activity above the $4,153.25 HVNode puts into play the $4,189.25 LVNode. Initiative trade beyond the LVNode could reach as high as the $4,227.75 HVNode and $4,259.75 LVNode, or higher.

In the worst case, the S&P 500 trades lower.

Any activity below the $4,153.25 HVNode puts into play the $4,117.75 MCPOC. Initiative trade beyond the MCPOC could reach as low as the $4,073.00 VPOC and $4,040.75 HVNode, or lower.

Click here to load today’s key levels into the web-based TradingView charting platform. Note that all levels are derived using the 65-minute timeframe. New links are produced, daily.
Graphic: 65-minute profile chart of the Micro E-mini S&P 500 Futures.

Considerations: Responsiveness near key-technical areas (that are discernable visually on a chart), suggests technically-driven traders with short time horizons are very active. 

Such traders often lack the wherewithal to defend retests and, additionally, the type of trade may be indicative of the other time frame participants waiting for more information to initiate trades.

Definitions

Volume Areas: A structurally sound market will build on areas of high volume (HVNodes). Should the market trend for long periods of time, it will lack sound structure, identified as low volume areas (LVNodes). LVNodes denote directional conviction and ought to offer support on any test. 

If participants were to auction and find acceptance into areas of prior low volume (LVNodes), then future discovery ought to be volatile and quick as participants look to HVNodes for favorable entry or exit.

POCs: POCs are valuable as they denote areas where two-sided trade was most prevalent in a prior day session. Participants will respond to future tests of value as they offer favorable entry and exit.

MCPOCs: POCs are valuable as they denote areas where two-sided trade was most prevalent over numerous day sessions. Participants will respond to future tests of value as they offer favorable entry and exit.

Volume-Weighted Average Prices (VWAPs): A metric highly regarded by chief investment officers, among other participants, for quality of trade. Additionally, liquidity algorithms are benchmarked and programmed to buy and sell around VWAPs.

About

After years of self-education, strategy development, mentorship, and trial-and-error, Renato Leonard Capelj began trading full-time and founded Physik Invest to detail his methods, research, and performance in the markets.

Capelj also develops insights around impactful options market dynamics at SpotGamma and is a Benzinga reporter.

Some of his works include conversations with ARK Invest’s Catherine Wood, investors Kevin O’Leary and John Chambers, FTX’s Sam Bankman-Fried, ex-Bridgewater Associate Andy Constan, Kai Volatility’s Cem Karsan, The Ambrus Group’s Kris Sidial, among many others.

Disclaimer

In no way should the materials herein be construed as advice. Derivatives carry a substantial risk of loss. All content is for informational purposes only.

Categories
Commentary

Daily Brief For August 5, 2022

The daily brief is a free glimpse into the prevailing fundamental and technical drivers of U.S. equity market products. Join the 750+ that read this report daily, below!

Graphic updated 7:00 AM ET. Sentiment Neutral if expected /ES open is inside of the prior day’s range. /ES levels are derived from the profile graphic at the bottom of the following section. Levels may have changed since initially quoted; click here for the latest levels. SqueezeMetrics Dark Pool Index (DIX) and Gamma (GEX) calculations are based on where the prior day’s reading falls with respect to the MAX and MIN of all occurrences available. A higher DIX is bullish. At the same time, the lower the GEX, the more (expected) volatility. Learn the implications of volatility, direction, and moneyness. Breadth reflects a reading of the prior day’s NYSE Advance/Decline indicator. VIX reflects a current reading of the CBOE Volatility Index (INDEX: VIX) from 0-100.

Fundamental

Shortened fundamentals section, today.

It’s the case that from mid-2020 to late-2021, as well explained by Damped Spring’s Andy Constan, the decline in risk premiums boosted assets, across the board.

Then, when “the drumbeats of quantitative tightening (QT) sounded on December 29,” the expansion in risk premiums bolstered a rotation out of risk.

Per Constan, conditions are unchanged. 

The “knee jerk re-leveraging flow [] will not survive the high coupon issuance/QT doubling of the September and Q4. Fade the [fear of missing out] until Turkey day when Santa comes to town.”

Graphic: Via Physik Invest. Data compiled by @jkonopas623. Fed Balance Sheet data, here. Treasury General Account Data, here. Reverse Repo data, here. NL = BS – TGA – RRP.

Positioning

As of 7:00 AM ET, Thursday’s expected volatility, via the Cboe Volatility Index (INDEX: VIX), sits at ~1.14%. Net gamma exposures are increasing which may promote tighter ranges.

Further, given where realized (RVOL) and implied (IVOL) volatility are, as well as skew, it is beneficial to be a buyer of options structures (e.g., put back spread and/or call ratio spread).

Here is some context.

Per past letters, such as the Daily Brief for August 2, the monetization and counterparty hedging of existing customer volatility (i.e., options) hedges, as well as the sale of short-dated volatility, particularly in some single stocks where there was “rich” volatility into the fall, lent to lackluster performance in IVOL and index mean reversion.

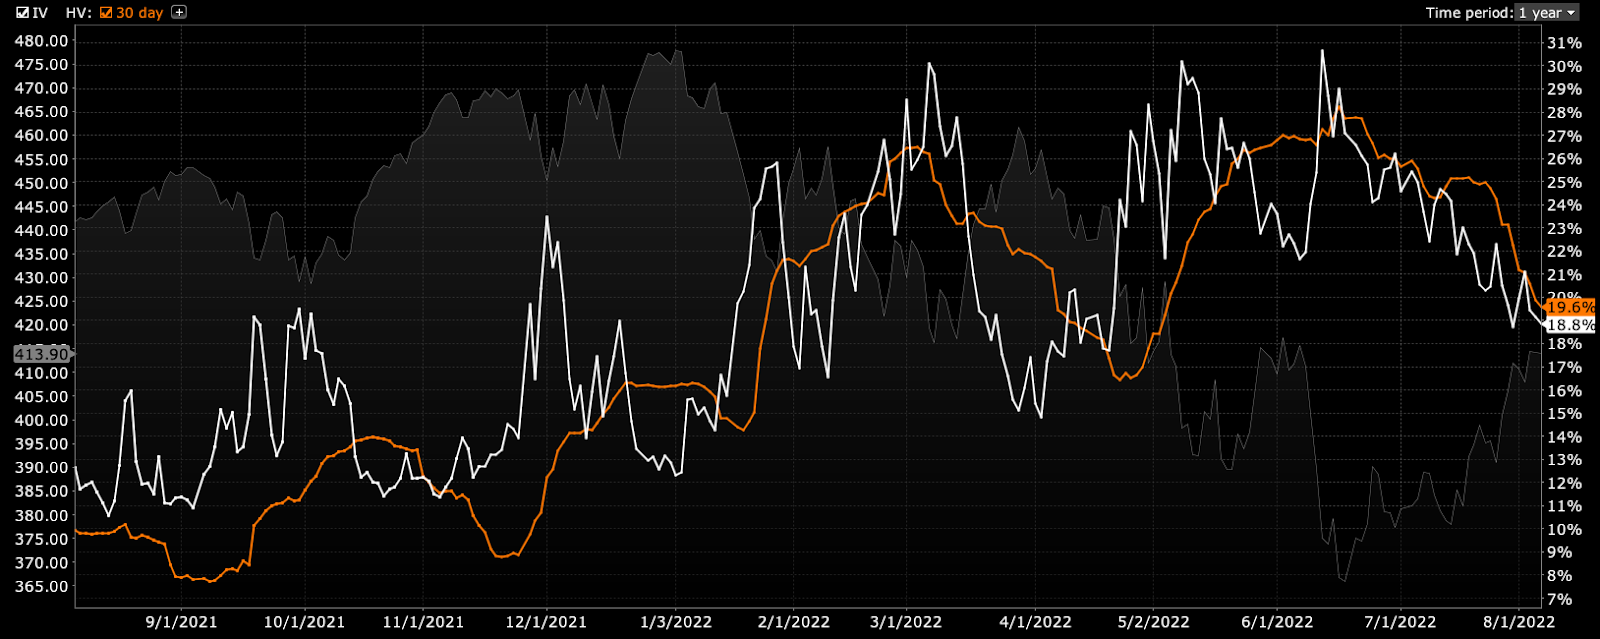
Graphic: RVOL (orange) versus IVOL (white) on the S&P 500 (INDEX: SPX).

These forces have only grown and are, presently, adding to the stickiness of the move higher. 

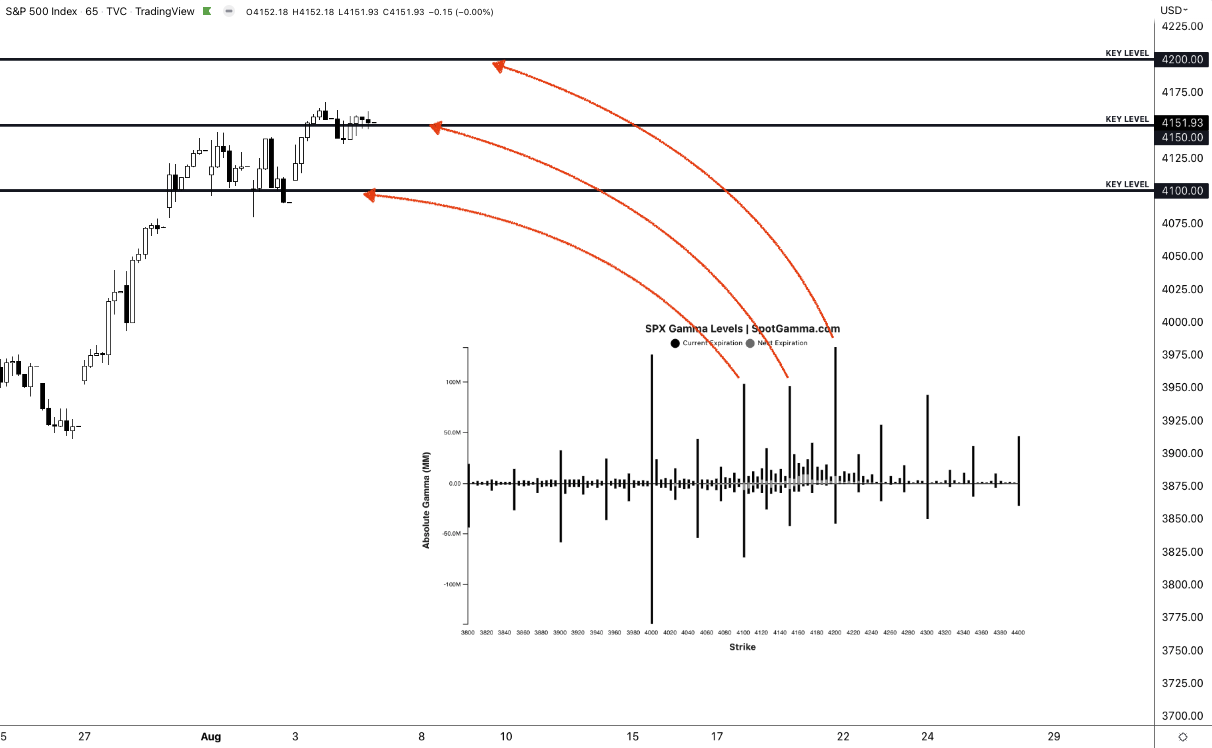
Graphic: Retrieved from SpotGamma on 8/4/2022.

Why? 

Well – though naive – if we take participants as trading similar to the way they do historically (i.e., buying stocks and hedging by selling calls and buying puts), the counterparty is left with a bullish trade (i.e., short put, long call). 

Depending on (A) where the market is in relation to this exposure, as well as (B) where this exposure is more concentrated, the call or put side may solicit increased hedging activities.

Today, with markets trading higher and participants becoming increasingly active on the call side, the counterparties have a trade that is (becoming increasingly) bullish; positive delta (i.e., exposure to direction) and gamma (i.e., rate of change of exposure to direction) are growing.

Further, knowing that participants are concentrating their bets on options close to current market prices, which are very short-dated (and with little time to expiration), the counterparty’s exposure is way more sensitive to changes in direction because options can go from having a lot of value to very little in a small window (of time and movement). 

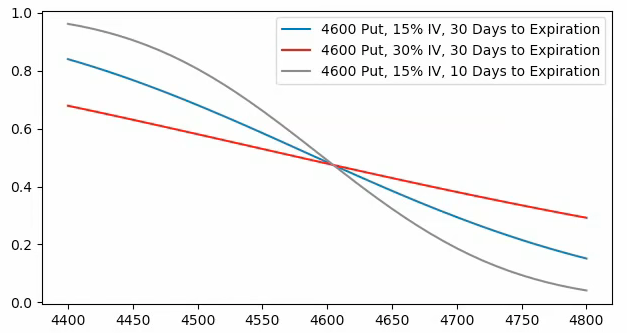
In other words, it is a fact that an option that is at the money can go from having a near 50% chance of expiring in the money to 0%. However, if the time to expiry is shorter, then the speed at which these options may go from a near 50% chance of expiring in the money to 0% rises.

That’s probably one of the simplest ways one could explain put it.

Therefore (with activity becoming more concentrated at options strikes near current price, all the while IVOL continues to fall), into weakness, counterparties lean toward buying (selling) dips (rips).

Adding:

If you (like a counterparty) own a call option and want no exposure to the positive payoff when the market moves higher, you sell the underlying asset (e.g., stock, future).

If the market is sideways and slightly lower, while volatility is generally trending lower, as it is recently, and your option declines in value, then you must rebalance your hedge. So, you would buy (cover) some of your existing short stock and futures position to rebalance your deltas.

That’s supportive.

Read: SqueezeMetrics’ “The Implied Order Book” for more regarding the impact of options trade on underlying liquidity.

Moreover, the trends above may be coming to an end as entities are squeezed out of trades that aren’t working (i.e., participants continue to rotate out of poor-performing volatility and commodities). 

Accordingly, Kai Volatility’s Cem Karsan explains that markets can, now, as that suppressive options activity fades, potentially, “really begin to respond to the core macro factors.”

Here’s why.

Should markets experience a shock (e.g., China and U.S. tensions escalate), the new demand for hedges may result in an “untethering” in IVOL, which was “one of the most supportive things into the decline,” Karsan explained.

That means that now is the best time to rotate into call options that are outperforming “their delta to the upside.”

Graphic: Via Banco Santander SA (NYSE: SAN) research, the return profile, at expiry, of a classic 1×2 (long 1, short 2 further away) ratio spread.

You may ask: what’s bolstering some of the market’s strength, in the shorter term?

In spite of negative macro narratives, as IVOL continues to decline and options, in general, are less sought after per their poor performance, what’s providing an added boost is the “cohort of quantitative-based investment strategies [buying] equities when volatility is lower,” according to statements by the Wall Street Journal.

“This year, these so-called systematic strategies have exited the market to historically low levels, meaning they have plenty of buying power.”

Much more next week! Talk soon.

Technical

As of 7:00 AM ET, Thursday’s regular session (9:30 AM – 4:00 PM ET), in the S&P 500, is likely to open in the middle part of a balanced overnight inventory, just inside of prior-range and -value, suggesting a limited potential for immediate directional opportunity.

In the best case, the S&P 500 trades higher.

Any activity above the $4,153.25 HVNode puts into play the $4,189.25 LVNode. Initiative trade beyond the LVNode could reach as high as the $4,227.75 HVNode and $4,259.75 LVNode, or higher.

In the worst case, the S&P 500 trades lower.

Any activity below the $4,153.25 HVNode puts into play the $4,117.75 MCPOC. Initiative trade beyond the MCPOC could reach as low as the $4,073.00 VPOC and $4,040.75 HVNode, or lower.

Click here to load today’s key levels into the web-based TradingView charting platform. Note that all levels are derived using the 65-minute timeframe. New links are produced, daily.
Graphic: 65-minute profile chart of the Micro E-mini S&P 500 Futures.

Considerations: Responsiveness near key-technical areas (that are discernable visually on a chart), suggests technically-driven traders with short time horizons are very active. 

Such traders often lack the wherewithal to defend retests and, additionally, the type of trade may be indicative of the other time frame participants waiting for more information to initiate trades.

Definitions

Volume Areas: A structurally sound market will build on areas of high volume (HVNodes). Should the market trend for long periods of time, it will lack sound structure, identified as low volume areas (LVNodes). LVNodes denote directional conviction and ought to offer support on any test. 

If participants were to auction and find acceptance into areas of prior low volume (LVNodes), then future discovery ought to be volatile and quick as participants look to HVNodes for favorable entry or exit.

POCs: POCs are valuable as they denote areas where two-sided trade was most prevalent in a prior day session. Participants will respond to future tests of value as they offer favorable entry and exit.

MCPOCs: POCs are valuable as they denote areas where two-sided trade was most prevalent over numerous day sessions. Participants will respond to future tests of value as they offer favorable entry and exit.

Volume-Weighted Average Prices (VWAPs): A metric highly regarded by chief investment officers, among other participants, for quality of trade. Additionally, liquidity algorithms are benchmarked and programmed to buy and sell around VWAPs.

About

After years of self-education, strategy development, mentorship, and trial-and-error, Renato Leonard Capelj began trading full-time and founded Physik Invest to detail his methods, research, and performance in the markets.

Capelj also develops insights around impactful options market dynamics at SpotGamma and is a Benzinga reporter.

Some of his works include conversations with ARK Invest’s Catherine Wood, investors Kevin O’Leary and John Chambers, FTX’s Sam Bankman-Fried, ex-Bridgewater Associate Andy Constan, Kai Volatility’s Cem Karsan, The Ambrus Group’s Kris Sidial, among many others.

Disclaimer

In no way should the materials herein be construed as advice. Derivatives carry a substantial risk of loss. All content is for informational purposes only.

Categories
Commentary

Daily Brief For August 4, 2022

The daily brief is a free glimpse into the prevailing fundamental and technical drivers of U.S. equity market products. Join the 750+ that read this report daily, below!

Graphic updated 7:10 AM ET. Sentiment Neutral if expected /ES open is inside of the prior day’s range. /ES levels are derived from the profile graphic at the bottom of the following section. Levels may have changed since initially quoted; click here for the latest levels. SqueezeMetrics Dark Pool Index (DIX) and Gamma (GEX) calculations are based on where the prior day’s reading falls with respect to the MAX and MIN of all occurrences available. A higher DIX is bullish. At the same time, the lower the GEX, the more (expected) volatility. Learn the implications of volatility, direction, and moneyness. Breadth reflects a reading of the prior day’s NYSE Advance/Decline indicator. VIX reflects a current reading of the CBOE Volatility Index (INDEX: VIX) from 0-100.

Fundamental

A heavy week content-wise. 

Monday, we talked about some of the big narratives participants are seeking to price. Tuesday and Wednesday we elaborated, providing information on the calculation of net liquidity and its relationship with equity index prices, as well as the probable paths the economy may traverse.

Today, we’ll add context with respect to some of the big headlines heading into today’s trade.

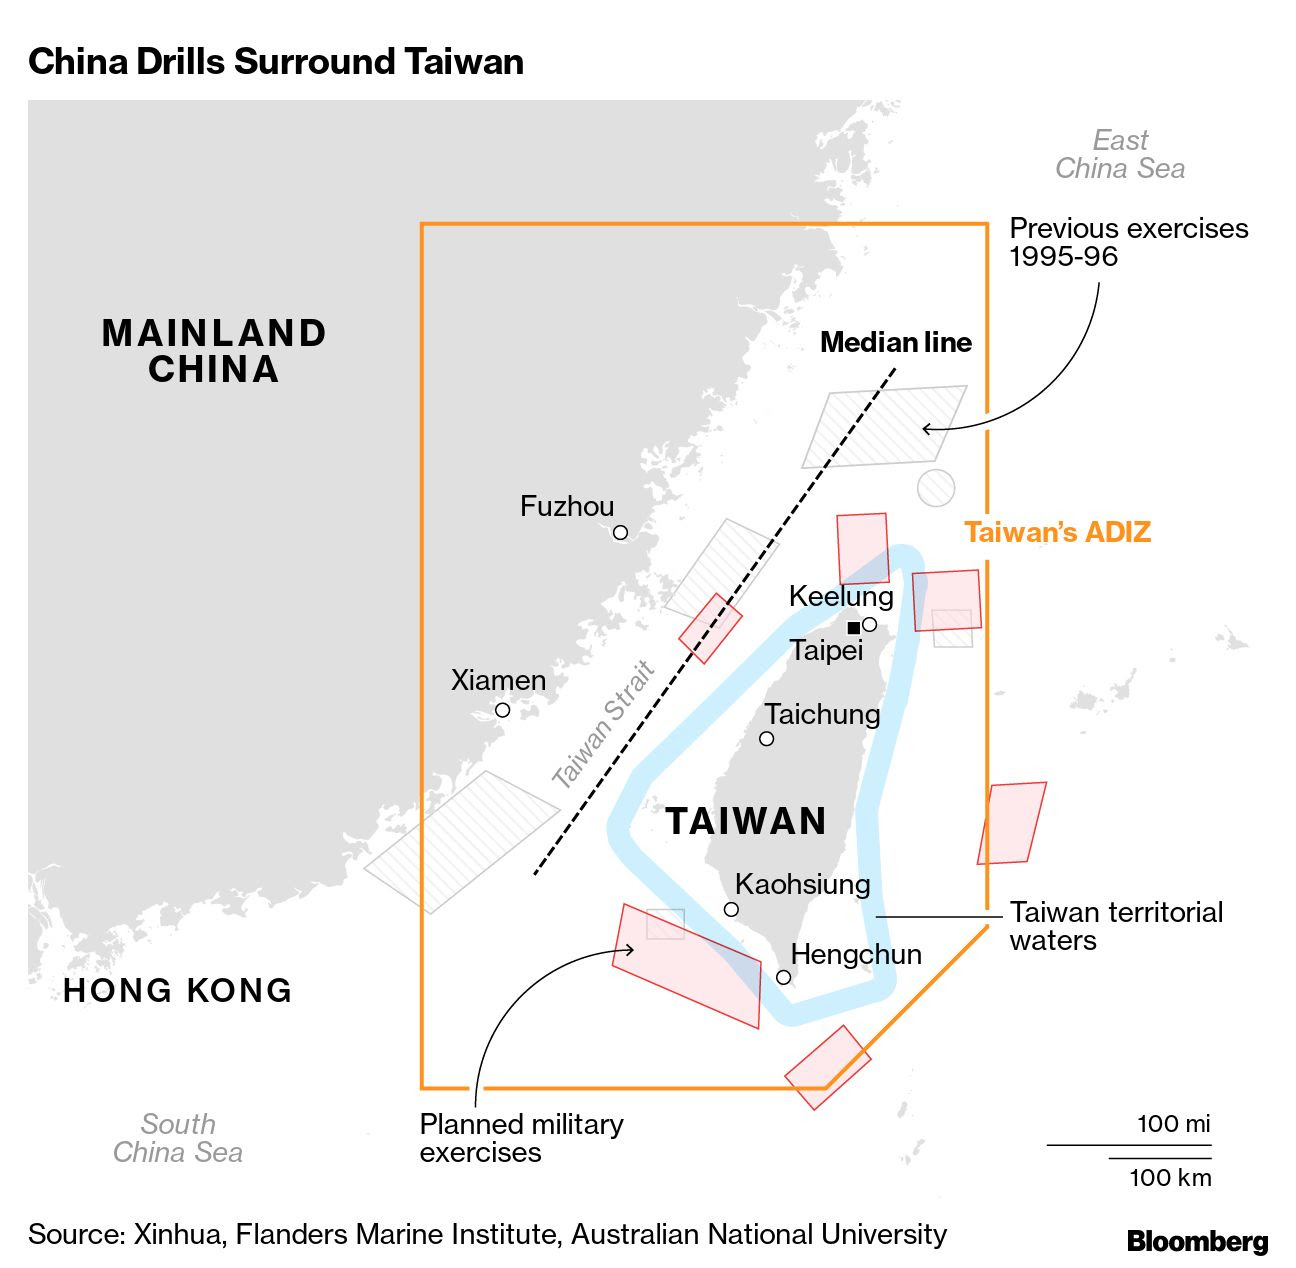
At the top of the list is geopolitical tension. US House Speaker Nancy Pelosi traveled to Taiwan. 

It’s the case that “China views Taiwan as a breakaway island” subject to mainland rules. The visit by Pelosi, who, per NPR, “has long been a critic of China and an advocate for Taiwan’s democracy,” China viewed as a provocation.

Accordingly, China responded with trade boycotts and military exercises such as the firing of 11 missiles into the sea around Taiwan.

Graphic: Retrieved from Bloomberg.

White House officials, per Bloomberg, were said to be “fuming” at Pelosi. In response, the Biden administration was seeking to put brakes on friendlier US and Taiwan policies.

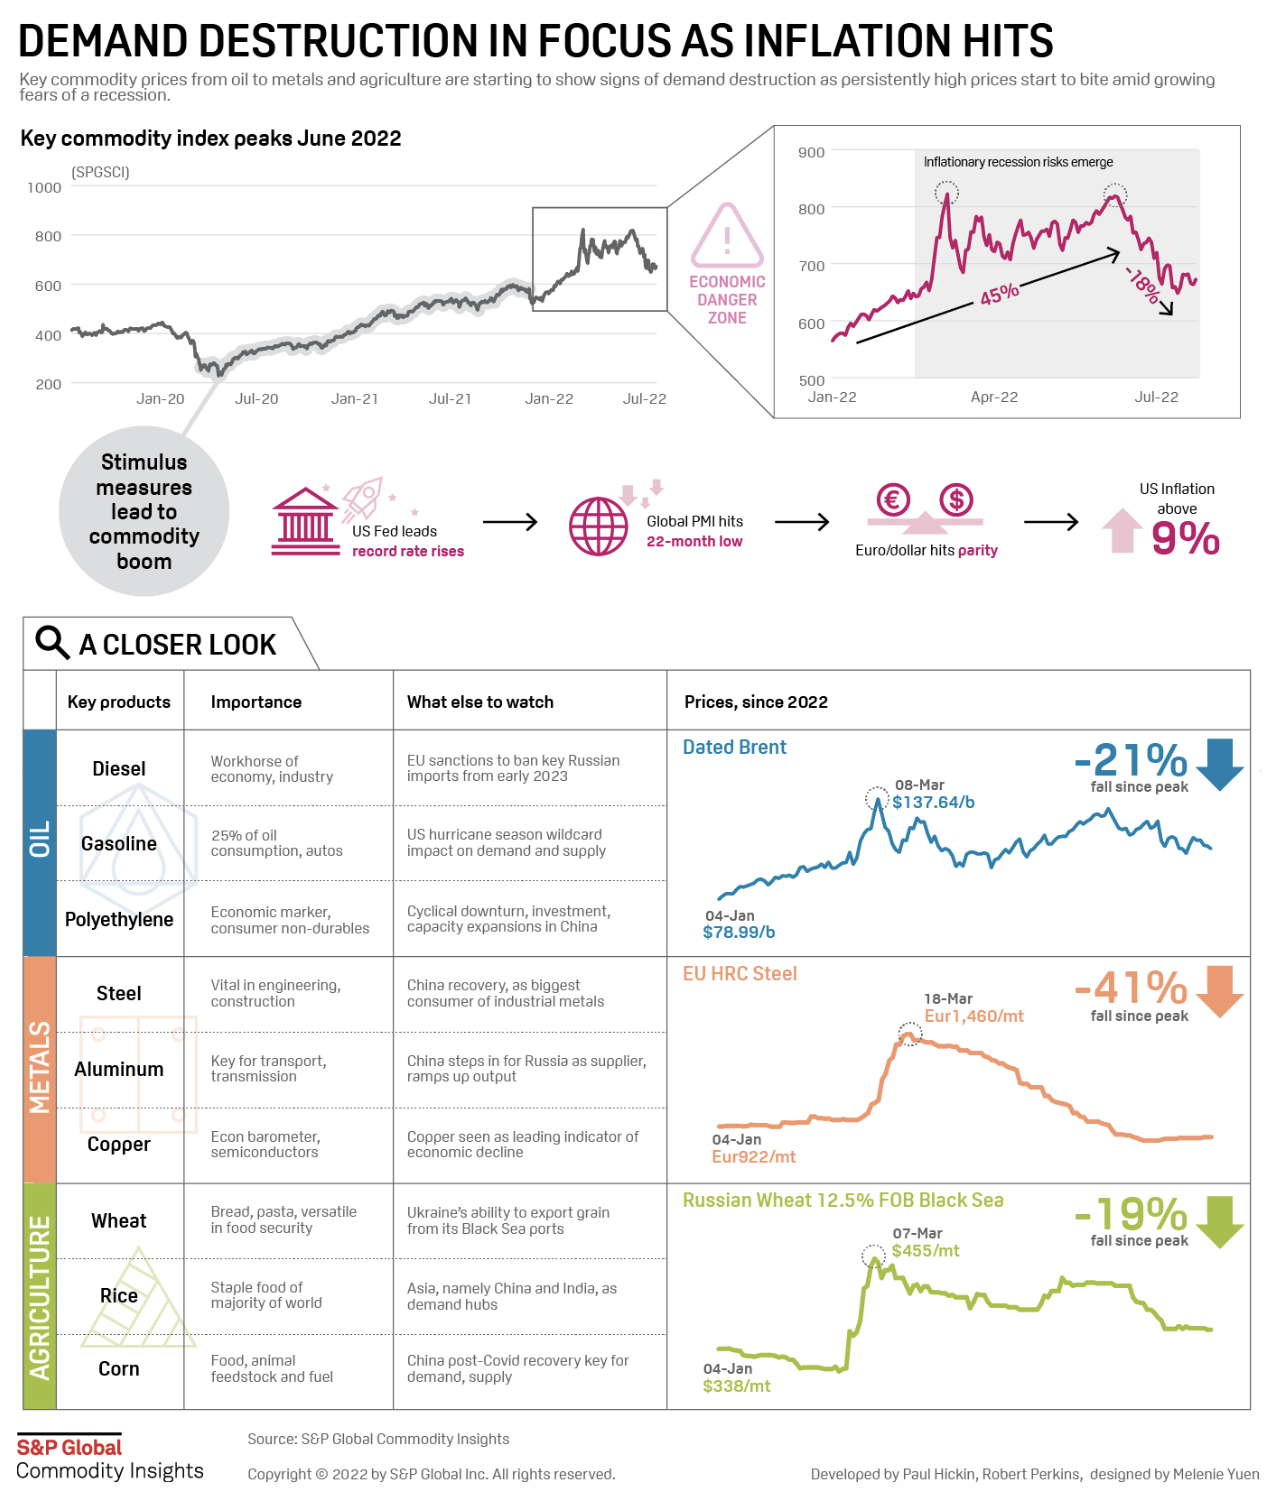
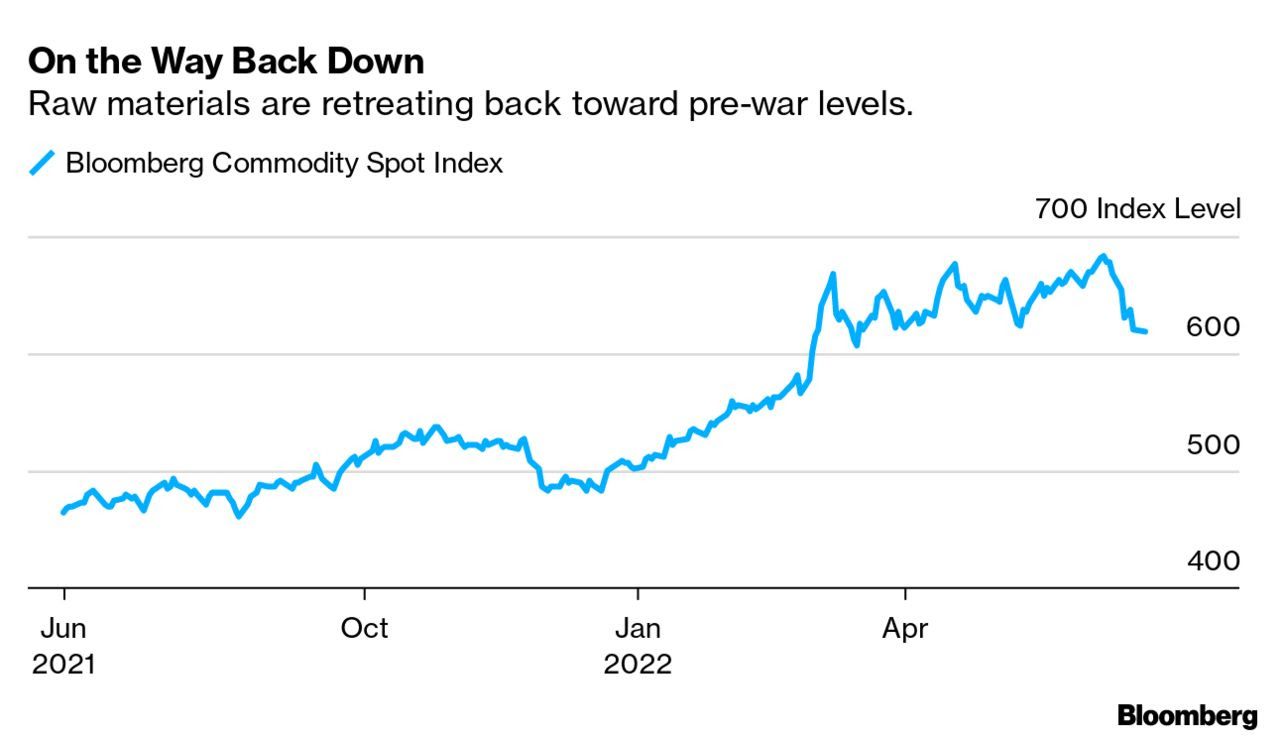
In other news, an ISM Services reading climbed unexpectedly, easing the concern of economic slowing while other data showed material and commodity prices falling.

Graphic: Retrieved from S&P Global Inc’s (NYSE: SPGI) commodity insights.

Still, more firms, from the likes of Credit Suisse Group AG (NYSE: CS) to Robinhood Markets Inc (NASDAQ: HOOD), are seeking to cut thousands of jobs and restructure.

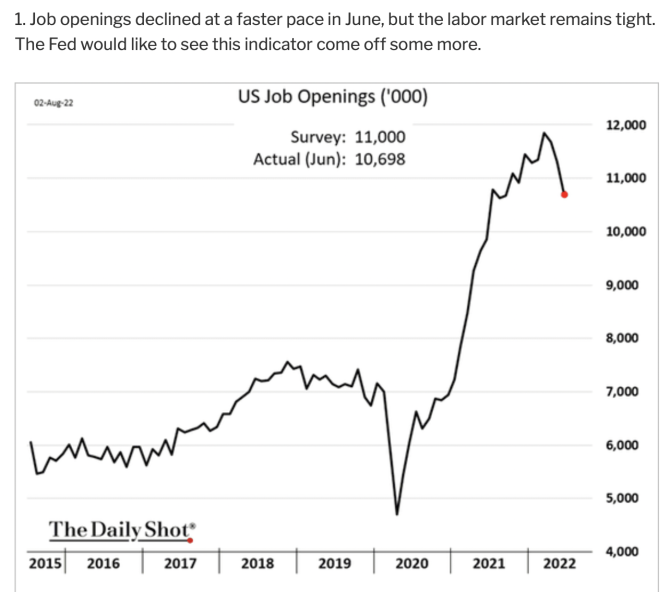
Graphic: Retrieved from The Daily Shot.

And, though equity markets are enjoying some relief, profit forecasts continue to be cut, and broad measures of the supply of money are falling.

Graphic: Via Physik Invest. Data compiled by @jkonopas623. Fed Balance Sheet data, here. Treasury General Account Data, here. Reverse Repo data, here. NL = BS – TGA – RRP.

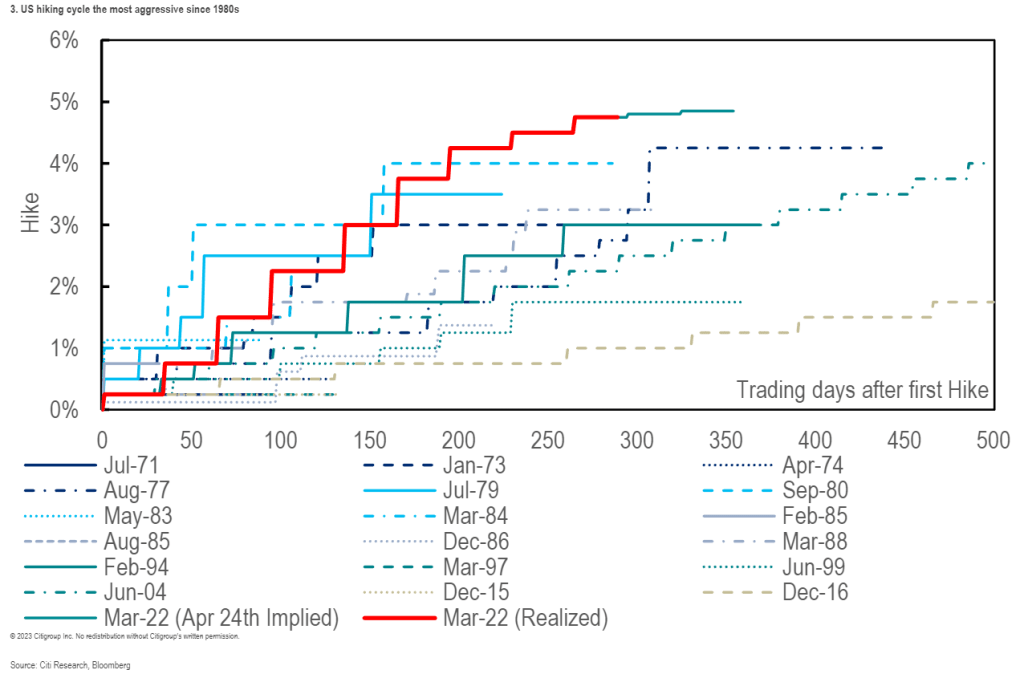
Additionally, many maintain that conditions are set to get tighter with the Bank of England raising rates the most since 1995 and a Fed funds rate of 5-6% not out of the realm of possibilities.

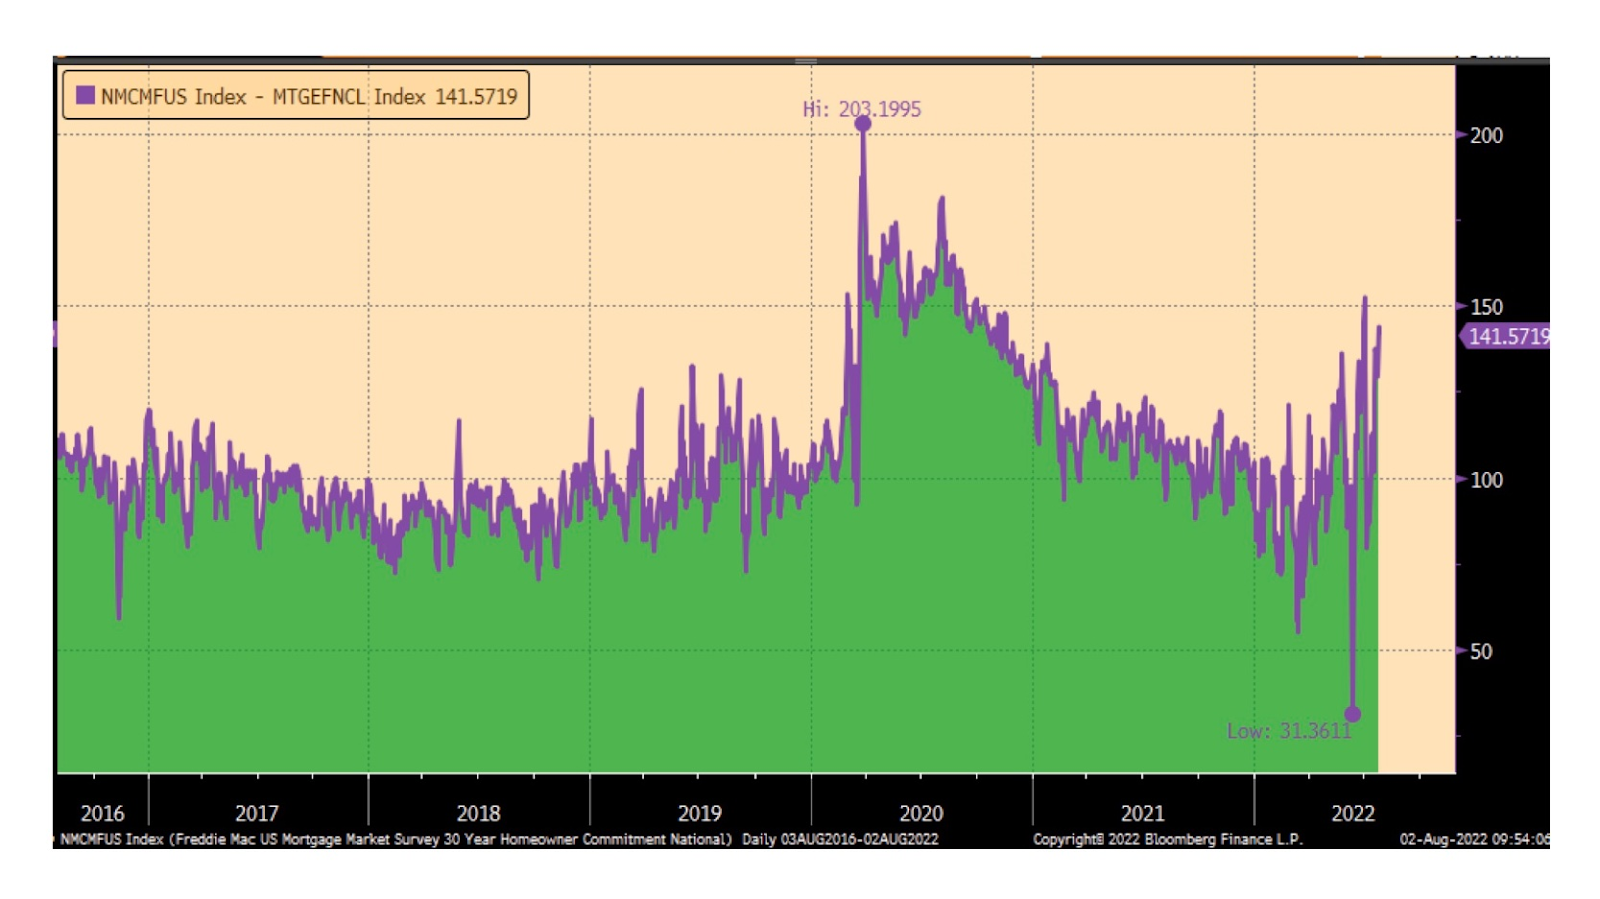
Graphic: Retrieved from @ConvexityMaven. “Home buyers don’t panic, retail Mortgage rates should soon be under 4.90%. MBS (mortgage bonds) usually trade ~75bp above the 10yr swap rate  (~85bp above the UST10yr rate). The retail Home loan rate should be ~100bp above MBS rate (chart). Mortgage brokers will be begging soon.

Positioning

As of 7:10 AM ET, Thursday’s expected volatility, via the Cboe Volatility Index (INDEX: VIX), sits at ~1.14%. Net gamma exposures increasing may promote tighter ranges at higher price levels.

Context: Customers concentrate bets at and above current S&P 500 (INDEX: SPX) prices. 

Taking the naive view and assuming this activity is, indeed, aligned with historical trends (i.e., customers sell calls and use those proceeds to finance protection, down below), then counterparts are likely taking on exposure to more long call positions, which they hedge by selling underlying. Into strength, some more underlying will be sold. Into weakness, some underlying will be bought. This activity can promote mean-reversion at higher prices.
Graphic: Retrieved from SpotGamma. Changes in call open interest.

As well put in our August 3 letter, given where realized (RVOL) and implied (IVOL) volatility are, as well as skew, it is beneficial to be a buyer of options structures (e.g., put back spread).

Graphic: Updated 8/3/2022. Time-lapse skew on the S&P 500 (INDEX: SPX) for Tuesday, Monday, and one week ago. Retrieved from Interactive Brokers Group Inc’s (NASDAQ: IBKR) Trader Workstation.

According to SpotGamma, “data suggests markets have entered into a period of normalization” and “IVOL likely reached a lower bound (see the bid skew).”

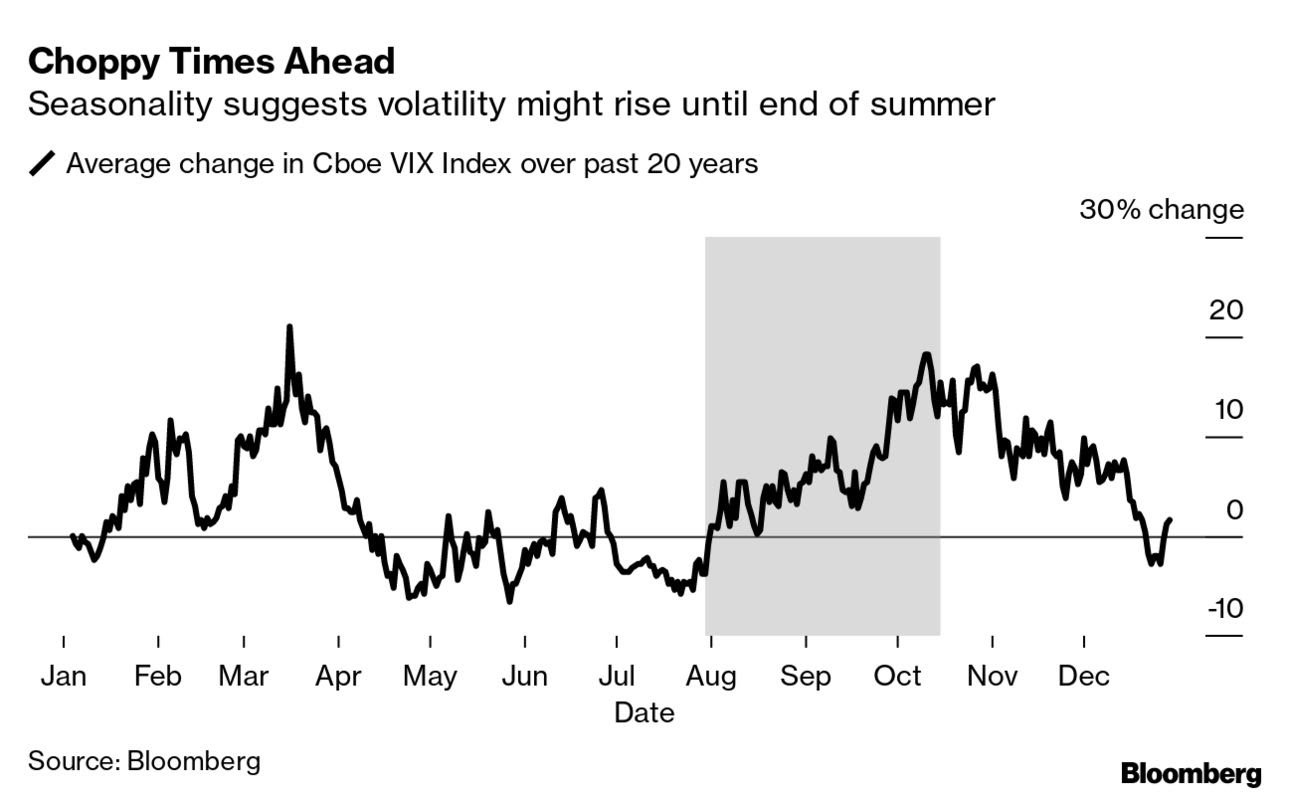
Graphic: Retrieved from Bloomberg. “The CBOE VIX index shows price swings usually rise in the summer and early autumn, and the S&P 500 is now entering its period of the worst historical returns over the past 25 years.”

“To maintain a risk-on (rally) environment, traders would need to position themselves into call options, now, further up in price, farther out in time, which they seem to be doing, albeit in not overly significant quantities.”

Notwithstanding, as SpotGamma adds, “with participants getting rid of commodity inflation and long volatility hedges that performed poorly, [this] (1) leaves equity markets more susceptible to the whims of potentially negative underlying macro forces and (2) leaves volatility markets more prone to jumps.”

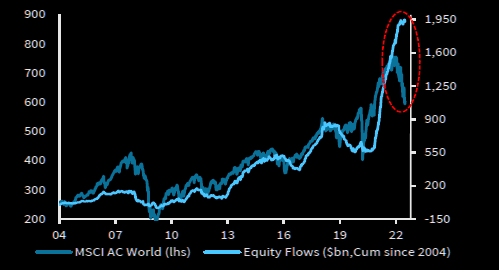
Thus far, it’s the case that we’re far more than halfway through a dot-com type collapse that’s happened “underneath the surface of the indices,” per Simplify Asset Management’s Mike Green. Should those strong passive flows falter, that likely takes from some of the support in the largest of index constituents.

Graphic: Retrieved from The Market Ear. Via Barclays PLC (NYSE: BCS).

Were the latter to happen, you’d want protection in the form of structures that would enable you to monetize on some sort-of non-linear repricing in volatility (e.g., butterflies and back spreads), should participants seek protection in a way they haven’t this year.

If nothing were to happen, the bid in skew would, at least, assist those structures in maintaining their value better, essentially.

Technical

As of 7:00 AM ET, Thursday’s regular session (9:30 AM – 4:00 PM ET), in the S&P 500, is likely to open in the upper part of a positively skewed overnight inventory, just inside of prior-range and -value, suggesting a limited potential for immediate directional opportunity.

In the best case, the S&P 500 trades higher.

Any activity above the $4,153.25 HVNode puts into play the $4,189.25 LVNode. Initiative trade beyond the LVNode could reach as high as the $4,227.75 HVNode and $4,259.75 LVNode, or higher.

In the worst case, the S&P 500 trades lower.

Any activity below the $4,153.25 HVNode puts into play the $4,117.75 MCPOC. Initiative trade beyond the MCPOC could reach as low as the $4,073.00 VPOC and $4,040.75 HVNode, or lower.

Click here to load today’s key levels into the web-based TradingView charting platform. Note that all levels are derived using the 65-minute timeframe. New links are produced, daily.
Graphic: 65-minute profile chart of the Micro E-mini S&P 500 Futures.

Considerations: Responsiveness near key-technical areas (that are discernable visually on a chart), suggests technically-driven traders with short time horizons are very active. 

Such traders often lack the wherewithal to defend retests and, additionally, the type of trade may be indicative of the other time frame participants waiting for more information to initiate trades.

Definitions

Volume Areas: A structurally sound market will build on areas of high volume (HVNodes). Should the market trend for long periods of time, it will lack sound structure, identified as low volume areas (LVNodes). LVNodes denote directional conviction and ought to offer support on any test. 

If participants were to auction and find acceptance into areas of prior low volume (LVNodes), then future discovery ought to be volatile and quick as participants look to HVNodes for favorable entry or exit.

POCs: POCs are valuable as they denote areas where two-sided trade was most prevalent in a prior day session. Participants will respond to future tests of value as they offer favorable entry and exit.

MCPOCs: POCs are valuable as they denote areas where two-sided trade was most prevalent over numerous day sessions. Participants will respond to future tests of value as they offer favorable entry and exit.

Volume-Weighted Average Prices (VWAPs): A metric highly regarded by chief investment officers, among other participants, for quality of trade. Additionally, liquidity algorithms are benchmarked and programmed to buy and sell around VWAPs.

About

After years of self-education, strategy development, mentorship, and trial-and-error, Renato Leonard Capelj began trading full-time and founded Physik Invest to detail his methods, research, and performance in the markets.

Capelj also develops insights around impactful options market dynamics at SpotGamma and is a Benzinga reporter.

Some of his works include conversations with ARK Invest’s Catherine Wood, investors Kevin O’Leary and John Chambers, FTX’s Sam Bankman-Fried, ex-Bridgewater Associate Andy Constan, Kai Volatility’s Cem Karsan, The Ambrus Group’s Kris Sidial, among many others.

Disclaimer

In no way should the materials herein be construed as advice. Derivatives carry a substantial risk of loss. All content is for informational purposes only.

Categories
Commentary

Daily Brief For July 27, 2022

The daily brief is a free glimpse into the prevailing fundamental and technical drivers of U.S. equity market products. Join the 600+ that read this report daily, below!

Graphic updated 6:55 AM ET. Sentiment Risk-On if expected /ES open is above the prior day’s range. /ES levels are derived from the profile graphic at the bottom of the following section. Levels may have changed since initially quoted; click here for the latest levels. SqueezeMetrics Dark Pool Index (DIX) and Gamma (GEX) calculations are based on where the prior day’s reading falls with respect to the MAX and MIN of all occurrences available. A higher DIX is bullish. At the same time, the lower the GEX, the more (expected) volatility. Learn the implications of volatility, direction, and moneyness. Breadth reflects a reading of the prior day’s NYSE Advance/Decline indicator. VIX reflects a current reading of the CBOE Volatility Index (INDEX: VIX) from 0-100.

Fundamental

We shall unpack details from the Federal Open Market Committee (FOMC) event in the coming sessions, stay tuned.

Positioning

As of 6:40 AM ET, Wednesday’s expected volatility, via the Cboe Volatility Index (INDEX: VIX), sits at ~1.27%. Net gamma exposures lightly decreasing may promote larger trading ranges.

Graphic: Via Physik Invest. Data retrieved from SqueezeMetrics.

Should fears with respect to the Federal Open Market Committee (FOMC) announcement be assuaged, then compression in volatility may do more to support current equity price levels.

Graphic: Updated July 26, 2022. Retrieved from Interactive Brokers Group Inc’s (NASDAQ: IBKR) Trader Workstation. Posted by SpotGamma. Short-dated, pre-FOMC, volatility is sold. Longer-dated, post-FOMC volatility is bid. “Traders have likely shorting implied volatility for pre-FOMC expirations which has been supportive of equities.”

Notwithstanding, let’s unpack some trends and how they may feed into a volatility “untethering.”

In the Daily Brief for March 31, 2022, we discussed participants’ aversion to selling short-term variance. This, which did more to assuage our fear of crash risk, as well explained in the Daily Brief for March 30, 2022, was, in part, the result of COVID-era volatility that forced participants, out on the risk curve, to deleverage en masse.

As stated in March, per Banco Santander SA’s (NYSE: SAN) research, the “supply of volatility remains very subdued in a trend that has continued since the pandemic.”

“We did observe some activity in 4Q21 and 1Q this year, but almost all of that was unwinding of existing positions from earlier, and these were not new trades.”

Graphic: Via Goldman Sachs Group Inc (NYSE: GS).

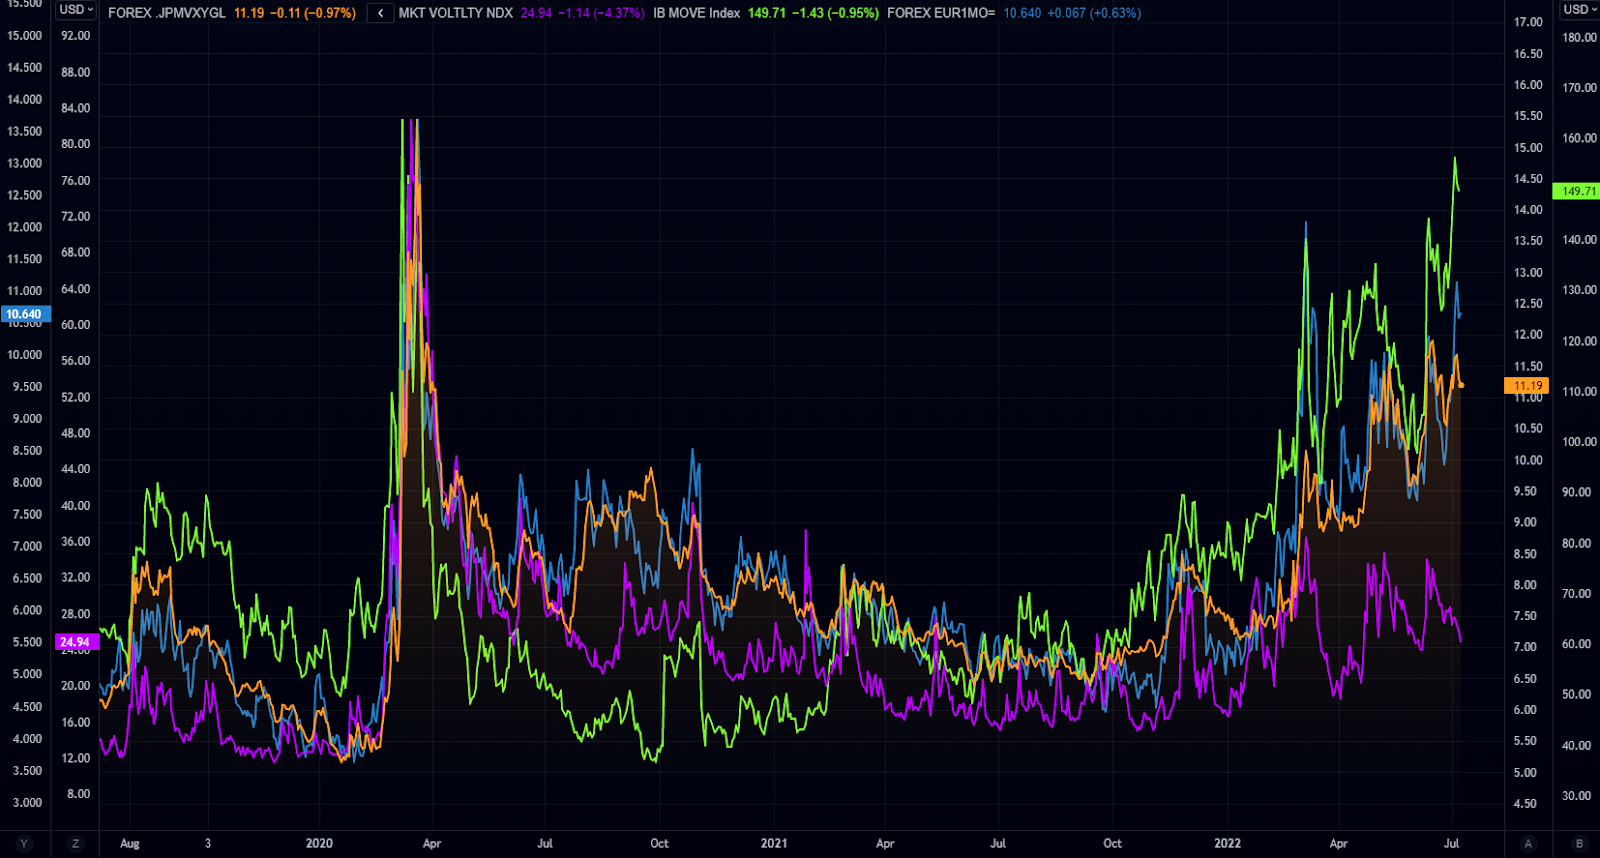
However, despite all of the “uncertainty from geopolitics and central banks,” we still saw broad equity implied volatility (IVOL) measures subdued, relative to those in rates and FX.

Graphic: Retrieved from QVR Advisors’ Benn Eifert.

Let’s unpack that muted response, further.

Well, as explained in the Daily Brief for July 21, 2022, heading into the 2022 decline, institutions repositioned and hedged, even allocating to “commodity trend following,” per our Daily Brief for July 15, 2022, which worked well the first two quarters.

The monetization and counterparty hedging of existing customer hedges, as well as the sale of short-dated volatility, particularly in some of the single names where there was “rich” volatility, into the fall, lent to lackluster performance in implied volatility and index mean reversion.

Graphic: Retrieved from Rob Emrich III. Via Goldman Sachs Group Inc (NYSE: GS).

This trend is set to come to an end as entities are squeezed out of trades that aren’t working (i.e., participants rotate out of volatility and commodities).

Graphic: Retrieved from SpotGamma. S&P 500 $3,500.00 put option values. “Like with the Boy Who Cried Wolf, people grew tired of false alarms. This year put buyers have been waiting for the wolf, but after June OPEX the villagers stopped listening.”

Per Kai Volatility’s Cem Karsan, as “volatility itself, on the equity side, becomes less and less hedged on the customer level, … [the] market can really begin to respond to the core macro factors.”

Should markets experience a shock, or trade substantially lower, the demand for hedges may result in an “untethering” in implied volatility, which was “one of the most supportive things into the decline,” Karsan said, adding that now is the best time to rotate into call options which are outperforming “their delta to the upside.”

Graphic: Time-lapse skew on the S&P 500 (INDEX: SPX) for July 25 and July 26, 2022. Retrieved from Interactive Brokers Group Inc’s (NASDAQ: IBKR) Trader Workstation.

Accordingly, given the macro risk, IVOL is likely at a lower bound and, per The Ambrus Group’s Kris Sidial, “if you wanted to go out and hedge, the opportunity is still there in the equity space.”

Technical

As of 6:30 AM ET, Wednesday’s regular session (9:30 AM – 4:00 PM ET), in the S&P 500, is likely to open in the upper part of a positively skewed overnight inventory, just outside of prior-range and -value, suggesting a potential for immediate directional opportunity.

In the best case, the S&P 500 trades higher.

Any activity above the $3,961.25 MCPOC puts into play the $3,997.00 VPOC. Initiative trade beyond the VPOC could reach as high as the $4,016.25 HVNode and $4,055.25 LVNode, or higher.

In the worst case, the S&P 500 trades lower.

Any activity below the $3,961.25 MCPOC puts into play the $3,921.00 VPOC. Initiative trade beyond the VPOC could reach as low as the $3,909.25 MCPOC and $3,867.25 LVNode, or lower.

Click here to load today’s key levels into the web-based TradingView charting platform. Note that all levels are derived using the 65-minute timeframe. New links are produced, daily.
Graphic: 65-minute profile chart of the Micro E-mini S&P 500 Futures.

Definitions

Volume Areas: A structurally sound market will build on areas of high volume (HVNodes). Should the market trend for long periods of time, it will lack sound structure, identified as low volume areas (LVNodes). LVNodes denote directional conviction and ought to offer support on any test. 

If participants were to auction and find acceptance into areas of prior low volume (LVNodes), then future discovery ought to be volatile and quick as participants look to HVNodes for favorable entry or exit.

POCs: POCs are valuable as they denote areas where two-sided trade was most prevalent in a prior day session. Participants will respond to future tests of value as they offer favorable entry and exit.

MCPOCs: POCs are valuable as they denote areas where two-sided trade was most prevalent over numerous day sessions. Participants will respond to future tests of value as they offer favorable entry and exit.

Volume-Weighted Average Prices (VWAPs): A metric highly regarded by chief investment officers, among other participants, for quality of trade. Additionally, liquidity algorithms are benchmarked and programmed to buy and sell around VWAPs.

About

After years of self-education, strategy development, mentorship, and trial-and-error, Renato Leonard Capelj began trading full-time and founded Physik Invest to detail his methods, research, and performance in the markets.

Capelj also develops insights around impactful options market dynamics at SpotGamma and is a Benzinga reporter.

Some of his works include conversations with ARK Invest’s Catherine Wood, investors Kevin O’Leary and John Chambers, FTX’s Sam Bankman-Fried, ex-Bridgewater Associate Andy Constan, Kai Volatility’s Cem Karsan, The Ambrus Group’s Kris Sidial, among many others. 

Disclaimer

In no way should the materials herein be construed as advice. Derivatives carry a substantial risk of loss. All content is for informational purposes only.

Categories
Commentary

Daily Brief For July 15, 2022

The daily brief is a free glimpse into the prevailing fundamental and technical drivers of U.S. equity market products. Join the 300+ that read this report daily, below!

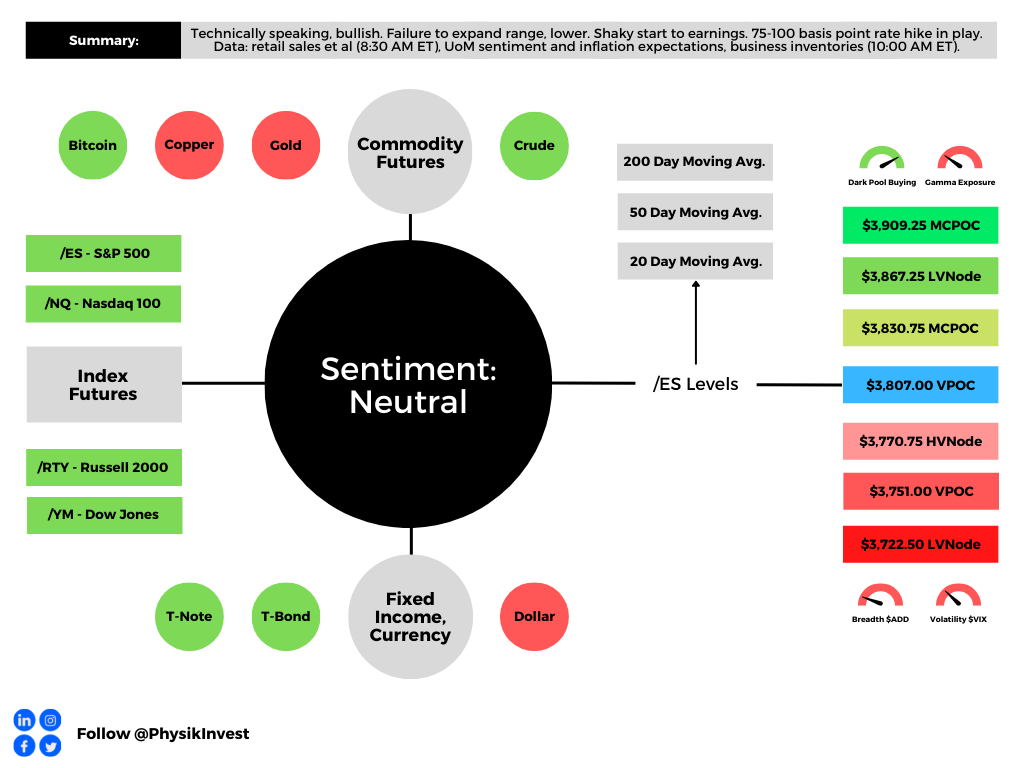
Graphic updated 6:35 AM ET. Sentiment Neutral if expected /ES open is inside of the prior day’s range. /ES levels are derived from the profile graphic at the bottom of the following section. Levels may have changed since initially quoted; click here for the latest levels. SqueezeMetrics Dark Pool Index (DIX) and Gamma (GEX) calculations are based on where the prior day’s reading falls with respect to the MAX and MIN of all occurrences available. A higher DIX is bullish. At the same time, the lower the GEX, the more (expected) volatility. Learn the implications of volatility, direction, and moneyness. Breadth reflects a reading of the prior day’s NYSE Advance/Decline indicator. VIX reflects a current reading of the CBOE Volatility Index (INDEX: VIX) from 0-100.

Fundamental

Note: A really interesting discussion in the below positioning section which tidies up some of the past analyses we’ve made. Read on for more!

Ahead are updates on retail sales, import prices, Empire State Manufacturing (8:30 AM ET), industrial production and capacity utilization (9:15 AM ET), as well as University of Michigan consumer sentiment and inflation expectations, and business inventories (10:00 AM ET).

This week, markets repriced after data on inflation came in hot. Participants have bet on tough action from the Federal Reserve (Fed). Now, there is a near-50% chance of a 100 basis point hike later in July.

Graphic: Via CME Group Inc’s (NASDAQ: CME) FedWatch Tool.

Per The Macro Compass, published by Alfonso Peccatiello, companies have downgraded their outlooks and job creation “is much less impressive” amid labor force shrinkage.

“[T]he number of total employed people in the US divided by its total population in the 25-54y age bracket dropped below 80%,” he explains. “Over the last 30 years, at the peak of each economic cycle, this ratio was over 80%.”

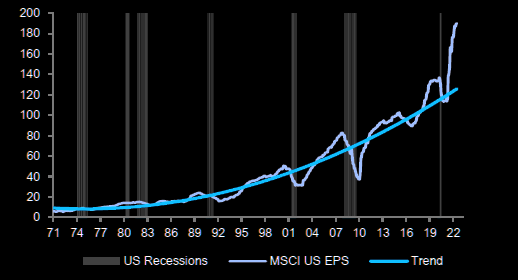
Accordingly, earnings “are nowhere near pricing the economic slowdown, … [and there still remains] way too much optimism.”

Graphic: Retrieved from The Market Ear. Via Barclays Plc (NYCE: BCS).

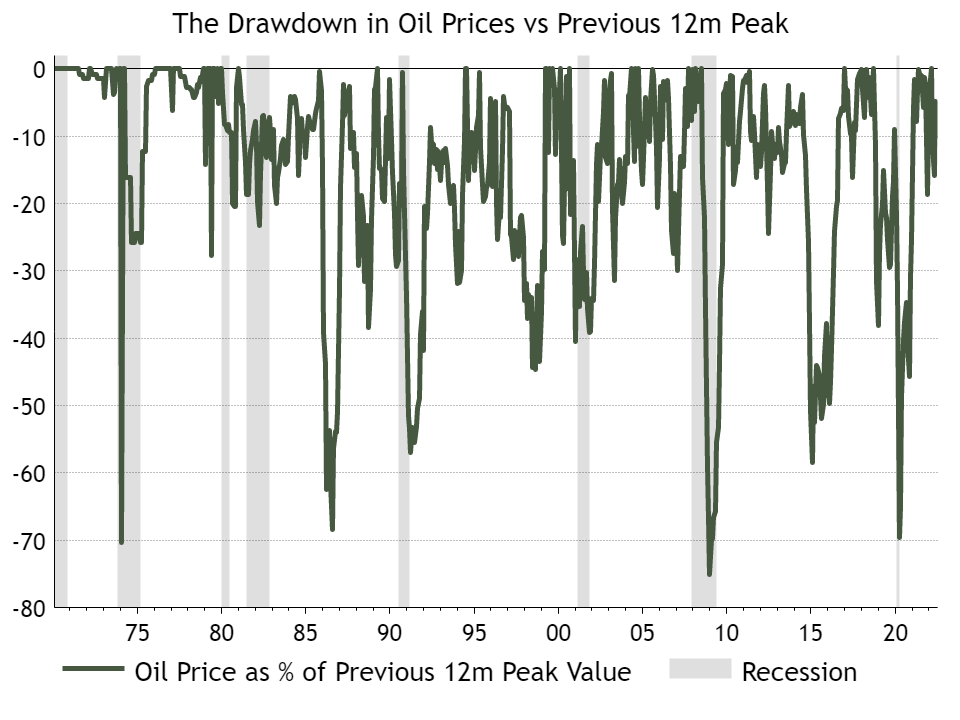
Additionally, commodities (even more so those that are industrial and “are the cleanest expression of global demand”) have endured selling pressure with a near 30% copper drawdown likely to precede positive total returns for long bonds, Peccatiello explains.

Graphic: Retrieved from Callum Thomas. With “[r]ecessions see[ing] oil prices fall by 20% to 70%, … being bullish on oil at this point is either betting against history or [] recession.”

Positioning

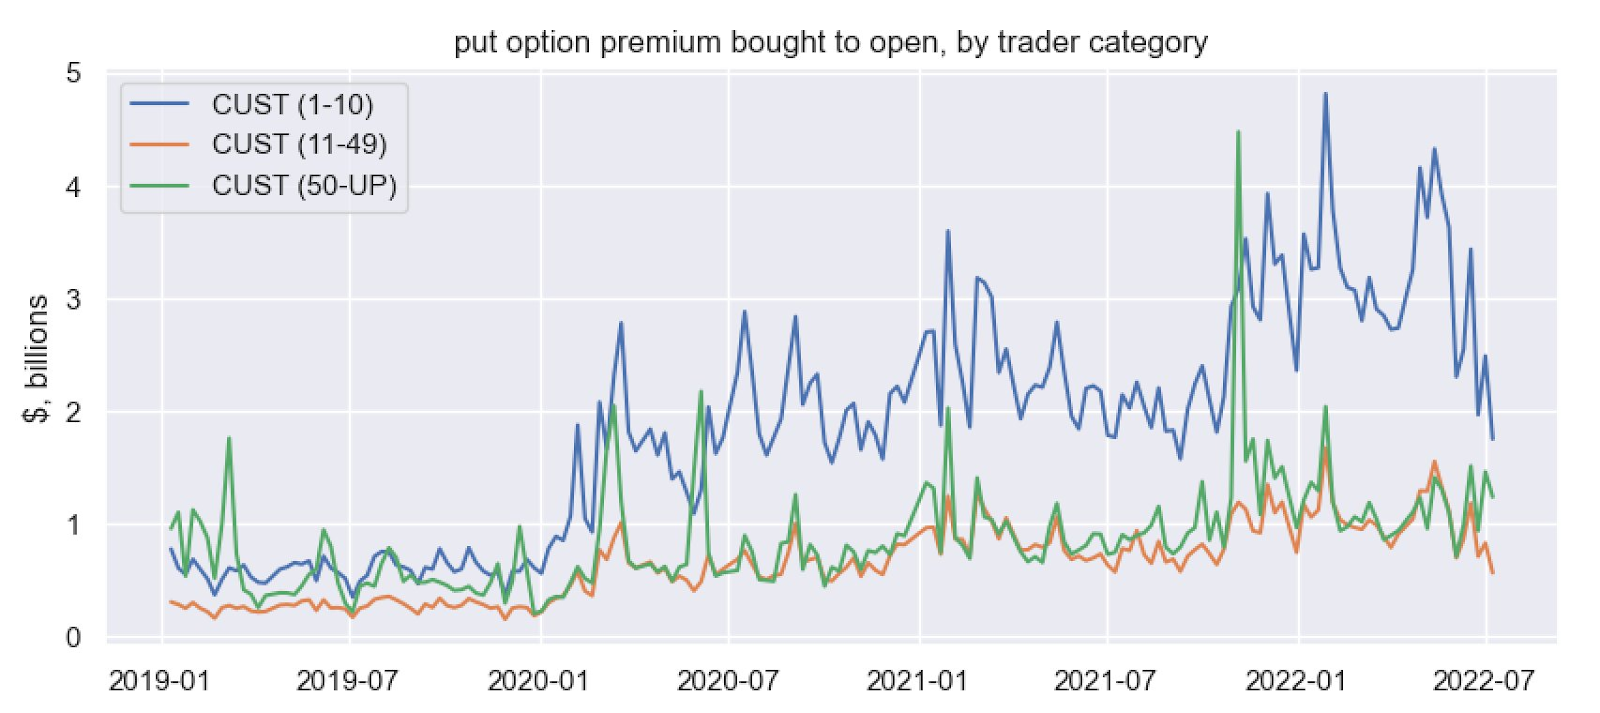
The drawdown in commodities is significant as that was, arguably, the last place that offered participants a hedge against their poorly performing bond and equity exposures. 

“A lot of people allocated to commodity trend following and that did a good job in the first two quarters,” The Ambrus Group’s Kris Sidial explained

“CTAs were performing and you had a lot of people who did not need to buy [equity] volatility because their portfolios were covered from the inflation hedges.”

Graphic: Shared by Benn Eifert of QVR Advisors.

That, coupled with the sale of ultra-short-dated volatility, particularly in some of the single names to capture “rich” volatility, as well as hedging of structured products issuances, continues to play into suppressed index volatility.

For context: Rising rates and a drive for yield have been a boon for exotic derivatives. 

Participants often seek exposure to products that are essentially short volatility a year or so out. The counterparty, here, is long volatility on these notes. To hedge risk – since “you can’t just be long volatility, … [otherwise] you’ll bleed money for long periods of time” – the bank will hedge risk in the listed market. 

However, on a one-year auto-callable, for which it would be appropriate to sell one-year volatility in the listed market, “some of these banks … create this synthetic calendar profile where they’re … sell[ing] a little bit of one-month vol because they can take in that theta a whole lot faster, or two- and three-month vol,” spreading exposure in buckets.

See, here, for a sample presentation on what is an Auto-Callable Yield Note.

This suppresses “vol in the front of the term structure, and … opens up the door to … that other move where if everybody is selling vol in the front of the term structure,” it may blow out on a large increase in demand.

“If you look back during COVID, there are articles about banks that lost a lot of money because of the[ir] hedges. This has happened previously and you’re seeing little blips of it start to” return.
Graphic: Retrieved from The Ambrus Group’s Kris Sidial. “[S]ome dealers will opportunistically look to sell vol in some buckets in the front of the term structure.”

Basically, “the macro landscape … opened up another area to hedge” which resulted in the increased movement of realized equity (RVOL) volatility, relative to that which is implied (IVOL).

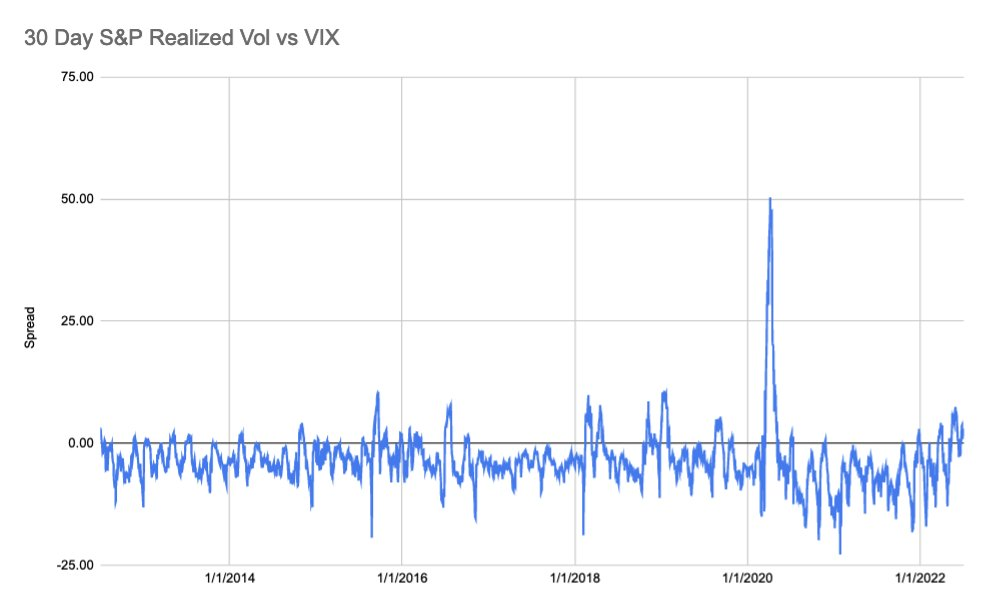
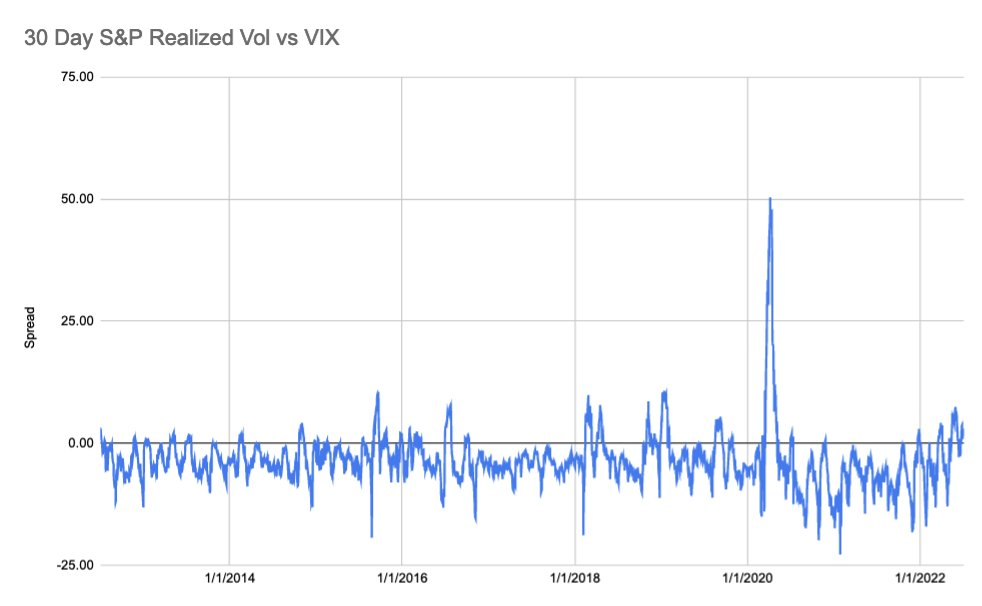
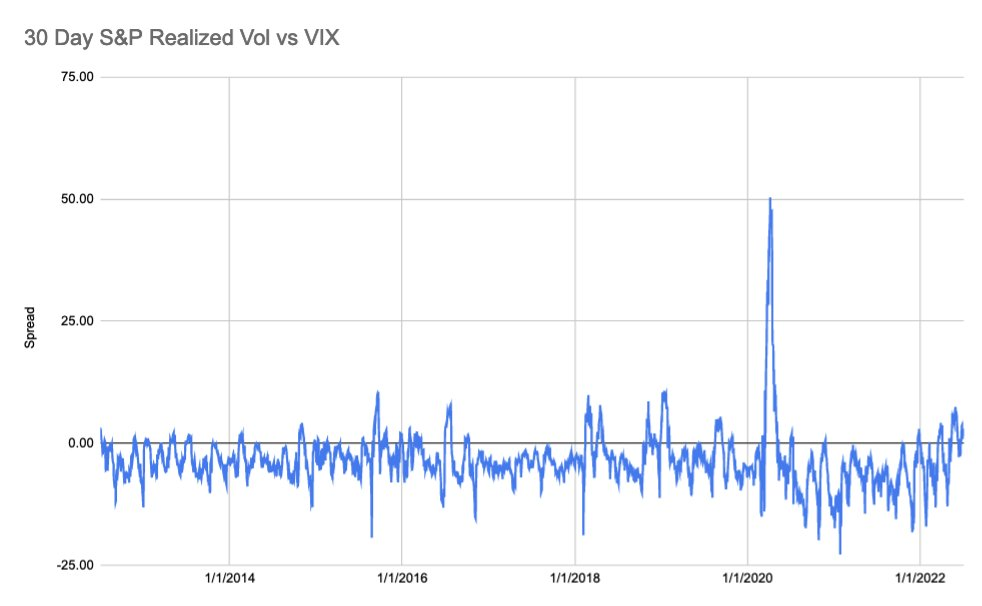
Graphic: Via S&P Global Inc (NYSE: SPGI). As explained by SpotGamma, “30-day realized SPX volatility is now trading above the VIX, something that generally shows after major selloffs wherein IV “premium” needs to reset to calmer/higher equity markets.”

Now, with commodities not offering protection, one has to be concerned if “the flock move[s].”

“If commodities are not performing, they’re not going to work as a hedge for your portfolio. That opens the door … [to] markets sliding lower and [people] need[ing] to get hedges on,” which is likely to bid equity volatility where some single names “are only trading three to four vol points above where they were trading in January of 2020,” the complete dismissal of a crash.

Therefore, “if you wanted to go out and hedge, the opportunity is still there in the equity space.”

Technical

As of 6:30 AM ET, Friday’s regular session (9:30 AM – 4:00 PM ET), in the S&P 500, is likely to open in the middle part of a balanced overnight inventory, inside of prior-range and -value, suggesting a limited potential for immediate directional opportunity.

In the best case, the S&P 500 trades higher.

Any activity above the $3,807.00 VPOC puts into play the $3,830.75 MCPOC. Initiative trade beyond the MCPOC could reach as high as the $3,867.25 LVNode and $3,909.25 MCPOC, or higher.

In the worst case, the S&P 500 trades lower.

Any activity below the $3,807.00 VPOC puts into play the $3,770.75 HVNode. Initiative trade beyond the HVNode could reach as low as the $3,751.00 VPOC and $3,722.50 LVNode, or lower.

Click here to load today’s key levels into the web-based TradingView charting platform. Note that all levels are derived using the 65-minute timeframe. New links are produced, daily.
Graphic: 65-minute profile chart of the Micro E-mini S&P 500 Futures.

Considerations: Responsiveness near key-technical areas (that are discernable visually on a chart), suggests technically-driven traders with short time horizons are very active. 

Such traders often lack the wherewithal to defend retests and, additionally, the type of trade may be indicative of the other time frame participants waiting for more information to initiate trades.

Definitions

Volume Areas: A structurally sound market will build on areas of high volume (HVNodes). Should the market trend for long periods of time, it will lack sound structure, identified as low volume areas (LVNodes). LVNodes denote directional conviction and ought to offer support on any test. 

If participants were to auction and find acceptance into areas of prior low volume (LVNodes), then future discovery ought to be volatile and quick as participants look to HVNodes for favorable entry or exit.

POCs: POCs are valuable as they denote areas where two-sided trade was most prevalent in a prior day session. Participants will respond to future tests of value as they offer favorable entry and exit.

MCPOCs: POCs are valuable as they denote areas where two-sided trade was most prevalent over numerous day sessions. Participants will respond to future tests of value as they offer favorable entry and exit.

Volume-Weighted Average Prices (VWAPs): A metric highly regarded by chief investment officers, among other participants, for quality of trade. Additionally, liquidity algorithms are benchmarked and programmed to buy and sell around VWAPs.

About

After years of self-education, strategy development, mentorship, and trial-and-error, Renato Leonard Capelj began trading full-time and founded Physik Invest to detail his methods, research, and performance in the markets.

Capelj also develops insights around impactful options market dynamics at SpotGamma and is a Benzinga reporter.

Some of his works include conversations with ARK Invest’s Catherine Wood, investors Kevin O’Leary and John Chambers, FTX’s Sam Bankman-Fried, former Bridgewater Associate Andy Constan, Kai Volatility’s Cem Karsan, The Ambrus Group’s Kris Sidial, among many others.

Disclaimer

In no way should the materials herein be construed as advice. Derivatives carry a substantial risk of loss. All content is for informational purposes only.
Categories
Commentary

Daily Brief For July 11, 2022

The daily brief is a free glimpse into the prevailing fundamental and technical drivers of U.S. equity market products. Join the 300+ that read this report daily, below!

Graphic updated 7:00 AM ET. Sentiment Neutral if expected /ES open is inside of the prior day’s range. /ES levels are derived from the profile graphic at the bottom of the following section. Levels may have changed since initially quoted; click here for the latest levels. SqueezeMetrics Dark Pool Index (DIX) and Gamma (GEX) calculations are based on where the prior day’s reading falls with respect to the MAX and MIN of all occurrences available. A higher DIX is bullish. At the same time, the lower the GEX, the more (expected) volatility. Learn the implications of volatility, direction, and moneyness. Breadth reflects a reading of the prior day’s NYSE Advance/Decline indicator. VIX reflects a current reading of the CBOE Volatility Index (INDEX: VIX) from 0-100.

Fundamental

To start, thank you to the many new subscribers who joined in the past weeks. I’m honored.

Further, today we start broad (fundamental) and hone into specifics on how to act in the current trade environment (positioning), as well as potential inflection (technical) points.

I encourage you to read through to the technicals part, if possible. Have a great week!

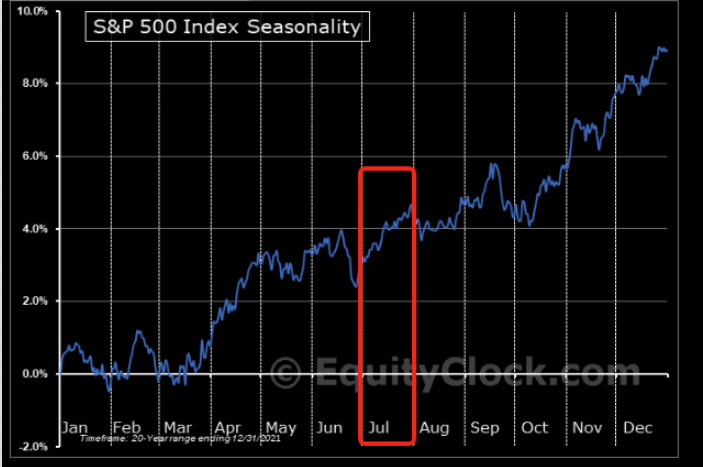
Seasonally speaking, the markets are in the midst of one of the most bullish periods of the year.

Graphic: Retrieved from The Market Ear.

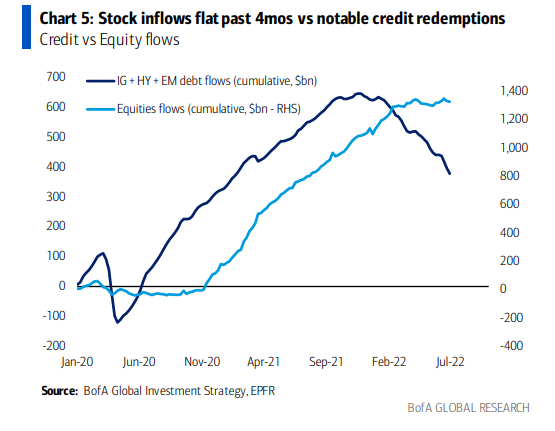
This is as stock market flows have yet to turn as they did for bonds months ago.

Graphic: Retrieved from Callum Thomas’ Topdown Charts. Via Bank of America Corporation (NYSE: BAC)

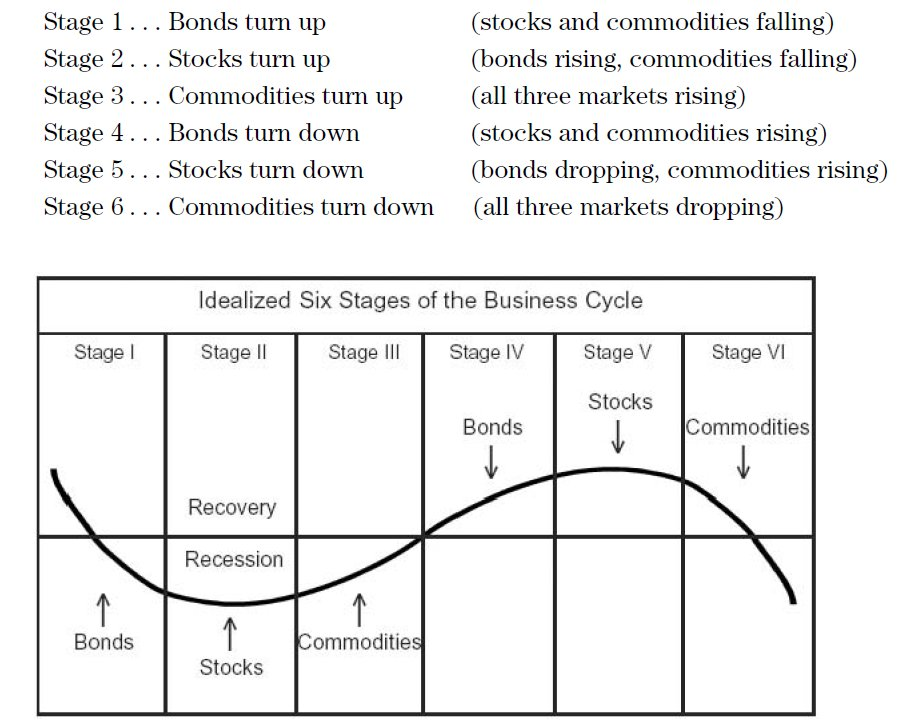
The cycle is as follows: typically bonds are the first to turn. Stocks and commodities follow. 

Graphic: Retrieved from @granthawkridge

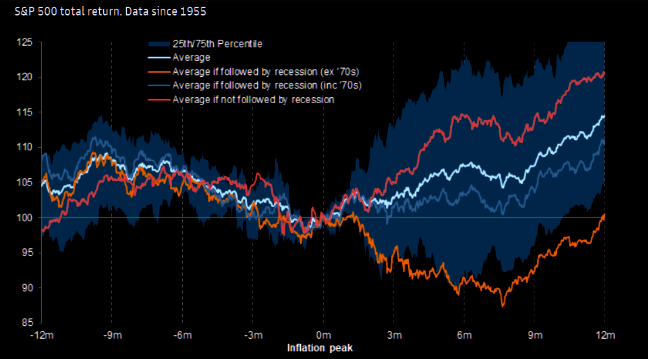
With bonds and equity products now off their swing lows and commodities off their highs (as inflation has, potentially, peaked), we have to question how much more?

Graphic: Retrieved from Goldman Sachs Group Inc (NYSE: GS).

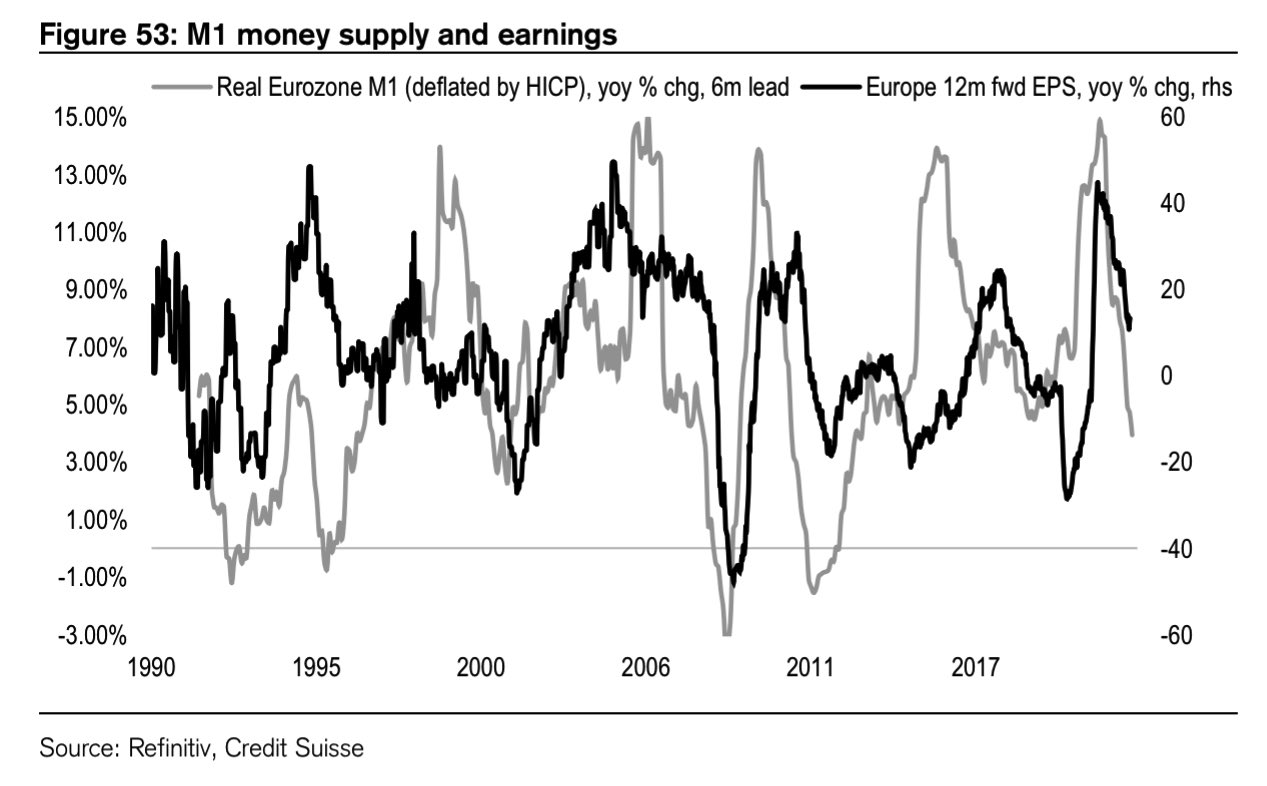
Well, thus far, and this is something we’ve talked about in the past, markets have suffered through compression in multiples. Does it stop or is there a looming earnings compression?

Graphic: Retrieved from Credit Suisse Group AG (NYSE: CS).

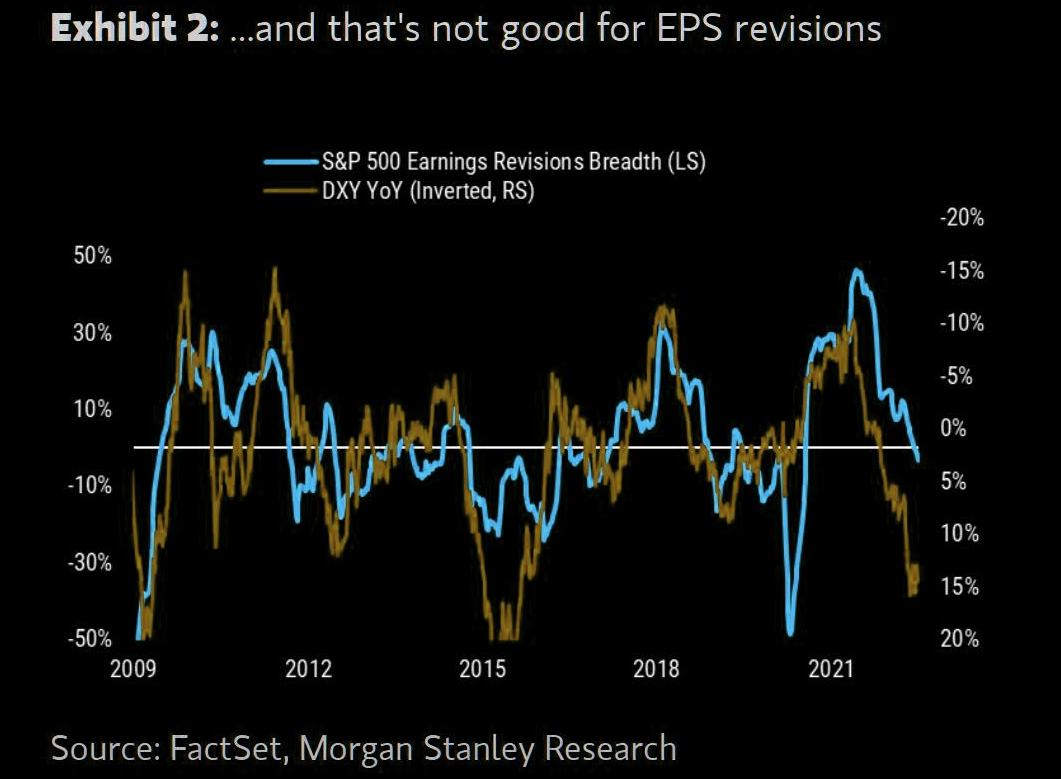
The earnings season shall shed clarity on the answer all the while – what is known – a strong dollar is sure to translate into a headwind for S&P 500 earnings growth.

Graphic: Retrieved from The Market Ear. Via Morgan Stanley (NYSE: MS) research. “The simple math on S&P 500 earnings from currency is that for every percentage point increase on a year-on-year basis it’s approximately a 0.5xhit to EPS growth. At today’s 16% year-on-year level, that translates into an 8% headwind for S&P 500 EPS growth, all else equal”

“The main point for equity investors is that this dollar strength is just another reason to think earnings revisions are coming down,” Morgan Stanley’s Mike Wilson explains

“[T]he recent rally in stocks is likely to fizzle out before too long.”

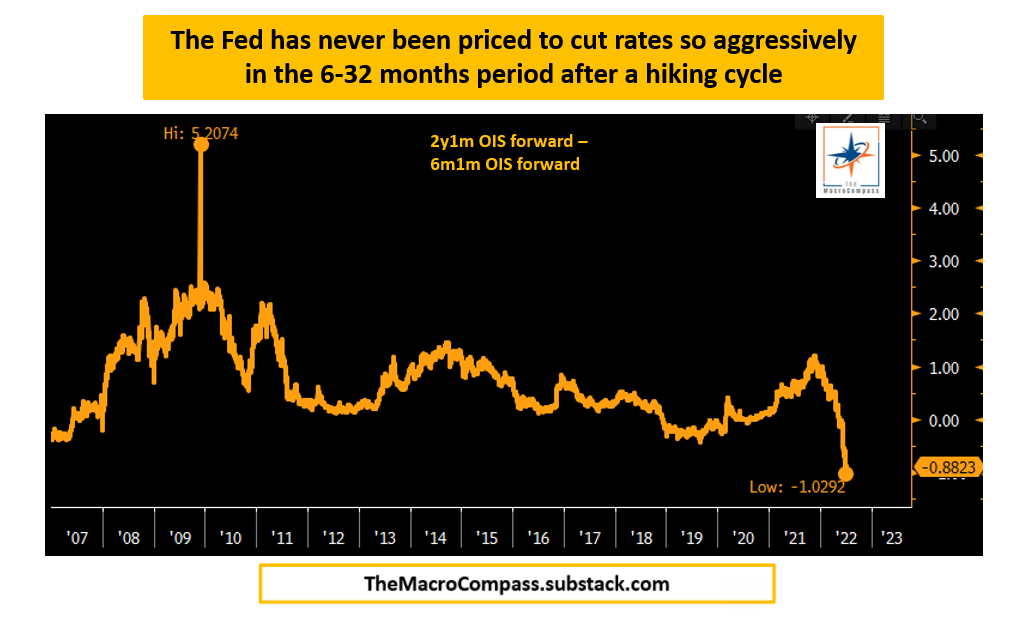
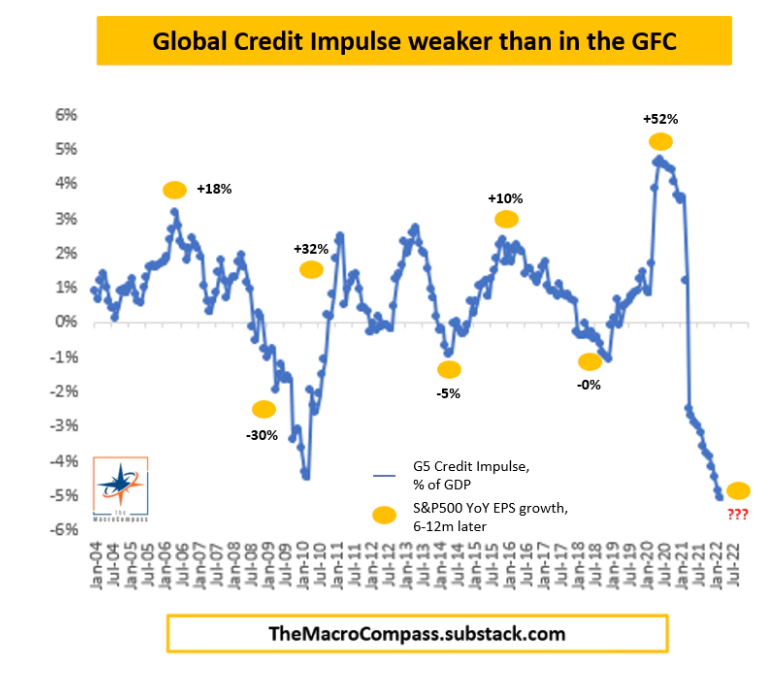
Moreover, with the impulse in credit falling, labor market showing preliminary signs of weakness, a drawdown in commodities (which is consistent with sharply lower economic growth), and bond market pricing rate cuts in early 2023, immediately following the hiking cycle, portfolios can “stay away from highly speculative assets, own USD cash and start allocating towards 5-10y+ government bonds,” as Alfonso Peccatiello explains well in his letter, The Macro Compass.

Graphic: Retrieved from The Macro Compass published by Alfonso Peccatiello.

Positioning

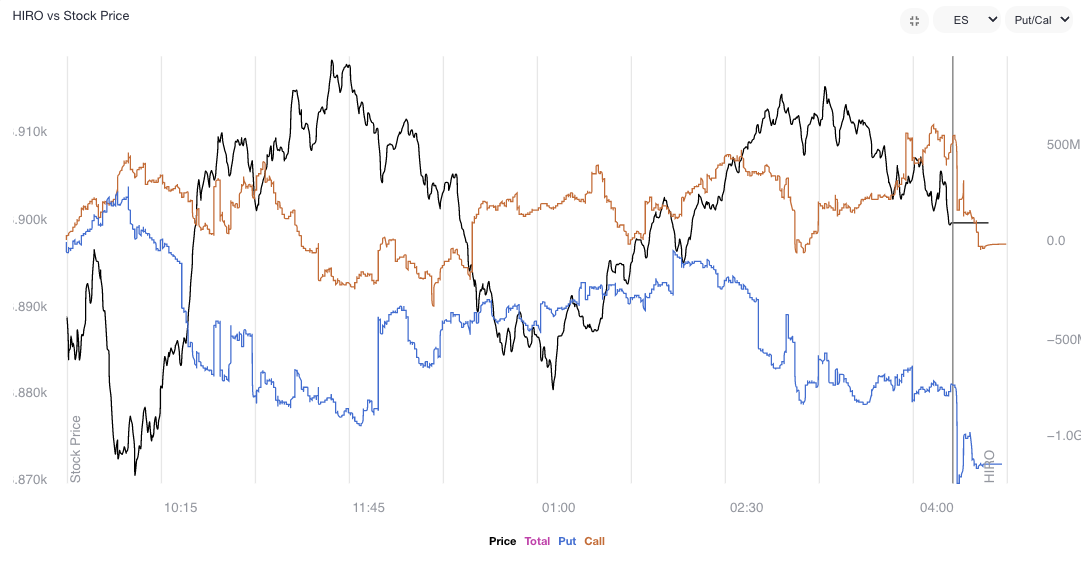
Calmer trade alongside easing volatility and generally rising gamma exposures. Trade, at times, was responsive. Participants would add positive (negative) delta bets into weakness (strength).

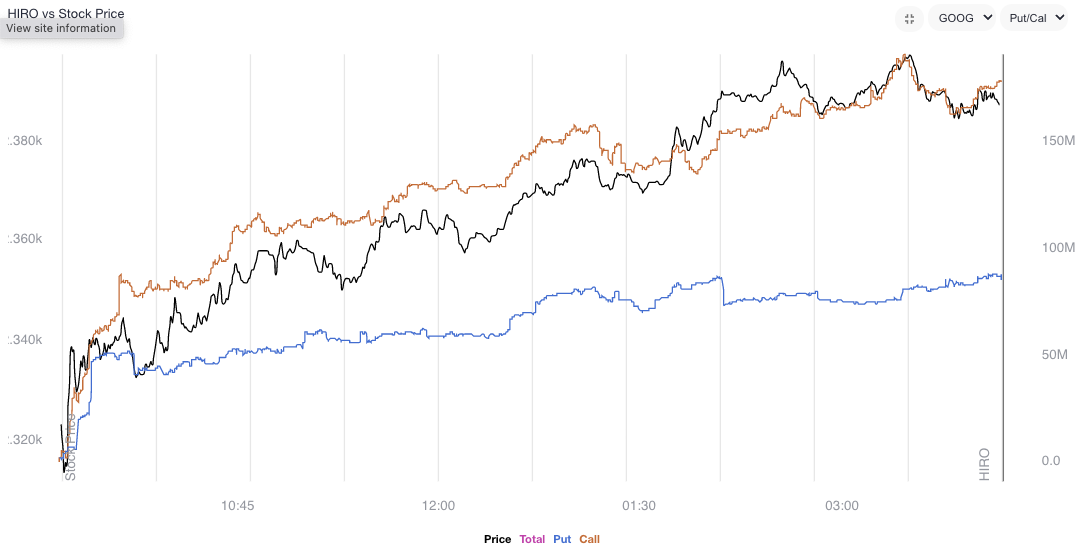
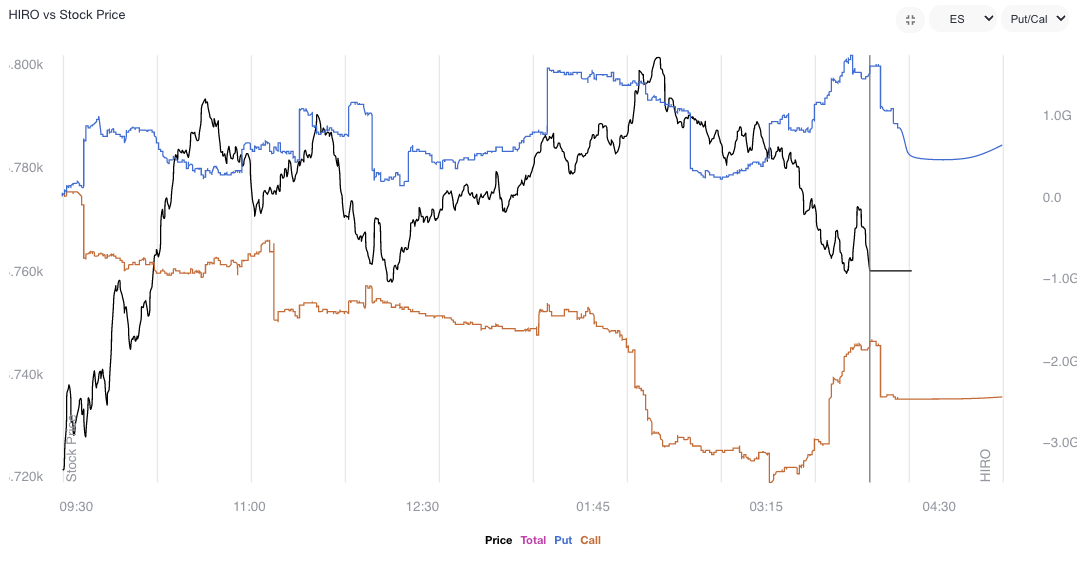
Graphic: Updated 7/8/2022. SpotGamma’s Hedging Impact of Real-Time Options (HIRO) indicator registers the sale of put (blue line) and call (orange) options.

Noteworthy is the continued sale of volatility, particularly across shorter time horizons, as well as increased demand for call options, especially in some of the larger index weights. Volatility sale, on the part of customers, leaves liquidity providers warehousing long volatility (which is kind of a naive thing to say as we’re discounting customer trades being paired off with each other).

Nonetheless, these liquidity providers’ positions, all else equal, will maintain or increase in value if underlying(s) realize volatility (especially that far in excess of implied). To hedge, rips (dips) will be sold (bought) to offset the increasing positive (negative) delta.

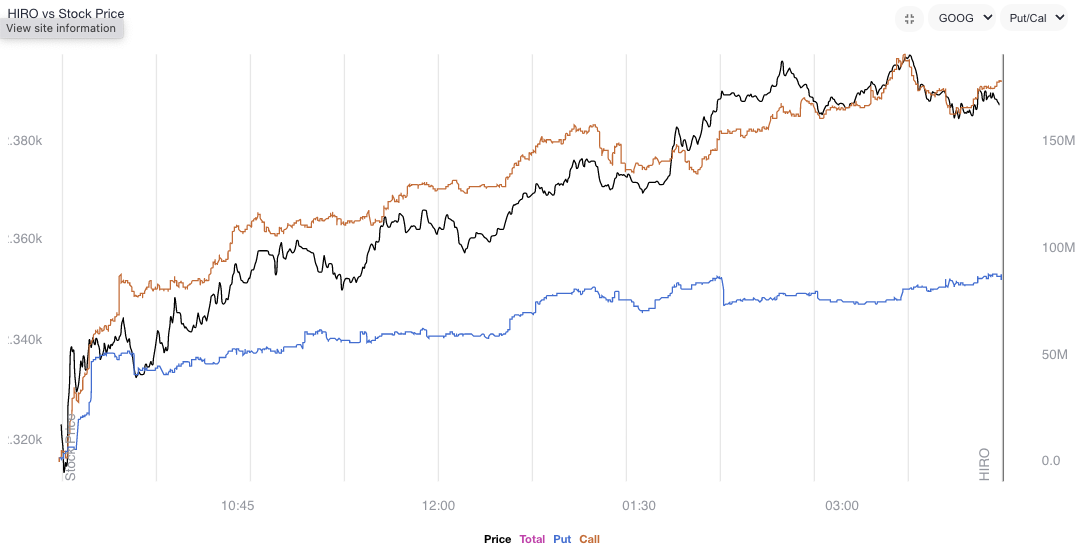
Graphic: Updated 7/7/2022. SpotGamma’s HIRO indicator for Alphabet Inc (NASDAQ: GOOG) (NASDAQ: GOOGL). Rising orange and blue lines point to call buying and put selling, both of which have bullish implications.

Moreover, this trend in volatility supply is in part on the loss of interest in “leveraged long S&P” trades, as well as “marginal demand for puts,” as SqueezeMetrics has stated, before.

Graphic: Retrieved from The Market Ear. Originally sourced via VIX Central. “Chart shows the VIX term structure ‘crash’ since June 13, which was the most recent VIX peak. The curve is now back to normal with the short end of the curve ‘much’ lower than longer-term maturities. Let’s see how far down they ‘press’ this.”

“Creeping into net selling territory is ‘smart’ bear market positioning. Short delta, short skew.”

Graphic: Retrieved from The Market Ear. “VIX has decoupled from cross-asset volatilities.”

Accordingly, the volatility markets have realized (RVOL) has crept (and exceeded, at times) the volatility implied (IVOL). 

Graphic: Via S&P Global. As explained by SpotGamma, “30-day realized SPX volatility is now trading above the VIX, something that generally shows after major selloffs wherein IV “premium” needs to reset to calmer/higher equity markets.”

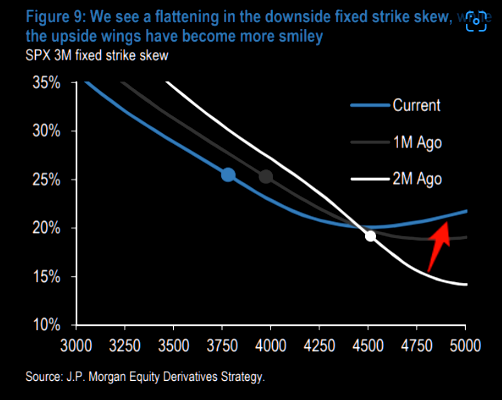
This, coupled with “a flattening in the downside fixed strike skew, while the upside wings [are] more smiley,” as described by JPMorgan Chase & Co (NYSE: JPM), has made for attractive low-cost spread opportunities, as talked about in the July 8, 2022 letter.

Graphic: Via JPMorgan Chase & Co (NYSE: JPM). Taken from The Market Ear.

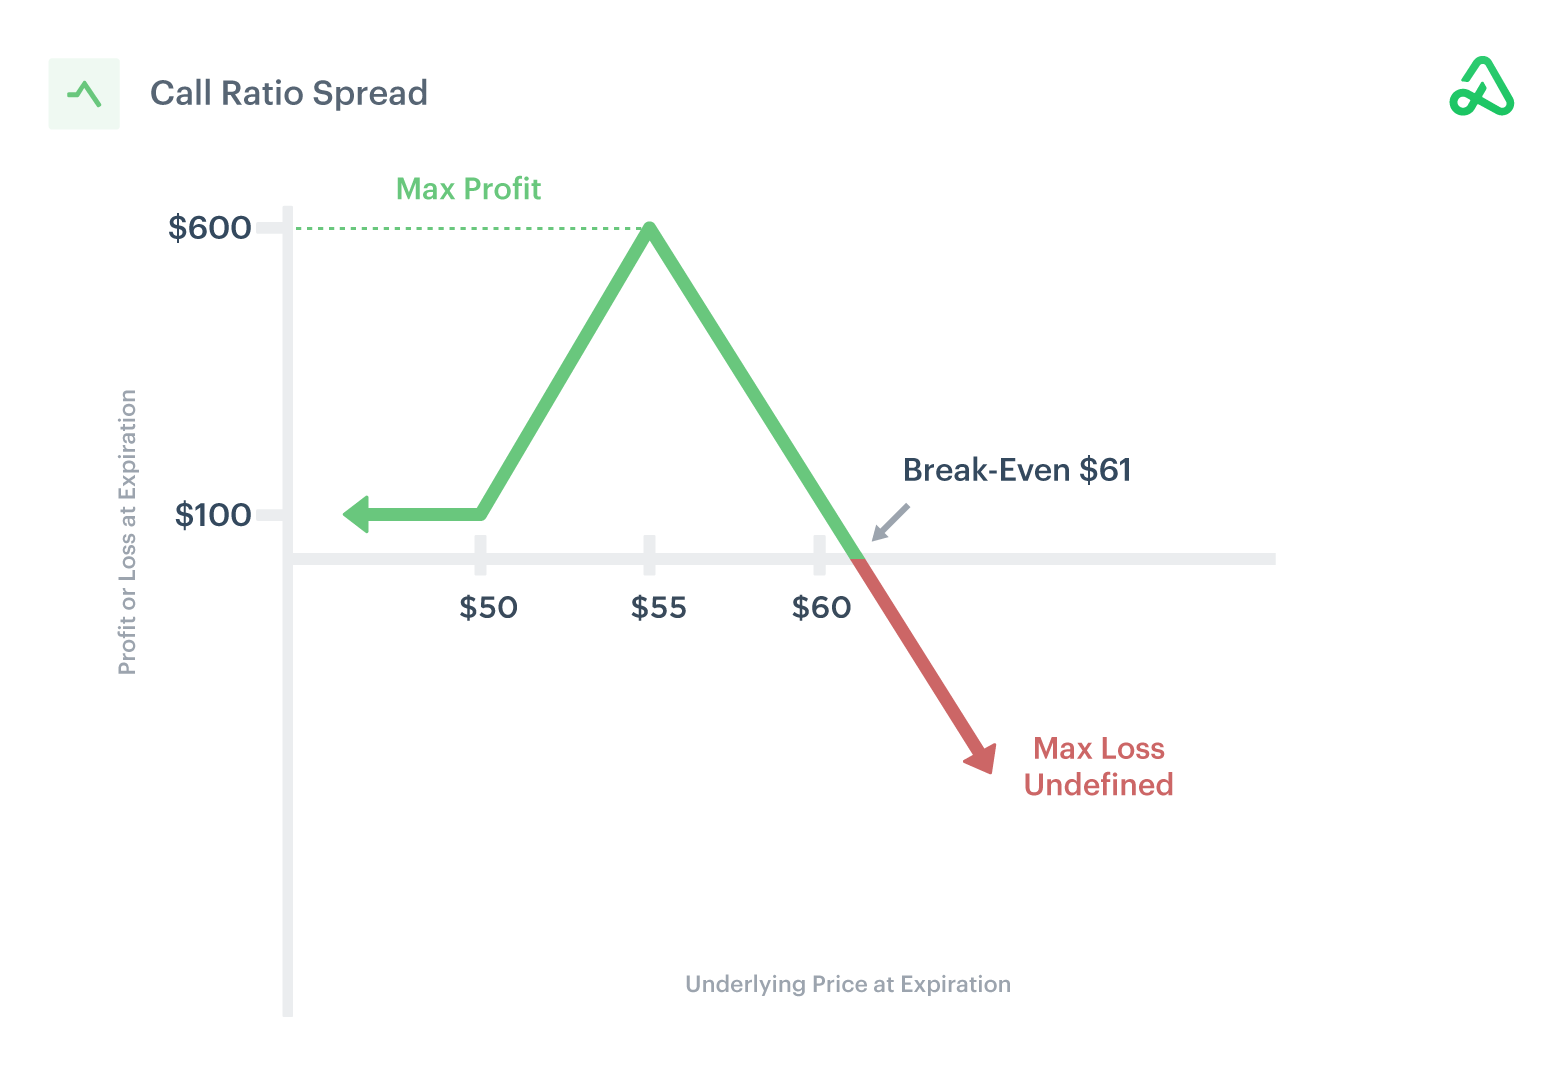
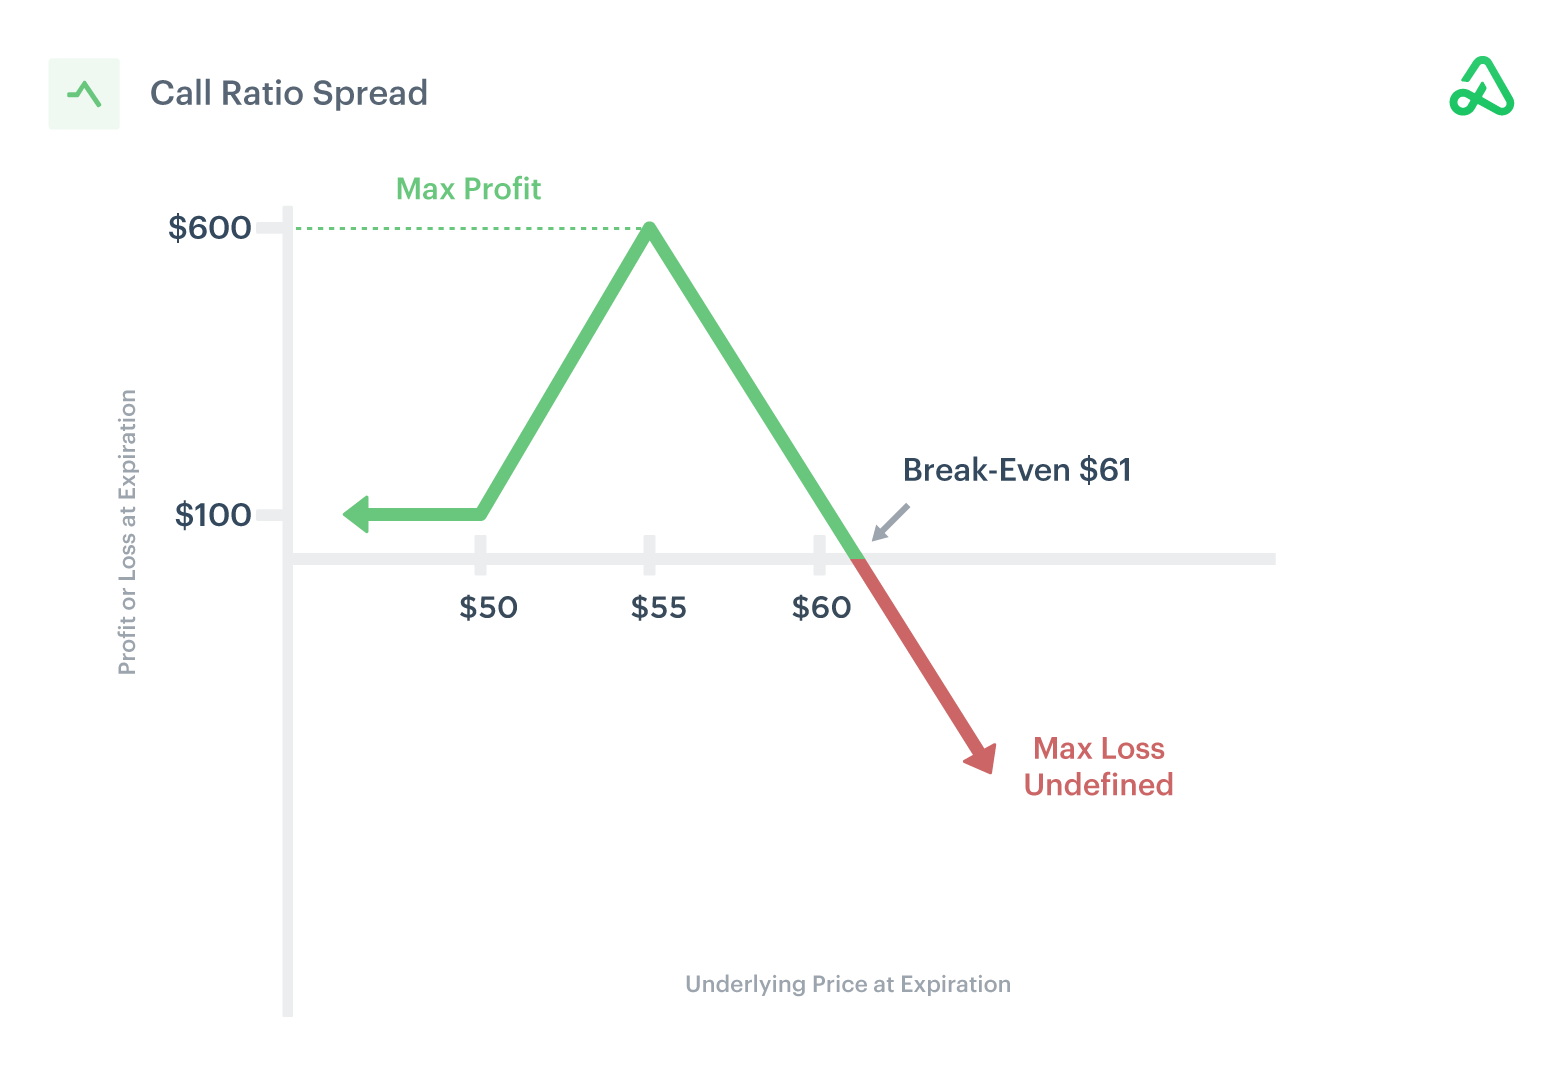
For instance, as discussed Friday, ratio spreads continue to work well for low- or no-cost exposure to the upside. 

Graphic: Via Option Alpha.

Pursuant to those remarks, no-cost spreads this letter’s writer has structured in Alphabet Inc (NASDAQ: GOOG) (NASDAQ: GOOGL) are pricing hundreds of dollars in credit to close.

Graphic: Via Charles Schwab Corporation-owned (NYSE: SCHW) TD Ameritrade’s Thinkorswim. 

Obviously, there’s no mention, here, of the risk management (e.g., sizing and width) involved. Again, this is as I’m trying to give actionable info without providing explicit recommendations.

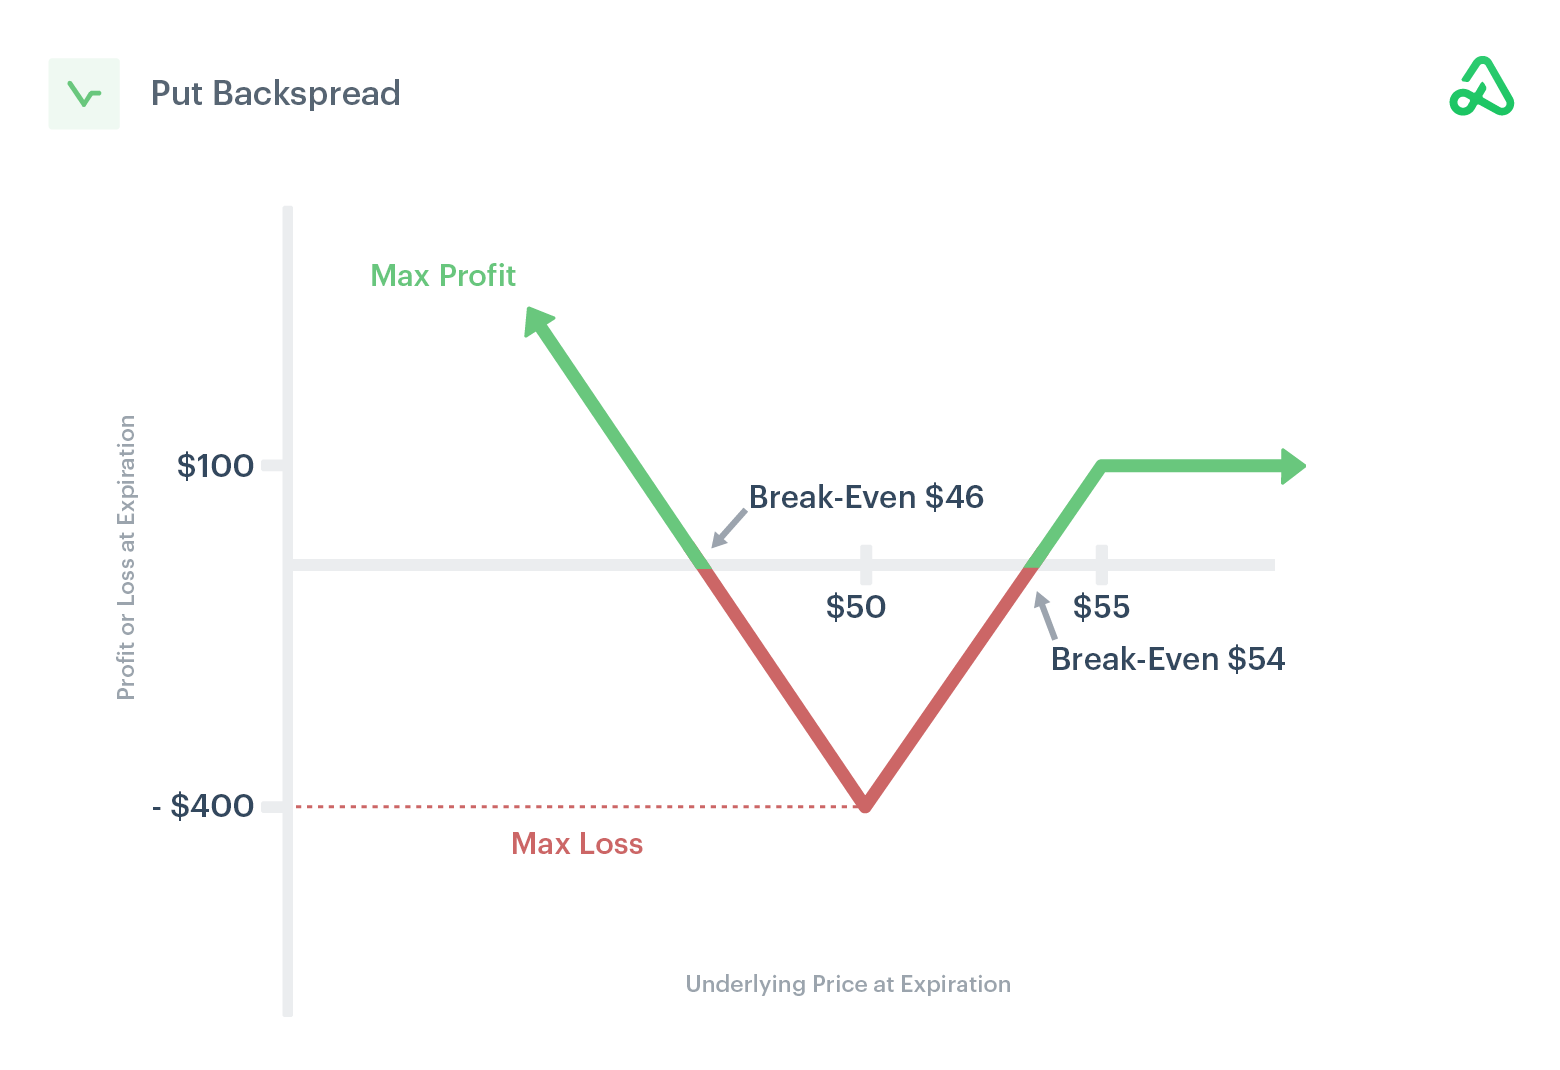
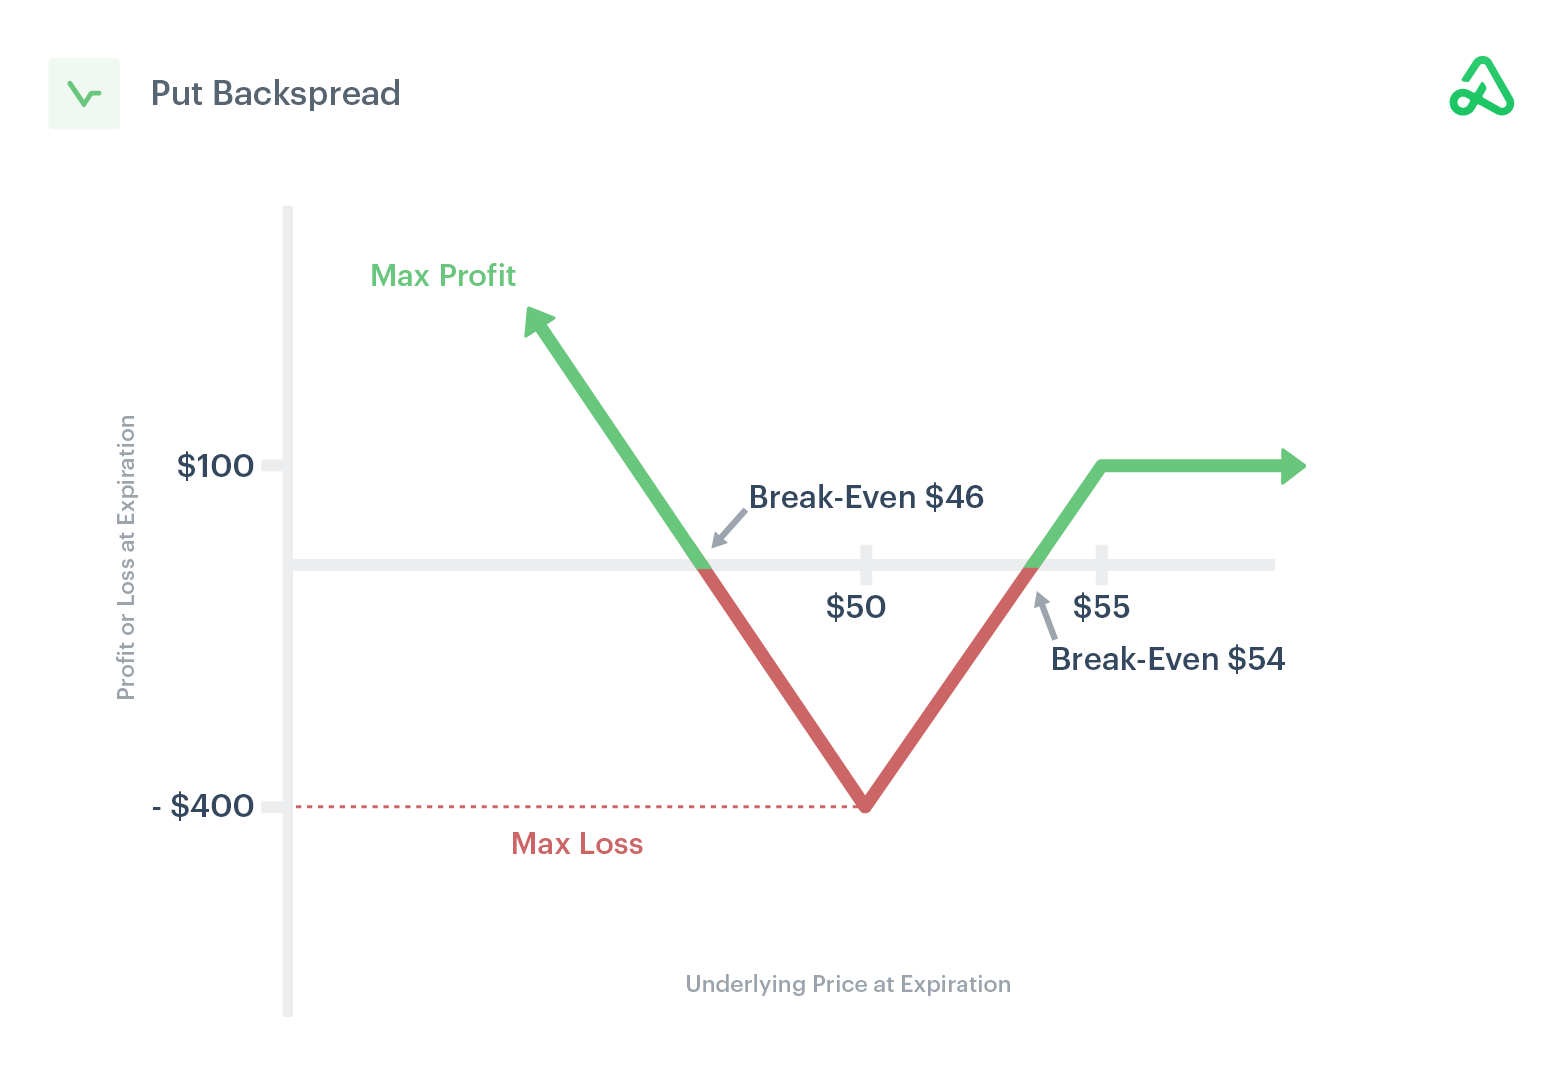
Similarly, if one thought volatility, though at a high starting point particularly at the money (ATM), was due for a repricing, they would look for exposure to the downside via something such as an inverse ratio (or back spread), as said last week.

Graphic: Via Option Alpha.

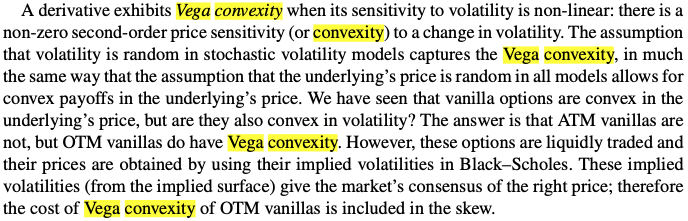
This is as the ATMs, unlike those further out of the money (OTM), are less convex in vega.

Graphic: Via Mohamed Bouzoubaa et al’s Exotic Options and Hybrids.

Technical

As of 7:00 AM ET, Monday’s regular session (9:30 AM – 4:00 PM ET), in the S&P 500, is likely to open in the middle-to-lower part of a negatively skewed overnight inventory, inside of prior-range and -value, suggesting a limited potential for immediate directional opportunity.

In the best case, the S&P 500 trades higher.

Any activity above the $3,867.25 LVNode puts into play the $3,909.25 MCPOC. Initiative trade beyond the MCPOC could reach as high as the $3,943.25 HVNode and $3,982.75 LVNode, or higher.

In the worst case, the S&P 500 trades lower.

Any activity below the $3,867.25 LVNode puts into play the $3,831.00 VPOC. Initiative trade beyond the VPOC could reach as low as the $3,800.25 LVNode and $3,755.00 VPOC, or lower.

Click here to load today’s key levels into the web-based TradingView charting platform. Note that all levels are derived using the 65-minute timeframe. New links are produced, daily.
Graphic: 65-minute profile chart of the Micro E-mini S&P 500 Futures.

Considerations: Responsiveness near key-technical areas (that are discernable visually on a chart), suggests technically-driven traders with short time horizons are very active. 

Such traders often lack the wherewithal to defend retests and, additionally, the type of trade may be indicative of the other time frame participants waiting for more information to initiate trades.

Example: The below 65-minute S&P 500 chart with volume profiles was included in the July 8, 2022 edition of the newsletter. Prices were near an inflection (micro-composite point of control and two key volume-weighted average price levels). From thereon, selling surfaced.

This is what is meant by responsiveness near key-technical areas.
Graphic: Updated 7/2/22. 65-minute profile chart of the Micro E-mini S&P 500 Futures.

Definitions

Volume Areas: A structurally sound market will build on areas of high volume (HVNodes). Should the market trend for long periods of time, it will lack sound structure, identified as low volume areas (LVNodes). LVNodes denote directional conviction and ought to offer support on any test. 

If participants were to auction and find acceptance into areas of prior low volume (LVNodes), then future discovery ought to be volatile and quick as participants look to HVNodes for favorable entry or exit.

POCs: POCs are valuable as they denote areas where two-sided trade was most prevalent in a prior day session. Participants will respond to future tests of value as they offer favorable entry and exit.

MCPOCs: POCs are valuable as they denote areas where two-sided trade was most prevalent over numerous day sessions. Participants will respond to future tests of value as they offer favorable entry and exit.

Volume-Weighted Average Prices (VWAPs): A metric highly regarded by chief investment officers, among other participants, for quality of trade. Additionally, liquidity algorithms are benchmarked and programmed to buy and sell around VWAPs.

About

After years of self-education, strategy development, mentorship, and trial-and-error, Renato Leonard Capelj began trading full-time and founded Physik Invest to detail his methods, research, and performance in the markets.

Capelj also develops insights around impactful options market dynamics at SpotGamma and is a Benzinga reporter.

Some of his works include conversations with ARK Invest’s Catherine Wood, investors Kevin O’Leary and John Chambers, FTX’s Sam Bankman-Fried, former Bridgewater Associate Andy Constan, Kai Volatility’s Cem Karsan, The Ambrus Group’s Kris Sidial, among many others.

Disclaimer

In no way should the materials herein be construed as advice. Derivatives carry a substantial risk of loss. All content is for informational purposes only.
Categories
Commentary

Daily Brief For July 8, 2022

The daily brief is a free glimpse into the prevailing fundamental and technical drivers of U.S. equity market products. Join the 300+ that read this report daily, below!

Graphic updated 6:30 AM ET. Sentiment Neutral if expected /ES open is inside of the prior day’s range. /ES levels are derived from the profile graphic at the bottom of the following section. Levels may have changed since initially quoted; click here for the latest levels. SqueezeMetrics Dark Pool Index (DIX) and Gamma (GEX) calculations are based on where the prior day’s reading falls with respect to the MAX and MIN of all occurrences available. A higher DIX is bullish. At the same time, the lower the GEX, the more (expected) volatility. Learn the implications of volatility, direction, and moneyness. Breadth reflects a reading of the prior day’s NYSE Advance/Decline indicator. VIX reflects a current reading of the CBOE Volatility Index (INDEX: VIX) from 0-100.

Fundamental

A light few letters after what it seems were like weeks of heavy content to discuss.

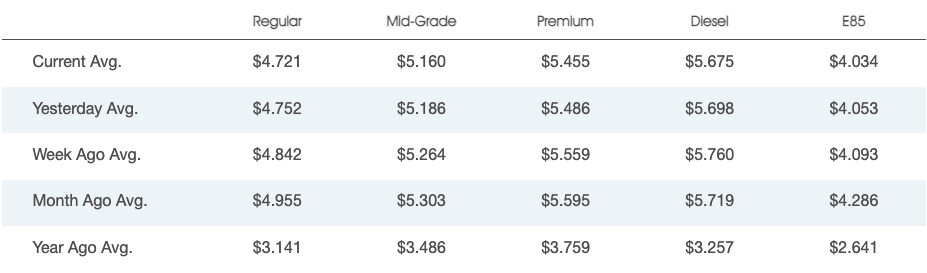
Further, prices at the pump are falling on an “unseasonal” drop in consumption, all the while the biggest bulls have tempered their outlooks on the market citing inflation and the implications of geopolitical tensions.

Graphic: National average gas prices posted by AAA.

An overseas slowdown affecting China likely solicits stimulus. Reported was China’s Ministry of Finance considering the sale of special bonds with proceeds used to pay for infrastructure and boost a slowed economy increasingly in the clear from Covid.

Graphic: Shared by Alfonso Peccatiello. “the pace of real-economy money printing (not bank reserves…) going on in the 5 largest economies in the world. It’s a good leading indicator for economic growth & the performance of several asset classes. It just printed below the GFC lows.”

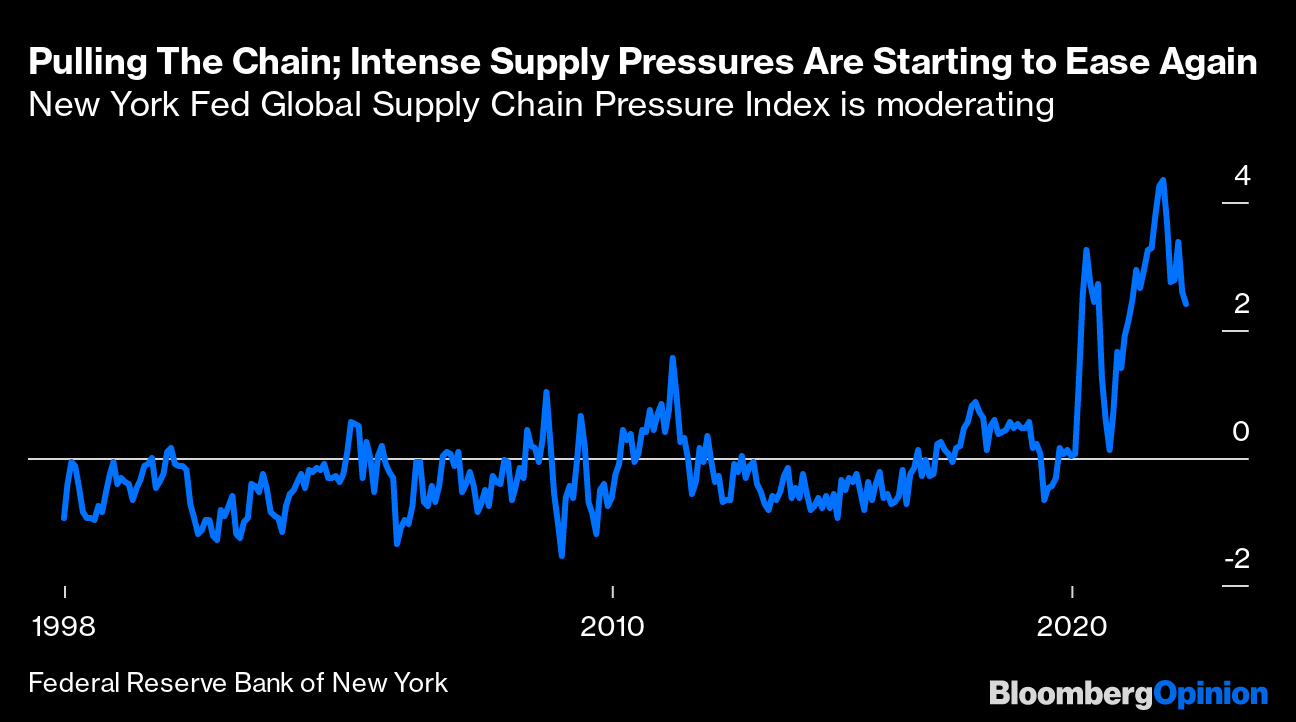
Moreover, as talked about yesterday, inflation may have peaked. Inventories are pointing to a looming supply gut.

Graphic: Via Bloomberg.

Accordingly, the Federal Reserve (Fed), just as it was slow to end stimulus late last year and early this year, maybe slow in moderating its efforts to de-stimulate.

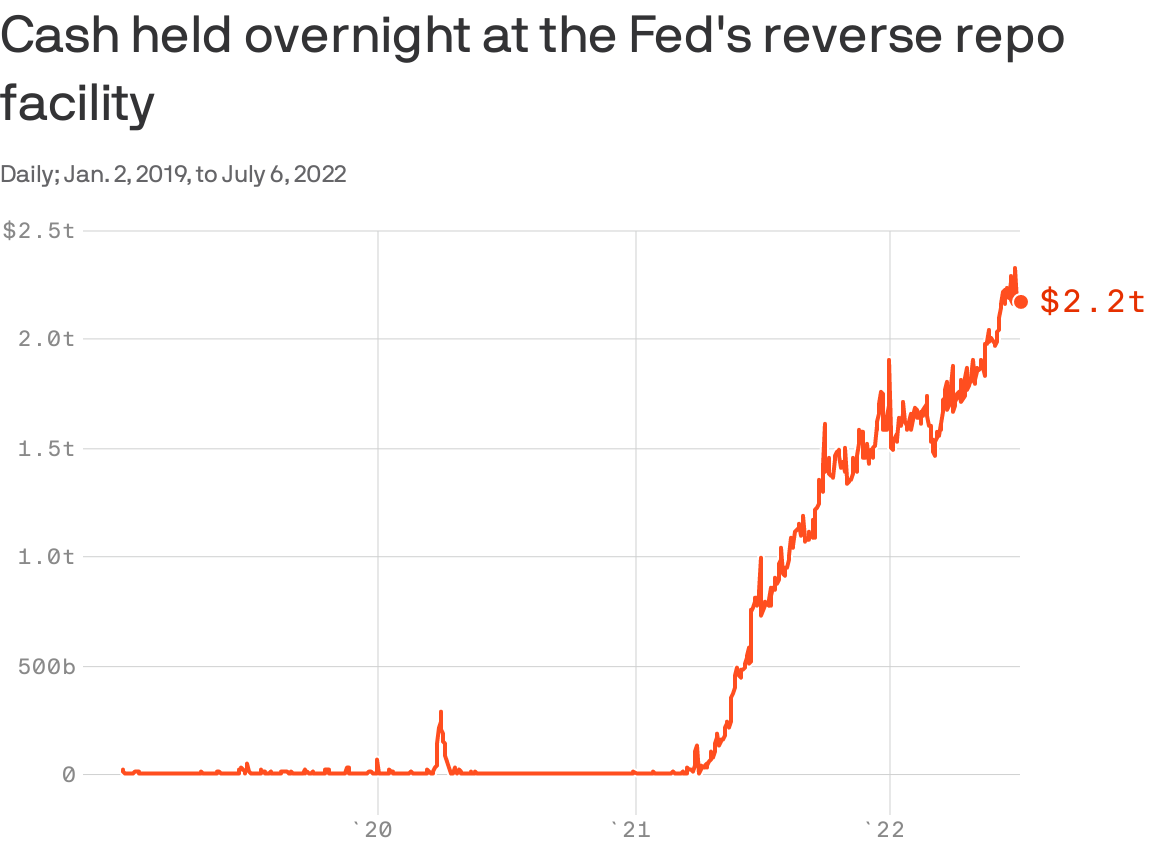
Graphic: Retrieved from Axios. “The glut of cash being parked at the Fed is reflective of policies that have already run their course, especially with quantitative tightening underway.” But, “it’s a representation of how much too far the Fed went in easing,” says Thomas Simon, an economist at Jefferies Financial Group (NYSE: JEF).

Minutes from the last Federal Open Market Committee (FOMC) meeting revealed a rate hike up to 75 basis points in July would be appropriate, per Moody’s Corporation (NYSE: MCO).

A strong jobs report would likely prompt the Fed “to raise rates even more aggressively as they pursue their goal to raise the unemployment rate,” explains Bryce Doty of Sit Fixed Income.

“As [the Fed] seek[s] to destroy demand, they are also destroying supply. As a result, inflation will persist longer and the economy will be even worse.”

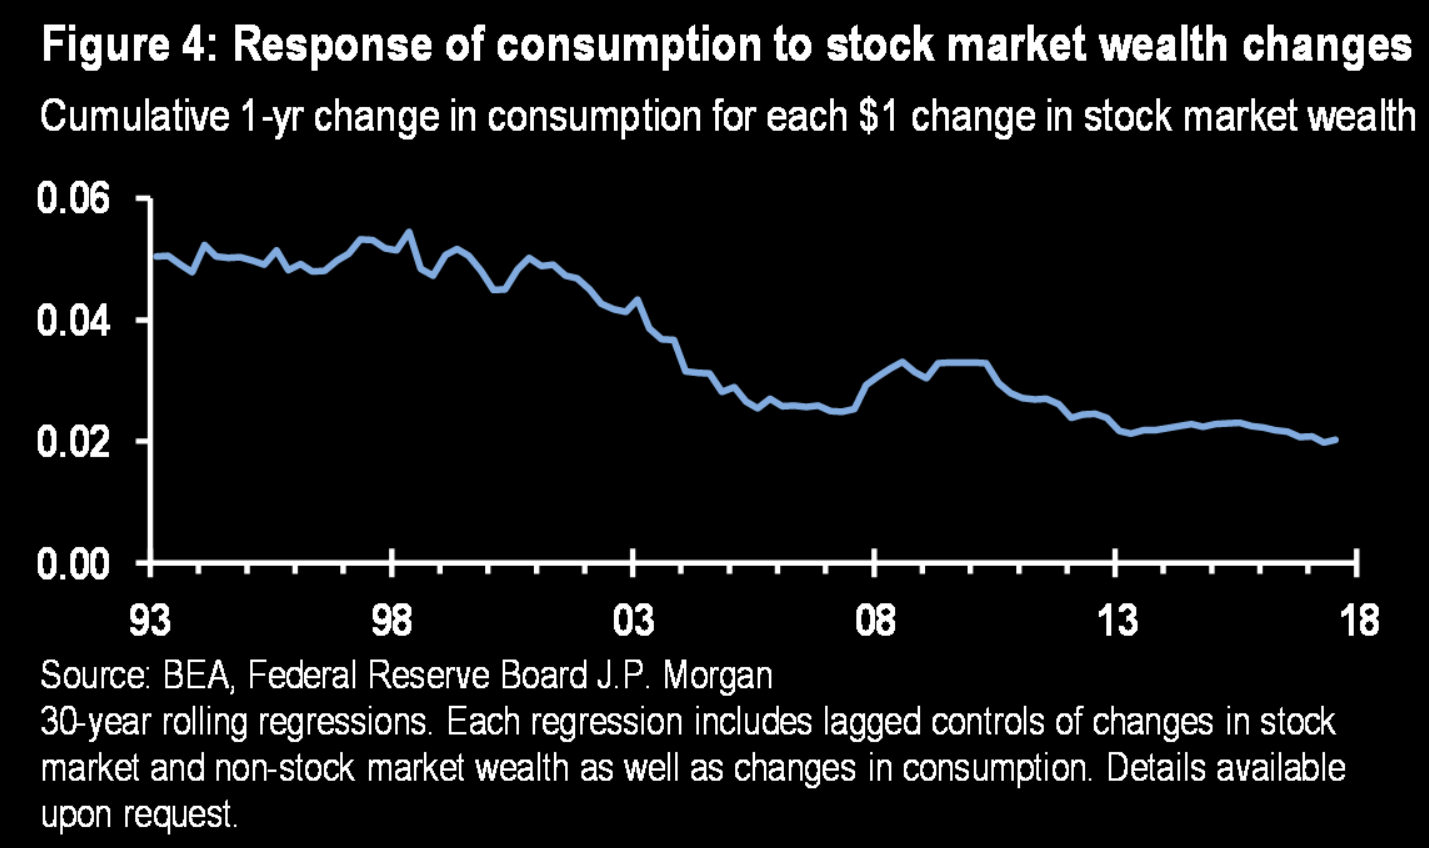
This is pursuant to calls by the Credit Suisse Group AG’s (NYSE: CS) Zoltan Pozsar who put forth, earlier this year, that the “Fed is pursuing demand destruction through negative wealth effects,” as the “central banks can only deal with nominal [and] not real chokepoints.”

Graphic: Via JPMorgan Chase & Co (NYSE: JPM). Taken from The Market Ear. “A stronger dollar, lower equity prices, and higher mortgage rates will weigh on demand growth [and] Over time weaker output demand should lead to weaker labor demand Don’t fight the Fed as this is what Fed wants (slower growth).”

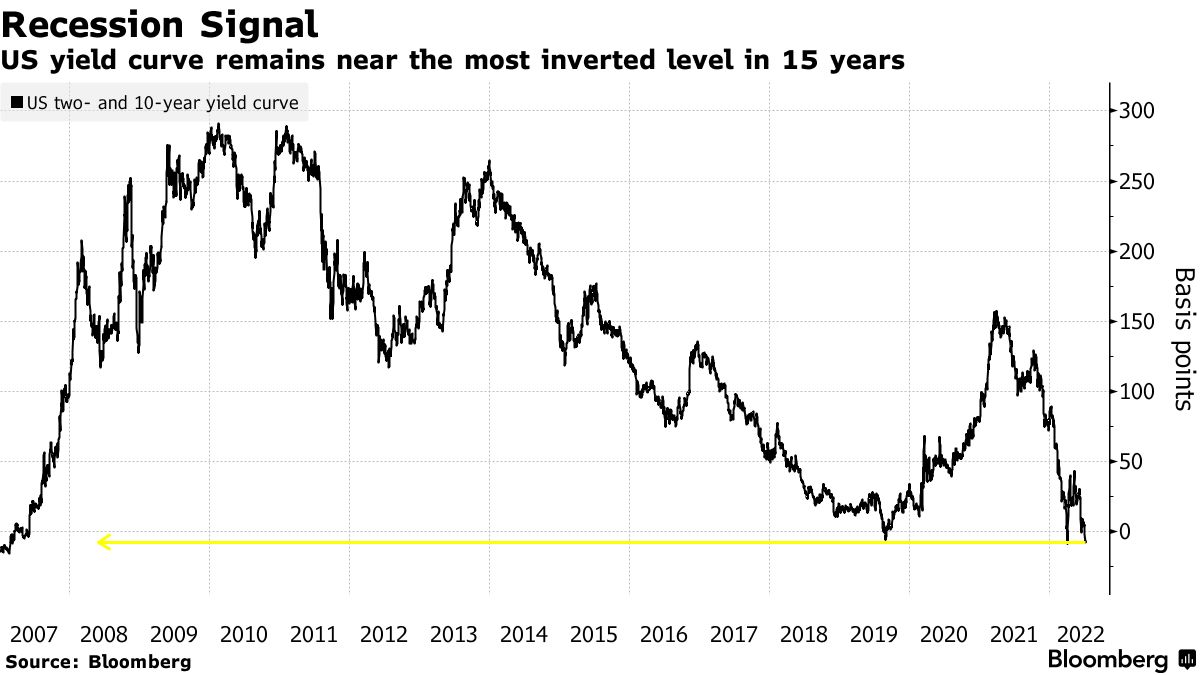
Ultimately, the “risk of recession, whether it is real or merely implied by an inversion of the yield curve, won’t deter the Fed from hiking rates higher faster or from injecting more volatility to build up negative wealth effects.”

“Rallies could beget more forceful pushback from the Fed – the new game.”

Graphic: Via Bloomberg.

Positioning

Data shows net gamma exposure increasing which may increasingly feed into smaller ranges and a positive drift amid shorter-dated volatility sales and a pick up in call demand, particularly in some of the larger index weights.

Graphic: Via SpotGamma’s Hedging Impact of Real-Time Options (HIRO) indicator for Alphabet Inc (NASDAQ: GOOG) (NASDAQ: GOOGL). Rising orange and blue lines point to call buying and put selling, both of which have bullish implications.

The creep in volatility realized (RVOL), versus that which is implied (IVOL), coupled with “a flattening in the downside fixed strike skew, while the upside wings [are] more smiley,” per JPMorgan Chase & Co (NYSE: JPM), makes it so we can put on more complex structures.

Graphic: Via S&P Global Inc (NYSE: SPGI). As explained by SpotGamma, “30-day realized SPX volatility is now trading above the VIX, something that generally shows after major selloffs wherein IV “premium” needs to reset to calmer/higher equity markets.”

For instance, ratio spreads continue to work well for low- or no-cost exposure to the upside. 

Graphic: Via Option Alpha.

Likewise, if one thought volatility, though at a high starting point particularly at the money (ATM), was due for a repricing, they would look for exposure to the downside via something such as an inverse ratio (or backspread). 

This is as the ATMs, unlike those further out of the money (OTM), are less convex in vega.

Graphic: Via Option Alpha.

Technical

As of 6:30 AM ET, Friday’s regular session (9:30 AM – 4:00 PM ET), in the S&P 500, is likely to open in the upper part of a negatively skewed overnight inventory, inside of prior-range and -value, suggesting a limited potential for immediate directional opportunity.

In the best case, the S&P 500 trades higher.

Any activity above the $3,909.25 MCPOC puts into play the $3,943.25 HVNode. Initiative trade beyond the HVNode could reach as high as the $3,982.75 LVNode and $4,016.25 HVNode, or higher.

In the worst case, the S&P 500 trades lower.

Any activity below the $3,909.25 MCPOC puts into play the $3,867.25 LVNode. Initiative trade beyond the LVNode could reach as low as the $3,831.00 VPOC and $3,800.25 LVNode, or lower.

Click here to load today’s key levels into the web-based TradingView charting platform. Note that all levels are derived using the 65-minute timeframe. New links are produced, daily.
Graphic: 65-minute profile chart of the Micro E-mini S&P 500 Futures.

Considerations: Responsiveness near key-technical areas (that are discernable visually on a chart), suggests technically-driven traders with short time horizons are very active. 

Such traders often lack the wherewithal to defend retests and, additionally, the type of trade may be indicative of the other time frame participants waiting for more information to initiate trades.

Definitions

Volume Areas: A structurally sound market will build on areas of high volume (HVNodes). Should the market trend for long periods of time, it will lack sound structure, identified as low volume areas (LVNodes). LVNodes denote directional conviction and ought to offer support on any test. 

If participants were to auction and find acceptance into areas of prior low volume (LVNodes), then future discovery ought to be volatile and quick as participants look to HVNodes for favorable entry or exit.

POCs: POCs are valuable as they denote areas where two-sided trade was most prevalent in a prior day session. Participants will respond to future tests of value as they offer favorable entry and exit.

MCPOCs: POCs are valuable as they denote areas where two-sided trade was most prevalent over numerous day sessions. Participants will respond to future tests of value as they offer favorable entry and exit.

Volume-Weighted Average Prices (VWAPs): A metric highly regarded by chief investment officers, among other participants, for quality of trade. Additionally, liquidity algorithms are benchmarked and programmed to buy and sell around VWAPs.

About

After years of self-education, strategy development, mentorship, and trial-and-error, Renato Leonard Capelj began trading full-time and founded Physik Invest to detail his methods, research, and performance in the markets.

Capelj also develops insights around impactful options market dynamics at SpotGamma and is a Benzinga reporter.

Some of his works include conversations with ARK Invest’s Catherine Wood, investors Kevin O’Leary and John Chambers, FTX’s Sam Bankman-Fried, former Bridgewater Associate Andy Constan, Kai Volatility’s Cem Karsan, The Ambrus Group’s Kris Sidial, among many others.

Disclaimer

In no way should the materials herein be construed as advice. Derivatives carry a substantial risk of loss. All content is for informational purposes only.
Categories
Commentary

Daily Brief For July 7, 2022

The daily brief is a free glimpse into the prevailing fundamental and technical drivers of U.S. equity market products. Join the 300+ that read this report daily, below!

Graphic updated 7:00 AM ET. Sentiment Neutral if expected /ES open is inside of the prior day’s range. /ES levels are derived from the profile graphic at the bottom of the following section. Levels may have changed since initially quoted; click here for the latest levels. SqueezeMetrics Dark Pool Index (DIX) and Gamma (GEX) calculations are based on where the prior day’s reading falls with respect to the MAX and MIN of all occurrences available. A higher DIX is bullish. At the same time, the lower the GEX, the more (expected) volatility. Learn the implications of volatility, direction, and moneyness. Breadth reflects a reading of the prior day’s NYSE Advance/Decline indicator. VIX reflects a current reading of the CBOE Volatility Index (INDEX: VIX) from 0-100.

Fundamental

An incredibly busy past few months with what it seems are back-to-back historic developments.

For instance, just this week, crypto broker Voyager Digital (OTC: VYGVF) filed for bankruptcy. “Impaired” will be account holders who likely won’t be “getting back exactly what they’re owed,” as reported by Bloomberg.

This is on the heels of crypto market volatility affecting some of Voyager’s largest borrowers like Three Arrows Capital, an embattled hedge fund. Voyager lent deposits to these parties at rates of interest that were ultra-high. Customers were then, accordingly, paid high rates.

However, this was done under the impression that the customer holdings were liquid, easy to access, and not subject to counterparty risks. That didn’t happen. Voyager, like others, was “making a lot of unsecured or undersecured loans.”

What’s the takeaway, here? Bloomberg’s Matt Levine explains well. 

“If supposedly safe crypto brokerages keep failing and customers keep losing money, that is bad for the whole ecosystem; if your money isn’t safe with any crypto brokerage then you might just not buy crypto.”

Others in the ecosystem have continued to lever on the supposed successes of crypto. The failure of Voyager, among others, may have knock-on effects to be felt much later in the cycle.

Another historic development was the London Metal Exchange’s (LME) cancellation of billions of dollars in trades. This made whole large bettors in that ecosystem, all the while dinging liquidity providers, badly.

Some, including algorithmic fund Transtrend, left the LME as they could no longer trust it with client funds.

The question is what now? What’s the next big thing and, more importantly, will it have an impact on the traditional markets we watch?

As talked about in past analyses, it is over the last four decades that monetary policies were a go-to for supporting the economy. From that, created was “a disinterest and unimportance to cash flows.”

The commitment to reducing liquidity and credit has consequences on the real economy and asset prices, accordingly, which rose and kept the deflationary pressures of policies at bay.

It is elevated volatility, persistent declines, slower tightening processes abroad, among other things, that are to prompt investors to lower their selling prices in risk(ier) assets (e.g., options bets, metals, cryptocurrency and stablecoins, equities, bonds) and compete for cash.

Graphic: Via TradingView. Retrieved by Physik Invest.

This all is to continue bolstering the dollar’s surge to some of its strongest levels in years.

Graphic: Retrieved from Aksel Kibar, CMT.

As well as further douse inflation (which is likely to peak on inventories bloat and a “supply gut”) and, eventually, prompt the Federal Reserve to reverse its aggressive rate hike and quantitative tightening (QT) path.

Graphic: Posted by Joe Weisenthal. “Wheat has erased all of its gains for the year. Also, it looks like corn and soy are rolling over.”

“It is starting,” Nassim Nicholas Taleb said online. “I’ve seen gluts not followed by shortages, but I’ve never seen a shortage not followed by a glut.”

ARK Invest’s Catherine Wood, who was very early to call the peak inflation, puts forth that “If inventories and stock prices are leading indicators for employment and wages, … then fears of cost-push inflation a la 1970’s should disappear during the next six months.”

Positioning

Thus far, we’re far into a dot-com type collapse, albeit one that has happened “underneath the surface of the indices,” per Simplify Asset Management’s Mike Green, as those largest stocks still are recipients of strong passive flows.

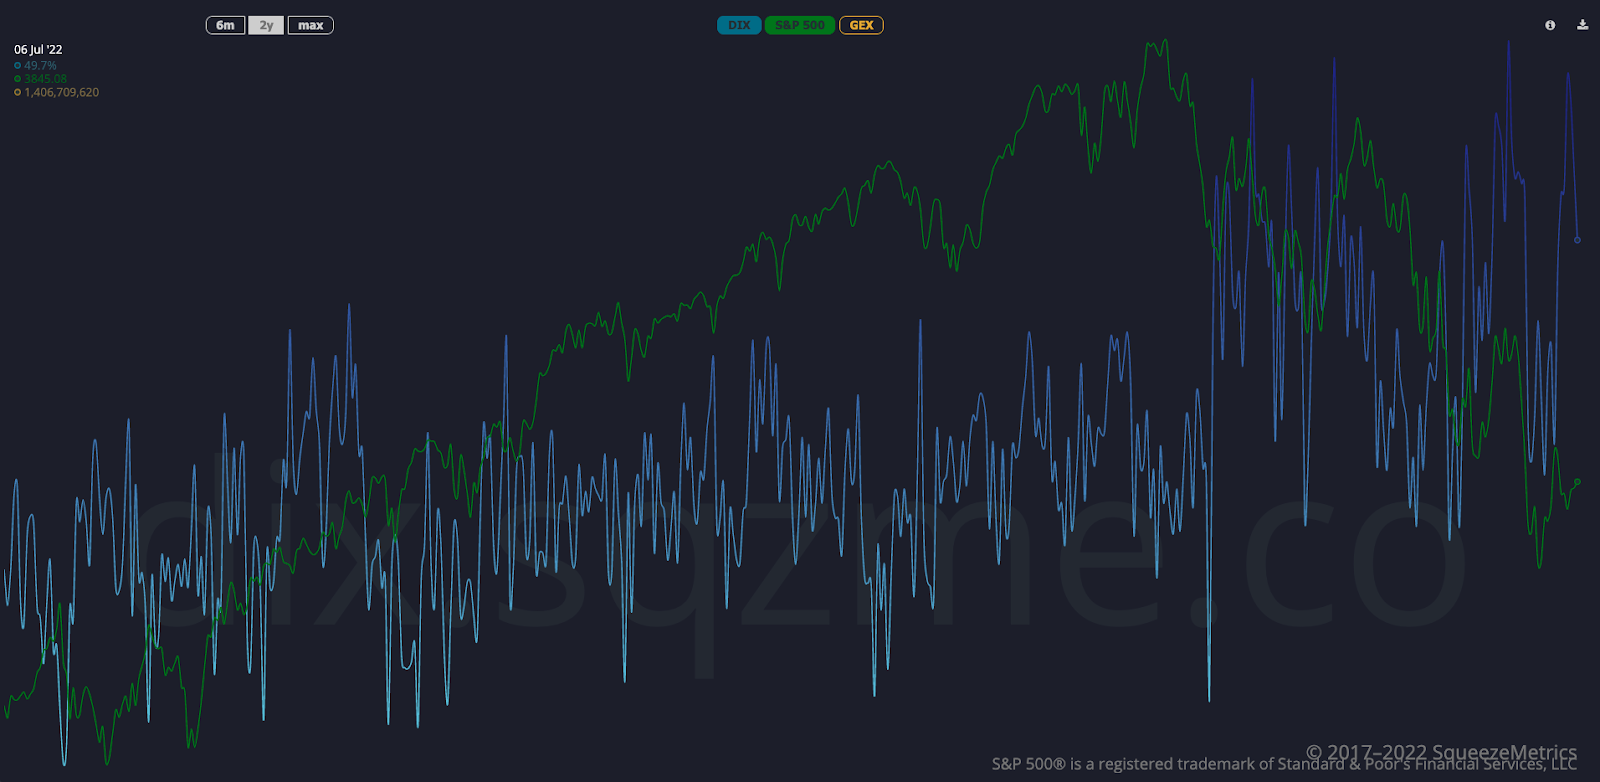
Graphic: SqueezeMetrics’ Dark Pool Index shows a trend in heightened implicit buying support.

The upcoming earnings season is likely to shed clarity with respect to corporates’ ability to weather or pass on higher costs. It is possible, as some put forth, that there is a broad “earnings compression,” deepening the de-rate in the face of what has been a “multiple compression.”

From a positioning perspective, so awing is the absence of heightened demand for downside skew, all the while that, on the upside, is bid probably due to the reach for bets on a ferocious bear market rally.

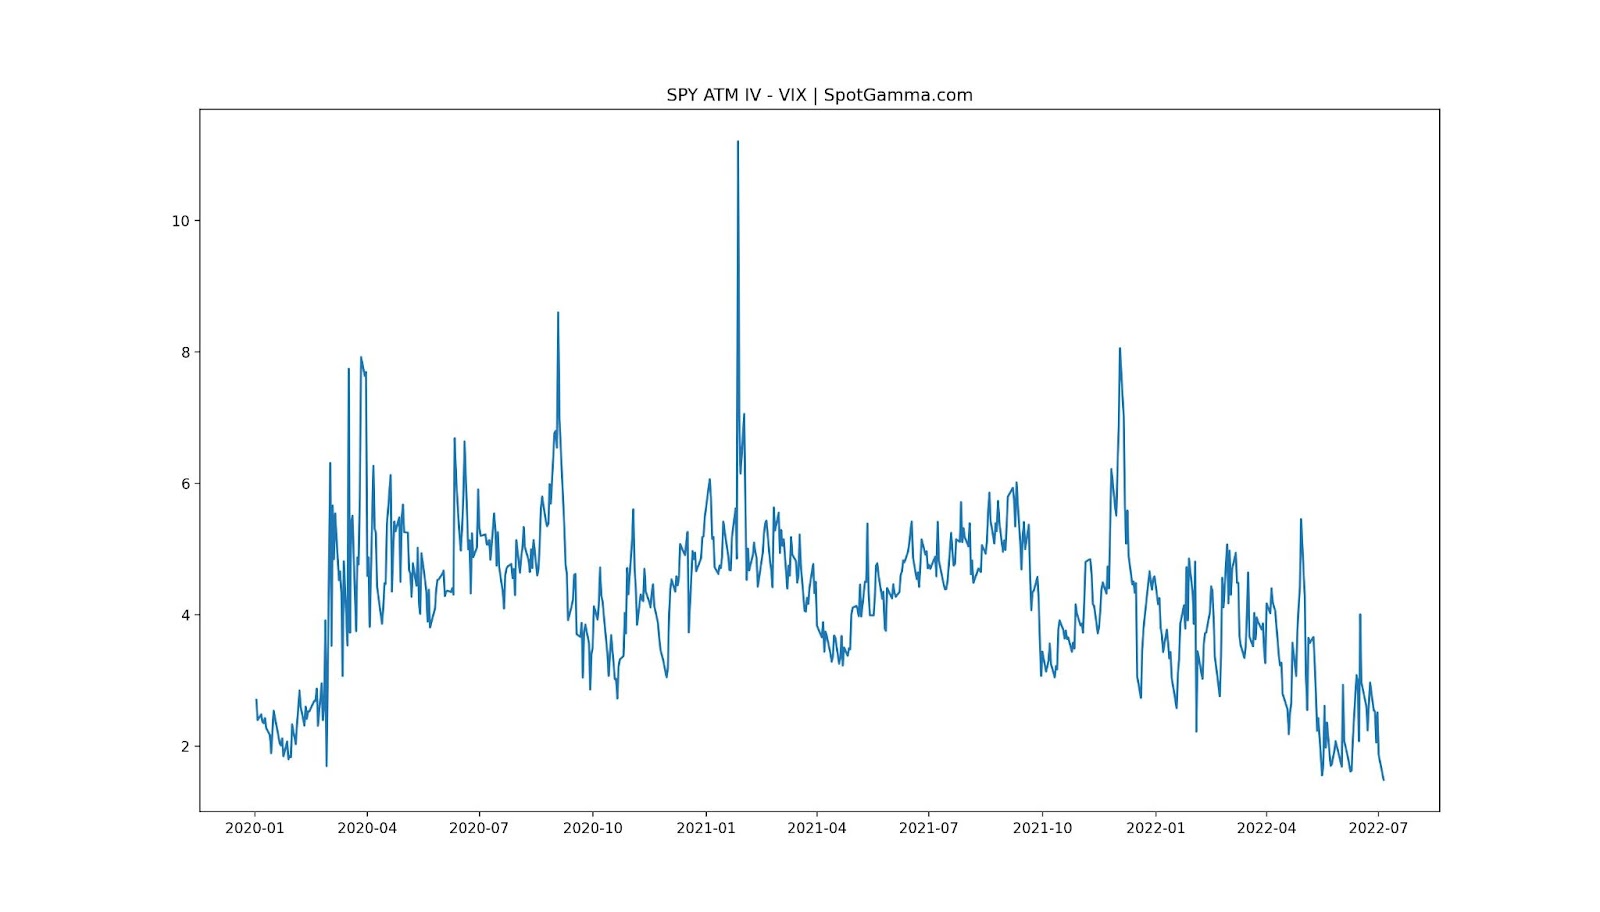
Graphic: Posted by SpotGamma. “30-day ATM SPY IV vs the VIX and while this plot has a bit of noise it seems to very closely resemble @Nations_Indexes VIX/VOLI measurement. One interpretation here is that OTM options aren’t trading for much premium over ATM (flat skew).”

As explained yesterday, it makes sense to be a buyer of volatility, albeit via complex structures. 

For instance, buying volatility on the upside that is closer to current prices and selling that which is farther out (if bullish). And (if bearish), opting for calendars (as it is volatility in the shortest of maturities being sold heavily), back spreads, and the like.

Read: Trading Volatility, Correlation, Term Structure and Skew by Colin Bennett.

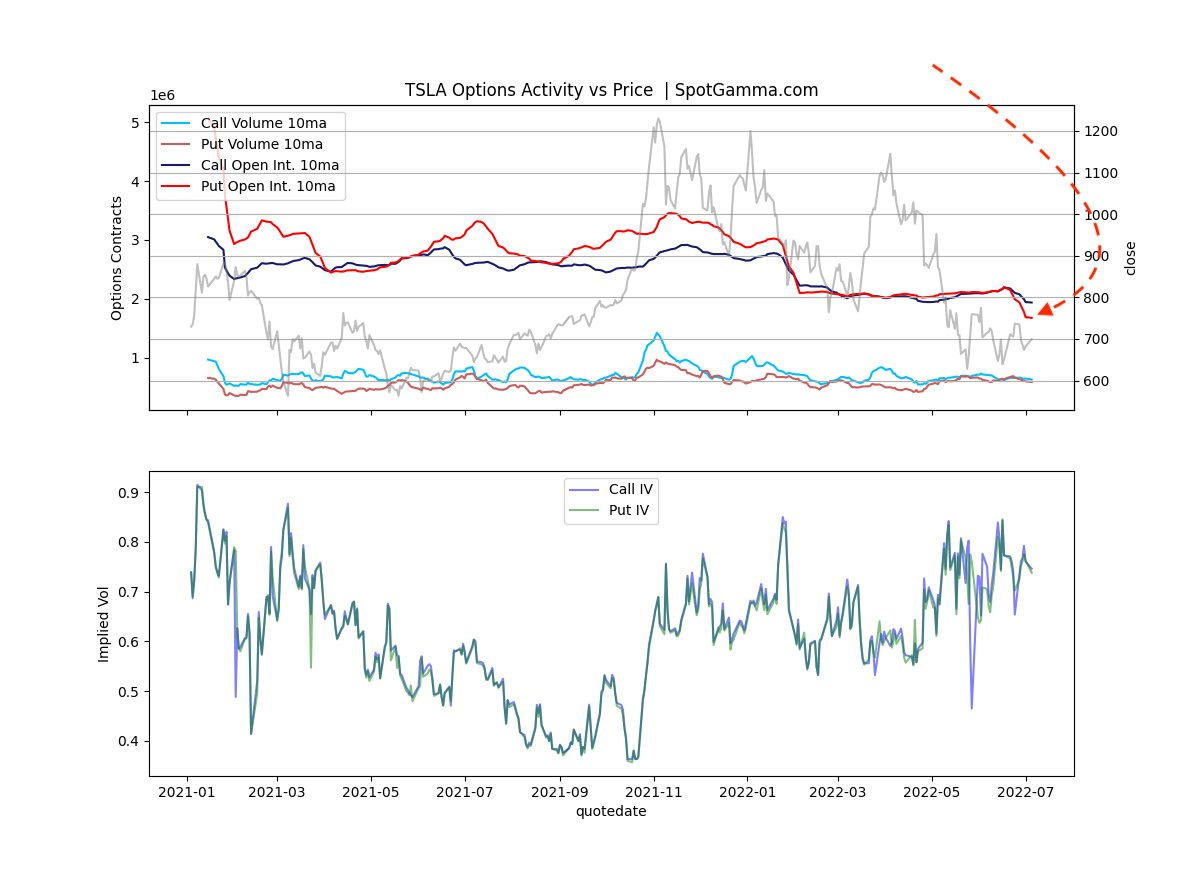
Graphic: Posted by SpotGamma. “TSLA open interest continues to decline, particularly on the put side as the stock trades near 1year lows. Interestingly at-the-money IV remains elevated to levels going back to the days of the $1200 call gamma squeeze.”

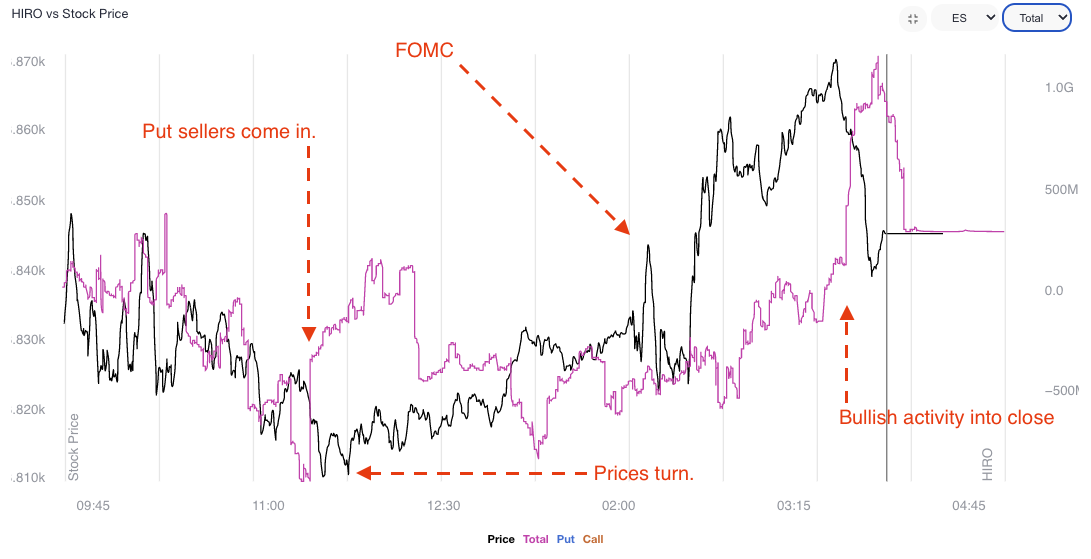
On a more granular level, after the release of the Federal Open Market Committee (FOMC) meeting minutes, participants added to their put sales and call buys, at the index level. The hedging of this does more to take from potential realized volatility. 

Graphic: Pictured is SpotGamma’s Hedging Impact of Real-Time Options (HIRO) indicator.

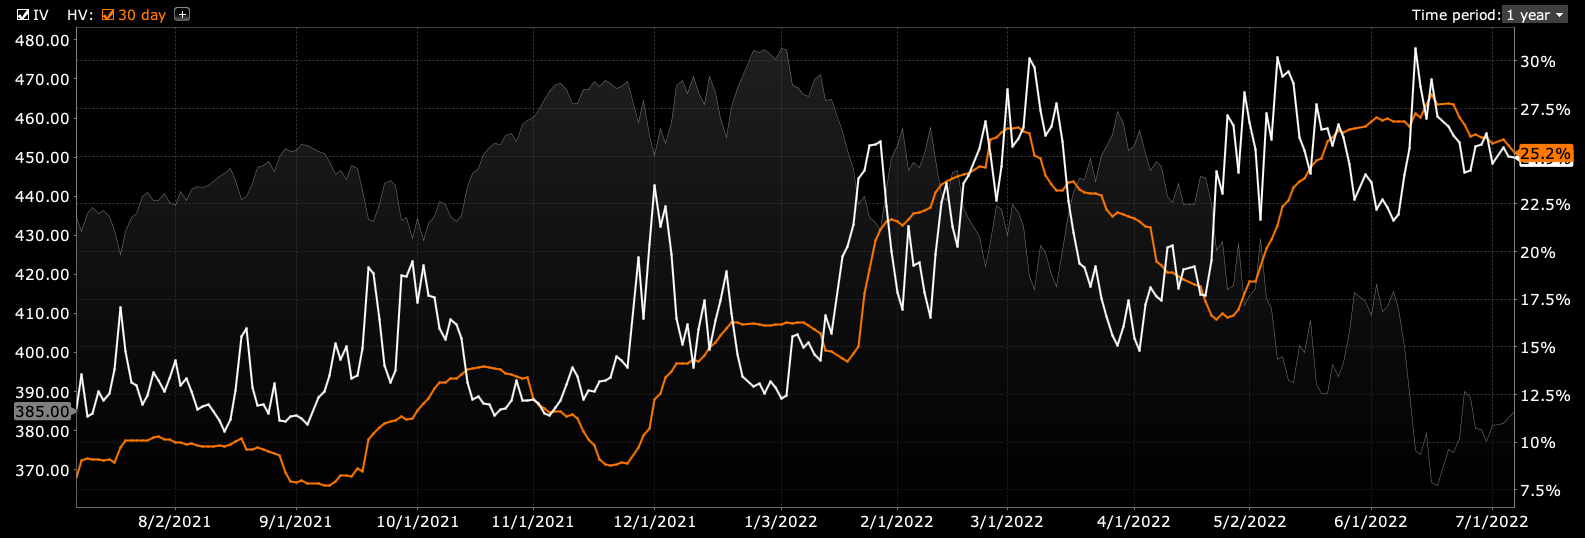
At its core, though, the market is at a pivot and losing the $3,800.00 S&P 500 area likely does more to bolster the creep in realized (RVOL) volatility, versus that which is implied (IVOL), all else equal.

Graphic: SPDR S&P 500 ETF Trust (NYSE: SPY) historical (orange) and implied (white) volatility via Interactive Brokers Group Inc’s (NASDAQ: IBKR) Trader Workstation.

Technical

As of 6:45 AM ET, Thursday’s regular session (9:30 AM – 4:00 PM ET), in the S&P 500, is likely to open in the middle part of a balanced overnight inventory, inside of prior-range and -value, suggesting a limited potential for immediate directional opportunity.

In the best case, the S&P 500 trades higher.

Any activity above the $3,859.00 overnight POC puts into play the $3,883.25 LVNode. Initiative trade beyond the LVNode could reach as high as the $3,909.25 MCPOC and $3,943.25 HVNode, or higher.

In the worst case, the S&P 500 trades lower.

Any activity below the $3,859.00 overnight POC puts into play the $3,831.00 VPOC. Initiative trade beyond the VPOC could reach as low as the $3,800.25 LVNode and $3,774.75 HVNode, or lower.

Click here to load today’s key levels into the web-based TradingView charting platform. Note that all levels are derived using the 65-minute timeframe. New links are produced, daily.
Graphic: 65-minute profile chart of the Micro E-mini S&P 500 Futures.

Definitions

Volume Areas: A structurally sound market will build on areas of high volume (HVNodes). Should the market trend for long periods of time, it will lack sound structure, identified as low volume areas (LVNodes). LVNodes denote directional conviction and ought to offer support on any test. 

If participants were to auction and find acceptance into areas of prior low volume (LVNodes), then future discovery ought to be volatile and quick as participants look to HVNodes for favorable entry or exit.

POCs: POCs are valuable as they denote areas where two-sided trade was most prevalent in a prior day session. Participants will respond to future tests of value as they offer favorable entry and exit.

MCPOCs: POCs are valuable as they denote areas where two-sided trade was most prevalent over numerous day sessions. Participants will respond to future tests of value as they offer favorable entry and exit.

Volume-Weighted Average Prices (VWAPs): A metric highly regarded by chief investment officers, among other participants, for quality of trade. Additionally, liquidity algorithms are benchmarked and programmed to buy and sell around VWAPs.

About

After years of self-education, strategy development, mentorship, and trial-and-error, Renato Leonard Capelj began trading full-time and founded Physik Invest to detail his methods, research, and performance in the markets.

Capelj also develops insights around impactful options market dynamics at SpotGamma and is a Benzinga reporter.

Some of his works include conversations with ARK Invest’s Catherine Wood, investors Kevin O’Leary and John Chambers, FTX’s Sam Bankman-Fried, former Bridgewater Associate Andy Constan, Kai Volatility’s Cem Karsan, The Ambrus Group’s Kris Sidial, among many others.

Disclaimer

In no way should the materials herein be construed as advice. Derivatives carry a substantial risk of loss. All content is for informational purposes only.
Categories
Commentary

Daily Brief For June 27, 2022

The daily brief is a free glimpse into the prevailing fundamental and technical drivers of U.S. equity market products. Join the 300+ that read this report daily, below!

What Happened

Overnight, equity index and commodity futures were higher while bonds were lower. Volatility measures were bid, too.

In the news is Russia’s default on foreign debts. Quarterly repositioning may bolster attempts higher, per JPMorgan Chase & Co (NYSE: JPM), while Morgan Stanley (NYSE: MS) strategists see the potential for lower with base cases calling for a soft economic landing.

Ahead is data on goods orders (8:30 AM ET) and pending home sales (10:00 AM ET).

Graphic updated 6:30 AM ET. Sentiment Risk-On if expected /ES open is above the prior day’s range. /ES levels are derived from the profile graphic at the bottom of the following section. Levels may have changed since initially quoted; click here for the latest levels. SqueezeMetrics Dark Pool Index (DIX) and Gamma (GEX) calculations are based on where the prior day’s reading falls with respect to the MAX and MIN of all occurrences available. A higher DIX is bullish. At the same time, the lower the GEX, the more (expected) volatility. Learn the implications of volatility, direction, and moneyness. SHIFT data used for S&P 500 (INDEX: SPX) options activity. Note that options flow is sorted by the call premium spent; if more positive, then more was spent on call options. Breadth reflects a reading of the prior day’s NYSE Advance/Decline indicator. VIX reflects a current reading of the CBOE Volatility Index (INDEX: VIX) from 0-100.

What To Expect

Fundamental: Very short, today.

Later this week, I’m excited to share some insights I gleaned from a veteran trader and macro strategist. As a preview, this person thinks that we are in a recession. However, a recovery in equity markets is not off the table with 2022 likely being a 1% total GPD year with 4% inflation.

Stay tuned for that.

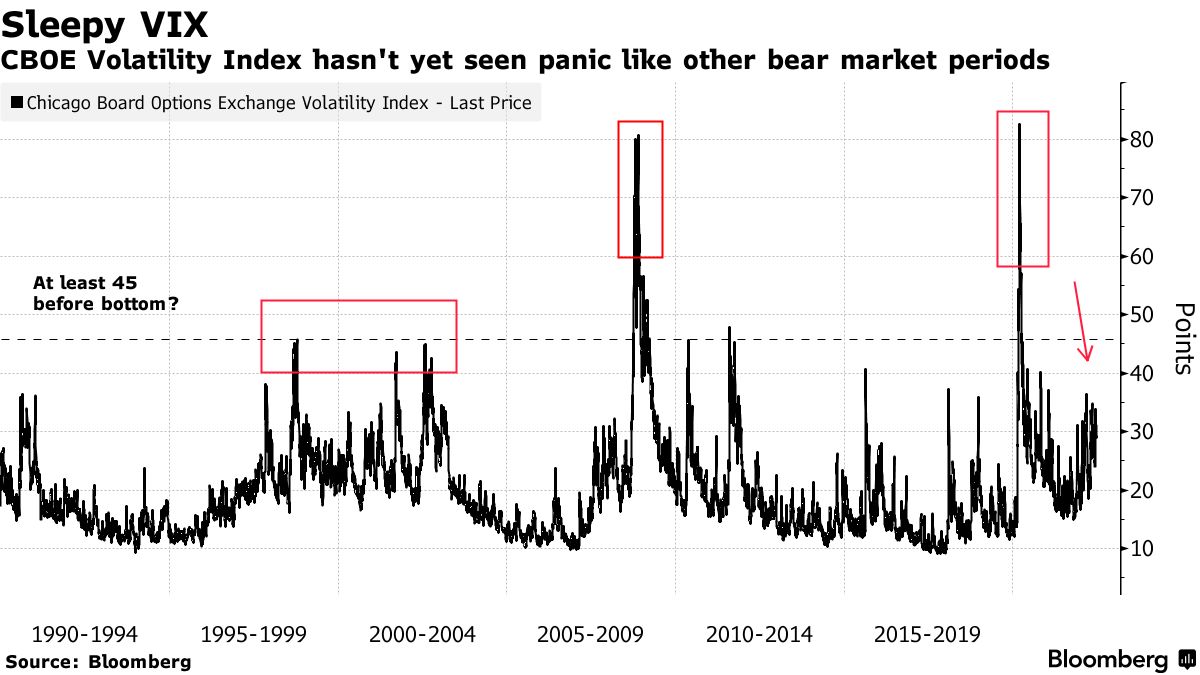
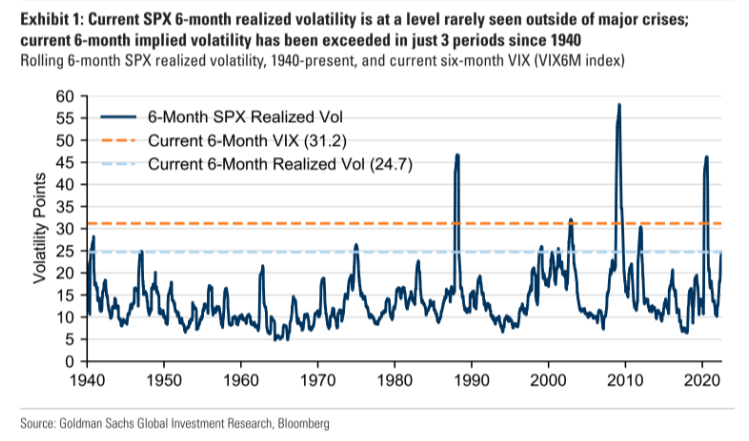
Positioning: We’ve been speaking on the demand for protection and the still-strong supply of it lending to tameness in Wall Street’s preferred “fear gauge,” relative to those gauges tracking markets like rates and commodities.

Graphic: Via Bloomberg.

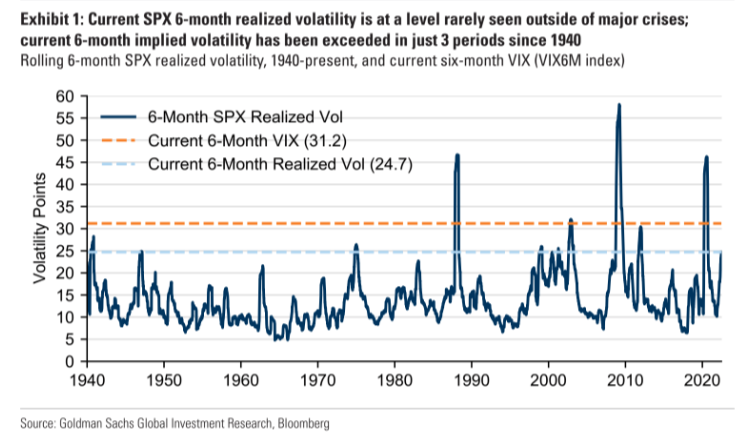
“The current behavior is playing out similar to the 2000-2002 dot-com bear market, with no big sudden shocks but sustained high realized volatility,” explained Talal Dehbi of PrismFP.

Graphic: Via Goldman Sachs Group Inc (NYSE: GS).

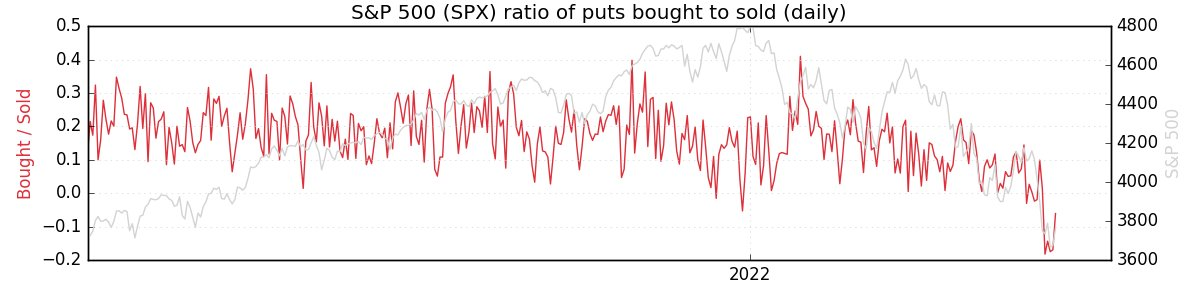
Options data and insights platform SqueezeMetrics explained that this is due in part to lower leverage, too.

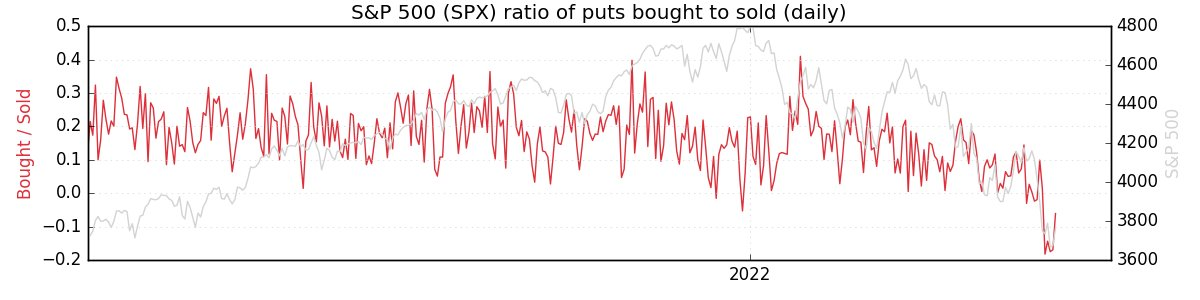
“Leveraged long S&P lost favor (understandable), and marginal demand for puts went with it. Creeping into net selling territory is ‘smart’ bear market positioning. Short delta, short skew.”

Graphic: Via SqueezeMetrics.

Anyways, noteworthy is the sale of short-dated volatility, and this has played into generally poor performance in skew. In light of that, it makes sense to lean toward owning volatility, rather than selling it.

Graphic: Via TradingView. Taken by Physik Invest. The Cboe VVIX Index (INDEX: VVIX), the expected volatility of the 30-day forward price of the VIX, or the volatility of volatility (a naive but useful measure of skew), was very depressed, too, in comparison to the VIX, itself.

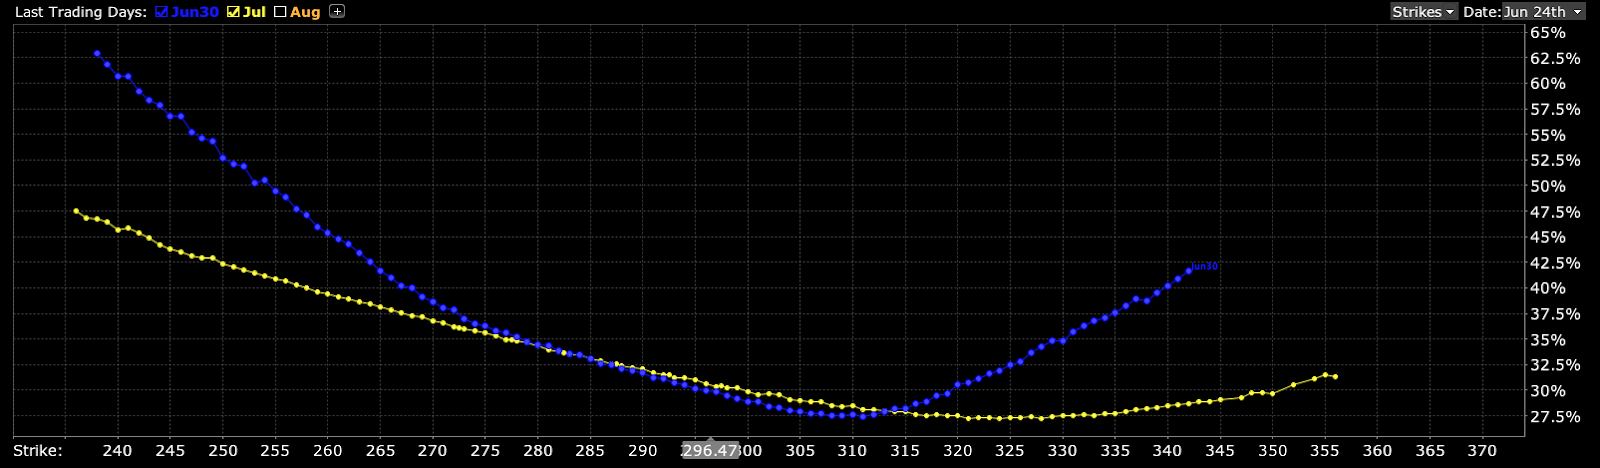
The note to point out, here, is – and this is in accordance with some very recent notes – that a “higher starting point” in IVOL, and a still-present right-tail, makes it so we may position, for less cost, in shorter-dated spread structures with attractive and asymmetric payouts.

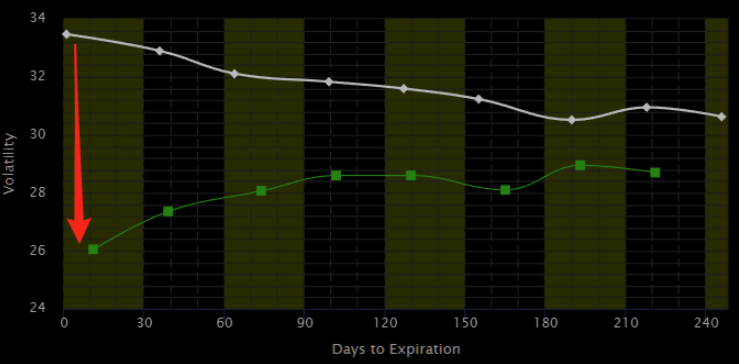
Graphic: Taken by Physik Invest from Interactive Brokers Group Inc (NASDAQ: IBKR). Multi-expiry skew in the Invesco QQQ Trust Series 1 (NASDAQ: QQQ). Notice the v-shape in the shorter maturity and smirk in the longer maturity. Here’s what that means.

Heading into the end of the quarter is the expected rollover of large options positions. These are hedges to customer long-equity exposure, which the liquidity providers are short. A front-running of this repositioning flow is (and is expected), in part, to add to the equity market upside.

Graphic: Via SpotGamma. “SPX prices X-axis. Option delta Y-axis. When the factors of implied volatility and time change, hedging ratios change. For instance, if SPX is at $4,700.00 and IV jumps 15% (all else equal), the dealer may sell an additional 0.2 deltas to hedge their exposure to the addition of a positive 0.2 delta. The graphic is for illustrational purposes, only.”

Per SpotGamma, after expiration, “it is more likely the [bearish] tone [all else equal] remains unchanged at least from a positioning perspective,” albeit many metrics appear a tad stretched.

Graphic: Via JPMorgan Chase & Co (NYSE: JPM). Taken from Callum Thomas’ Weekly S&P 500 ChartStorm.

Technical: As of 6:30 AM ET, Monday’s regular session (9:30 AM – 4:00 PM ET), in the S&P 500, will likely open in the middle part of a positively skewed overnight inventory, outside of prior-range and -value, suggesting a potential for immediate directional opportunity.

In the best case, the S&P 500 trades higher; activity above the $3,943.25 HVNode puts in play the $3,982.75 LVNode. Initiative trade beyond the LVNode could reach as high as the $4,016.25 HVNode and $4,055.25 LVNode, or higher.

In the worst case, the S&P 500 trades lower; activity below the $3,943.25 HVNode puts in play the $3,909.25 MCPOC. Initiative trade beyond the $3,909.25 MCPOC could reach as low as the  $3,889.00 VPOC and $3,821.50 LVNode, or lower.

Click here to load today’s key levels into the web-based TradingView charting platform. Note that all levels are derived using the 65-minute timeframe. New links are produced, daily.
Graphic: 65-minute profile chart of the Micro E-mini S&P 500 Futures.

Gap Scenarios In Play: Gaps ought to fill quickly. Should they not, that’s a signal of strength; do not fade. Leaving value behind on a gap-fill or failing to fill a gap (i.e., remaining outside of the prior session’s range) is a go-with indicator.

Auctioning and spending at least 1-hour of trade back in the prior range suggests a lack of conviction; in such a case, do not follow the direction of the most recent initiative activity.

Definitions

A structurally sound market will build on areas of high volume (HVNodes). Should the market trend for long periods of time, it will lack sound structure, identified as low volume areas (LVNodes). LVNodes denote directional conviction and ought to offer support on any test. 

If participants were to auction and find acceptance into areas of prior low volume (LVNodes), then future discovery ought to be volatile and quick as participants look to HVNodes for favorable entry or exit.

Also, MCPOCs are valuable as they denote areas where two-sided trade was most prevalent over numerous day sessions. Participants will respond to future tests of value as they offer favorable entry and exit.

About

After years of self-education, strategy development, mentorship, and trial-and-error, Renato Leonard Capelj began trading full-time and founded Physik Invest to detail his methods, research, and performance in the markets.

Capelj also develops insights around impactful options market dynamics at SpotGamma and is a Benzinga reporter.

Some of his works include conversations with ARK Invest’s Catherine Wood, investors Kevin O’Leary and John Chambers, FTX’s Sam Bankman-Fried, Kai Volatility’s Cem Karsan, The Ambrus Group’s Kris Sidial, among many others.

Disclaimer

In no way should the materials herein be construed as advice. Derivatives carry a substantial risk of loss. All content is for informational purposes only.

Categories
Commentary

Daily Brief For June 24, 2022

The daily brief is a free glimpse into the prevailing fundamental and technical drivers of U.S. equity market products. Join the 300+ that read this report daily, below!

What Happened

Overnight, equity index futures resolved a multi-day consolidation and auctioned higher, far beyond the prior day’s range. Commodities were mixed while bonds were lower.

The break from consolidation is one of the most bullish happenings in weeks. We’re monitoring whether participants add to their recent short volatility bets against direction, or whether there is repositioning and this bolsters the initiative probe.

Ahead is data on University of Michigan consumer sentiment, inflation expectations, and new home sales (10:00 AM ET), as well as some Fed speak (7:30 AM and 4:00 PM ET).

Graphic updated 6:40 AM ET. Sentiment Risk-On if expected /ES open is above the prior day’s range. /ES levels are derived from the profile graphic at the bottom of the following section. Levels may have changed since initially quoted; click here for the latest levels. SqueezeMetrics Dark Pool Index (DIX) and Gamma (GEX) calculations are based on where the prior day’s reading falls with respect to the MAX and MIN of all occurrences available. A higher DIX is bullish. At the same time, the lower the GEX, the more (expected) volatility. Learn the implications of volatility, direction, and moneyness. SHIFT data used for S&P 500 (INDEX: SPX) options activity. Note that options flow is sorted by the call premium spent; if more positive, then more was spent on call options. Breadth reflects a reading of the prior day’s NYSE Advance/Decline indicator. VIX reflects a current reading of the CBOE Volatility Index (INDEX: VIX) from 0-100.

What To Expect

Fundamental: To start, I want to apologize for any confusion, yesterday, with respect to the /GE Eurodollar quote. This newsletter said the peak of the Fed-rate-hike cycle – terminal rate – sat near December 2023. 

That’s wrong. It’s December 2022.

Graphic: Via Charles Schwab Corporation-owned (NYSE: SCHW) TD Ameritrade’s Thinkorswim. The Eurodollar (FUTURE: /GE) futures curve is a reflection of participants’ outlook on interest rates. The peak of the Fed-rate-hike cycle – terminal rate – is around DEC 20[22].

Okay, moving on, now!

New data is pointing to a “remarkable” drop in demand for goods and services during June, compared to months prior. 

“US economic growth has slowed sharply in June, with deteriorating forward-looking indicators setting the scene for an economic contraction in the third quarter,” S&P Global (NYSE: SPGI) Market Intelligence’s Chris Williamson explained.

“The survey data are consistent with the economy expanding at an annualized rate of less than 1% in June, with the goods-producing sector already in decline and the vast service sector slowing sharply.”

Graphic: Via S&P Global Inc. “This is a sizeable miss and evidence of a quick slowdown in demand, though it’s still in positive territory (above 50). This report is consistent with a shifting narrative away from inflation worries and towards growth worries.”

Businesses (particularly in retail) are way “more concerned about the outlook” of costs and demand, as well as the path in monetary policies and deterioration in financial conditions. 

Graphic: Via Bloomberg. “Supply constraints, exacerbated by Russia’s war in Ukraine this year, account for about half of the surge in US inflation, with demand currently making up a third of the increase, according to new research from the Federal Reserve Bank of San Francisco.”

That’s validated by Tesla Inc’s (NASDAQ: TSLA) CEO Elon Musk speaking about the carmaker’s losses from new plants, supply chain problems, and the like. 

Graphic: Via Bloomberg. “Long-term ocean freight rates between China and the US West Coast are higher than spot prices for the first time since April 2020.”

“The past two years have been an absolute nightmare of supply chain interruptions, one thing after another,” Musk said.

“We’re not out of it yet. That’s overwhelmingly our concern is how do we keep the factories operating so we can pay people and not go bankrupt.”

Graphic: Via Bloomberg. “Supply chains in Asia look to be on the mend,” though it will “ take a while for supply and demand to rebalance.”

It’s a global move into recession all at once, as Jeffrey Snider of Alhambra Investments says

Read: Daily Brief for May 18, 2022

“​​Combine the potential for break in repo collateral with economy heading toward recession, no wonder the Euro[dollar] curve inversion is spreading as rapidly as it has. Possibility of something big going wrong, therefore ending rate hikes, is huge now.”

“Euro[dollar] squeeze, collateral shortage, deflationary potential in money, and now demand destruction in global real economy.”

Graphic: Via Alhambra Investments.

Over the last four decades, monetary policy was a go-to for supporting the economy. Money was sent to capital and that promoted innovation and, by that token, deflation, ultimately creating “unimportance to cash flows,” as well put by Kai Volatility’s Cem Karsan. 

Now, there’s a strong commitment to reducing liquidity and credit, all the while there are chokepoints monetary policymakers have little control over. 

This has consequences on the real economy and asset prices, accordingly, which rose and kept deflationary pressures at bay. A stock market drop is both a recession and a direct reflection of the unwind of carry. It is the manifestation of a deflationary shock, and today’s poor sentiments and economic data reflects this.

At the same time, “bonds are not acting as a hedge and appear to be becoming less ‘money’ like due persistent declines in price and elevated rate vol,” as Joseph Wang puts it. 

Bank deposits are to drain about $1 trillion or so by year-end, prompting investors to “continue to lower their selling prices to compete for the cash they want.”

Retail buyers, who, according to Michael Wang of Prometheus Alternative Investments, “were a significant driver of the inflated valuations we saw in tech and crypto,” are capitulating in stocks, all the while froth in housing markets is soon to abate, likewise.

Notwithstanding, Mark Zandi of Moody’s Corporation (NYSE: MCO) does not see “the kind of mortgage defaults and distressed sales that would be necessary for big declines in housing values,” just as prices of raw materials are retreating as inventories are bloating.

As put forth, partially, earlier this week, one has to wonder about the likelihood that inflation is near its high and whether the de-rates have played their course.

Let’s keep an open mind and follow up on this, in detail, next week.

Graphic: Via Bloomberg. “The hot commodities rally is cooling off fast as recession fears again ground and cloud the outlook for demand.”

Positioning: Keeping this section short. 

As stated yesterday, a feature of the equity sell-off is the suppression of implied volatility (IVOL) versus that which the market realizes (RVOL) given that participants are hedged and volatility remains in strong supply. 

Read: Daily Brief for June 23, 2022.

Graphic: Via Goldman Sachs Group Inc (NYSE: GS).

Options data and insights platform SqueezeMetrics explained that this is due in part to lower leverage, too.

“Leveraged long S&P lost favor (understandable), and marginal demand for puts went with it. Creeping into net selling territory is ‘smart’ bear market positioning. Short delta, short skew.”

Graphic: Via SqueezeMetrics.

As I said in SpotGamma’s note, last night, given “the high starting point in IVOL, as well as its place in relation to [RVOL], it makes sense to own structures that benefit either from sharp changes in underlying price or an abrupt repricing in volatility.”

Cutting into the realization of a sharp change in underlying price or a far-reaching rally, however, are short-volatility bets across shorter maturity periods (and the associated hedging), as well as big (and popularized) positions set to roll off at the quarter-end.

Liquidity providers, per SpotGamma, all else equal, will have to sell to re-hedge, and we will talk about this further, next week.

Graphic: Taken 6/22/2022. SpotGamma’s Hedging Impact of Real-Time Options (HIRO) indicator points to selling of put and call options in the S&P 500 (INDEX: SPX) and S&P 500 ETF (SPY). Those liquidity providers, who are on the other side, are more exposed to long volatility, which they hedge by buying (selling) into weakness (strength) underlying.

Technical: As of 6:40 AM ET, Friday’s regular session (9:30 AM – 4:00 PM ET), in the S&P 500, will likely open in the upper part of a positively skewed overnight inventory, outside of prior-range and -value, suggesting a potential for immediate directional opportunity.

In the best case, the S&P 500 trades higher; activity above the $3,821.50 LVNode puts in play the $3,843.00 RTH High. Initiative trade beyond the RTH High could reach as high as the $3,911.00 VPOC and $3,943.25 HVNode, or higher.
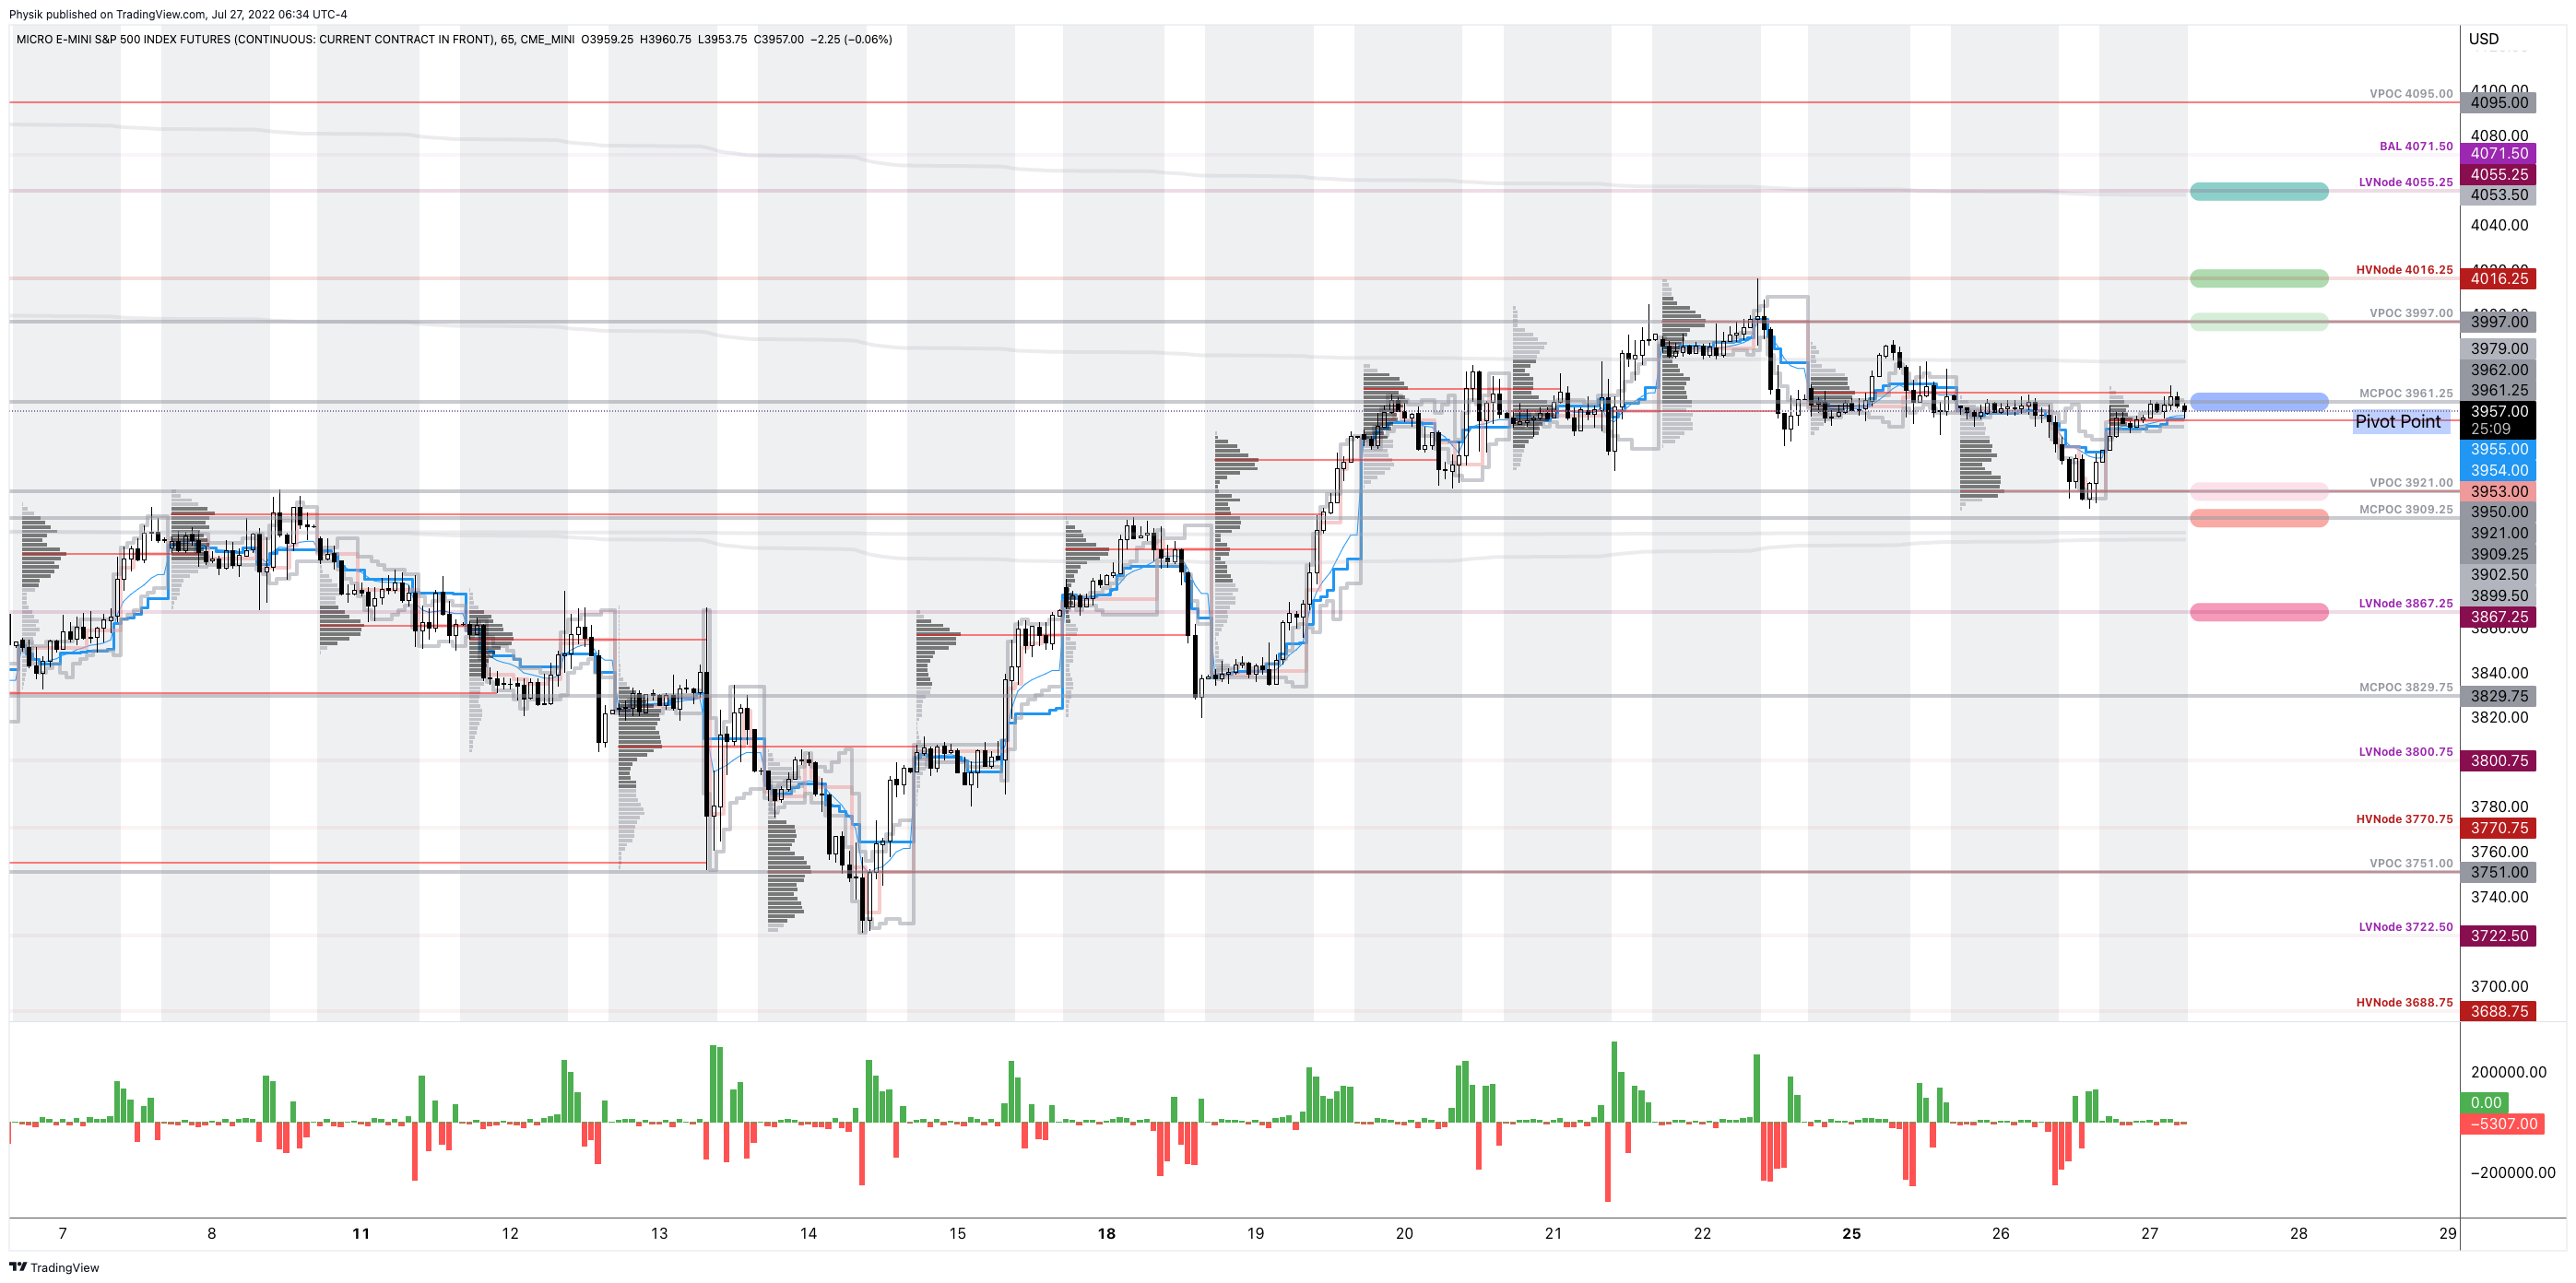
In the worst case, the S&P 500 trades lower; activity below the $3,821.50 LVNode puts in play the $3,793.25 ledge. Initiative trade beyond the ledge could reach as low as the $3,770.75 HVNode and $3,735.75 HVNode, or lower.

Click here to load today’s key levels into the web-based TradingView charting platform. Note that all levels are derived using the 65-minute timeframe. New links are produced, daily.
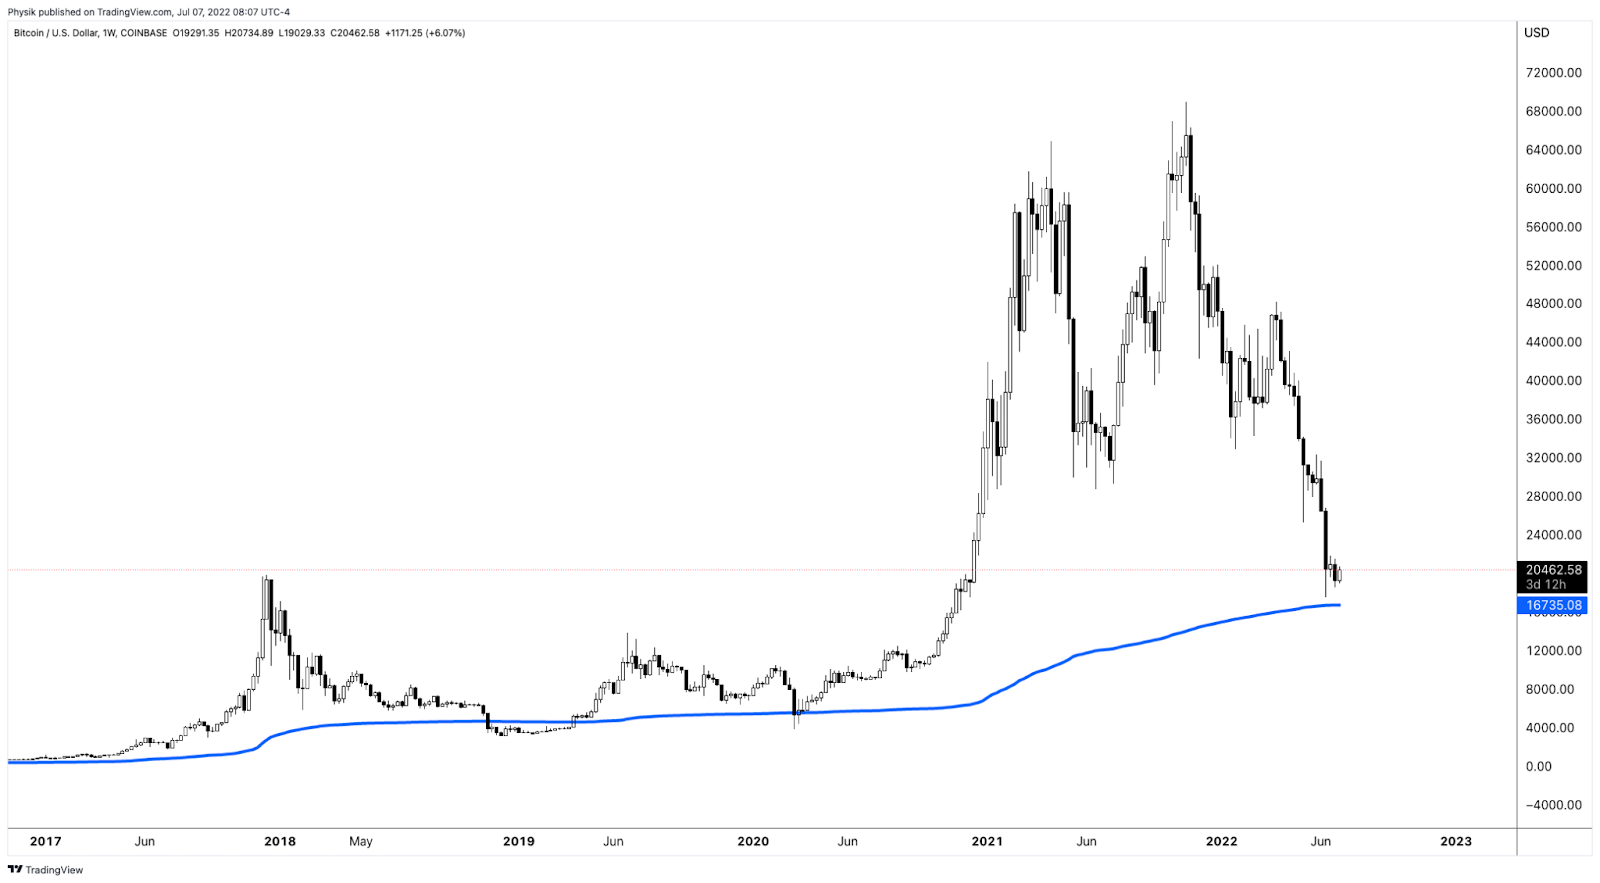
Graphic: 65-minute profile chart of the Micro E-mini S&P 500 Futures.

Considerations: Recent trade has been lackluster and the overnight break is the most bullish happening in weeks. The go-to trade this week was short volatility. Participants responded to tests of key visual areas, and sold options, particularly in shorter maturities.
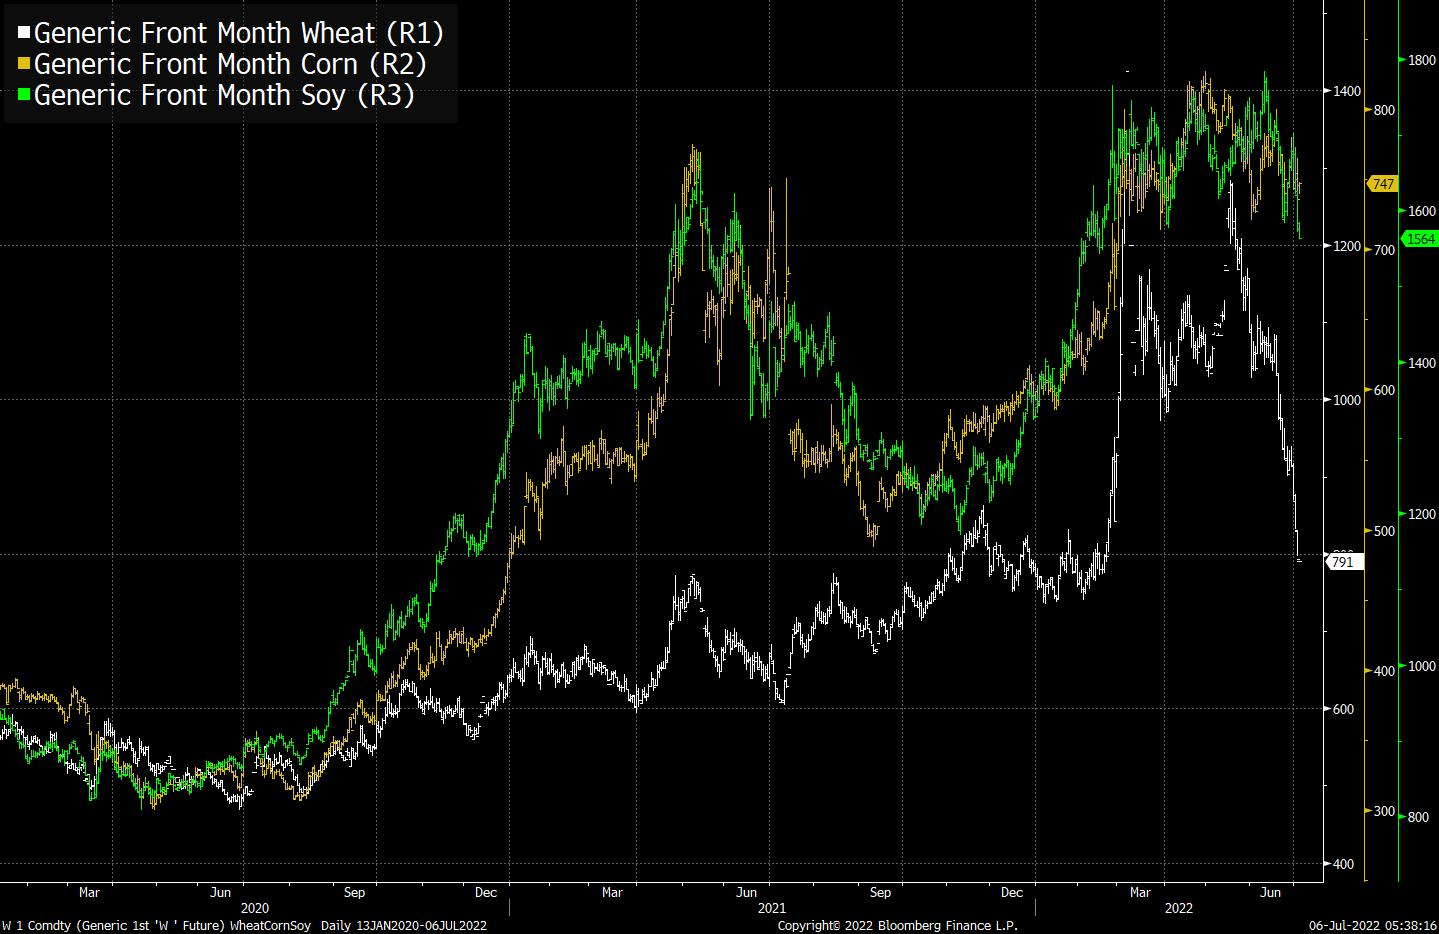
In the coming session(s), some of those participants will respond to the break in a manner that bolsters the initiative drive. Notwithstanding, the key to watch for is whether participants will use the bump as an opportunity to add to their most recent short volatility bets against the direction. 

Ultimately, the more time that is spent outside of the prior consolidation area, the likelihood that the breakout is a signal to look for dips to buy and play rotations to key areas up above.

Definitions

Volume Areas: A structurally sound market will build on areas of high volume (HVNodes). Should the market trend for long periods of time, it will lack sound structure, identified as low volume areas (LVNodes). LVNodes denote directional conviction and ought to offer support on any test. 

If participants were to auction and find acceptance into areas of prior low volume (LVNodes), then future discovery ought to be volatile and quick as participants look to HVNodes for favorable entry or exit.

POCs: POCs are valuable as they denote areas where two-sided trade was most prevalent in a prior day session. Participants will respond to future tests of value as they offer favorable entry and exit.

Balance-Break + Gap Scenarios: A change in the market (i.e., the transition from two-time frame trade, or balance, to one-time frame trade, or trend) is occurring.

Monitor for acceptance (i.e., more than 1-hour of trade) outside of the balance area. 

Leaving value behind on a gap-fill or failing to fill a gap (i.e., remaining outside of the prior session’s range) is a go-with indicator. 

Rejection (i.e., return inside of balance) portends a move to the opposite end of the balance.

About

After years of self-education, strategy development, mentorship, and trial-and-error, Renato Leonard Capelj began trading full-time and founded Physik Invest to detail his methods, research, and performance in the markets.

Capelj also develops insights around impactful options market dynamics at SpotGamma and is a Benzinga reporter.

Some of his works include conversations with ARK Invest’s Catherine Wood, investors Kevin O’Leary and John Chambers, FTX’s Sam Bankman-Fried, Kai Volatility’s Cem Karsan, The Ambrus Group’s Kris Sidial, among many others.

Disclaimer

In no way should the materials herein be construed as advice. Derivatives carry a substantial risk of loss. All content is for informational purposes only.