
The Daily Brief is a free glimpse into the prevailing fundamental and technical drivers of U.S. equity market products. Join the 200+ that read this report daily, below!
What Happened
Overnight, equity index futures auctioned sideways to lower while most commodities and the ten-year yield were higher.
The bullishness of the past days, driven in part by breakthroughs in Russia and Ukraine peace talks is threatened by new updates. Now, the Kremlin said that its talks with Ukraine yielded no breakthroughs. Geopolitical matters and supply chain issues are major headwinds for markets.
Ahead is data on ADP employment (8:15 AM ET), GDP revision, gross domestic income, and corporate profits (8:30 AM ET), as well as Fed-speak. Tom Barkin speaks at 9:15 AM ET and Esther George speaks at 1:00 PM ET.
What To Expect
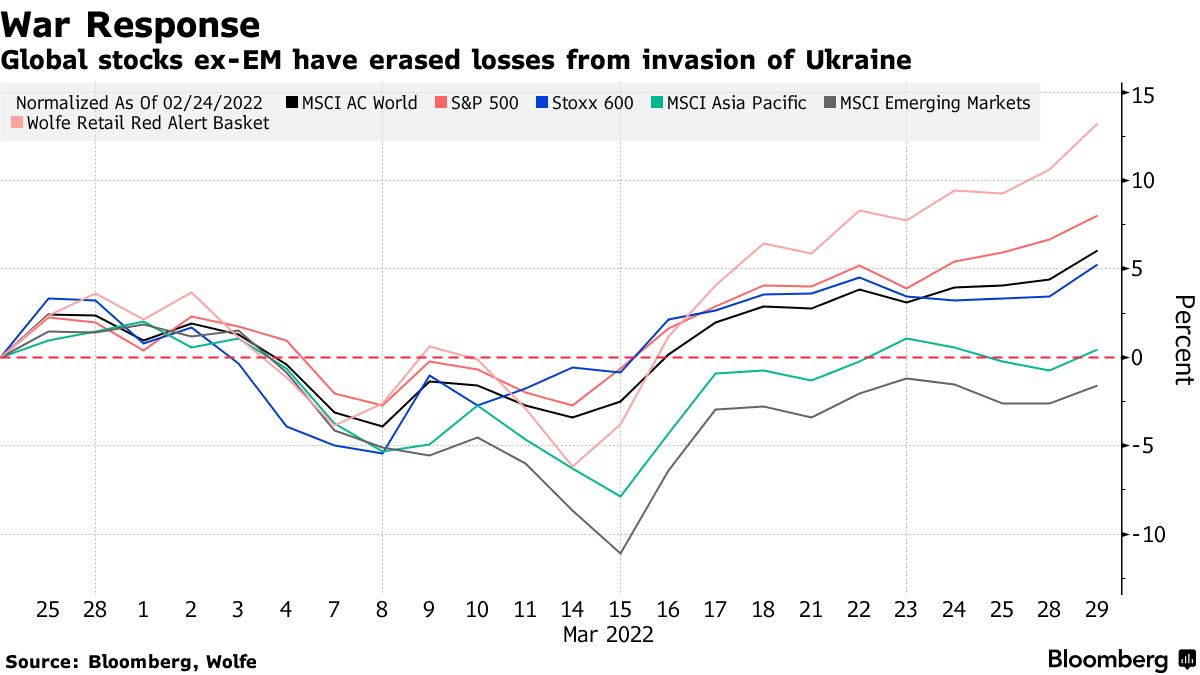
Positioning: Buying the March 14 S&P 500 low would have yielded you nearly a 12% gain. Buying and holding the Nasdaq 100 low would have yielded you about 17%.
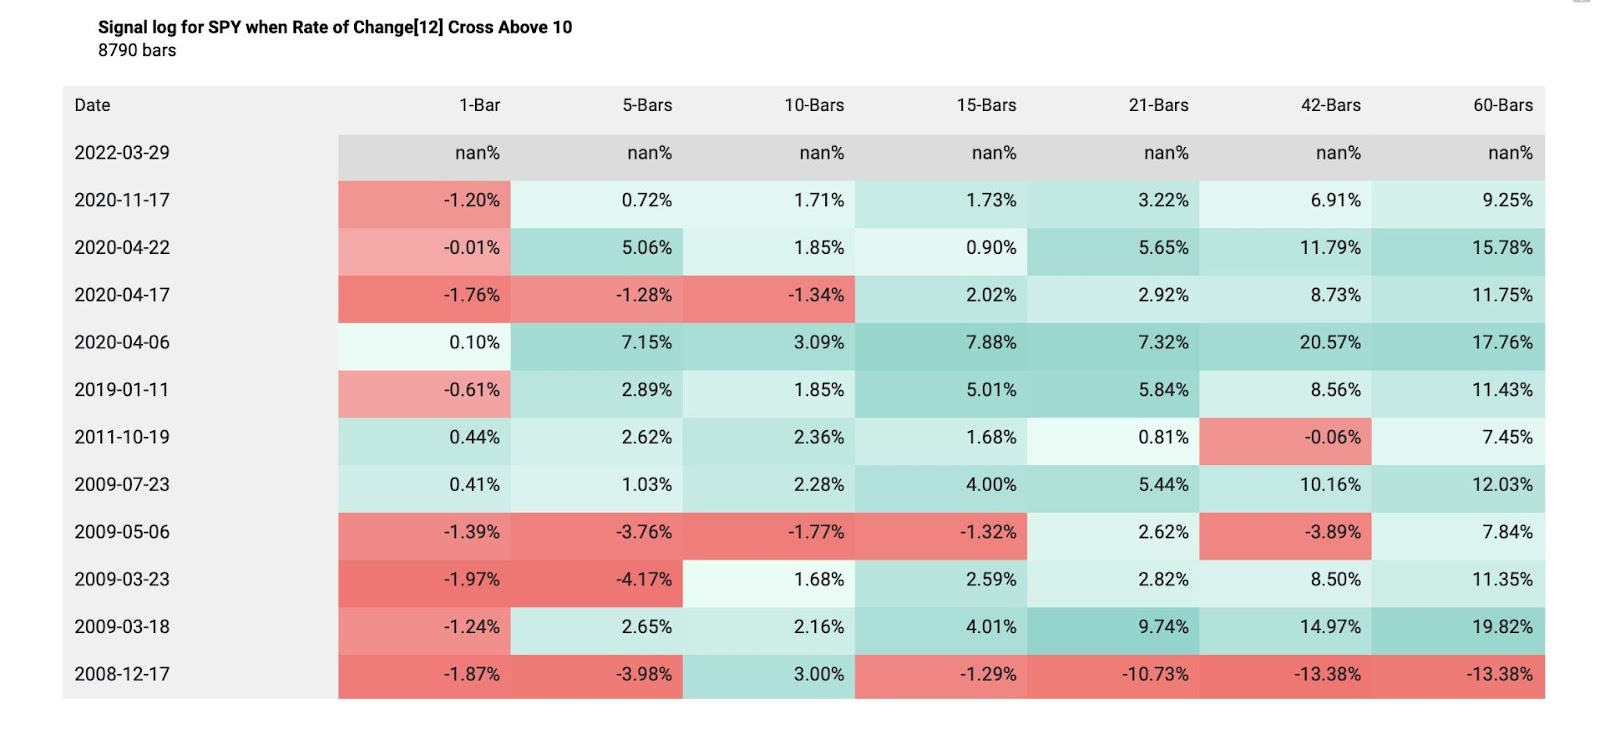
The forward returns when the 10-day S&P 500 return crosses above 10% are mixed.
From 2000 to 2009, forward returns are weak. From 2009 and beyond, returns are strong.
These powerful moves are due in part to the “reflexive dynamic coming from structural flows,” explains The Ambrus Group’s Kris Sidial who sees a lot of opportunity in the “front of the term structure.”
Sidial and I have spoken a couple of times regarding the implications of increased derivatives exposures and the transmission of those risks associated to underlyings.
Mainly, counterparties, as a result of regulatory frameworks, among other things, lend to cascading reactions that exacerbate underlying price movements.
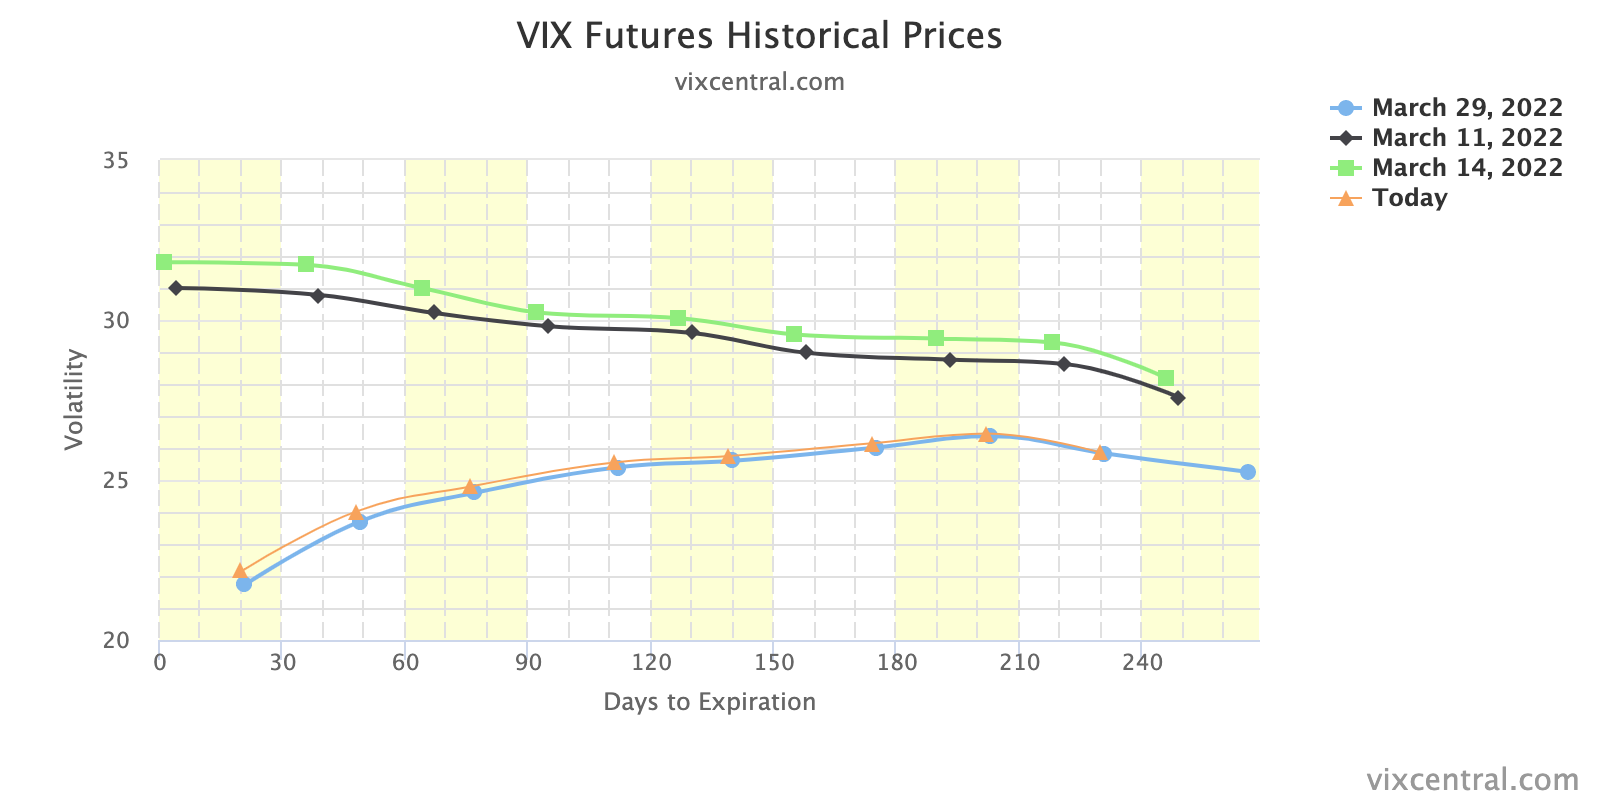
Further, this recovery is in the context of geopolitical tension and monetary uncertainties that have lent to volatility spikes across other asset classes. Though fear tends to spread across markets, it is not, today, as discussed in past commentaries.
Basically, the equity market’s pricing of risk, which we use the CBOE Volatility Index (INDEX: VIX) as a proxy for, is not moving in lockstep with that of measures in FX and rate markets.
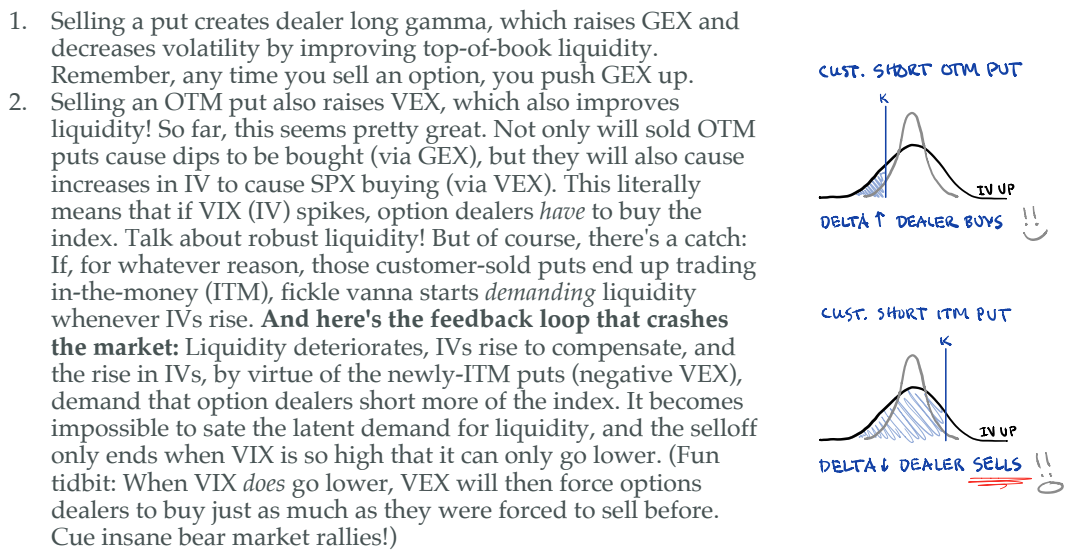
Notwithstanding, as SqueezeMetrics explains, there are no “hardcore vol[atility] sellers in the SPX right now,” and this may actually be a good thing.
As SqueezeMetrics explains in their Implied Order Book paper, “Selling options is a tough business, since you’re on the wrong end of a derivative with a convex payoff.”
“In terms of gamma [an option deltas sensitivity to direction] and vanna [delta hedging flow with respect to changing levels of implied volatility], crash risk is a function of how many investors have sold puts [which] … are, quite literally, a bunch of huge buy limit orders below the market, and then a bunch of liquidity-taking stop-losses further down.”
Heading into the early-to-mid March reversal period, this newsletter revealed the forecasted returns distribution of a comparison of proxies for buying (DIX) and gamma exposure (GEX).
At the time, the returns distribution was skewed positive given a deeply negative GEX and strong DIX.
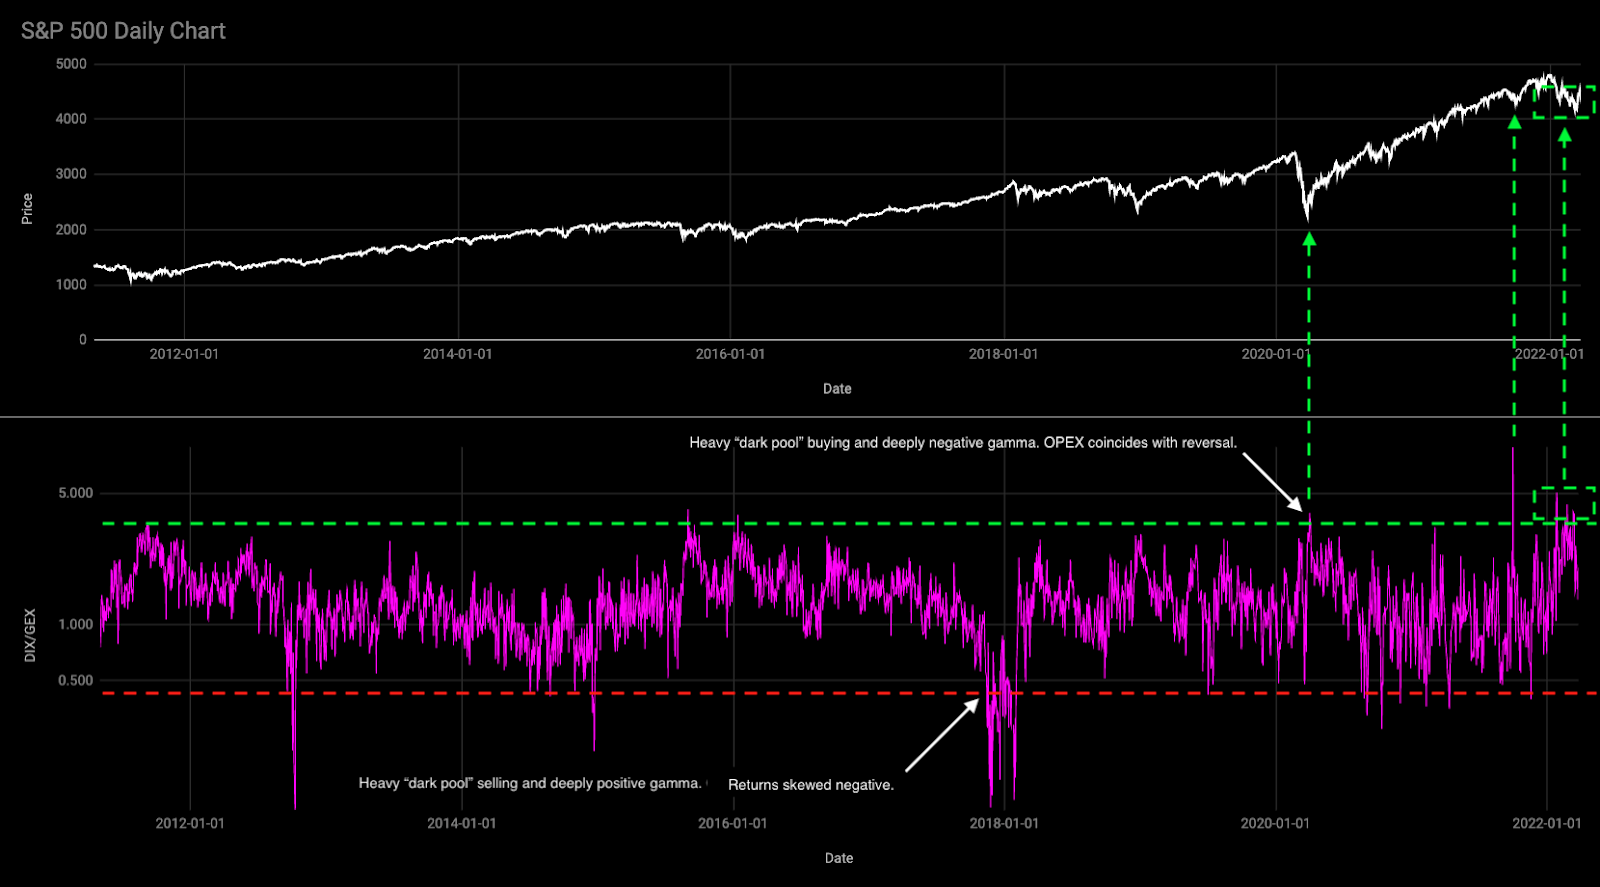
The bullishness of those metrics was taken with a bit of a discount, given the aforementioned cross-asset divergences, as a result of geopolitical conflict, among other things.
In hindsight, the right call would have been to buy hand over fist.
A bout of speculative demand (expressed through short-dated options highly sensitive to direction), as well as the compression of ultra short-dated volatility heading into and through the Federal Open Market Committee (FOMC) meeting and large March monthly options expiration (OPEX) bolstered strong buying support and lent to the market’s resolve higher.
The price rise, now, has likely reached a climax. The S&P 500, in particular, is at an overbought level: the concentrations of call open interest at and around $4,600.00.
As SpotGamma explained well, recently, “customers are short calls up top (to finance put options, or bets on the downside, down below). As underlying SPX prices rise, the call (put) side solicits more (less) hedging.”
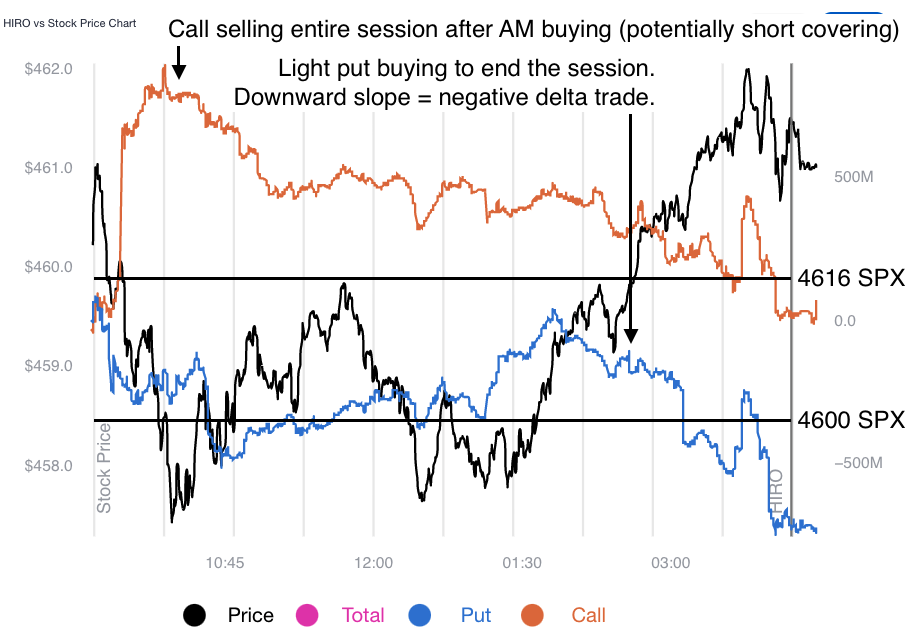
“Since counterparties’ call positions provide positive exposure to direction (positive delta) and profits are amplified to the upside (positive gamma), counterparties must sell into higher prices and buy into lower prices, thereby adding liquidity and supporting the market.”
Participants’ selling of volatility at these higher levels suggests increased odds of sideways, rather than up or down; as time and volatility trend to zero for these options, their gamma increases, and the reaction to this will result in the promotion of pinning.
Thereafter, the clearing of this options exposure likely opens the door to underlying breadth which has improved markedly since early March.
Though today’s market is unprecedented, so to speak, improvements in breadth support a historical case for sideways-to-higher through tightening cycles.
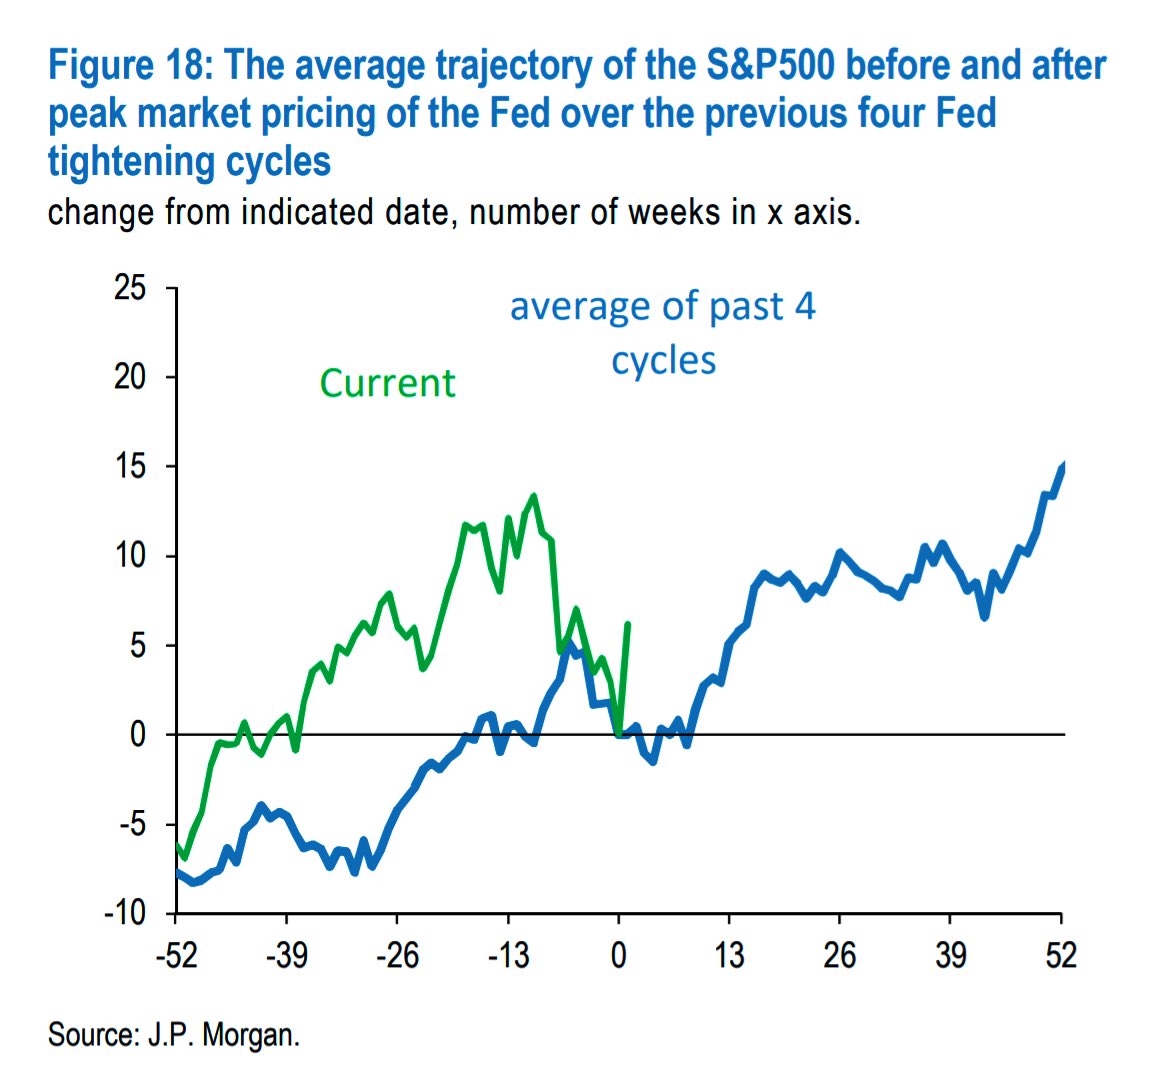
In opposition to this narrative (i.e., higher prices through the tightening cycle) are some Bank of America Corporation (NYSE: BAC) strategists.
“The worsening macro backdrop and market-unfriendly Fed make sustained U.S. equity gains unlikely,” Bank of America strategists said in a statement that recommended investors sell upside (call) protection to hedge downside.
If Bank of America is correct, it’s possible that, given the recent clearing of puts, participants’ demand for protection, and the hedging of this exposure, would add velocity to the move lower.
SqueezeMetrics’ remark on hardcore volatility selling, however, has us a little less concerned (about some sort of armageddon situation).
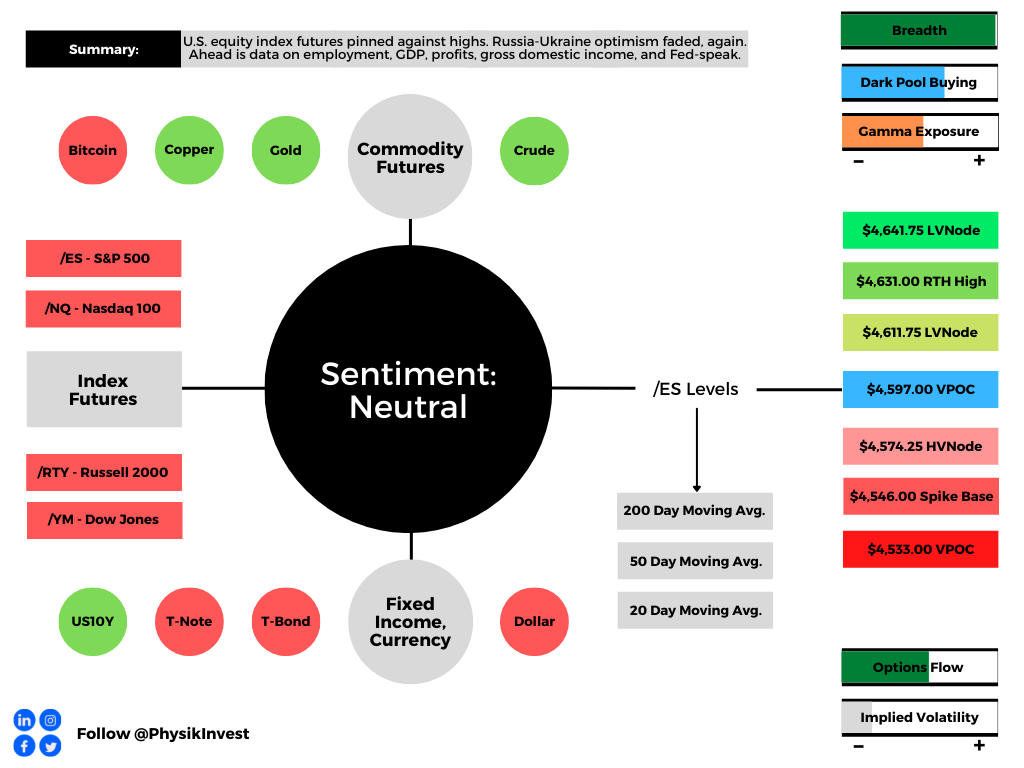
Technical: As of 6:30 AM ET, Wednesday’s regular session (9:30 AM – 4:00 PM ET), in the S&P 500, will likely open in the lower part of a negatively skewed overnight inventory, inside of prior-range and -value, suggesting a limited potential for immediate directional opportunity.
In the best case, the S&P 500 trades higher; activity above the $4,597.00 untested point of control (VPOC) puts in play the $4,611.75 low volume area (LVNode). Initiative trade beyond the LVNode could reach as high as the $4,631.00 regular trade high (RTH High) and $4,641.75 LVNode, or higher.
In the worst case, the S&P 500 trades lower; activity below the $4,597.00 VPOC puts in play the $4,574.25 HVNode. Initiative trade beyond the HVNode could reach as low as the $4,546.00 Spike Base and $4,533.00 VPOC, or lower.
Click here to load today’s key levels into the web-based TradingView charting platform. Note that all levels are derived using the 65-minute timeframe. New links are produced, daily.

Definitions
Volume Areas: A structurally sound market will build on areas of high volume (HVNodes). Should the market trend for long periods of time, it will lack sound structure, identified as low volume areas (LVNodes). LVNodes denote directional conviction and ought to offer support on any test.
If participants were to auction and find acceptance into areas of prior low volume (LVNodes), then future discovery ought to be volatile and quick as participants look to HVNodes for favorable entry or exit.
DIX: For every buyer is a seller (usually a market maker). Using DIX — which is derived from short sales (i.e., liquidity provision on the market-making side) — we can measure buying pressure.
Gamma: Gamma is the sensitivity of an option to changes in the underlying price. Dealers that take the other side of options trades hedge their exposure to risk by buying and selling the underlying. When dealers are short-gamma, they hedge by buying into strength and selling into weakness. When dealers are long-gamma, they hedge by selling into strength and buying into weakness. The former exacerbates volatility. The latter calms volatility.
Vanna: The rate at which the delta of an option changes with respect to volatility.
POCs: POCs are valuable as they denote areas where two-sided trade was most prevalent in a prior day session. Participants will respond to future tests of value as they offer favorable entry and exit.
Options Expiration (OPEX): Traditionally, option expiries mark a reduction in dealer gamma exposure.
About
After years of self-education, strategy development, mentorship, and trial-and-error, Renato Leonard Capelj began trading full-time and founded Physik Invest to detail his methods, research, and performance in the markets.
Capelj also develops insights around impactful options market dynamics at SpotGamma and is a Benzinga reporter.
Some of his works include conversations with ARK Invest’s Catherine Wood, investors Kevin O’Leary and John Chambers, FTX’s Sam Bankman-Fried, Kai Volatility’s Cem Karsan, The Ambrus Group’s Kris Sidial, among many others.
Disclaimer
In no way should the materials herein be construed as advice. Derivatives carry a substantial risk of loss. All content is for informational purposes only.


One reply on “Daily Brief For March 30, 2022”
[…] variance. This, which did more to assuage our fear of crash risk, as well explained in the Daily Brief for March 30, 2022, was, in part, the result of COVID-era volatility that forced participants, out on the risk curve, […]