Physik Invest’s Daily Brief is read by thousands of subscribers. You, too, can join this community to learn about the fundamental and technical drivers of markets.
Positioning
Friends, please read the entire post.
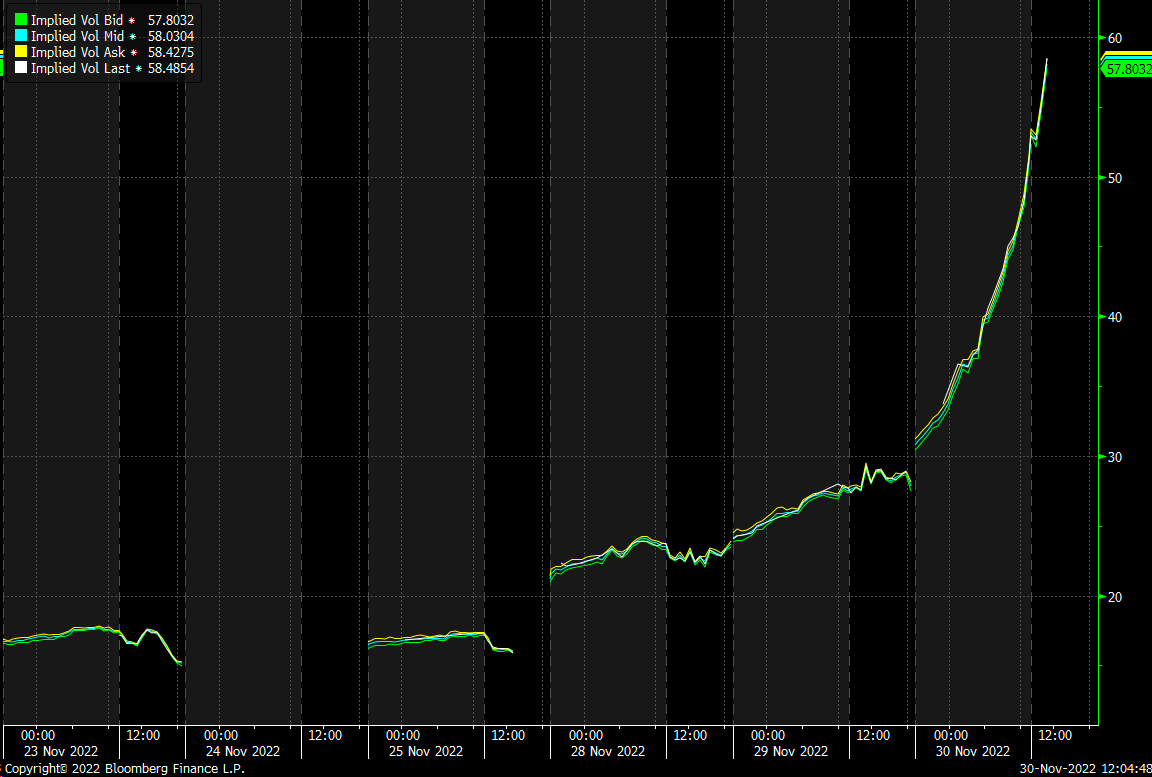
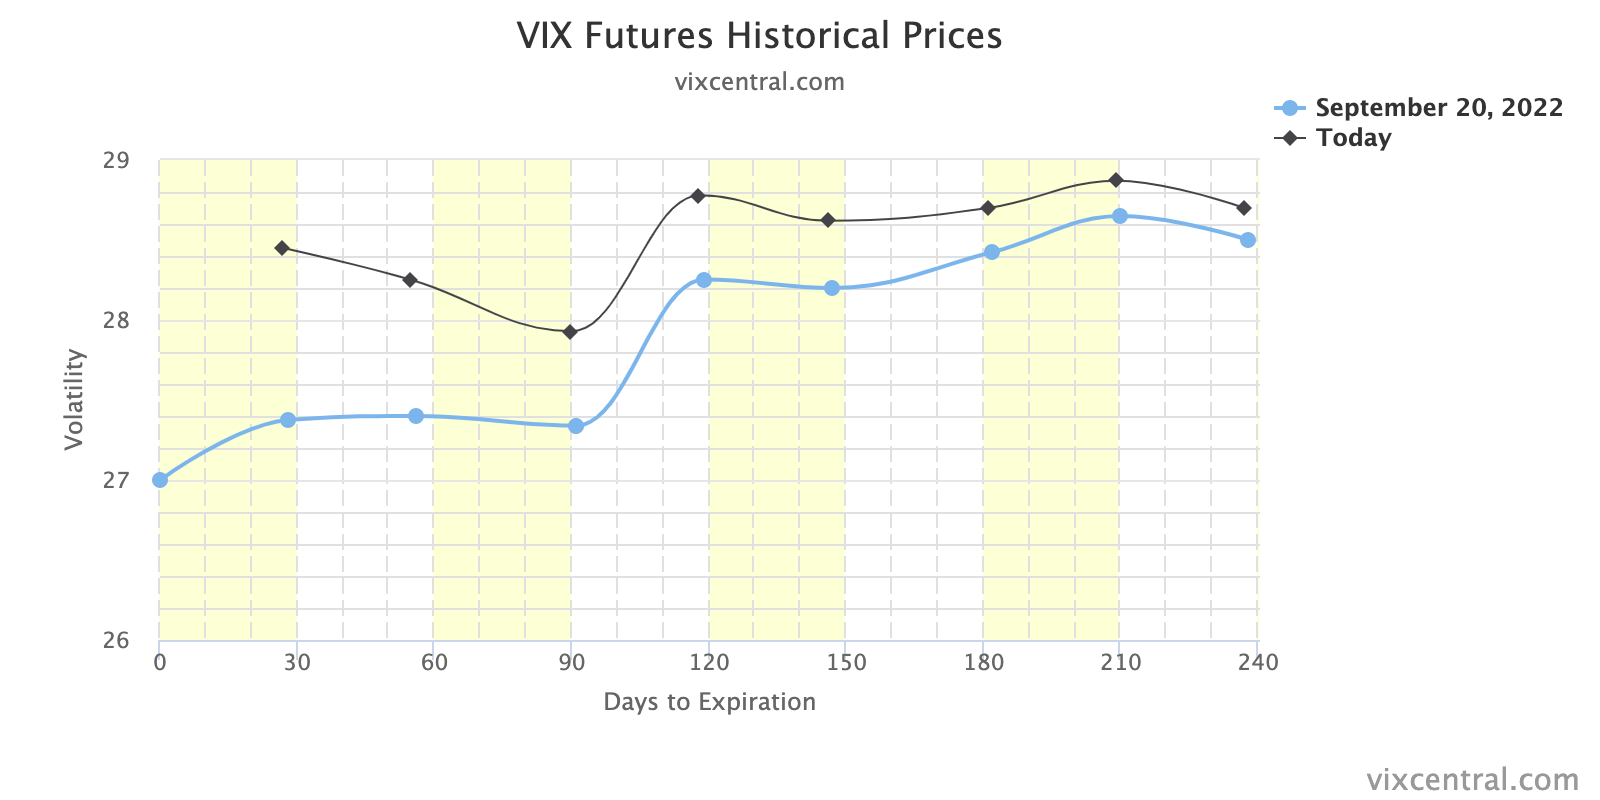
In the Daily Brief for December 21, 2022, this letter dissected some of the positioning contexts responsible for fixed-strike and top-line implied volatility (IVOL) measures’ downward trajectory with the S&P 500. Since this detailed letter was published, IVOL has increased, albeit not by a massive amount so to speak. The moves lower, coupled with the volatility skew not blowing out, have enabled your letter writer to monetize structures entered into while on travel for a nice return. Let’s talk about it, further.
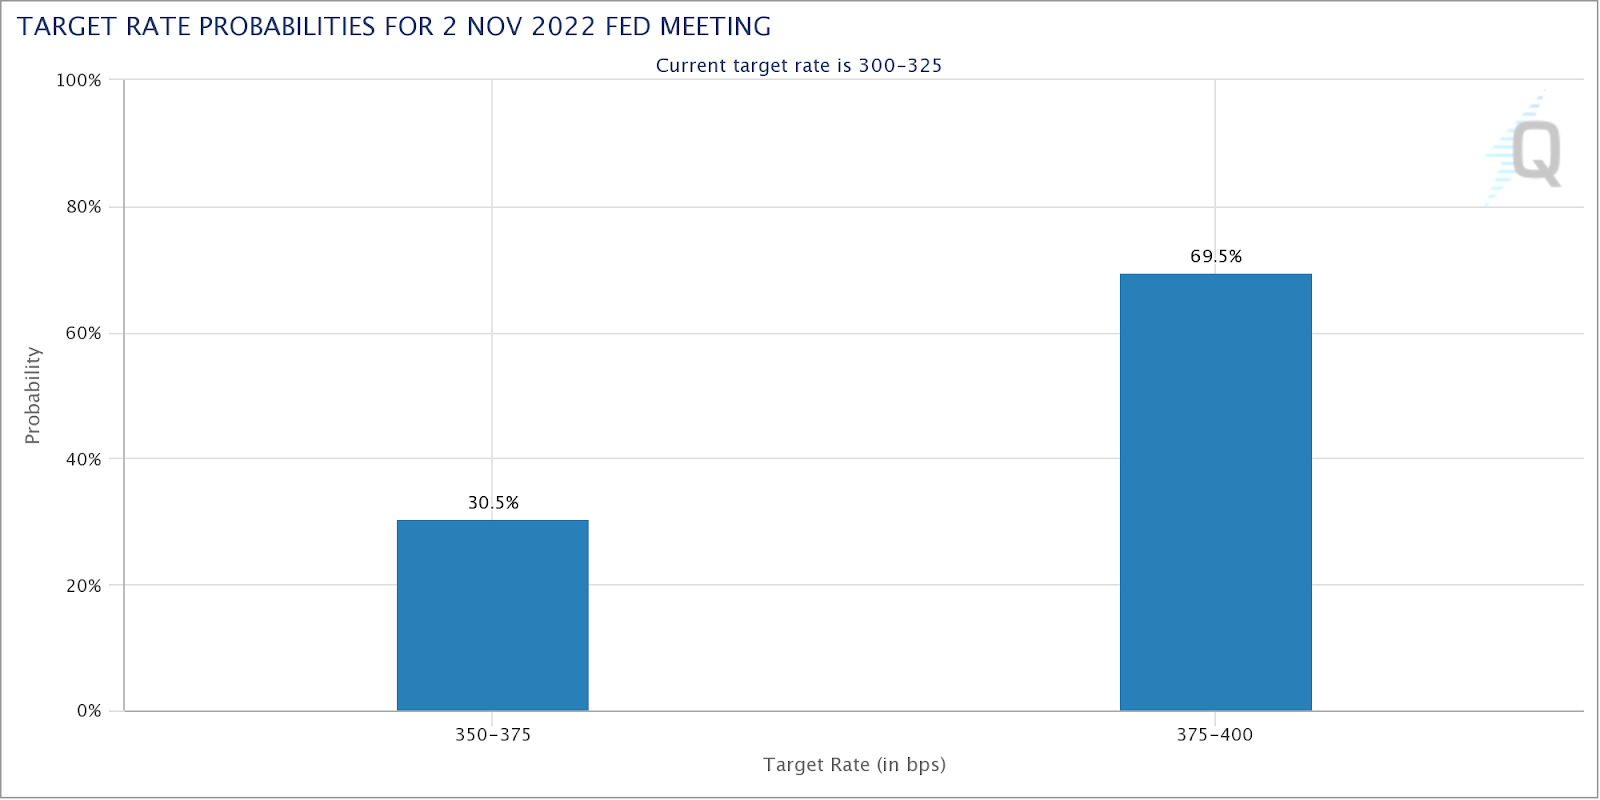
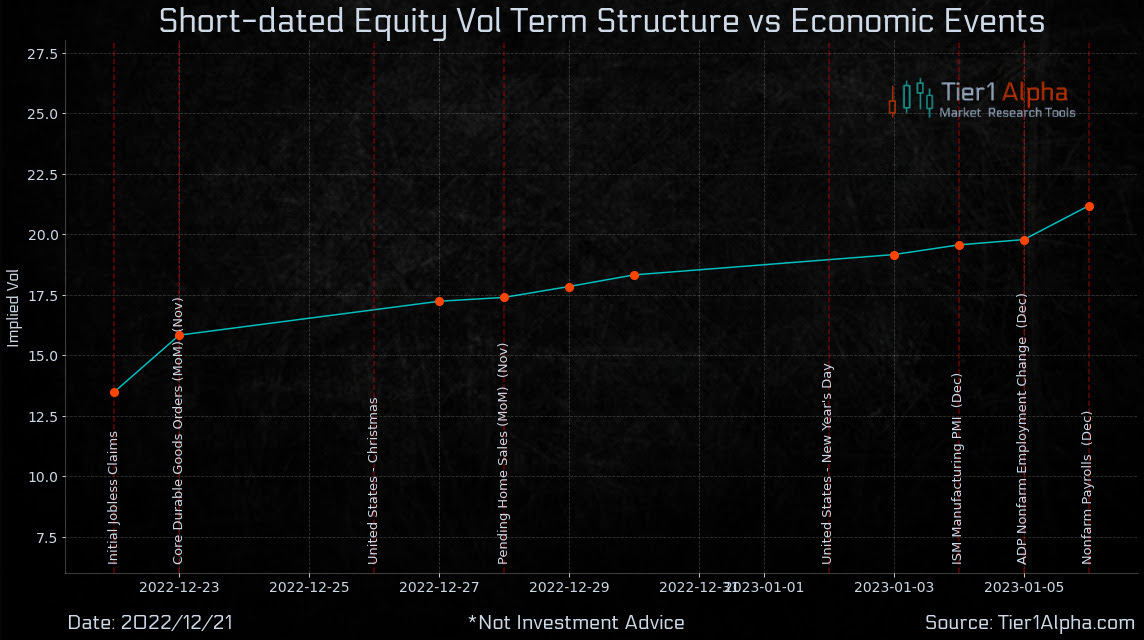
Heading into consumer price (i.e., inflation) updates, as well as updates from the Federal Reserve on their commitment to stemming inflation, traders sought to protect against (or bet on) movement thereby bidding measures of IVOL.
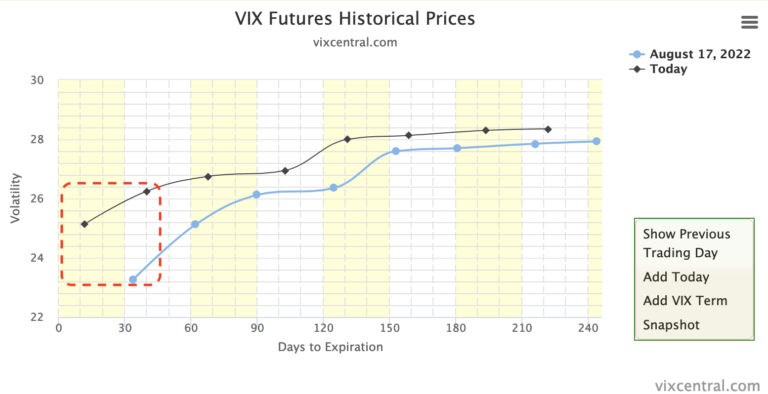
To quote The Ambrus Group’s Kris Sidial, the “entire term structure was jacked going into CPI and FOMC.” Additionally, “granted nothing out of left field,” Sidial added, it would be tough “for December and January vol[atility] to remain bid.”

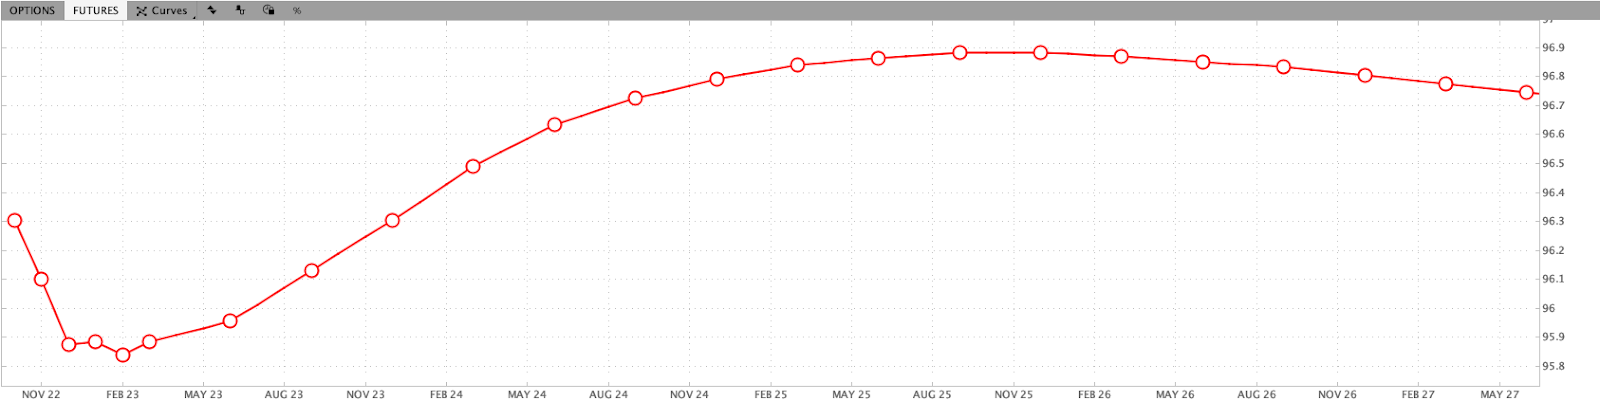
Accordingly, after the CPI and FOMC, market concerns ebbed and traders’ supply of the options they demanded, particularly at the front-end of the curve, pushed the term structure back to an upward-sloping so-called contango.
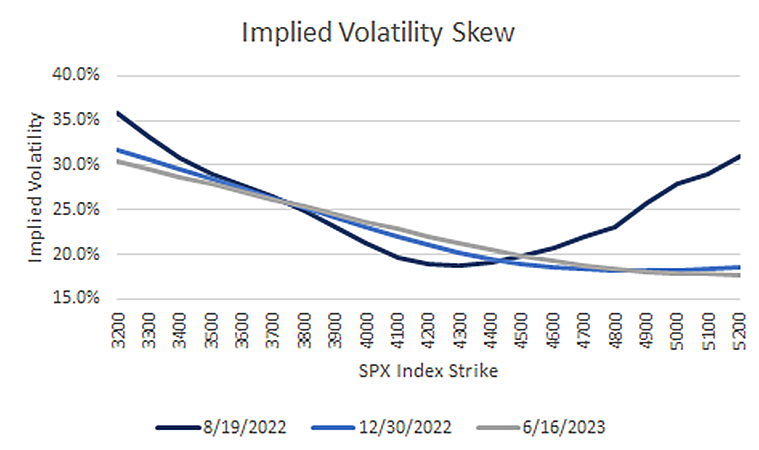
As was detailed in the December 21 letter, this dynamic following the release of CPI and FOMC would do a lot to keep IVOL and equity movement contained. Knowing this, your letter writer’s trading partner alerted him while on a trip of skew presenting some nice, zero-cost trades that would expand should the market trade lower and IVOL remain contained (i.e., volatility skew not blowing out).
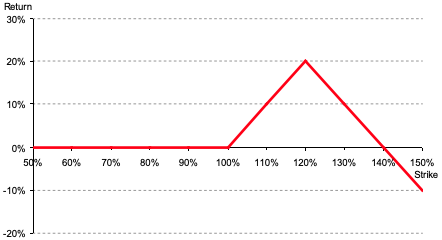
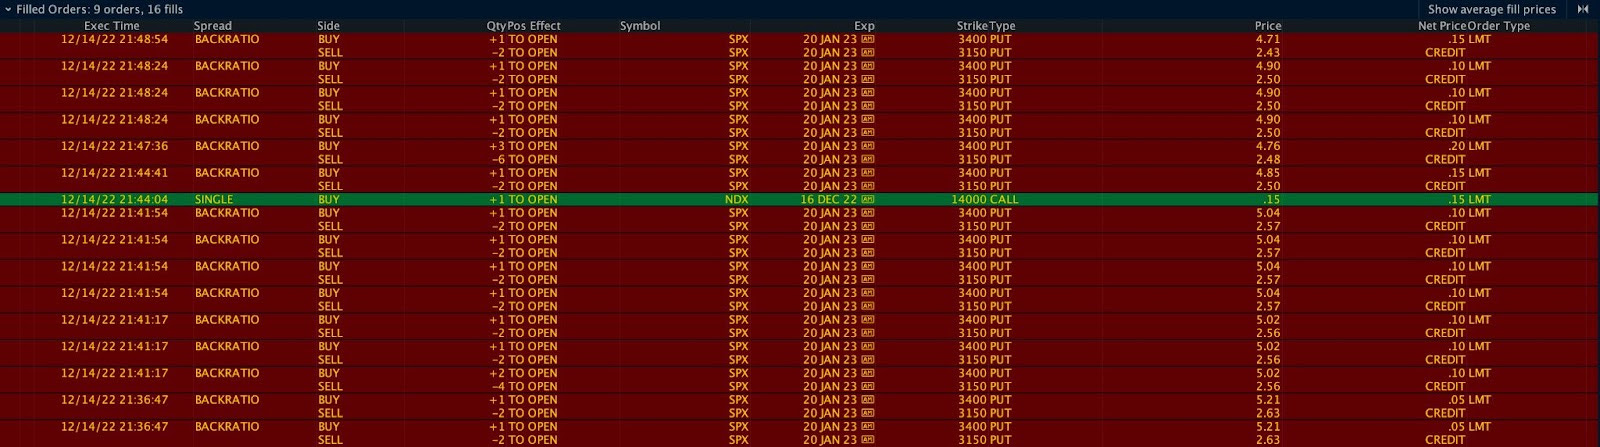
Upon analysis, entered was a simple +1 x -2 Put Ratio Spread (Trade Ticket: SOLD -1 1/2 BACKRATIO SPX 100 20 JAN 23 [AM] 3400/3150 PUT @.10) for a ~$10.00 credit before fees and commissions, a favorite of your letter writer’s.
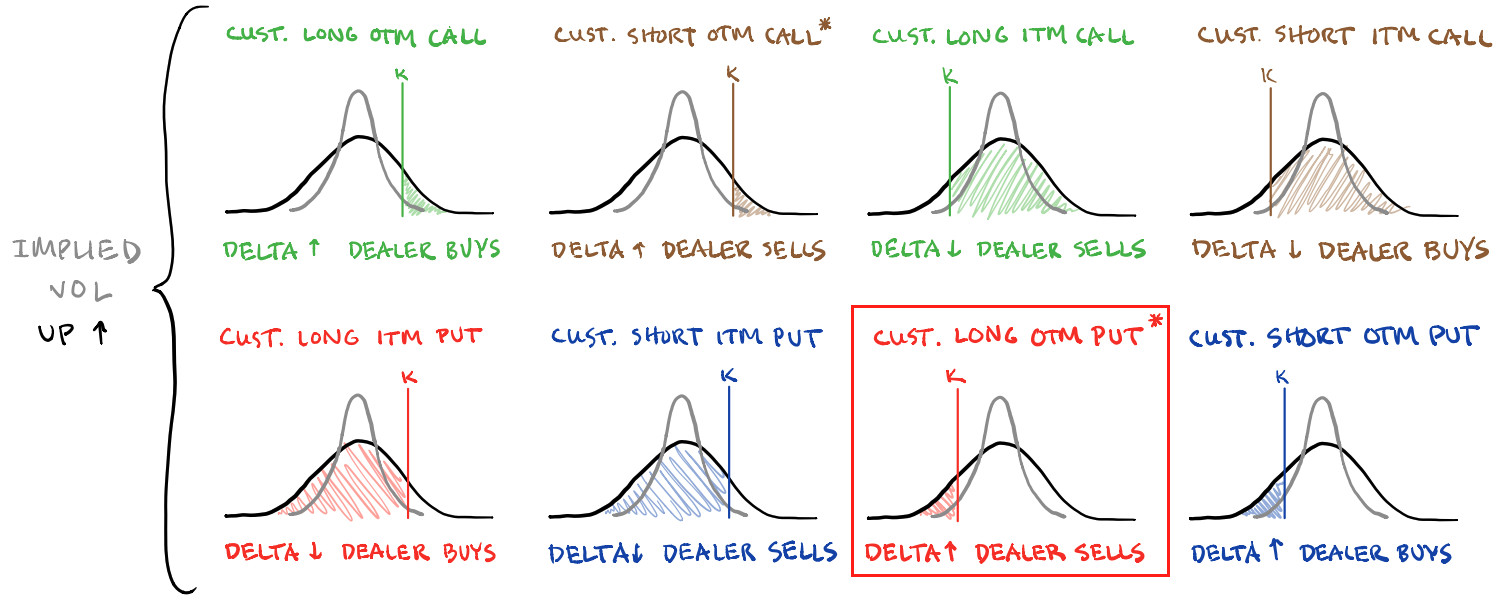
The trades provided exposure to -Delta (direction) and +Gamma (movement).

As an aside, from the start the Vega (sensitivity to changes in IVOL) was negative but, this has a lot to do with how far out the spread is on the chain and, should there be movement as you’re about to see, enabling the put leg you own to start kicking in, so to speak, Vega ends up turning positive very quickly, all else equal.
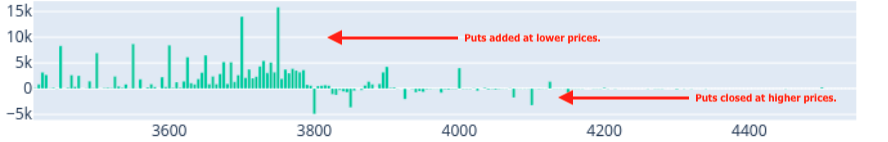
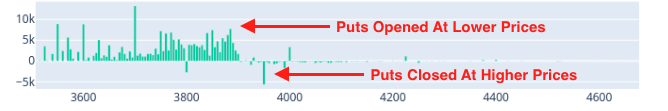
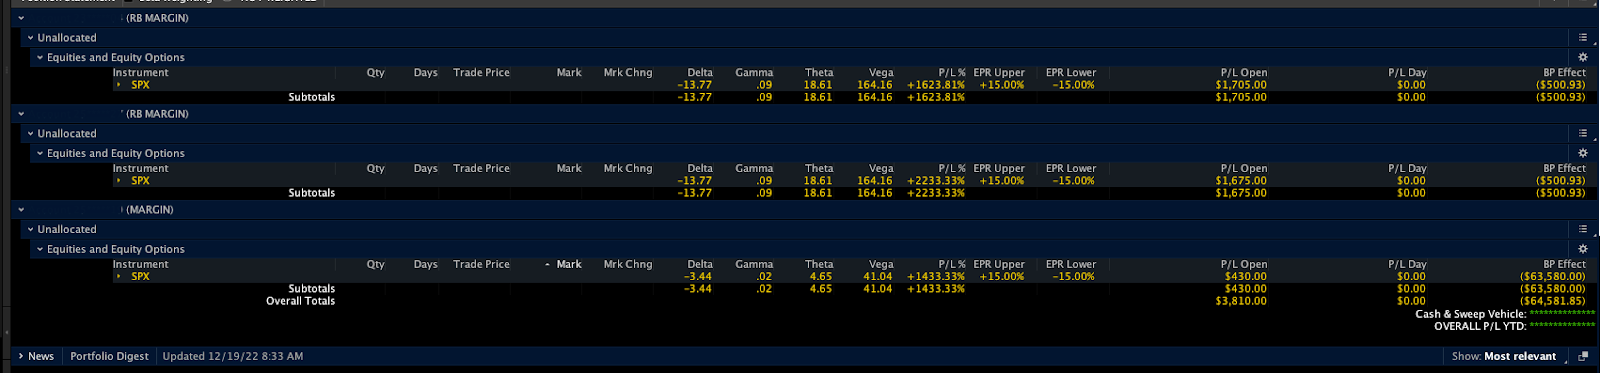
The below graphic, taken on December 19, prior to much of the spread being monetized, shows a large -Delta, +Gamma, and +Vega (i.e., if the market moves lower or IVOL rises, the spread is to rise in value), much like it did when the market traded down into the beginning of this week and IVOL rose into the end of this week.
For one account, 50% of the initial trade was closed for $205-220.00 in credit per spread. After this closure, the remaining structure, in this one account, was turned into a +2 x -5 Ratio. Why? In short, the market was strengthening and the odds of a large move lower were, in short, low. To have downside exposure but be paid for the initial effort, the conversion from a +4 x -8 to a +2 x -5 resulted in an additional $8.10 credit, leaving your letter writer with a -Delta, +Gamma, and +Vega, still.

In the days after, the market turned and traded lower, far more than expected. Notwithstanding, the remaining structures (both +1 x -2 and +2 x -5) performed well, though the 2×5’s Vegas briefly turned negative on the sharp selling yesterday, which, if it had remained like that, would have solicited action (i.e., repositioning, closure, or hedging via correlated instrument).

At the end of the day, what’s important to your letter writer, here, is how the spread prices if the market moves to it today, all else (e.g., time, IVOL, etc) remains equal. If the spread prices at a better price to close at the money, that’s a quick check that says: “Hey, your bet on the market moving lower actually makes money if the market moves lower, all else equal.”
To explain further, look at the working orders above. At current S&P 500 levels, the +1 x -2 prices for $215.00 credit to close. The Delta is negative, as desired, and both the Gamma and Vega are positive. If the spread was at the money, it prices for nearly a $4,500.00 credit to close as shown below.

So, what now? Well, the exposure is really light and much of the structure was monetized. From here, if the market moves lower that would likely be good for the remaining structures. Any costs to enter have been covered and, at this point, the trade is a free bet on the downside.
Obviously, there are pieces not included in this trade dissection, today, including how to properly manage your greek risk, as well as size the position at entry. These are the secret sauces, so to speak, that will either make or break you in the long run.
Should you want more write-ups like this, comment below. Your letter writer attempts to make these updates as informative and engaging as possible. It’s tough, at times, given the dullness of the material. Separately, trading is not as hard as it’s all made out to be. Sure, you need to have a good read on markets (e.g., skew), but, as your letter writer has learned over the many years he’s been engaging with markets, the theory is nothing like practice. No formula will help you price and enter the correct trade structure in a fast-moving meme stock with IVOL blowing out.
If all could be automated, there would be no market. Markets are the product of human emotion. Avoid acting on theory, blindly. Price different structures, like the ones this letter has detailed, and observe how the different parts of the trade interact with each other as the market moves, IVOL moves, time passes, interest rates change, and so on.
For instance, you could have owned puts early in the week and still lost money as the market moved lower. If you would have leveraged a short leg against your long leg, then you could have offset the decay, as your letter writer did above.
There’s no substitute for time in the seat (e.g., you could have observed the -Vega at the entry on the trade structure above and not entered, missing out on the trade’s expansion. Time in the seat taught your letter writer better).
Don’t construe this letter’s simplicity as naivety, also. In the end, what’s your exposure to movement? If your bet is on movement, will you make money if the market moves? If not, find another trade structure or sit out.
Anyways, happy holidays to you and your closest. It’s been quite the year and I have a lot to be thankful for and reflect on. See you next week, most likely (though your letter writer’s burn-out may result in new publications being delayed until the new year).
Technical
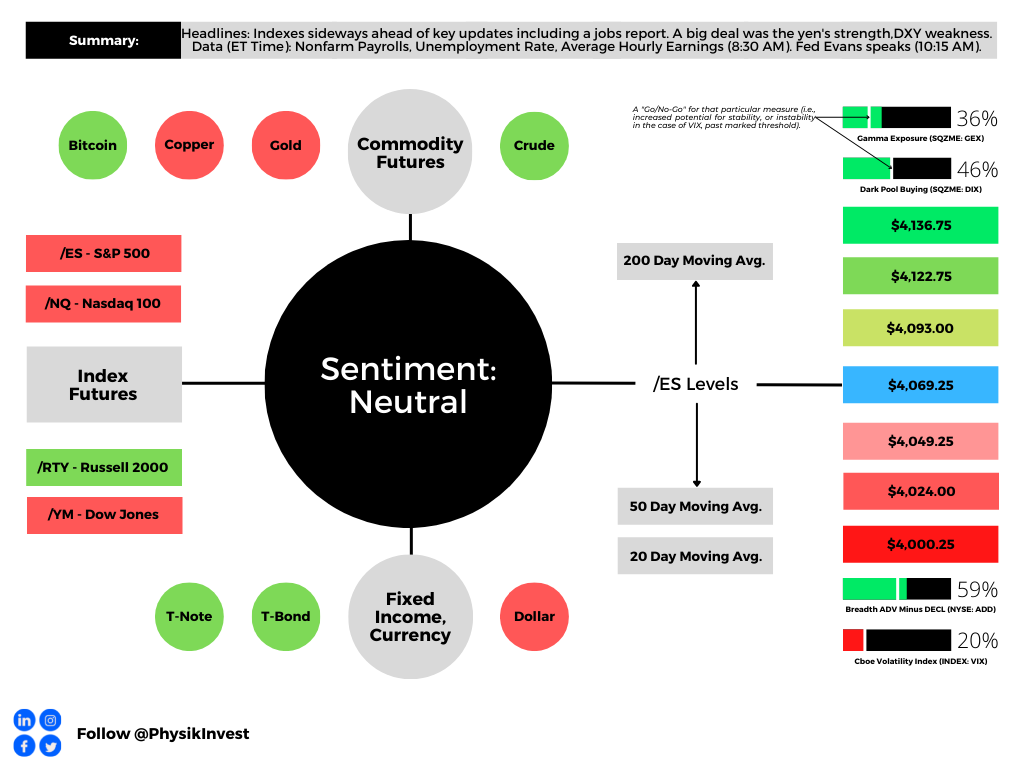
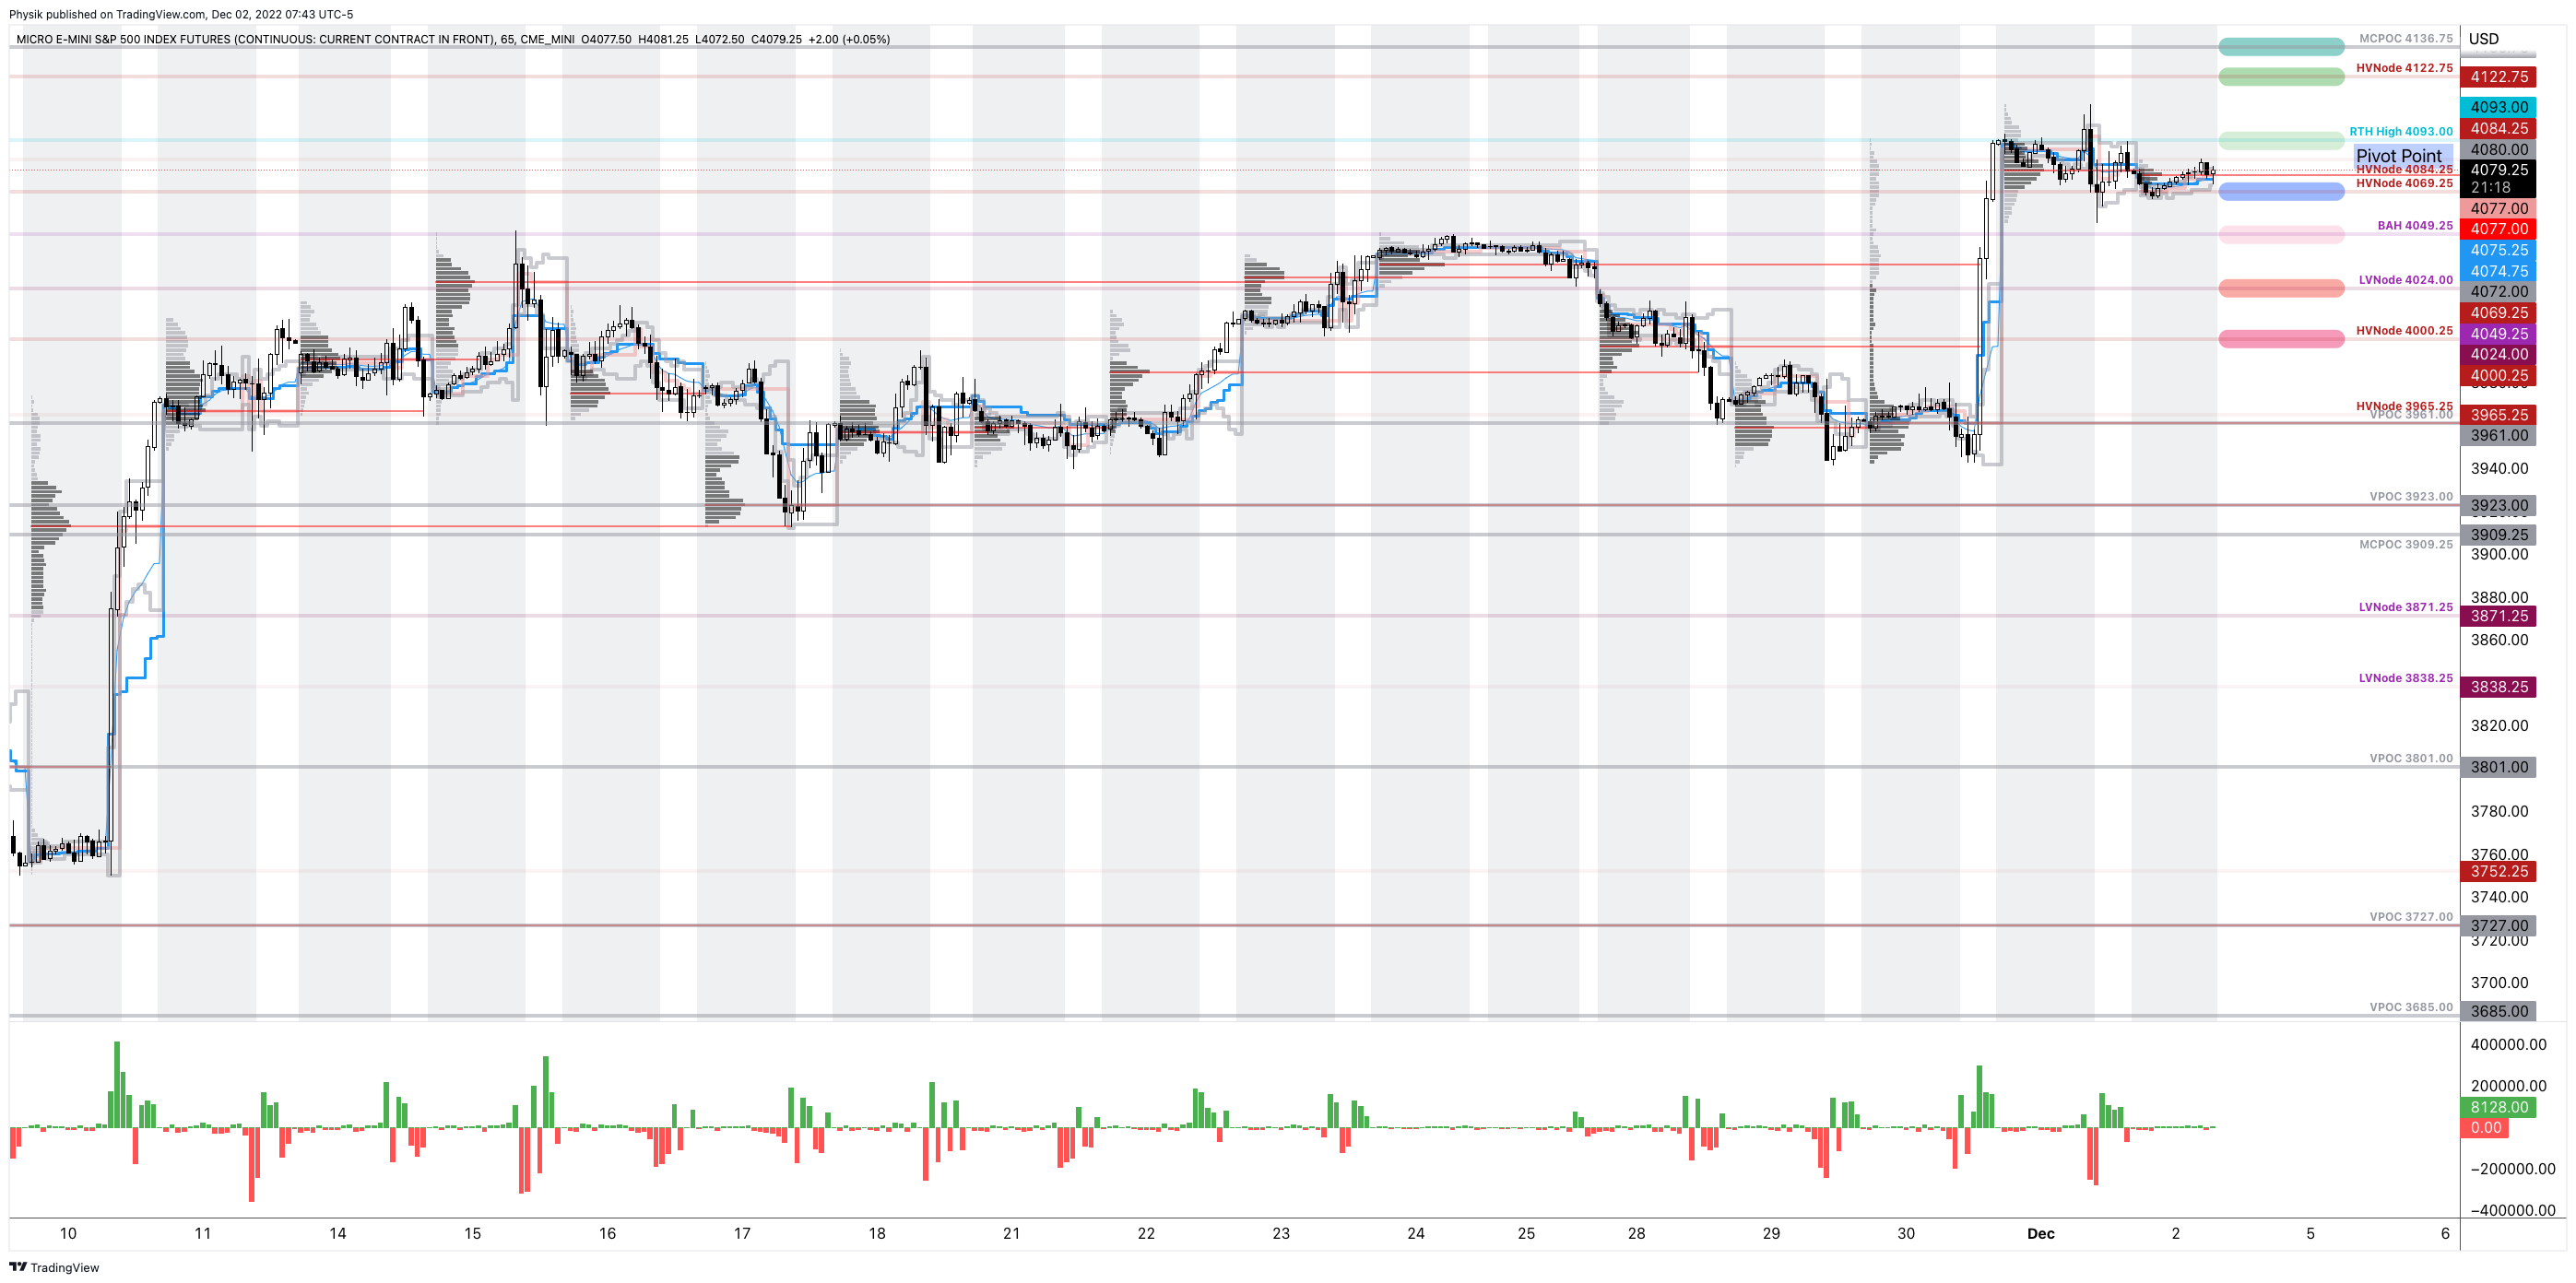
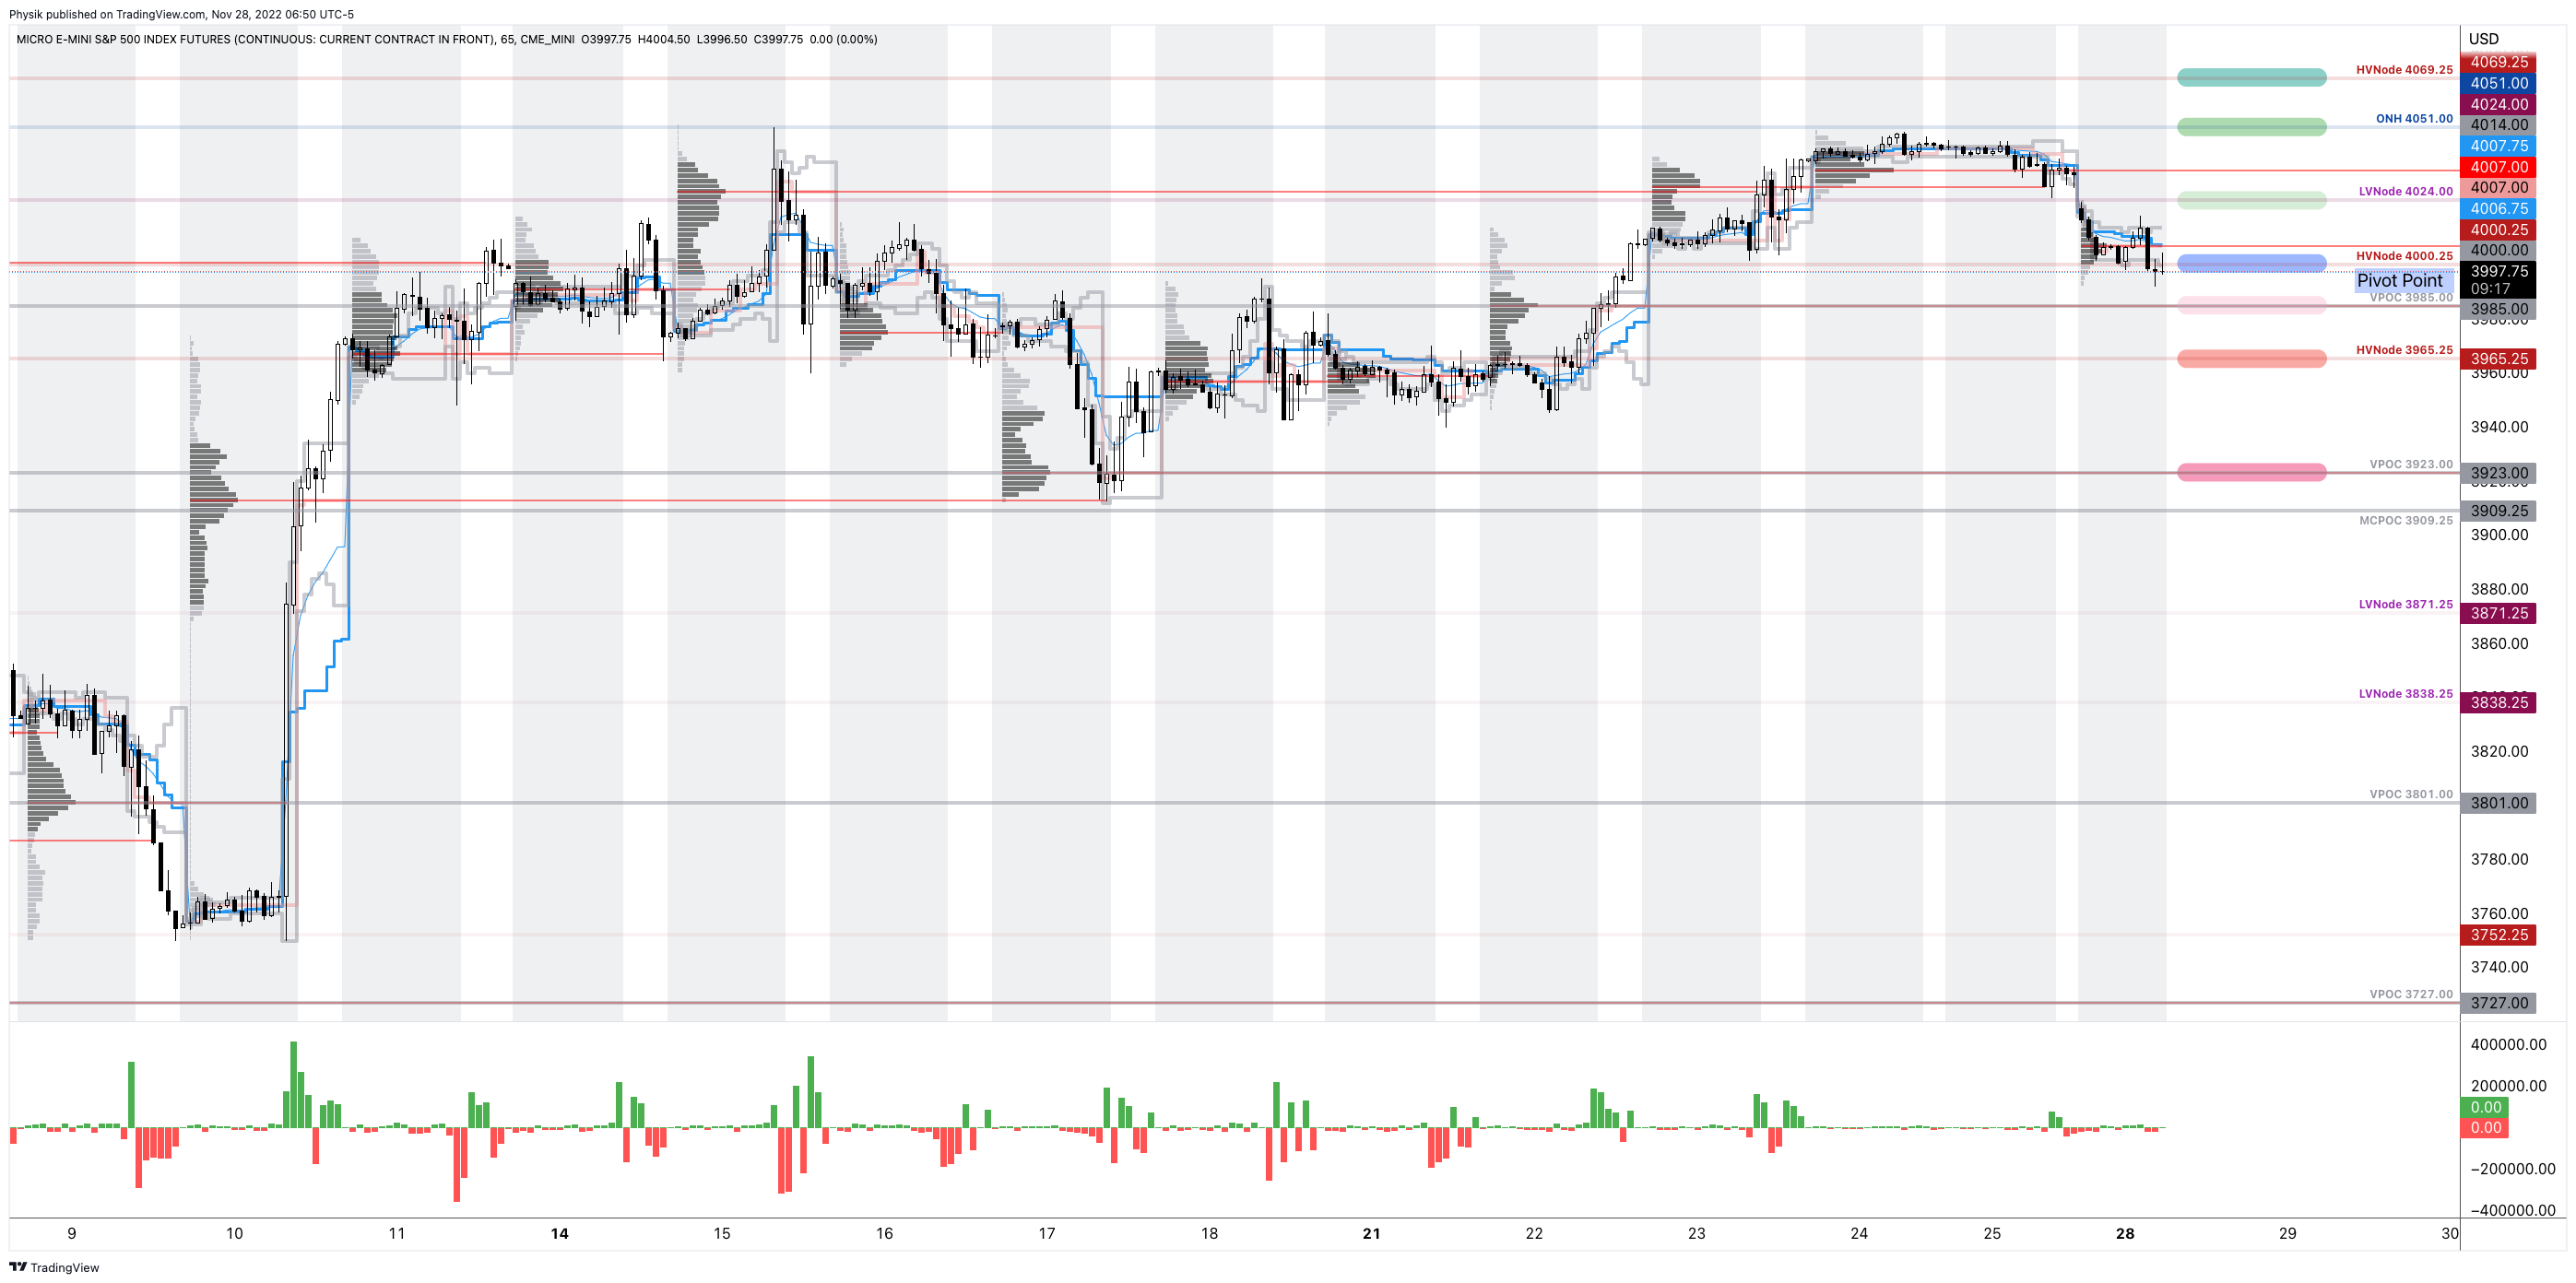
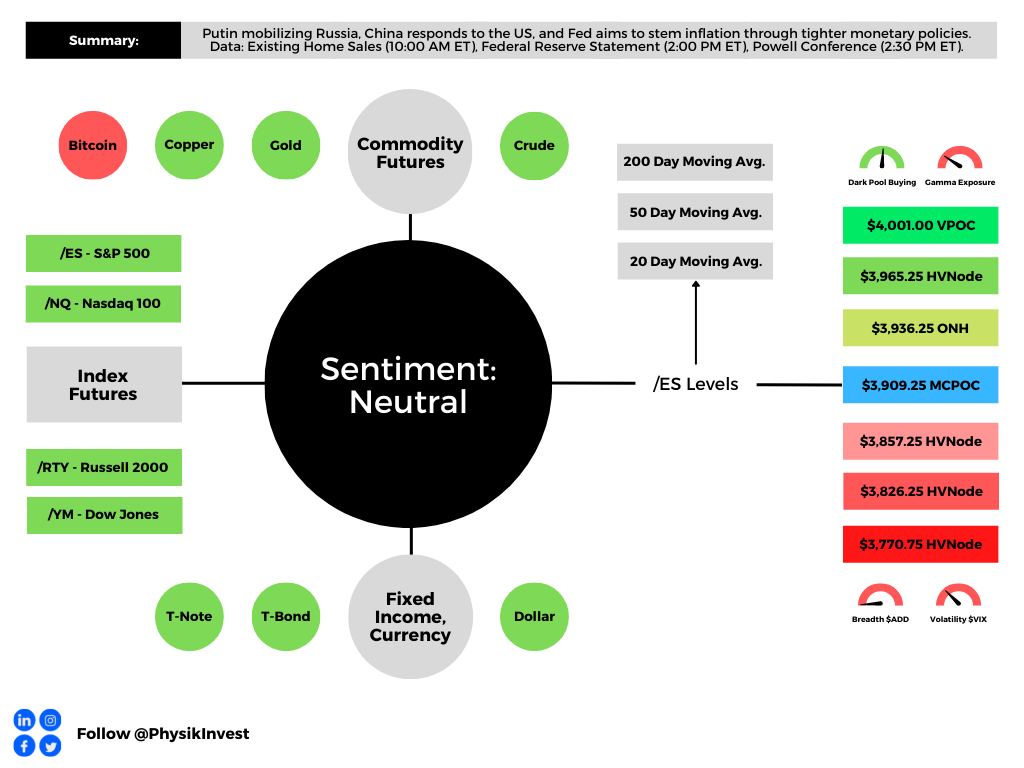
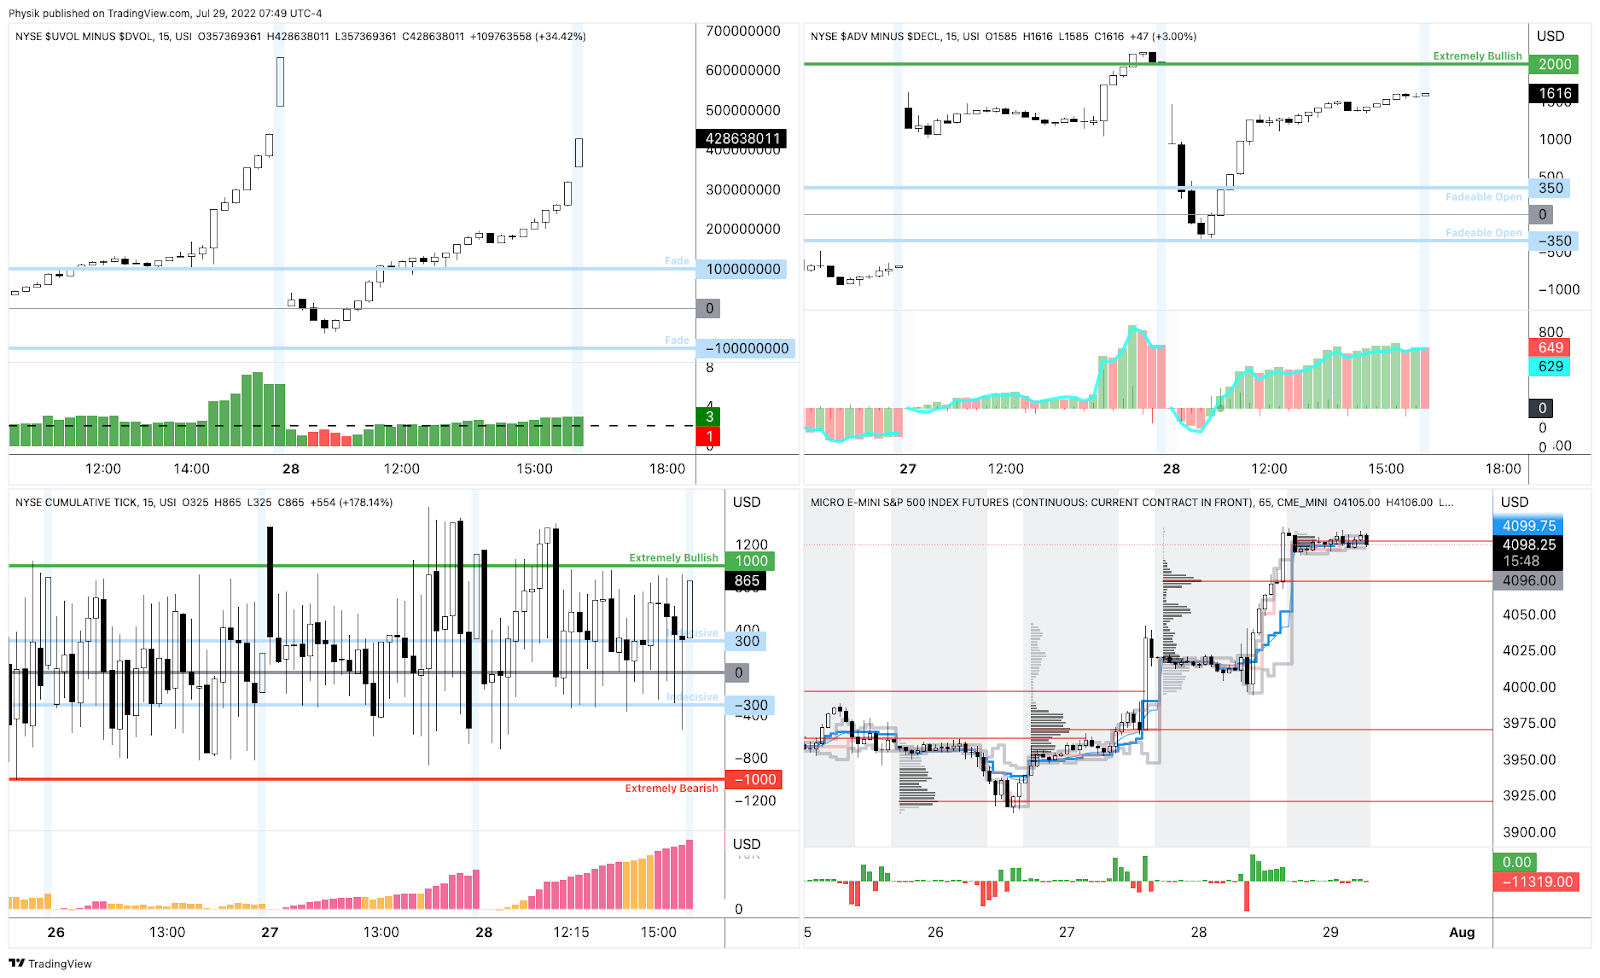
As of 8:20 AM ET, Friday’s regular session (9:30 AM – 4:00 PM ET), in the S&P 500, is likely to open in the upper part of a positively skewed overnight inventory, inside of prior-range and -value, suggesting a limited potential for immediate directional opportunity.
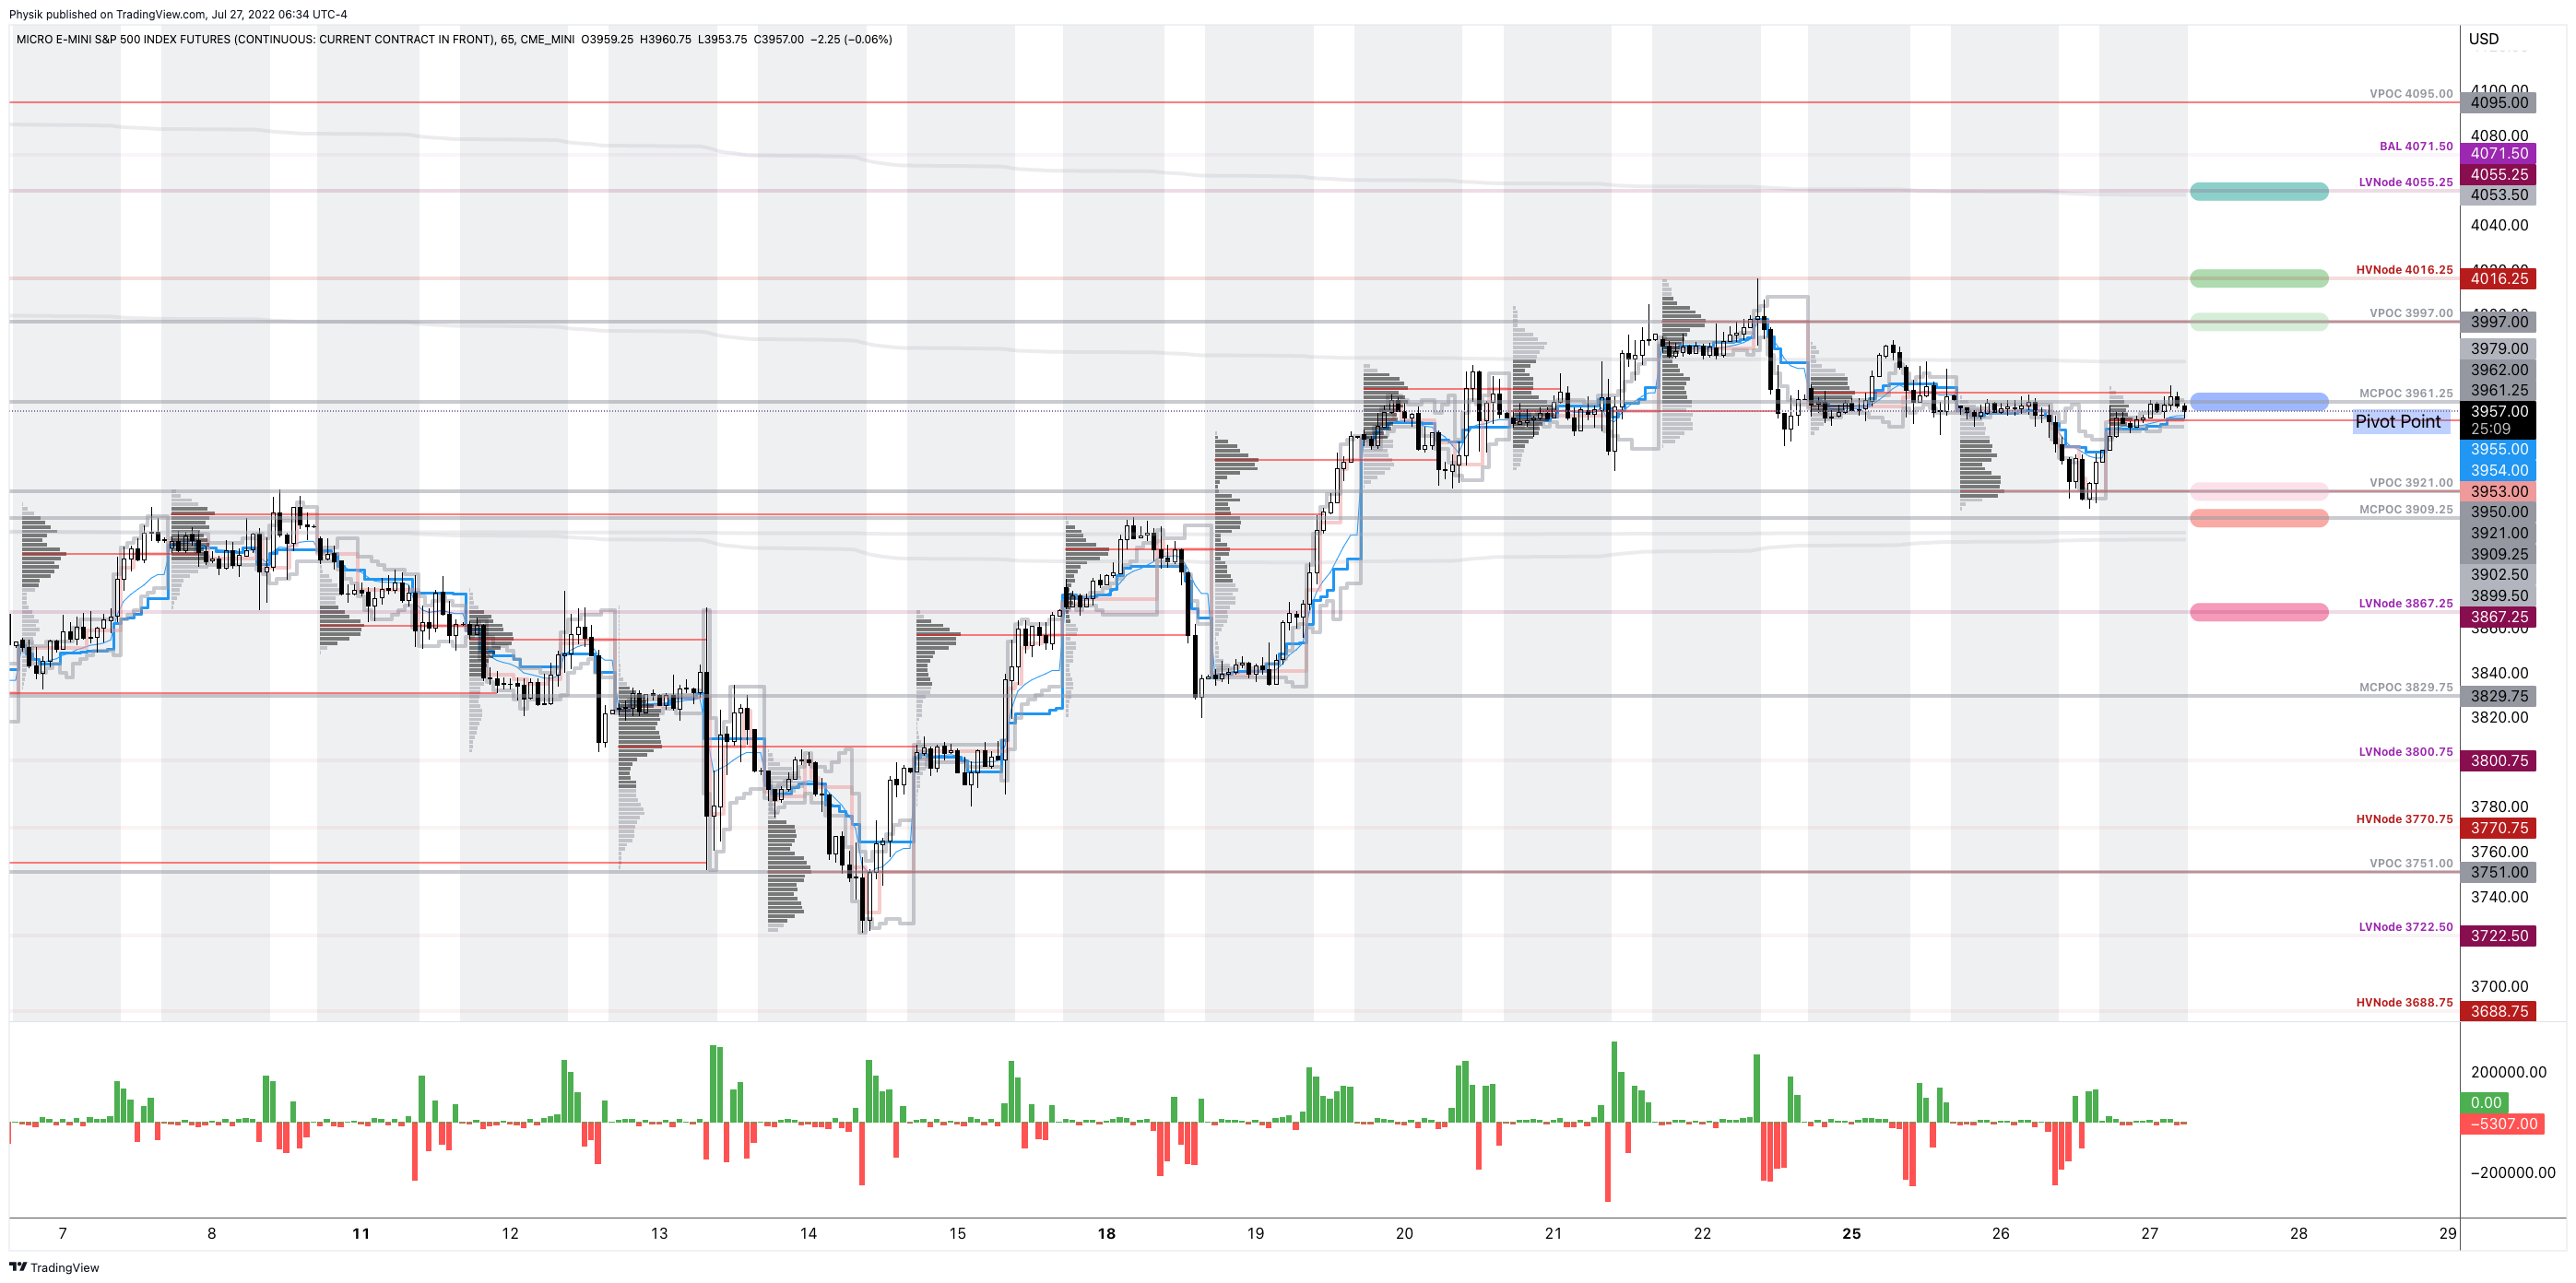
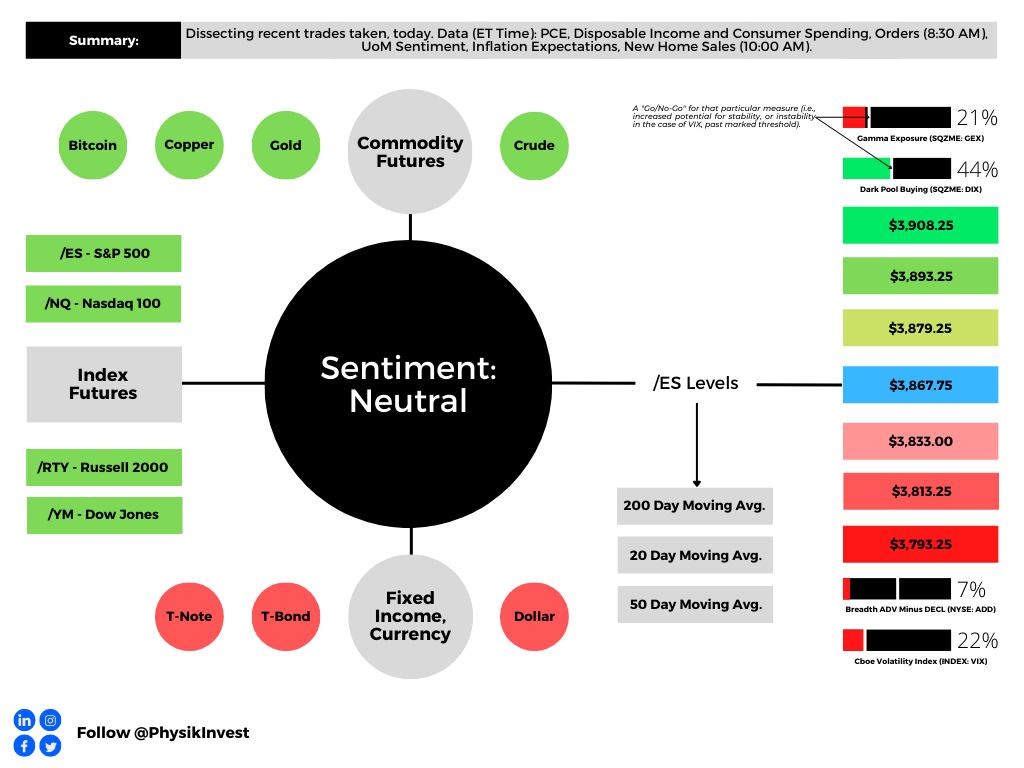
Our S&P 500 pivot for today is $3,867.75.
Key levels to the upside include $3,879.25, $3,893.75, and $3,908.25.
Key levels to the downside include $3,833.00, $3,813.25, and $3,793.25.
Click here to load today’s key levels into the web-based TradingView platform. All levels are derived using the 65-minute timeframe. New links are produced, daily.

Definitions
Volume Areas: Markets will build on areas of high-volume (HVNodes). Should the market trend for long periods of time, it will be identified by low-volume areas (LVNodes). LVNodes denote directional conviction and ought to offer support on any test.
If participants auction and find acceptance in an area of a prior LVNode, then future discovery ought to be volatile and quick as participants look to HVNodes for favorable entry or exit.
POCs: Denote areas where two-sided trade was most prevalent in a prior day session. Participants will respond to future tests of value as they offer favorable entry and exit.
MCPOCs: Denote areas where two-sided trade was most prevalent over numerous sessions. Participants will respond to future tests of value as they offer favorable entry and exit.
About
In short, an economics graduate working in finance and journalism.
Capelj spends most of his time as the founder of Physik Invest through which he invests and publishes daily analyses to subscribers, some of whom represent well-known institutions.
Separately, Capelj is an equity options analyst at SpotGamma and an accredited journalist interviewing global leaders in business, government, and finance.
Past works include conversations with investor Kevin O’Leary, ARK Invest’s Catherine Wood, FTX’s Sam Bankman-Fried, Lithuania’s Minister of Economy and Innovation Aušrinė Armonaitė, former Cisco chairman and CEO John Chambers, and persons at the Clinton Global Initiative.
Contact
Direct queries to renato@physikinvest.com or Renato Capelj#8625 on Discord.
Calendar
You may view this letter’s content calendar at this link.
Disclaimer
Do not construe this newsletter as advice. All content is for informational purposes.