
Physik Invest’s Daily Brief is read by thousands of subscribers. You, too, can join this community to learn about the fundamental and technical drivers of markets.
Administrative
We will issue a content calendar, soon, revealing the dates letters are likely to be published and the content that may be covered. That said, due to the writer’s travel commitments, from 12/6 to 12/9 and 12/12 to 12/16 there will be no commentaries. If any queries, or if you are local to New York City or Paris, ping renato@physikinvest.com or Renato Capelj#8625 on Discord.
Reflections
Fundamentally, our Wednesday letter pointed to some macro-type forces creating an uncertain context for traders.
Key crosswinds are numbered (1-4).
Alongside (1) easing financial conditions, the markets roared higher with boosts coming from (2) a “vol crunch” and “systemic exposure reallocation,” Nomura Holdings Inc’s (NYSE: NMR) Charlie McElligott November 28, 2022, said.
Our November 30, 2022 letter noted Morgan Stanley (NYSE: MS) strategists were seeing a (3) “contraction … [or] squeezing of liquidity that, alone, implies an 8% drop for the S&P 500.”
Strategists JPMorgan Chase & Co (NYSE: JPM) agreed:
On “a significant decline in corporate earnings, at a time of higher interest rates (implying lower P/Es and lower prices relative to the 2022 lows), … [a] market decline could happen between now and the end of the first quarter of 2023.”
With (4) “the financial system … evolved around an environment of near-zero interest rates, … [built up] market interdependencies … can cause selloffs” that feed on themselves (i.e., large market drops statistically add to the likelihood of further large drops).
In light of the above (1-4) crosswinds, we took a step back and asked:
How do we get bullish – particularly if policymakers ease the pace of rate increases – and not lose much money if the market falls, or position ourselves for the drop many expect?
To quote our November 30, 2022 letter, the Nasdaq 100’s (INDEX: NDX) “volatility skew … was smile-shaped, … making for some great trades to the upside,” we said, adding: “we can use the richness of further away calls to reduce the cost of our bets on the market upside.”
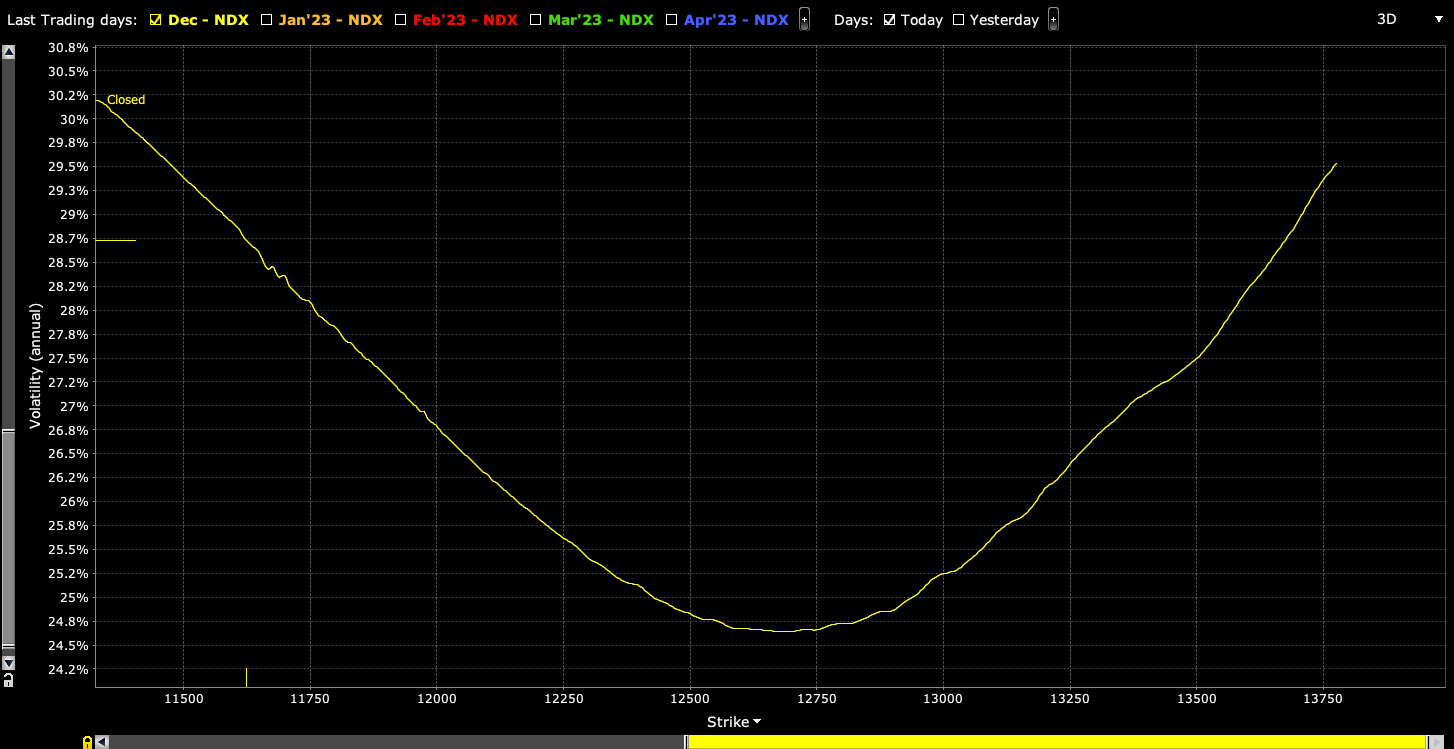
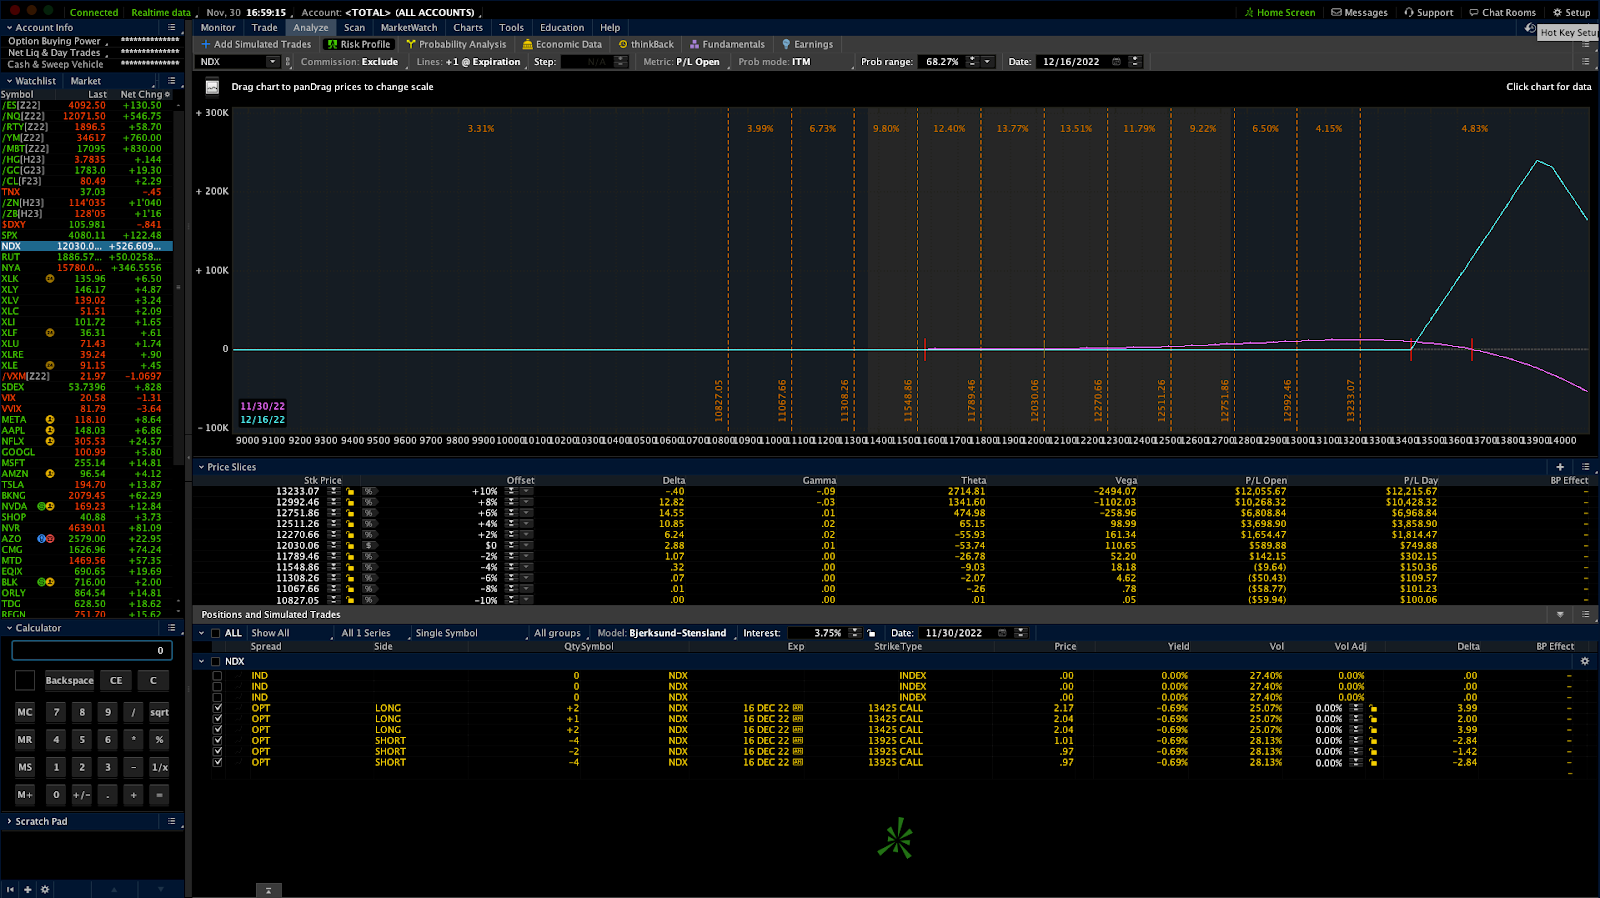
The sample trade provided: 500-1000 points wide call ratio spreads (buy the closer leg, sell two of the farther legs) expiring in fifteen days may work well (e.g., SELL -1 1/2 BACKRATIO NDX 100 16 DEC 22 [AM] 13425/13925 CALL @.20 CR LMT).
The trade’s key greeks (+Delta and +Gamma) suggested upside would result in profit. The NDX did rise, and the sample trade priced as high as +2,000%. Adding, as sized by the letter writer, if NDX -10.00%, the loss was limited to $60.00. If the NDX +10.00%, with other conditions the same, profit ~$12,000.00.
Back to the present. What now?
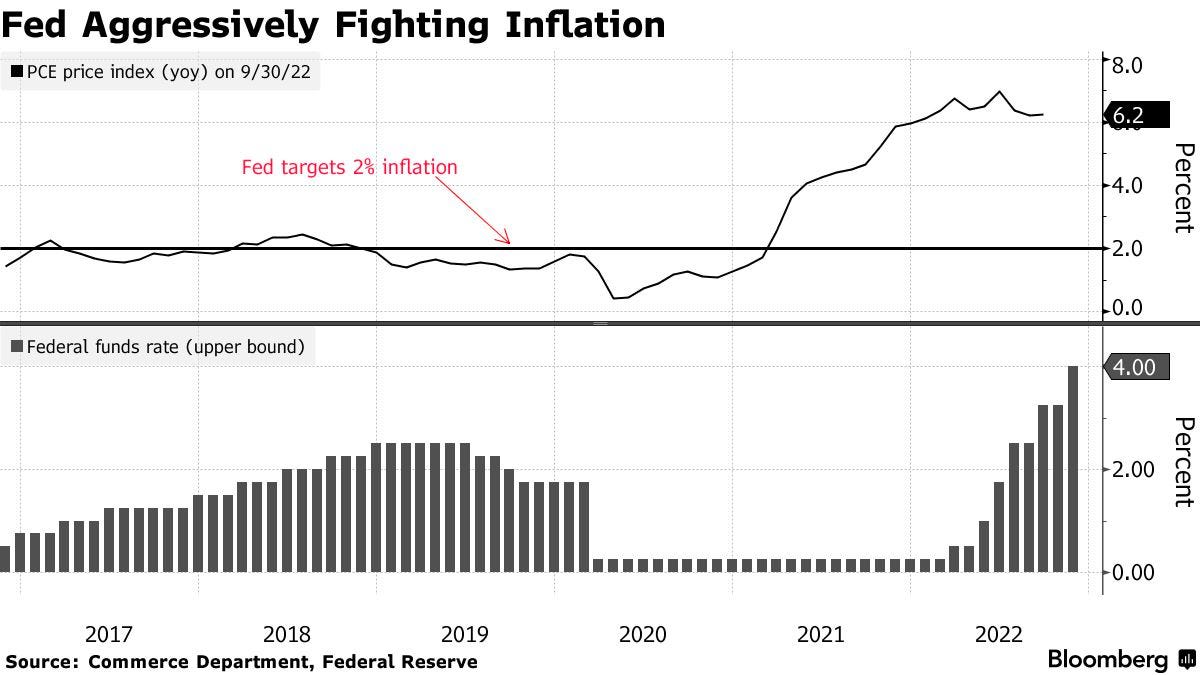
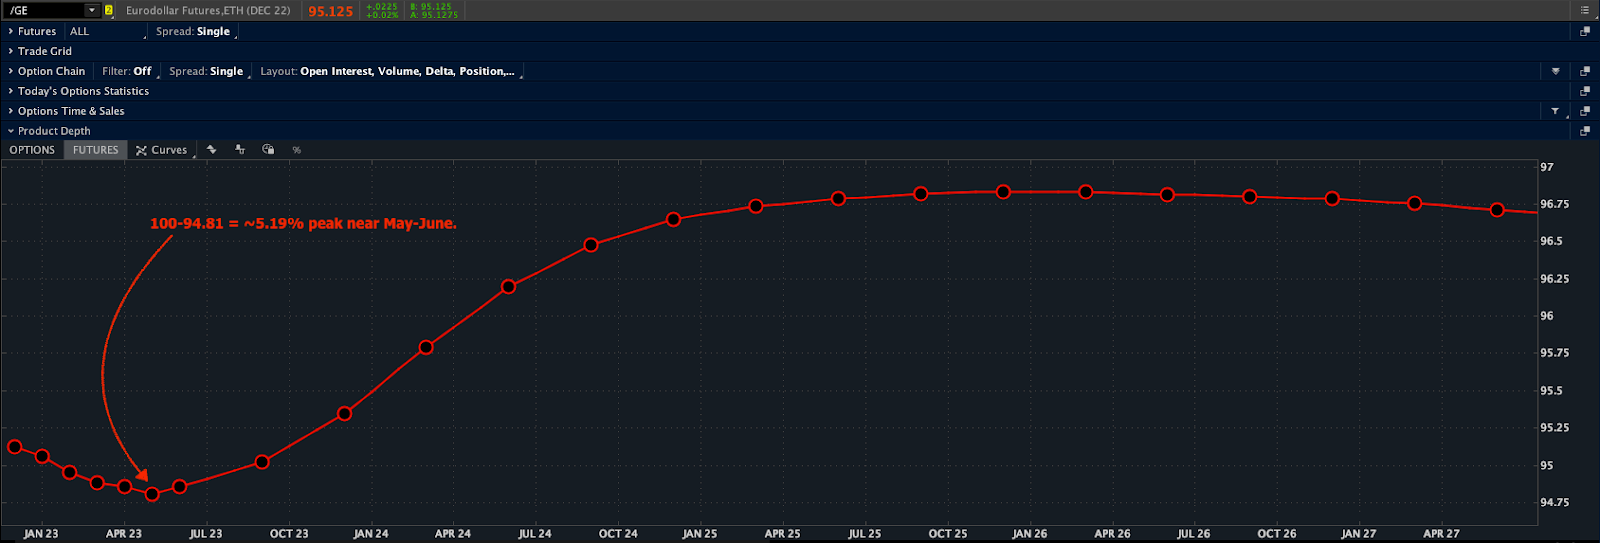
With news that China is loosening its grip on Covid, and the Federal Reserve seeing inflation fall in some parts of the economy (despite markets showing the terminal rate at ~5.20% next spring) ahead of PCE inflation updates this morning, there is a chance for follow-on bullishness.
So, what is the takeaway?
The purpose of this letter, though it seems we venture beyond it at times, is to ponder theory as well as generate actionable trade ideas based on the application of theory to recent happenings.
Though there are factors that may skew the expected distribution of returns one way or another, a trade is a coinflip; your bet either works or it does not. Using the factors of volatility and time to our advantage may lower the risk and cost of bets, in case they do not pan out.
In short, we don’t know if up or down, but we can use market context to lower our costs and live to fight another day! See you later.
Technical
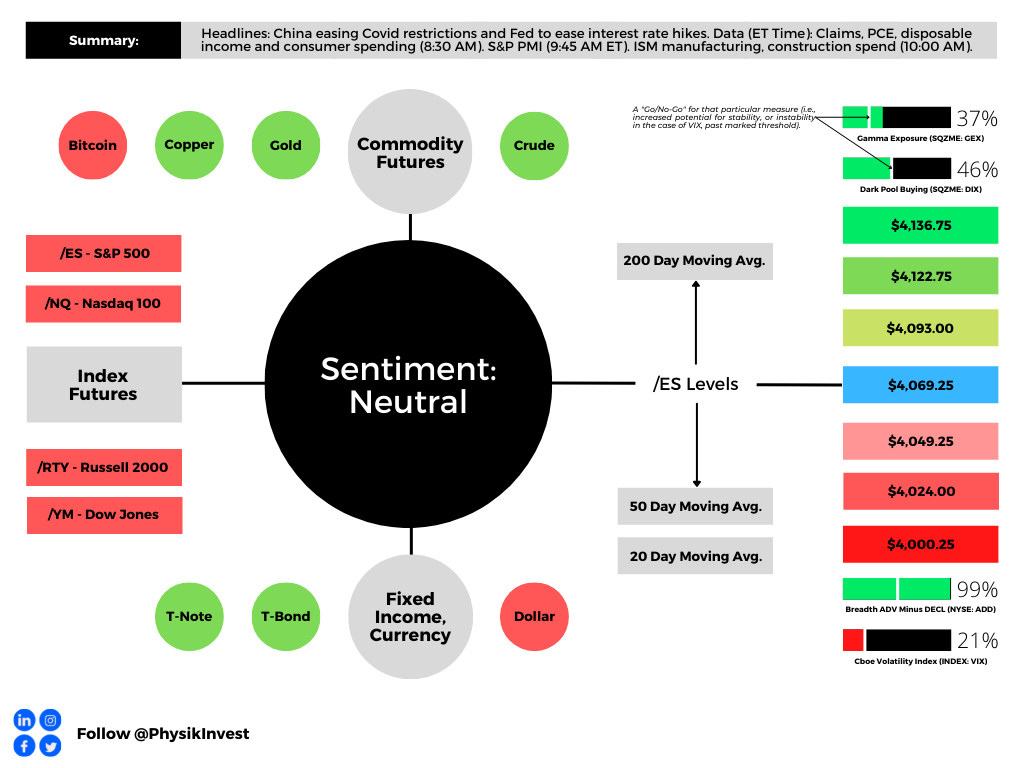
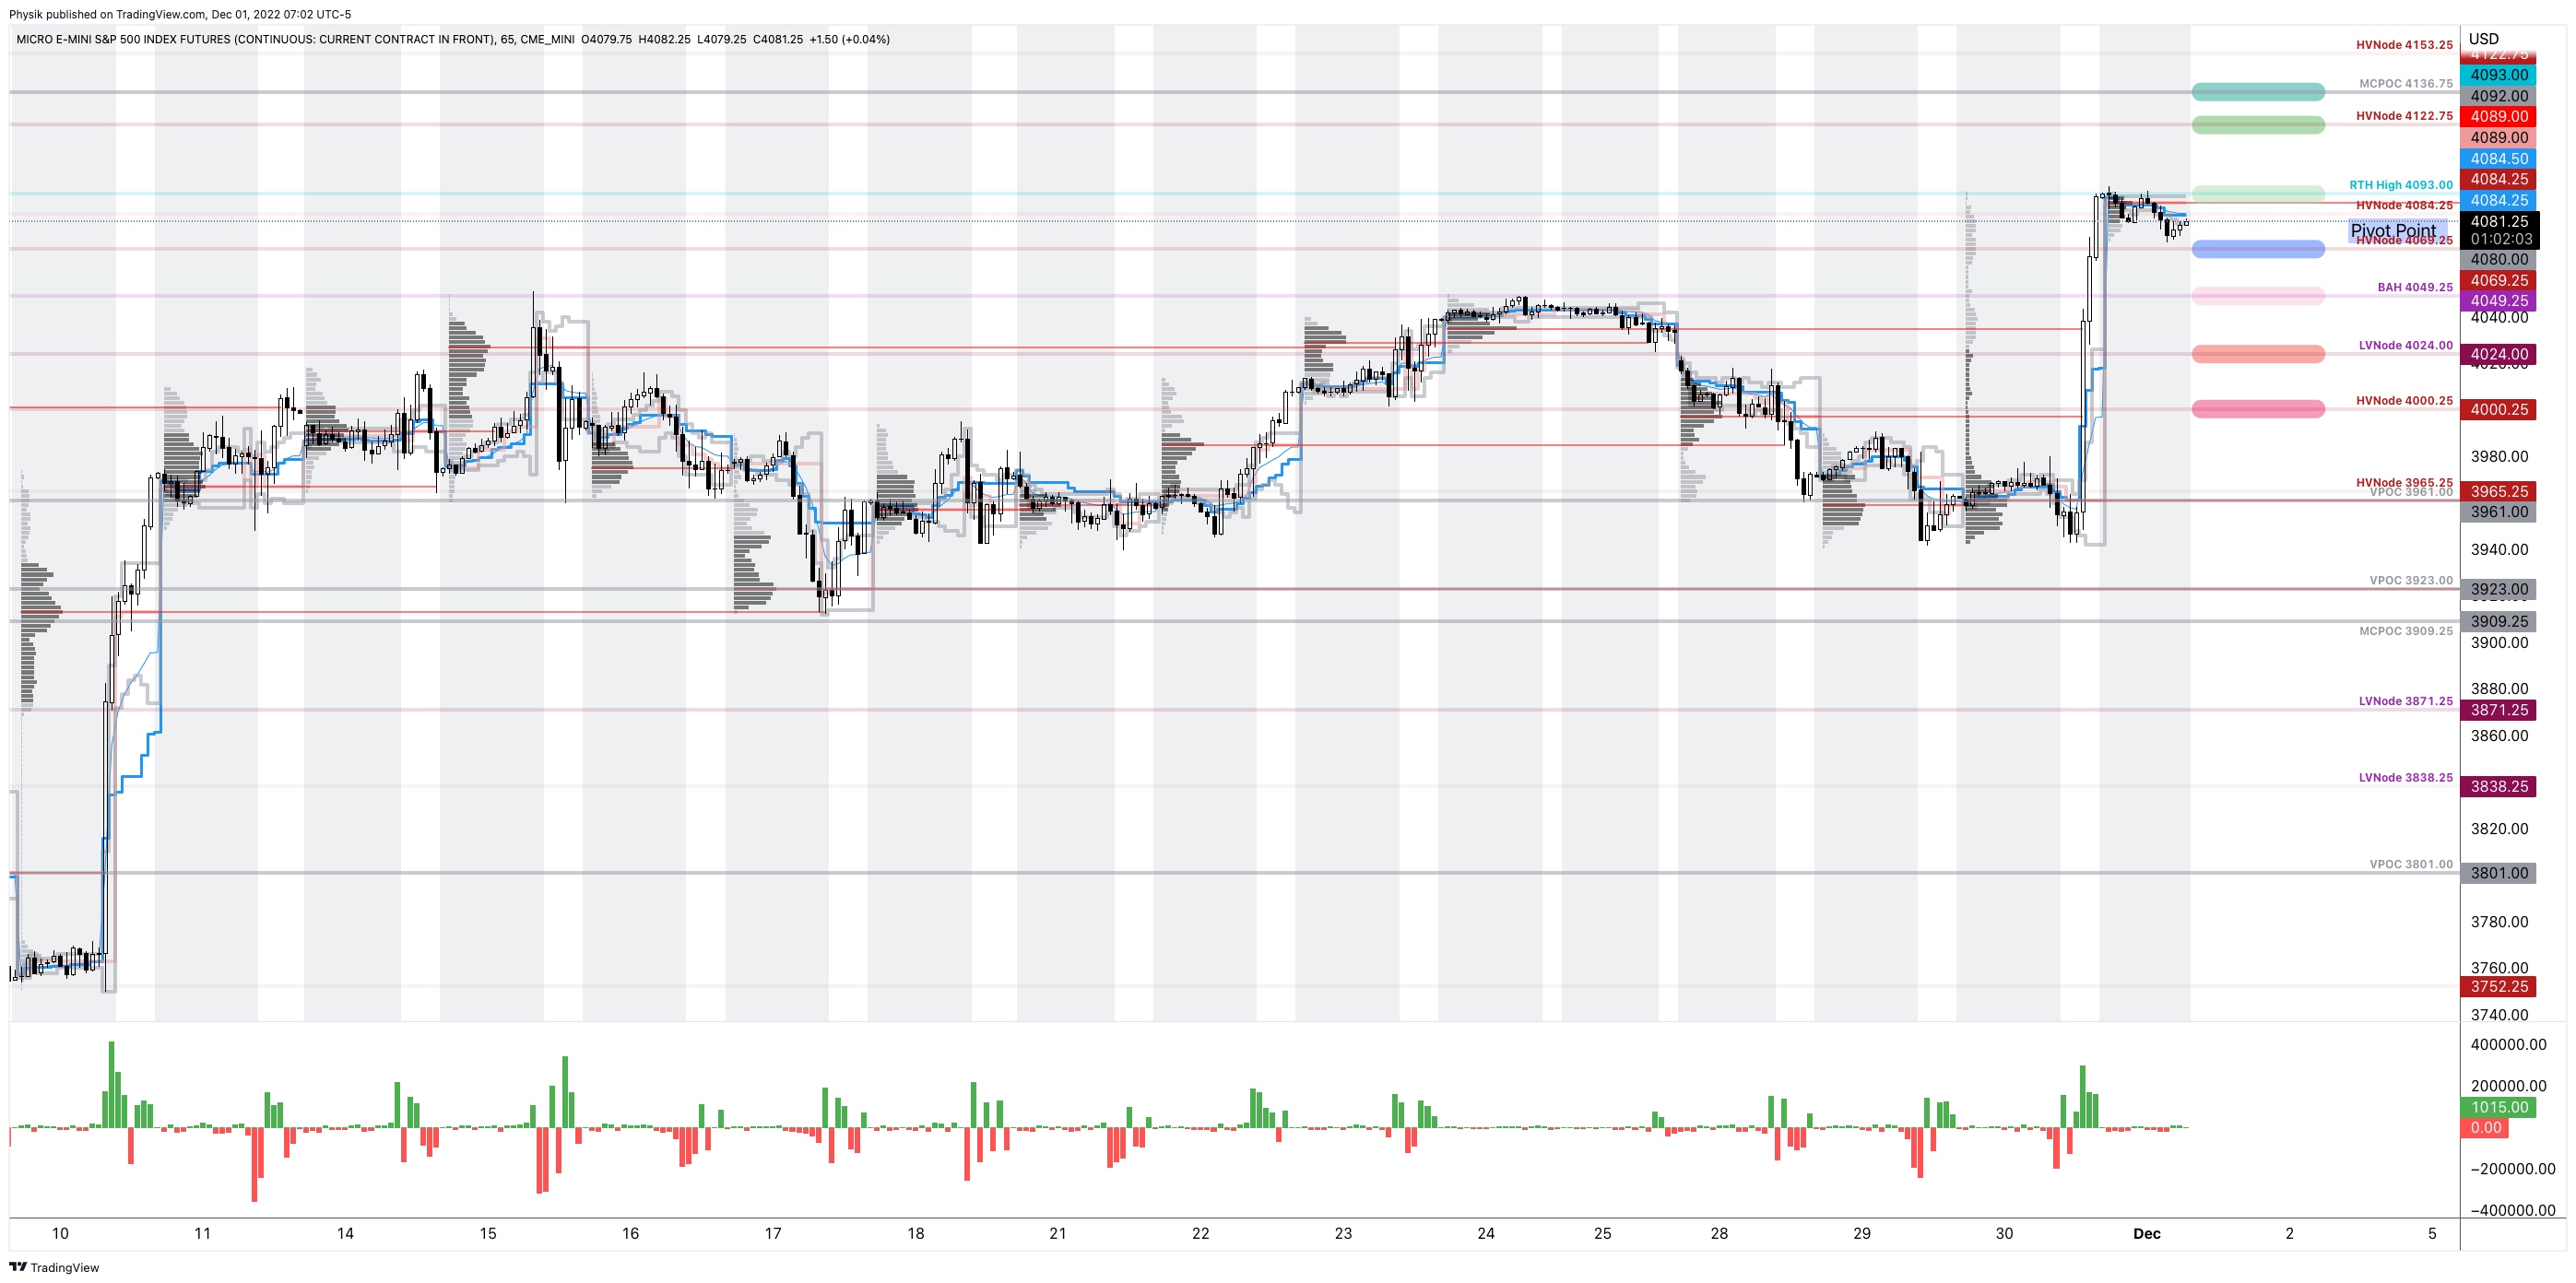
As of 7:00 AM ET, Thursday’s regular session (9:30 AM – 4:00 PM ET), in the S&P 500, is likely to open in the lower part of a negatively skewed overnight inventory, inside of prior-range and -value, suggesting a limited potential for immediate directional opportunity.
Our S&P 500 pivot for today is $4,069.25.
Key levels to the upside include $4,093.00, $4,122.75, and $4,136.75.
Key levels to the downside include $4,049.25, $4,024.00, and $4,000.25.
Click here to load today’s key levels into the web-based TradingView platform. All levels are derived using the 65-minute timeframe. New links are produced, daily.
Definitions
Volume Areas: Markets will build on areas of high-volume (HVNodes). Should the market trend for long periods of time, it will be identified by low-volume areas (LVNodes). LVNodes denote directional conviction and ought to offer support on any test.
If participants auction and find acceptance in an area of a prior LVNode, then future discovery ought to be volatile and quick as participants look to HVNodes for favorable entry or exit.
POCs: Denote areas where two-sided trade was most prevalent in a prior day session. Participants will respond to future tests of value as they offer favorable entry and exit.
MCPOCs: Denote areas where two-sided trade was most prevalent over numerous sessions. Participants will respond to future tests of value as they offer favorable entry and exit.
Volume-Weighted Average Prices (VWAPs): A metric highly regarded by chief investment officers, among other participants, for quality of trade. Additionally, liquidity algorithms are benchmarked and programmed to buy and sell around VWAPs.
About
In short, an economics graduate working in finance and journalism.
Capelj spends most of his time as the founder of Physik Invest through which he invests and publishes daily analyses to subscribers, some of whom represent well-known institutions.
Separately, Capelj is an equity options analyst at SpotGamma and an accredited journalist interviewing global leaders in business, government, and finance.
Past works include conversations with investor Kevin O’Leary, ARK Invest’s Catherine Wood, FTX’s Sam Bankman-Fried, Lithuania’s Minister of Economy and Innovation Aušrinė Armonaitė, former Cisco chairman and CEO John Chambers, and persons at the Clinton Global Initiative.
Contact
Direct queries to renato@physikinvest.com or Renato Capelj#8625 on Discord.
Disclaimer
Do not construe this newsletter as advice. All content is for informational purposes.


2 replies on “Daily Brief For December 1, 2022”
[…] Please check out the Daily Brief for November 29 and 30, as well as December 1. […]
[…] for the feedback on the December 1, 2022 letter, everyone! Here is a wordy response I sent to one subscriber on an example trade that was […]