This week’s letter is about 7,000 words and may be cut off. If so, try viewing it in a browser window!
Our long-winded “Reality Is Path-Dependent” letter, which you can review here, received great feedback. Thank you! We will spare you the excruciating details this week and opt for more frivolity. Additionally, following this brief update section of the letter below, we will reveal our first “Market Intelligence” podcast episode and transcript. Please read on!
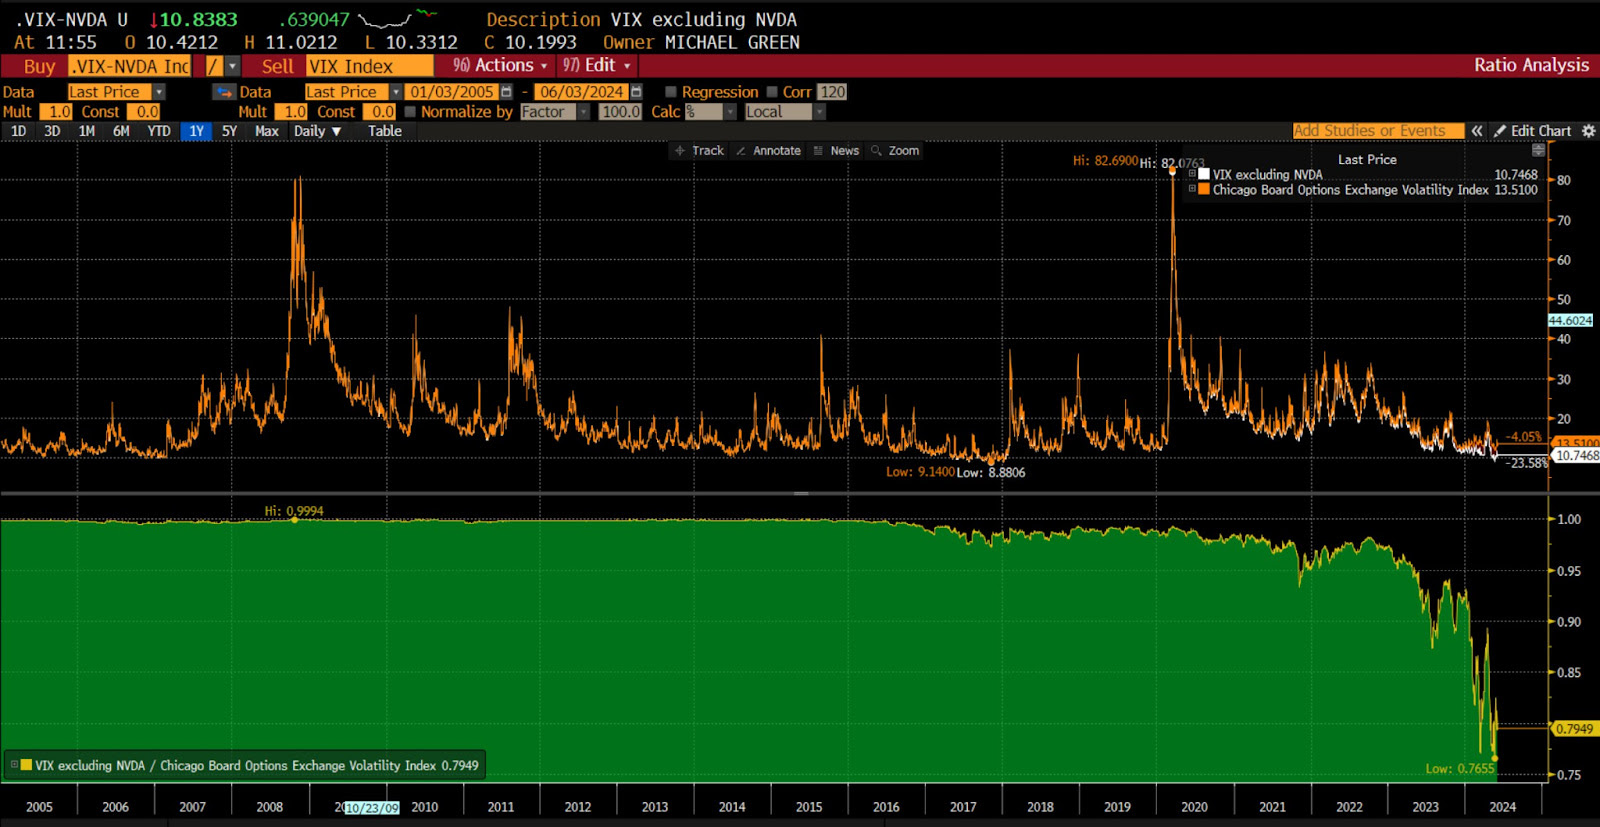
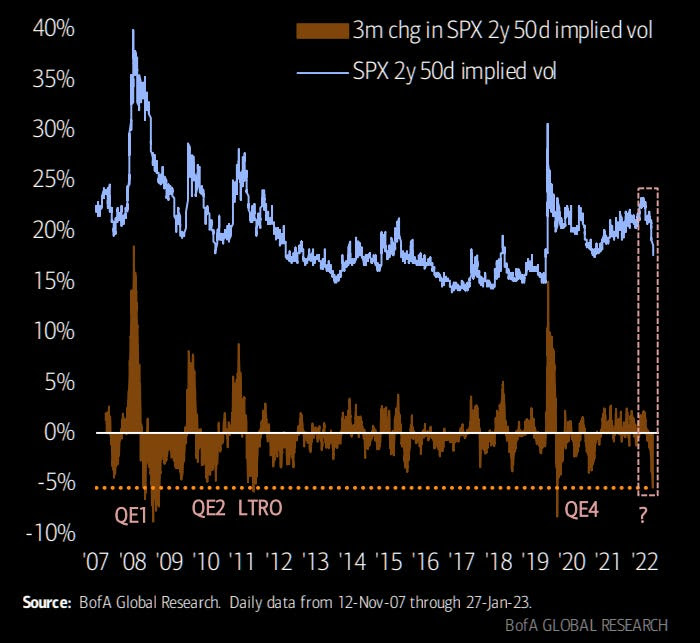
From low levels, spot-vol beta (i.e., the relationship between the market or “spot” and changes in its volatility or the sensitivity of volatility to the market’s trading) performs better, as The Ambrus Group’s Kris Sidial characterizes.

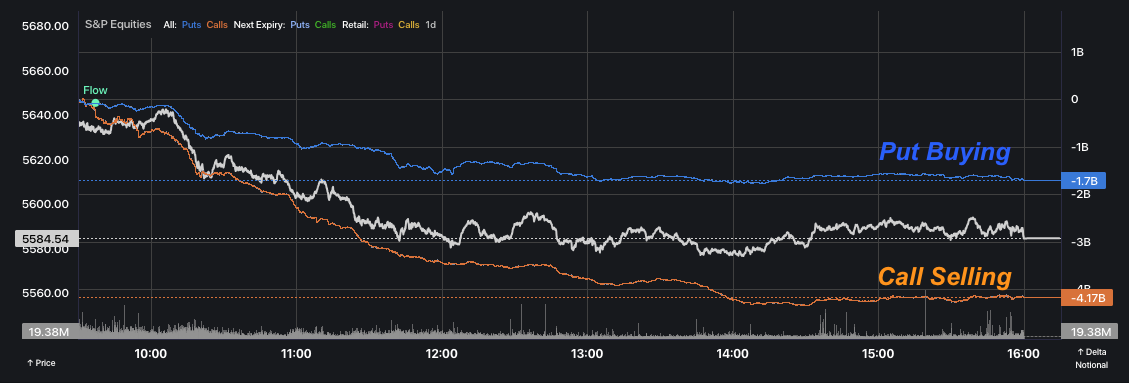
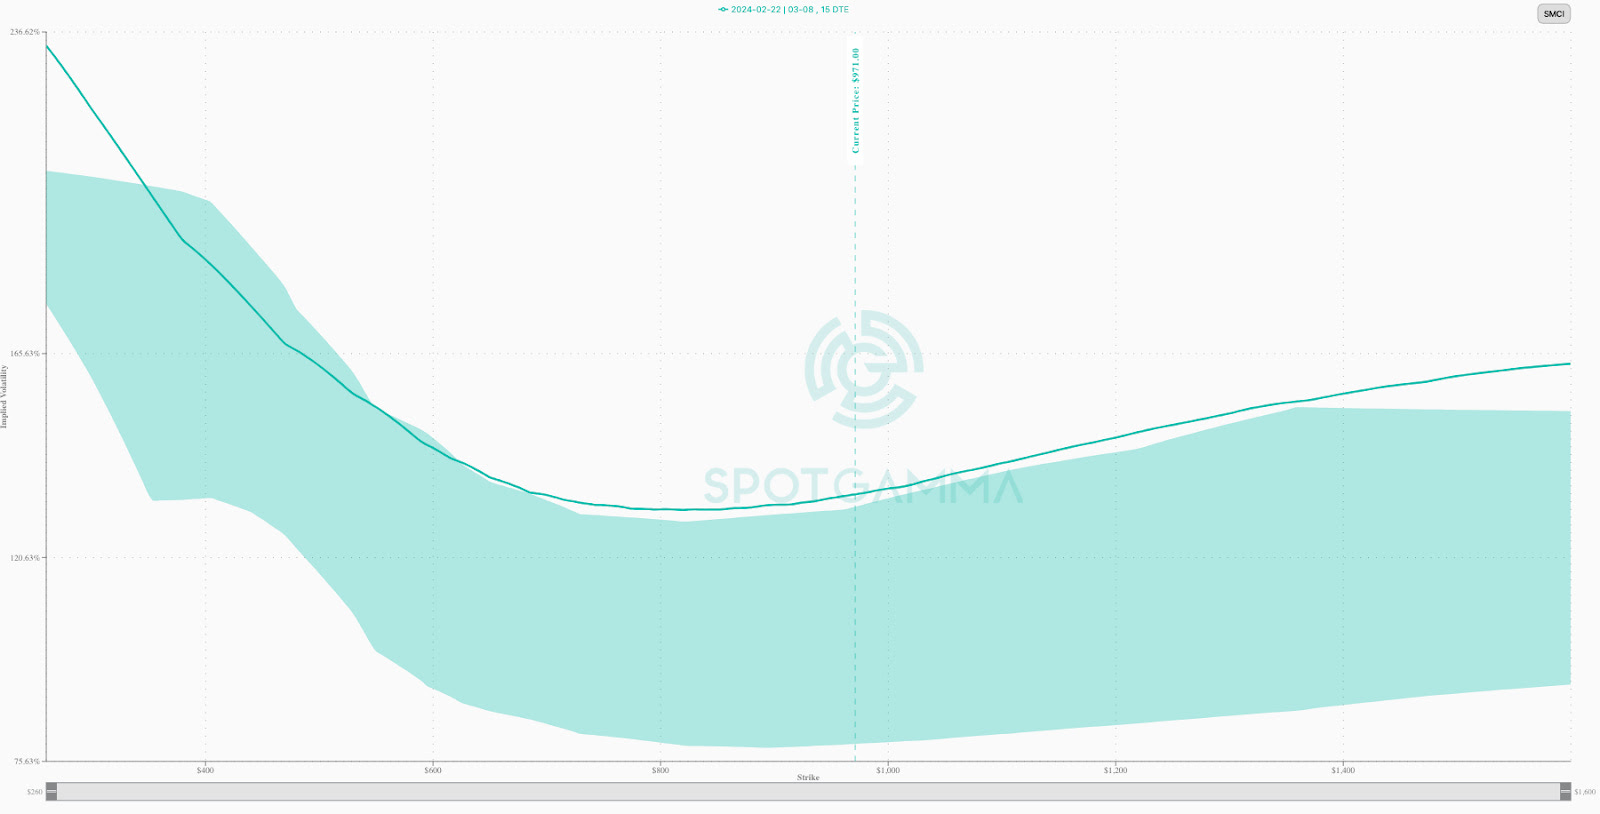
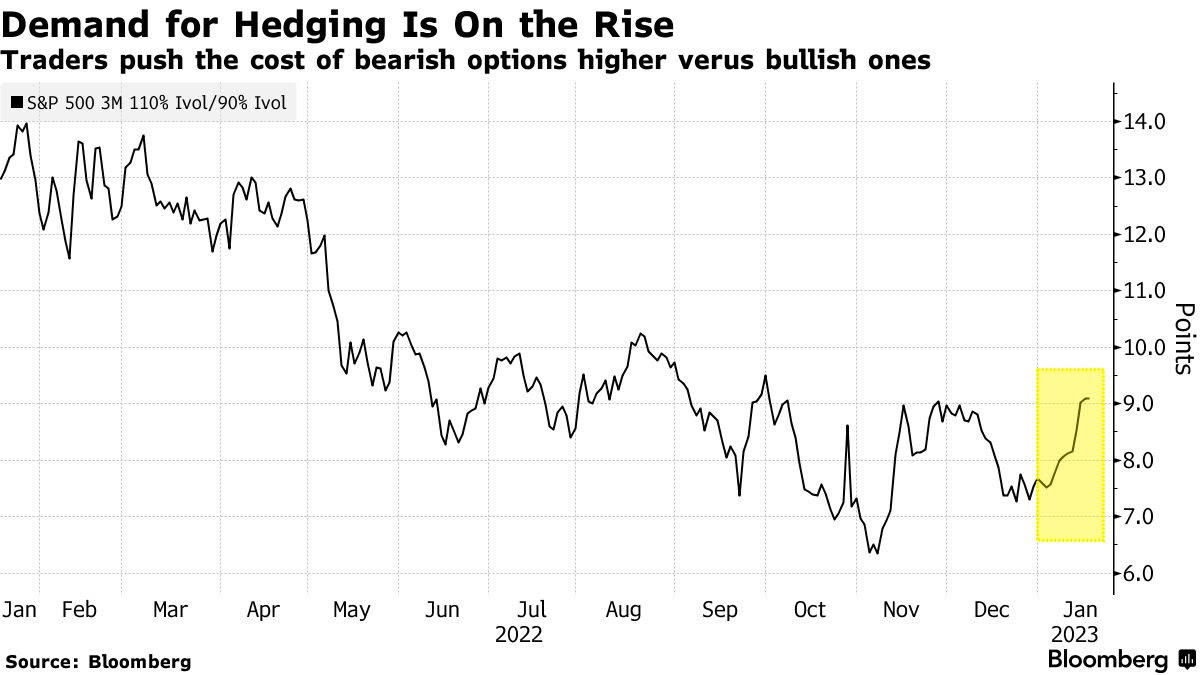
Sidial sees “some institutional flow reach for tail-like protection,” which we can observe in elevating volatility skew (i.e., the variation in implied volatilities or the market’s forecast of likely movements for different strike price options).

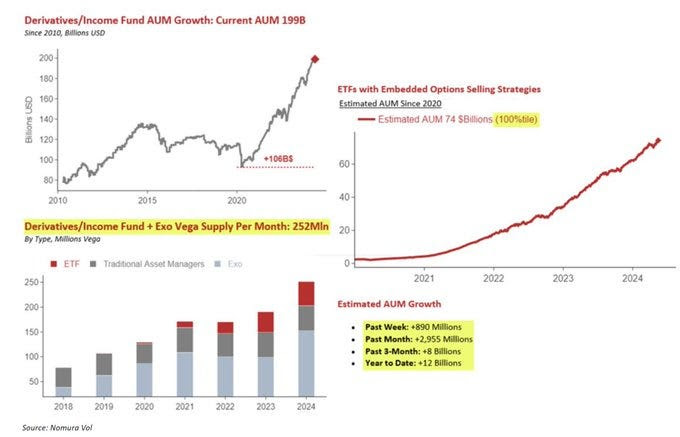
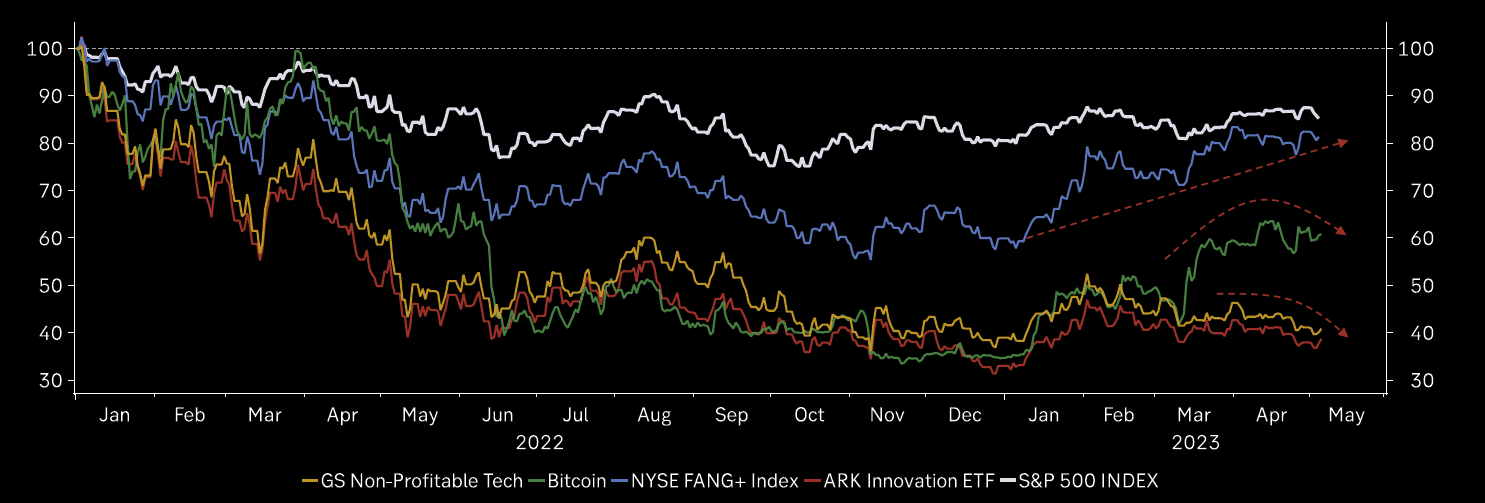
BNP Paribas (OTCMKTS: BNPQY) identifies fragility, noting that selling flows from systemic strategies are offset by buying flows in ETFs. Their positioning indicators remain close to “maximum long.” A more correlated move may destabilize broader measures and have policy consequences; reality is path-dependent. To explain, inflation numbers haven’t worsened, and the wealth effect has supported the economy. However, with a ~10% market pullback, there’s a ~$10 trillion money supply and collateral reduction.
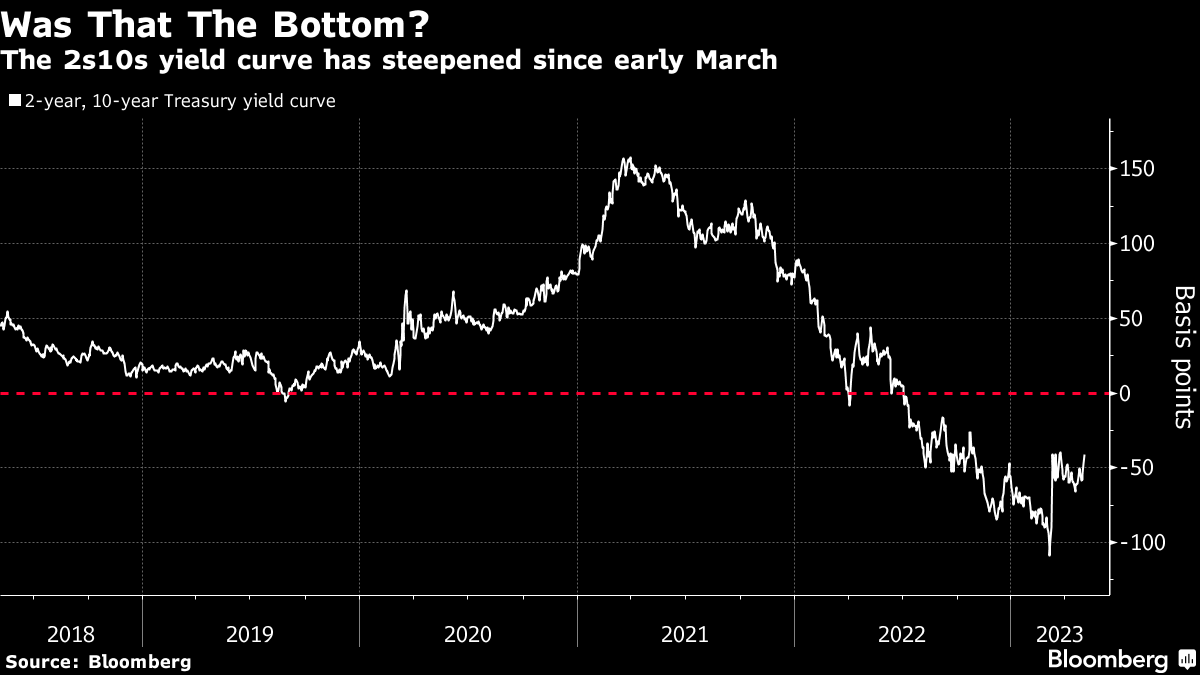
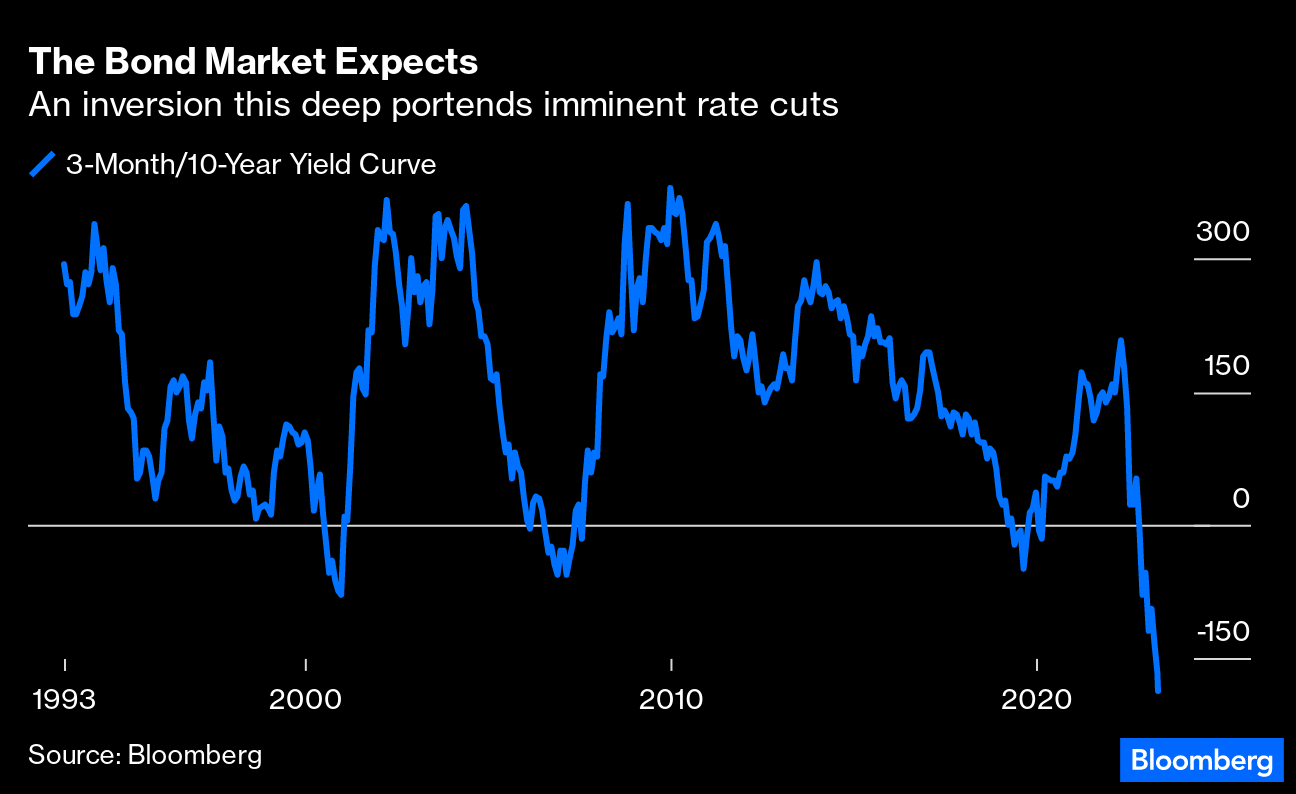
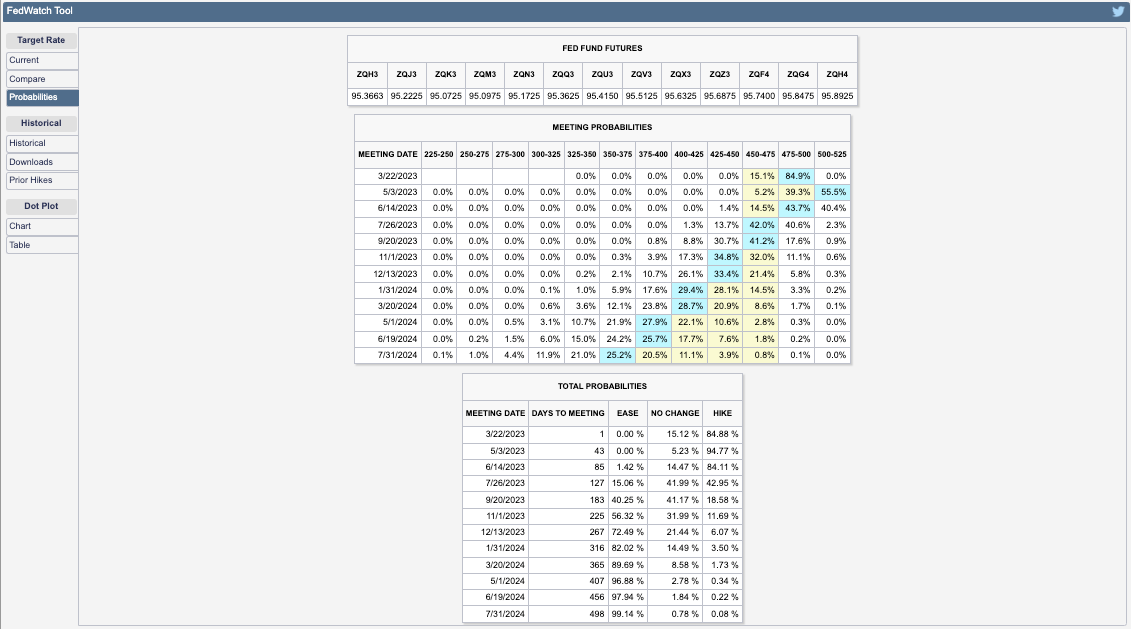
“The Federal Reserve will tell you all day long that they don’t manage the market, but they manage the money supply,” Kai Volatility’s Cem Karsan says. “The market has a wealth effect, which is money supply. So you better believe they’re watching this market if we continue to decline here. A July 31st [cut] is not only on the table; it becomes likely.”
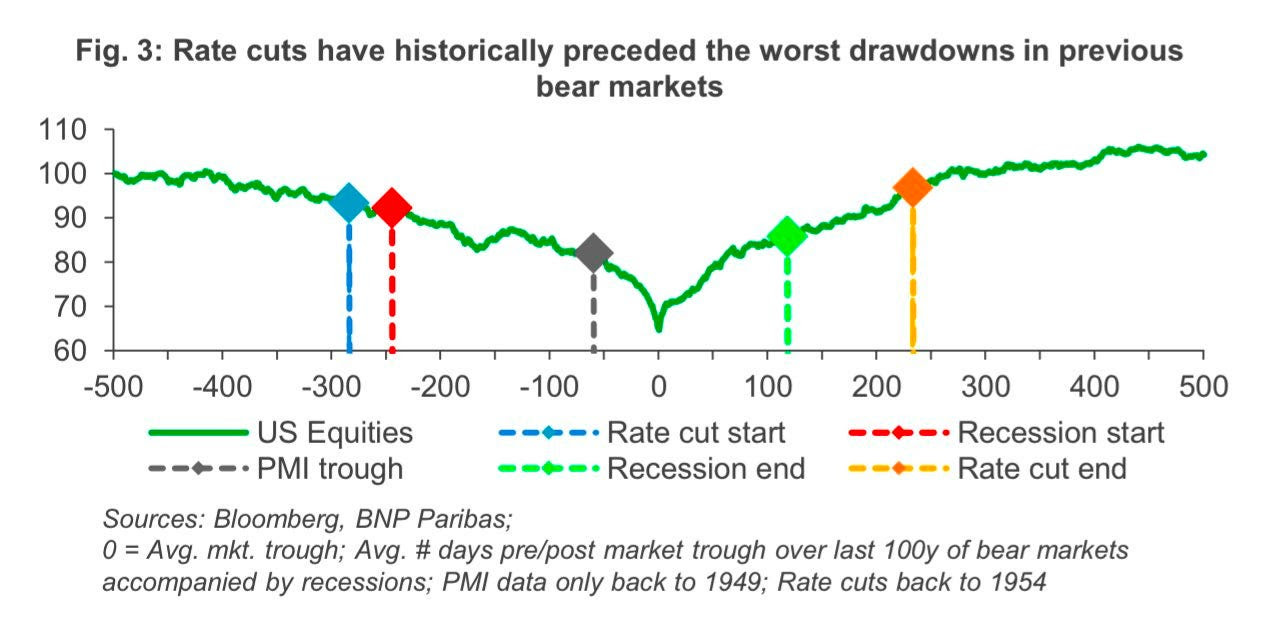
Bill Dudley, former president of the Federal Reserve Bank of New York and chair of the Bretton Woods Committee, agrees that the Fed should cut this month as the delta between the haves and have-nots grows. Easing financial conditions and surging stock markets increased wealthier households’ consumption propensity. To contain inflation sustained monetary tightening from the Fed would be required, but many at the bottom are falling on hard times. Tightening labor markets can lead to reduced spending, economic weakening, and reduced business investment. That portends layoffs and even less spending; recessions soon follow.
Reminiscences of a Market Maker
Imagine you’re a large trader whose fund’s survival depends on quickly hedging against a severe market drop. You log on to your computer and place an order to buy to open 25,000 put spreads in the S&P 500 (INDEX: SPX). You’re shocked that only 175 of the 25,000 are executed at your desired price; you must break the order into smaller pieces.
That’s the horror story of screen trading. It’s also why pit trading, which financial journalism has long predicted the end of, is here to stay. Exchanges like the Chicago Board Options Exchange or Cboe fulfill such demands, offering traders a size market through a hybrid model combining electronic and pit trading. That’s according to Mat Cashman from the Options Clearing Corporation (OCC), whom we featured on our inaugural podcast episode last week.
Cashman’s been in markets for decades, starting in the pits of Chicago’s trading floors before moving to London and back to build big trading businesses. He explains pit trading is here to stay. Just look to the Miami Exchange preparing to pair its electronic trading venue with a physical one in Miami’s Wynwood neighborhood. Pit trading enables better negotiation of large orders, which can be challenging to achieve with electronic trading, especially during volatile markets.
“You can only write a headline about how pit trading is dying so many times before you’re like, maybe it will never die,” he shared. “You can find this sweet spot in that hybrid environment where one bolsters the other, and they both feed on each other regarding liquidity; they’re puzzle pieces that fit into each other to help keep up with the size that needs to be executed at a price.”
Cashman went on to share a lot more, including his start in markets, managing risk and making faster decisions, the benefits and costs of automation, trading in the S&P 500 pit, the entities taking the other side of your trade, incentives, 0 DTE options and the risks of high-variance and illiquid trades. The video can be accessed at this link and below. A lightly edited transcript follows.
How did you get into markets?
Serendipitous is a good word for that.
I studied music and philosophy in college and was a saxophone player. I still am a saxophone player. I play all the time. But I was at a gig and met the drummer’s brother. This was like 1998. He was an options trader. An O’Connor Swiss Bank guy. That was a famous nexus for options trading, and many of the Chicago genesis of options trading started at O’Connor School. We started talking after the gig, and the drummer’s brother and I bonded over math and things of that nature.
“You should come down and talk to my partners,” the brother said.
So, I showed up and had a great meeting with them. They offered me a job on the spot as a clerk to become a trader. This was 1998 on the floor of the Cboe. There were a lot of things going on during the run-up in the Nasdaq bubble. In some ways, you’re looking for warm bodies. The floor is an incredibly chaotic place, so whoever you get has to be able to function in that environment, be excited by it, or have some proclivity for functioning there. Secondarily, you need someone who will be fast, quick on their feet, and understand math. And I happened to fit all those bills, and I am relatively tall at about 6’6”. That helps when dealing with 100-plus guys in a pit. Being tall, big, and aggressive helps. The stars aligned in that way.
Back then, you were a clerk for six months before you went out and had to break into pits, which were a very insular environment. If you think about how options trade, a limited amount of edge or money comes into the pit from orders. You’re dealing with a limited amount of edge and have 15 or 20 guys. It gets split up 20 ways. If you have 100 guys, it gets split up 100 ways. So, they were incentivized, and eventually, I was also incentivized as a member of a pit to keep people out. You want to avoid more people involved, especially if you have great products where everyone’s making a lot of money.
You don’t want that broadcast to the world.
So you have to go through the process of breaking in, which means you stand in the back, and people yell at you and call you the worst things you could imagine. Eventually, by just showing up every day and getting beat down, you go through this hazing process, get accepted into the fold, and suddenly become a pit member.
That took about six months as well. Once you get in, it is an entirely different environment. So that’s the kind of story. That was 1999. That was a long time ago. So, my career has had many different iterations of training since then. But that’s where it started. That was the genesis of the whole thing.

What products did you trade back then, and how long did it take you to get comfortable managing that risk, making quicker decisions, and so on?
I stood at Post 1 Station 1, which was for Xilinx, a chipmaker.
It takes about six months to show up and get into a situation where you can start trading. I learned Put/Call Parity and all of those things. I had a limited idea of Vega, Gamma, Delta, etc. In 1999, you’re looking for warm bodies, right? People who can understand how these things work relatively.
When you start trading, you’re in the pit doing everything the other guys do. Through the osmosis process, you learn how risk management works. In some ways, everyone in the pit has the same position because of the order flow. So, once you’re accepted into the pit, you learn the risk management ropes by getting your teeth kicked in and losing a bunch of money. It’s hard to say it that way. But in many ways, that’s how it works.
For instance, say that I have a giant call spread. I’m long 500 call spreads and short stock against them.
If the stock rallies to the long strike of the call spread and expires there, that is the worst-case scenario, especially if you don’t have it creatively hedged; instead, you have it hedged on a delta-neutral perspective, and you get smoked on that move because you’re short stock up, and your call spread never kicks in.
If everyone in the pit has that on, the collective groans as the stock rallies every day into expiration and then pins at the strike on Friday. That is instructive if you need help understanding what’s happening. You just know, “Oh, my P&L is incredibly negative every single day. Why is that?” And then you start to put the pieces together, … and learn the risk management part of it in a piecemeal sort of way over time. The funny part is that at the beginning, we talked about how you started reading all of these books, like “Dynamic Hedging: Managing Vanilla and Exotic Options.” Those are incredibly complex books. Never in a million years would I have even thought about picking up a book like that in 1999. So many things were going on, and I was just trying to keep up. I didn’t have time to read Nassim Taleb. I didn’t even know who that was. I do now, and I love reading that stuff, but it’s a much more informed and nuanced understanding of the landscape built up over 20 years of doing this. At first, you’re just busy getting your teeth kicked in and trying to figure out what is going on, and that part is the steep part of the learning curve.
How much of a psychological effect was in play back then versus today with automation removing people from the mix?
There are two sides to that coin.
It helps remove the emotional aspect of trading decisions and the human aspect of risk management.
Taking the emotion out of trading, as long as you feel your model is reliable, and you are continuously checking and tweaking it, can be beneficial. The problem arises when people substitute automation for good old-fashioned risk management.
The combination of those two things is the ultimate. I want all the good parts: to remove all the emotion from the trading so I don’t have FOMO (e.g., I’m not buying call spreads as a stock is rallying because everyone else is buying call spreads, or I’m not selling my stock when I’m short gamma because everyone else is).
Even if you have a sophisticated model, it doesn’t necessarily mean you can let it manage all your risk.
It is interesting to consider how it has changed the industry. That’s an interesting question as to whether or not the industry going forward is better suited or not quite as well prepared for the events on the horizon. I don’t know the answer to that question. I know that trading in the pit in 2008 was incredibly educational, and being able to experience that firsthand in an environment like that is a visceral experience and imprints certain things in your mind, especially regarding risk management, that I will never forget. And if you’re in a situation where your computer is doing all that for you, I’m curious to know how much of that visceral experience gets translated to you. I don’t want to go out there and say automation is removing all of those good parts from the market-making or trading community because it isn’t. But it’s a delicate balance people need to navigate intentionally and thoughtfully.
You end up moving out of the pits upstairs. What did you do while you were in London?
I had two instances of pit trading at the beginning and very end. In between was London for me. London was a marketplace where pit trading only existed if you traded metals.

By the time I had moved to London, I went over there for a company called DRW. The pit trading of options had migrated to an upstairs model or a phone around marketplace that sat side by side with an incredibly robust and one-of-a-kind electronic presence. It was early on for the electronic markets, but they were developed in places like Amsterdam for an extended period.
I traded Schatz, Bobl, and Bund options: the German twos, fives, and tens. So, German bond options. It’s the long end of Europe’s interest rate curve, which is actively traded. Then, the other side of the desk traded a short-term trade: your IBOR, short Serling, and some other pieces of the shorter part of the duration curve in the interest rates in Europe. And then, we had what we would call a relative value book, which was finding opportunities where we felt like things were mispriced relative to something else, and so we would have mid-curve options in the IBOR versus Bobl options that were on the five-year. So, it’s a mixture of duration, and then you’re trading vol against each other doing all that complicated stuff. It’s fascinating, but it’s also tough to explain. And it’s also tough to model many times.
So my pit trading was at the beginning at the Cboe, and then I went to London and traded Bund, Bobl, and Schatz on the phone and, in the call around market and on the screen. Then, when I came back to the United States, I started and ran an index options market-making business on the floor of the Cboe with three other partners. We ran that for about a decade, up until 2016 or so.
The interesting part about London is that it requires you to be very dynamic and malleable in how you are if you’re coming from a pit environment and you’re walking into a phone around market. There’s a learning curve there. You have to be able to interact with people on the phone and then hedge things on the screen simultaneously. Parts of that were challenging to pick up initially, but once you get the hang of it, it’s a dynamic and exciting place to trade. I worked hard for 15- and 16-hour days. Your schedule then was extensive. The Bund, Bobl, and Schatz options were open at 6:30 or so in the morning and closed at 6 p.m. It was aggressive, and then we did a bunch of entertaining brokers and things of that nature. So, I worked 24 hours a day and burned out quickly. But it was an incredible learning experience, and much of my success after that was primarily due to all the things I learned while in that environment. Pit trading was at the bookends of my career screen trading.
What was the interest in getting into index options around 2006?
We had no grand vision other than having a decent amount of collective experience in that marketplace. I had never traded index options in the pit then. All of my pit trading had been equity options at first, but the other partners in that firm were all index traders. Some started in the equities but then quickly moved to index options. So, we were leveraging a lot of experience there. The other exciting thing about the index pits, especially on the Cboe at the time, was that they were massive. So you had 300 people in these pits. In a pit where you have that many people, the spot where you trade or stand – the actual physical spot – is precious. And your proximity to a broker – hopefully, a very good broker – is even more valuable. So, some parts of the pit are valuable.
Additionally, in a large pit, identical items can be traded simultaneously at different prices in different parts of the pit. So you need what is called pit coverage. You need to be able to be involved in all of the places because things trade at different prices in different parts of the pit. Part of the natural, physical arbitrage in a pit of that size is just the fact that a call spread traded for $3.50 in one place, and it just traded for $3.25 in another, right? That part is interesting. Another part is modeling the volatility surface, which is more interesting. But the physical part of it can’t be underestimated. That part is essential as well. And so the people I partnered with had experience and spots. Some people had spots in the pit, which is a big deal when starting because it gives you a head start. You don’t have to break into every one of these spots to create a viable business model.

Are pits still relevant today?
Absolutely. I think the industry broadly has been sounding the death knell of the pit for 25 years, and it’s not dead yet. You can only write a headline about how pit trading is dying so many times before you’re like, maybe it will never die.
You’ll see that you can find this sweet spot in that hybrid environment where one bolsters the other. They’re puzzle pieces that fit into each other in environments where things are exceptionally volatile. Screens sometimes need help to keep up with the size that needs to be executed at a price. Sometimes, that’s hard in a volatile environment.
People with long-term experience in volatile environments tell stories like, “I went to execute 25,000 call spreads on the screen, and I got 175 done.” That’s the horror story of the screen trade.
In a volatile environment, you might be able to walk into a pit with 100 people in it and say, “Hey, I need a size market on this thing; where can I get size done?” If I’m a market maker and I have a trade worth $5.00 and you tell me you need to sell 200 of it, I might buy it for $4.90 or $4.95. If you tell me you will sell 25,000 of it, I will just say, “All right, listen, you’re doing a massive amount of size. This incurs a significant amount of, like, carry risk for me. And just like strike risk and all kinds of other risks, liquidity risks. You want 25,000 of them done. You have to sell it for $4.50.”
Everyone in that pit trading environment may add, “Yeah, I’ll do 5,000 for $4.50” or “I’ll do 5,000 for five, right?”
Suddenly, you can get 50,000 contracts executed at $4.50, whereas, in another liquidity environment, like a screen, it’s tough to have that conversation with an algorithm. So, I’m not pooh-poohing one side or the other. There are benefits in a pit trading environment that you don’t have in a screen trading environment.
The other side is that the screen trading environment often does things better than the pit. It’s a puzzle-piece environment, and it can be exceptionally robust when you find the proper connection between the two. They can feed liquidity onto each other, which you see in environments like the Cboe, where weekly or daily index options are almost exclusively traded electronically. The reason is that they move so fast that a pit broker cannot keep up with quoting them how they need to be quoted. That is something that can only happen with an algorithm and a computer. And so that’s another side of this. That’s one thing the screen does well. These algorithms do exceptionally well. There are benefits for each one.

Who is on the other side, and does size change that? Additionally, are they the same persons warehousing the risk?
Let’s say you, and I are trading in the pit, and you are a broker, and you come in, and you say, “I have 500 of these to sell,” and I give you a price, and you decide to sell them all with me and say, “I’ll sell you 500, and then you walk out.”
In an old-school environment, I would say, “What’s your house?” or “What’s your give-up?” I would signal [a tent over my head].
What that means is what clearing firm are you giving up to me so that I can tell my clearing firm we need to meet that clearing firm and tell them, “Hey, we bought 500 of these for $2.50, and they sold us 500 at $2.50.”
Let’s say you give up 005, which was Goldman back in the day, and it might still be. I would write down your acronyms, 005, and that I paid $2.50 for 500 of them. You would do the same on your side, except you write down MKC 690.
That way, you know who’s on the other side. You can see the house. You can see where the clearing firm is coming from. That kind of vocabulary, or the same way those are designated, also exists electronically. Digging into the electronic record lets you see the house you’re trading with. However, the electronic trade has a much more anonymous presence. We’re not sitting face to face, and I’m not trading with you. I’m trading on the screen, and it just so happens that I traded $2.50 and I bought 500 of them, but 15 other people bought 500 of them also, and so you don’t have the same face-to-face interaction, but you still have the same amount of information about it, which is I paid $2.50 for it, and someone from 690 sold or someone from 005 sold.
As things become more and more electronic, they will become more anonymous because, in many ways, it doesn’t matter. You can’t keep track. If you’re trading 100,000, 200,000, or 400,000 contracts a day, keeping a mental note of who you’re trading with and what their house is is tough. However, generally speaking, the people on the opposite side of your trades as retail investors, if you’re selling five, ten, or 15 of them, will be the people just making markets in the regular scope of market making. That will be the case for most large market-making firms, constantly putting out tight prices and creating liquidity. If you are a much larger player and you’re doing something like selling 50,000 call spreads, it creates an event that people take notice of. You’ll see big prints hit the tape and then be disseminated by people like prime brokers and brokerage firms.
Part of what they’re doing is saying, “Hey, this hedge fund sold 50,000 call spreads through Goldman. Look at this trade. Do you want to sell it, too? You’ve got a bunch of money in your account.”
They’re utilizing the prints to create more volume for themselves. They get paid on volume. When the size of those prints increases, it doesn’t necessarily change the players involved. It changes the size in which they participate. It’s generally the same people involved in it, but it creates a situation in which people will take a little more notice of what happened.
Five 0 DTE call spreads expiring at the end of the day don’t hit the tape. 50,000 call spreads in DEC that trade in the SPX or the Bund, Bobl, Schatz, or whatever create an event where people will be like, “Oh, what happened there, and at what price did it trade? Where were futures when they traded? What is the vol level that this creates?”
You have a situation wherein someone is short a bunch of vol from a point, and people start to do all kinds of things with large prints because they like to keep track of big players who have positions that might unwind.
Why would you keep track of that?
If someone came in and sold 50,000 call spreads, they might need to go in and repurchase them at some point. And if you can be the person who bought the last 500 lot of the 50,000 lot and then be the person who is the last person on the print on the sell side when they come back to repurchase it, you’re going to be the person who probably makes the most amount of money for the commensurate amount of risk that you took. So that’s the puzzle that everyone’s trying to put together.
You get a little information about who’s trading, but you’ll never know the exact person you’re trading with. As things become more electronic, they will become more anonymous.

What do you get in exchange for taking on the other side of trades?
If you’re a market maker, you have theoretical values for every option on the board. Your model is telling you this option’s worth $4.00, or this option’s worth $1.50, or whatever. You have created an edge if you can buy that option with a theoretical value of $4.00 for $3.90. You have $0.10 of edge to buy however many you purchase.
Generally speaking, if you do the math, $0.10 of edge maybe $1,000 in an SPX product. That’s the edge relative to your theoretical value. Here’s the hard part: when you pay $3.90 for something worth $4.00, especially now, you immediately move your theoretical value to $3.90 because you just paid $3.90, hoping the next person who comes in sells it at $3.80. You get to buy more for a lower price, or in the perfect world, they pay $4.00; you bought it for $3.90 and sold it for $4.00. That’s the ultimate. But that essentially never happens anymore. It used to be in 1999 all the time.
So, you’re paying $3.90, moving your theoretical value to $3.90, and then constantly moving things around to capture the bid-ask spread. Suppose you’re continually buying on the bid and selling on the offer. If the spread is a dime, and you manage your risk correctly, you will make a dime as many times as you trade.
What you’re doing is providing liquidity, a.k.a. prices, into the marketplace in exchange for theoretically harvesting the bid-ask spread on any number of millions of options that trade. It’s more complicated than it sounds because it’s an incredibly complex ecosystem. The landscape is much more complicated than ever, and people are constantly hedging things in different and innovative ways.
Whereas when we used to trade Xilinx, that semiconductor company I traded in 1999, we wouldn’t even trade monthly options against each other. It was just because people were so simplistically putting on bets. “I want to buy the DEC 100 calls,” and we would sell you the DEC 100 calls. People weren’t coming in and saying, “How’s the DEC 100/120/140 call fly versus the JAN 90/110/130 call fly?” That never happened. Right now, not only does that happen because people are rolling positions and doing all this stuff, but it also occurs electronically via a broker. That didn’t happen then. The landscape has changed, but the actual market-making process hasn’t changed. It is the margins that have changed.
Remember, if you’re buying, you’re paying the offer. If you’re selling, you’re selling the bid. I buy the bid and sell the offer if I’m the market maker. That’s where my edge comes in as a market maker. But think about this if you’re a market maker: if the bid-ask spread continues to narrow, which it has over the last 20 years, which is good for the retail investor, that means that there is margin compression happening on the market-making side is getting more and more and more aggressive. You must be more aggressive and competitive to participate in the marketplace. No one is writing sad songs for market makers. They’re doing just fine. They always have been, and they always will be. But it’s important to understand that when you see margin compression like that, it’s a force that has knock-on effects on profitability for people trading the options as market makers.

What’s your role at the OCC, and how did you join them?
I joined OCC almost three years ago now. I never really thought I would have a career in education, but when I look back on it, I was always positioned that way without knowing it. And so this is a very natural outgrowth of my career thus far.
My title says that I’m the Principal of Investor Education at OCC, meaning I work for the Options Industry Council (OIC), a non-profit educational arm inside the OCC. All we do is provide educational resources about options to the broader public. We do this as a free service because OCC fully funds us. The OCC is the Options Clearing Corporation. Anytime you’re trading an option in the United States in an index or equity, it’s going through the hands of OCC in some sort of centrally cleared and settled option marketplace. For that, the OCC charges a variable rate. I think it’s $0.02. And that pays for all the operational expenses in an organization of that size where we’re now clearing over 12 billion contracts a year. You can do the math there and know that the operational expenses and the operational budget are significant, but so are the responsibility and the amount of risk management that has to occur to maintain a smooth and functioning marketplace that doesn’t have a bunch of hiccups in it.
The OCC is the foundation for secure markets in the United States.
My job is to educate people about the risks and benefits of exchange-traded options. I do that through many different methods, including things like this. I go out, and I do interviews and YouTube videos. I appear in places and speak publicly about who I am, where I’ve come from, and how I’m leveraging that expertise to get the message out about how options work more broadly. My job is to teach people how options work. It helps to lean on my experience as an options market maker to tell people stories about how things work and what can go wrong.
The idea behind what we do is that we teach about the risks and the benefits of exchange-traded options. I’ve experienced both of those many times, right? And I can tell you many stories about how those things work. Sometimes those stories effectively get the point across to say to someone, listen, “This is how puts generally work, but sometimes you have to be on the lookout for a situation in which this happens,” right? “This should be on your risk radar as a potential outcome for a strategy like this. I can’t guarantee how it will play out, but let me tell you a story,” right? “Let me tell you one example of how I was in a situation where this happened, and this is how I dealt with it, or this is one of those situations where I got my teeth kicked in. I’m not saying this is exactly how it will play out, but it’s a potential way it plays out. Or, the other way is that things might go exactly as you expected.”
Eventually, my job is to figure out the best way to give people that moment where the pieces click and they understand how optionality works. You know, at the beginning of this conversation, you and I talked about how you were reading these incredibly complex books, and that’s amazing. Still, I would also say when you’re first learning how options work, sometimes the best way to learn how they work is to trade them in a paper account and get smoked a couple of times on paper without actually using capital because you’re never going to learn.
The lessons I’ve learned best are where I’ve lost the most money. And so, everyone has a different aha moment where they’re looking at all this option stuff and saying, “Okay. Calls are supposed to go up when stocks go up, and puts are supposed to go down. And I kind of get that. But why is this one not going up?” And often, people have difficulty understanding because options are so variable. There are so many strikes and different strategies. My job is to try to distill all that information into digestible pieces of transmittable information and say, “This is how these things generally work. Take this knowledge and then build on it.” So that’s what we do at the Options Industry Council. We do that from our website, optionseducation.org, and host an entire educational resource suite. They are broad and exceptionally robust. It’s a fantastic resource and free.
I spent all that time reading, but it only clicked once I started doing it. One thing that helped was taking a small amount of capital and testing trades in real time. It was incredibly informative, and I would like to know if that resonates.
That resonates. It’s something that I think is a vital part of the learning curve, and when people ask me whether or not they should start by paper trading, my response is always, “Well, it can’t hurt. Why not try it without risking actual capital first?” And if you can find the ability to do that at your brokerage or your clearing firm or whatever, it’s a fantastic way to dip your toe in the water and figure out if optionality is for you. Maybe it is not. It’s incredibly variable.
As an options educator, I can help people understand that some aspects of optionality are for everyone in some way, shape, or form. But maybe it’s not how your dentist told you they bought call spreads. Perhaps that’s not for you.
When he started, I had a friend who took 80% of his capital and traded it the way he thought it should be, and then 20% of his capital was put on the same trades in the opposite direction. He said the amazing part was to look at the P&L of those two accounts next to each other and that the combination of those two numbers was instructive as to why things were happening the way they were. Often, when you have something on and it loses money, it’s hard to figure out why it lost money. Like, “The stock did exactly what I thought it would do. Why did the option part of this lose money?” And his thought was, I’ll be able to figure it out a lot easier if I have it on the opposite way over here, and I can just go look at it and be like, “Oh, this part made money, and this part lost.” The combination of both helped him. I’m not advocating that strategy, but thinking about it that way is interesting, especially when you’re starting and learning how options work.
The options markets have grown tremendously, with shorter-dated options receiving much of that interest. Is that risky?
When discussing options, I tell almost everyone this, especially when they ask whether 0 DTE options are for them: the optionality itself is the most essential part to understand. Once you know the optionality and have that kind of aha moment, it becomes easier to say the optionality reacts to time this way and extrapolate it out in time, then extrapolate it in time toward expiration and away from expiration. An option should take on the qualities of a Vega-rich option as you add duration to it. Another should take on the qualities of a more Gamma-rich option as you take time out of it and move it closer to expiration. If you understand the actual inherent optionality that exists there, you’re going to be so much better prepared to be able to make decisions that are based on an exact understanding of the inherent optionality, which is really what you need if you’re going to be using options like that.
The one thing that I will say about 0 DTE options, and the move towards shorter-dated options in general, is that there’s a lot of financial journalism focused on what we would call systemic risk that might be part of that rotation into shorter-duration options. My response is that every option that has ever existed has, at one point in its lifetime, been a 0 DTE option on the day it expires. This is not a new concept. This is not something that someone cooked up in a lab. This is a change in the actual cadence of expirations. And, if you look at a lot of the stuff that I put out on LinkedIn, especially about 0 DTE options, it’s taken 15 years to get to the point where we have an expiration that happens every day. And the Cboe did it in chunks.
It’s not a new risk. It’s a different cadence of risk. That’s an important distinction.
The more you understand the basics of optionality, the better you’ll understand the shorter-dated and longer-dated options. Sometimes, shorter-dated options can’t do what you want them to. You can’t get real Vega in a shorter-dated option. An option with two days left has less Vega; it will not respond to implied volatility changes as well as an option with 200 or 100 days.
If you’re looking for exposure to implied volatility moves, you can’t get that in a two-day option.
Duration is a spectrum; like anything else, it involves a mixture of risk and benefit. But to understand both sides, you must understand the basics of optionality.
The Cboe adds that much of this short-dated exposure is balanced. It’s just a one-day exposure, and it can’t be anything more because it just rolls off at the end of the day.
There’s that part of it, too.

Since we’re running out of time, I’ll end with your best or worst trade. What was it, and what did it teach you?
The worst was an exceptionally high variance trade that risked about 80 to 90% of the firm’s capital and was put on at an unusually illiquid time during the cycle. We carried it over Christmas when everyone is wherever they are; when you remove players from the marketplace, things can be weird because fewer people are on cash arb desks to keep things in line, like indexes with cash components and actual stock components. If you take all the people out of that trade that usually would trade it and keep it in line, that thing can do really weird things and print in very strange directions.
From that, I learned risk management has many different elements.
You need to keep many other things on your radar, and liquidity is one of them, right? Volatility is another one. Cash management is a massive part of it, too. How much of my account have I invested in this one trade? Am I too concentrated on something that might be exceptionally volatile? That’s an essential part of risk management as well.
Disclaimer
By viewing our content, you agree to be bound by the terms and conditions outlined in this disclaimer. Consume our content only if you agree to the terms and conditions below.
Physik Invest is not registered with the US Securities and Exchange Commission or any other securities regulatory authority. Our content is for informational purposes only and should not be considered investment advice or a recommendation to buy or sell any security or other investment. The information provided is not tailored to your financial situation or investment objectives.
We do not guarantee any information’s accuracy, completeness, or timeliness. Please do not rely solely on our content to make investment decisions or undertake any investment strategy. Trading is risky, and investors can lose all or more than their initial investment. Hypothetical performance results have limitations and may not reflect actual trading results. Other factors related to the markets and specific trading programs can adversely affect actual trading results. We recommend seeking independent financial advice from a licensed professional before making investment decisions.
We don’t make any claims, representations, or warranties about the accuracy, completeness, timeliness, or reliability of any information we provide. We are not liable for any loss or damage caused by reliance on any information we provide. We are not liable for direct, indirect, incidental, consequential, or damages from the information provided. We do not have a professional relationship with you and are not your financial advisor. We do not provide personalized investment advice.
Our content is provided without warranties, is the property of our company, and is protected by copyright and other intellectual property laws. You may not be able to reproduce, distribute, or use any content provided through our services without our prior written consent. Please email renato@physikinvest for consent.
We reserve the right to modify these terms and conditions at any time. Following any such modification, your continued consumption of our content means you accept the modified terms. This disclaimer is governed by the laws of the jurisdiction in which our company is located.