Categories
Commentary

Daily Brief For March 23, 2023

Physik Invest’s Daily Brief is read free by thousands of subscribers. Join this community to learn about the fundamental and technical drivers of markets.

Graphic updated TIME AM ET. Sentiment Neutral if expected /MES open is inside of the prior day’s range. Sentiment Risk-On if expected /MES open is above the prior day’s range. Sentiment Risk-Off if expected /MES open is below the prior day’s range. /MES levels are derived from the profile graphic at the bottom of this letter. Click here for the latest levels. SqueezeMetrics Dark Pool Index (DIX) and Gamma (GEX) with the latter calculated based on where the prior day’s reading falls with respect to the MAX and MIN of all occurrences available. A higher DIX is bullish. The lower the GEX, the more (expected) volatility. Click to learn the implications of volatility, direction, and moneyness. Breadth reflects a reading of the prior day’s NYSE Advance/Decline indicator. The CBOE VIX Volatility Index (INDEX: VVIX) reflects the attractiveness of owning volatility. UMBS prices via MNDClick here for the economic calendar.

Administrative

A shorter letter today, so there may be some holes we patch later. Take care!

Fundamental

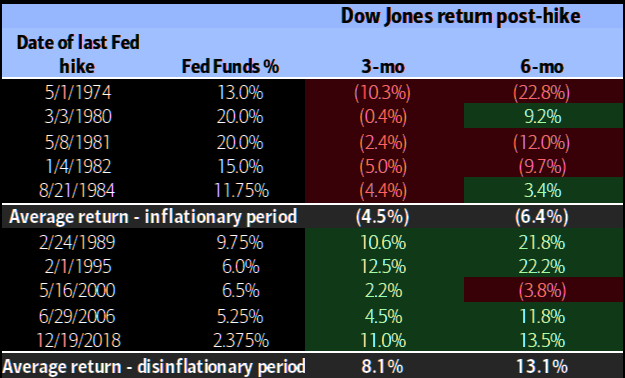
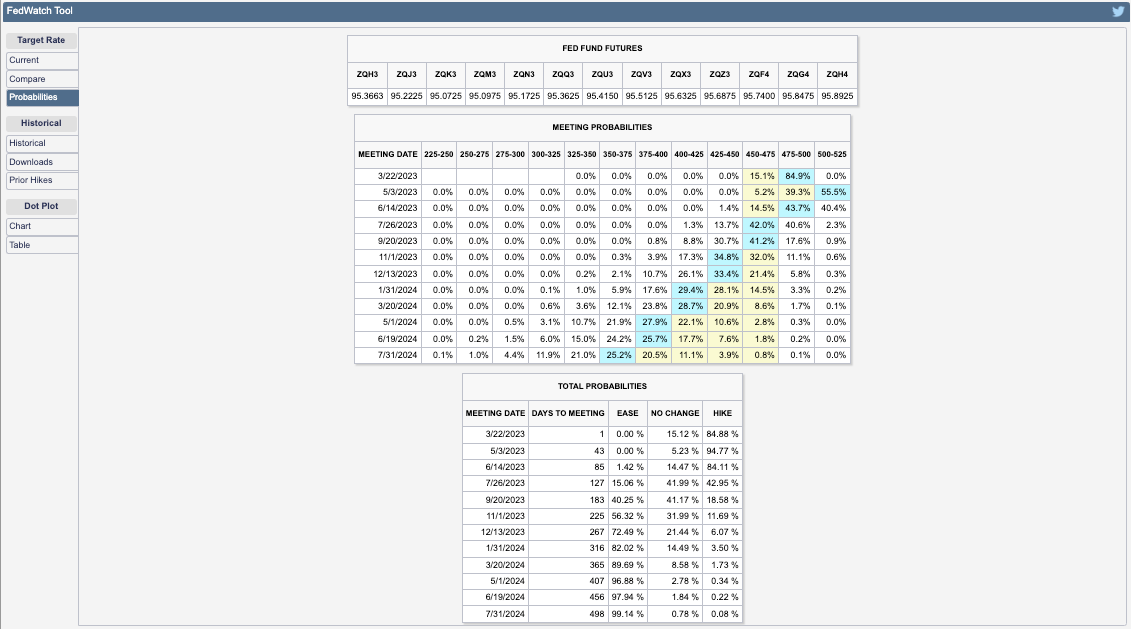
The Federal Reserve (Fed) bumped its target rate up 25 basis points to 4.75-5.00% and opened the door to more hikes, barring market-induced financial tightening, as this letter put forward yesterday morning.

“The events in the banking system over the past two weeks are likely to result in tighter credit conditions for households and businesses, which would, in turn, affect economic outcomes,” Fed chair Jerome Powell commented, adding that credit tightening significantly means monetary policy “may have less work to do.”

Further, before the recent collapses of a few financial institutions, including SVB Financial Group, the market was pricing a 50 basis point hike.

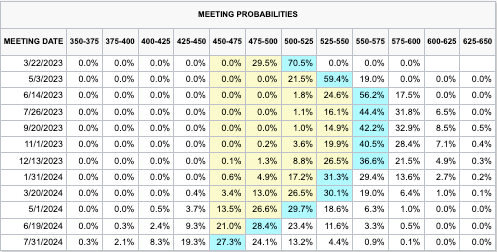
The below CME Group Inc’s (NASDAQ: CME) FedWatch Tool shows the market’s expectations on March 8. Note the 5.50-5.75% terminal (peak) rate.

Graphic: Retrieved from CME Group Inc’s (NASDAQ: CME) FedWatch Tool via The Daily Brief for March 8, 2023.

“Absent SVB, the Fed would have likely raised 50 basis points,” TS Lombard’s Steve Blitz said. “SVB did happen, however, and so this FOMC, ever anxious about facing a recession (rising unemployment), is more than happy to let ‘tighter credit conditions for households and businesses … weigh on economic activity, hiring, and inflation.’ As for financial instability, they believe they have the tools to keep a few poorly managed banks from imploding the whole sector.”

The updated summary of economic projections (SEP) or dot plot shows the FOMC expecting rates to end 2023 above 5.00%.

Graphic: Retrieved from Bloomberg.

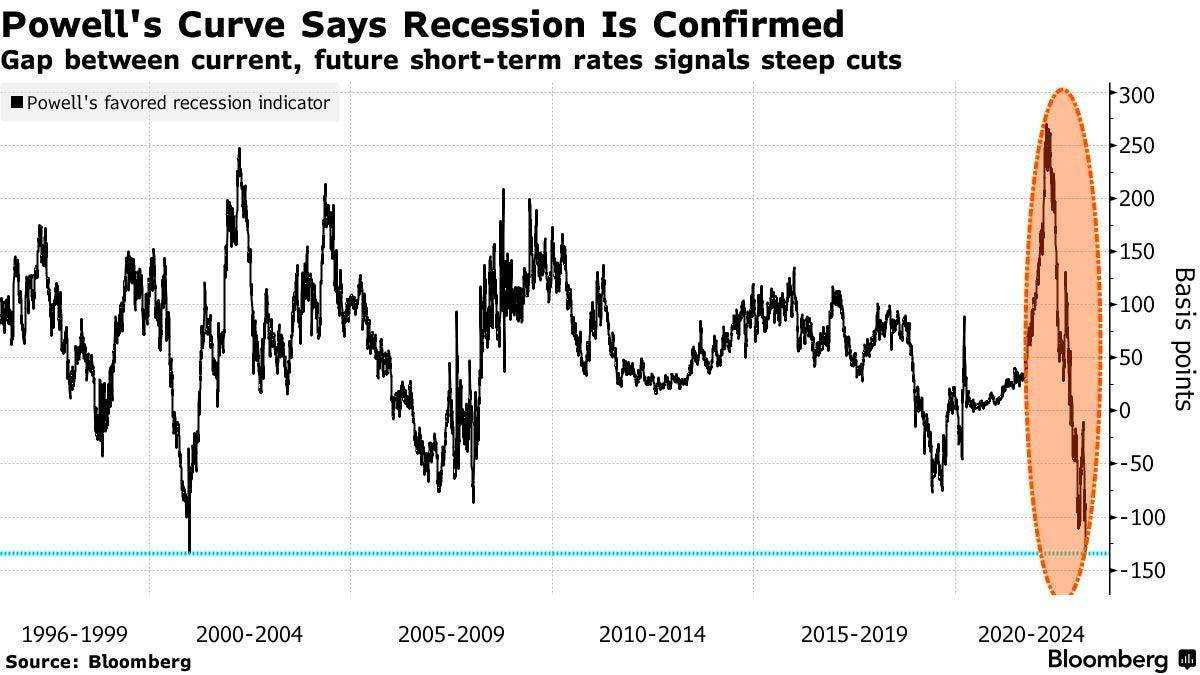
This is far higher than what the markets are pricing. Powell’s go-to measure for spotting economic troubles suggests steep cuts are also coming sooner than later.

Graphic: Retrieved from Bloomberg. “Frankly,  there’s good research by staff in the Federal Reserve system that really says to look at the short — the first 18 months — of the yield curve. That’s really what has 100% of the explanatory power of the yield curve. It makes sense. Because if it’s inverted, that means the Fed’s going to cut, which means the economy is weak.” — Fed Chair Powell on March 21, 2022.

Anyways, given that what was expected happened, markets responded positively. If interested in why that is the case following important events as of late, see the Daily Brief for 2/1 and 2/2

Graphic: Retrieved from Bank of America Corporation (NYSE: BAC) via Bloomberg. “Viewed through the lens of implied volatility — or expectations of how much an underlying asset will swing in the future — zero-day options aren’t particularly cheap in reality. The gap over the S&P 500’s realized volatility, something in derivatives parlance known as volatility risk premium, is typically three times higher than longer-dated contracts, according to BofA.” The compression of “will naturally lead to a buyback” that supports the market, Kai Volatility’s Cem Karsan says.

It was Treasury secretary Janet Yellen who took the market lower. Yellen said she has “not considered or discussed anything having to do with blanket insurance of guarantees of deposits,” and markets did not like that.

Graphic: Retrieved from Bloomberg.

The likes of Pershing Square’s Bill Ackman responded he “would be surprised if deposit outflows don’t accelerate.” Adding, Federated Hermes’ Steve Chiavarone thought it was “astounding” Yellen and Powell would give contradictory messages.

“Powell essentially said that all deposits are safe; Yellen said, ‘Hold my beer.’ You would have thought that they would have coordinated,” responded Federated Hermes’ Steve Chiavarone.

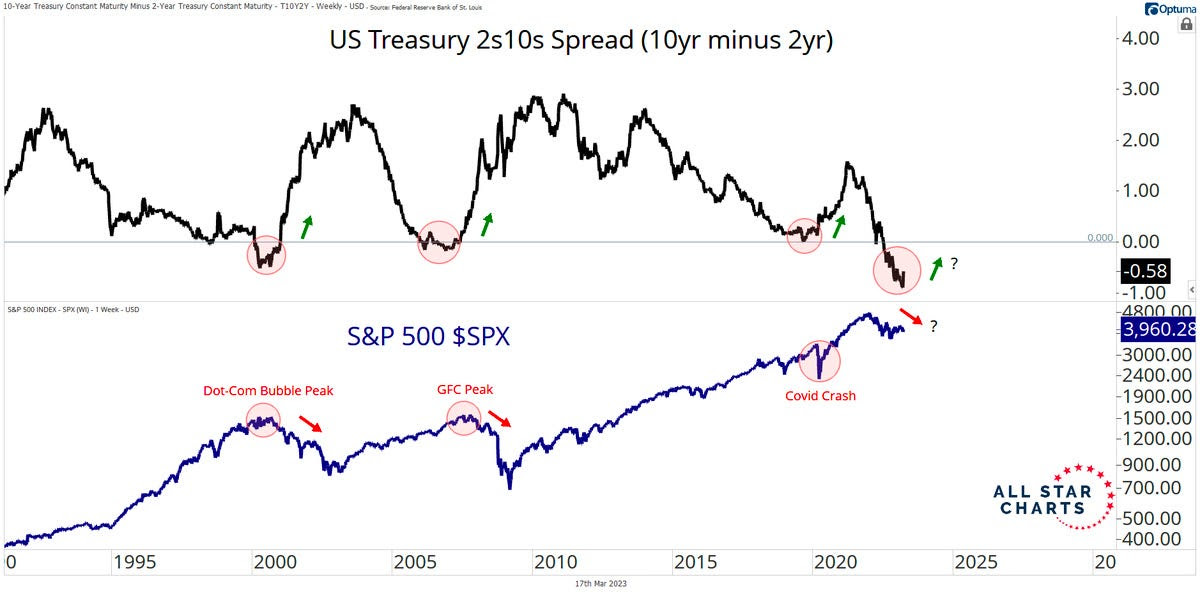
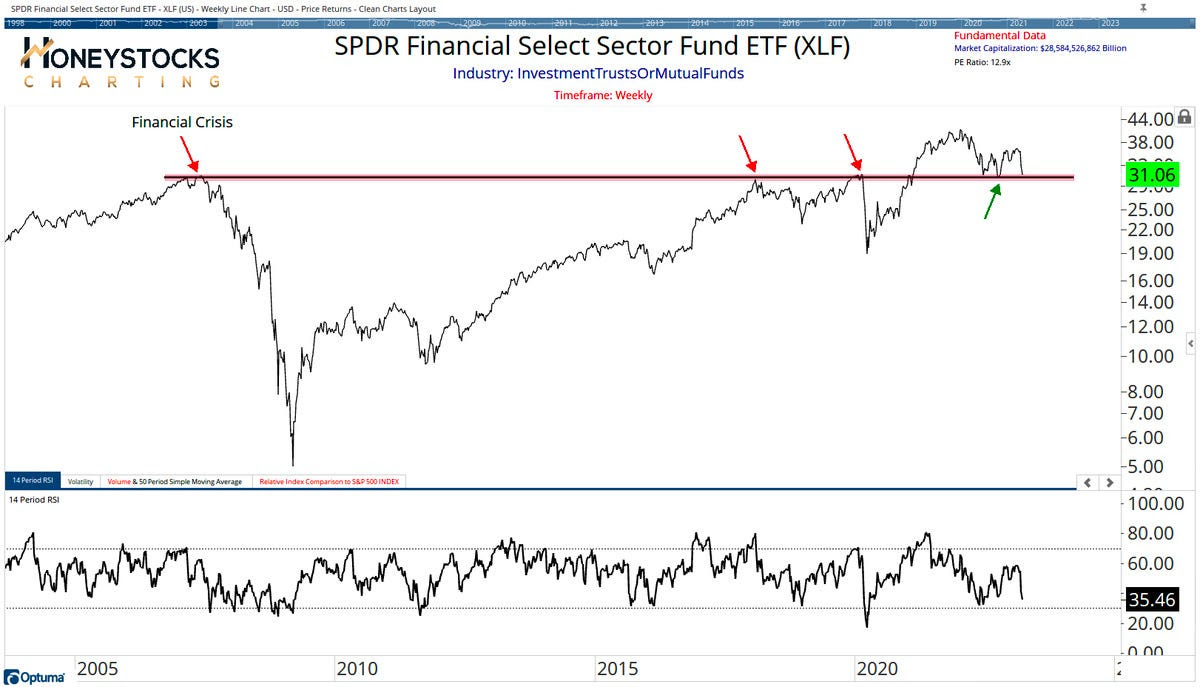
To keep it brief, we’ll end with references to letters for 3/20 and 3/21, noting that the conditions for weak equity markets are present. The S&P 500 forward earnings are declining, the yield curve is inverted, unemployment is below average, manufacturing PMIs are below 50, and 40% of banks are tightening lending, Morgan Stanley (NYSE: MS) strategists explain.

Technical

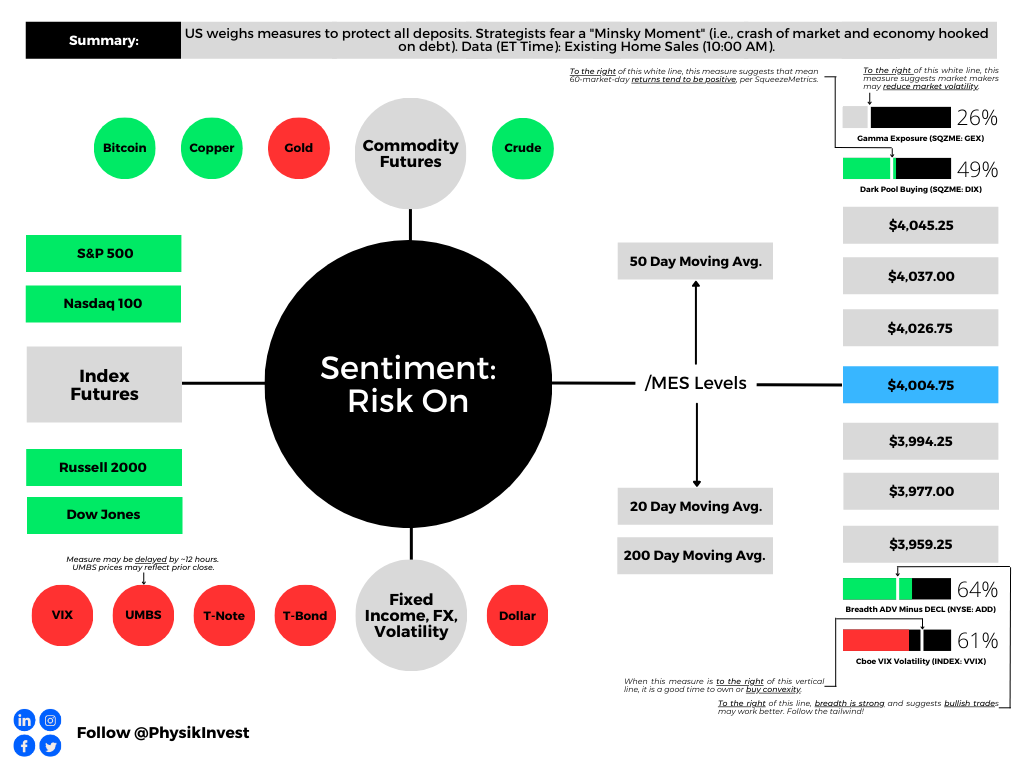
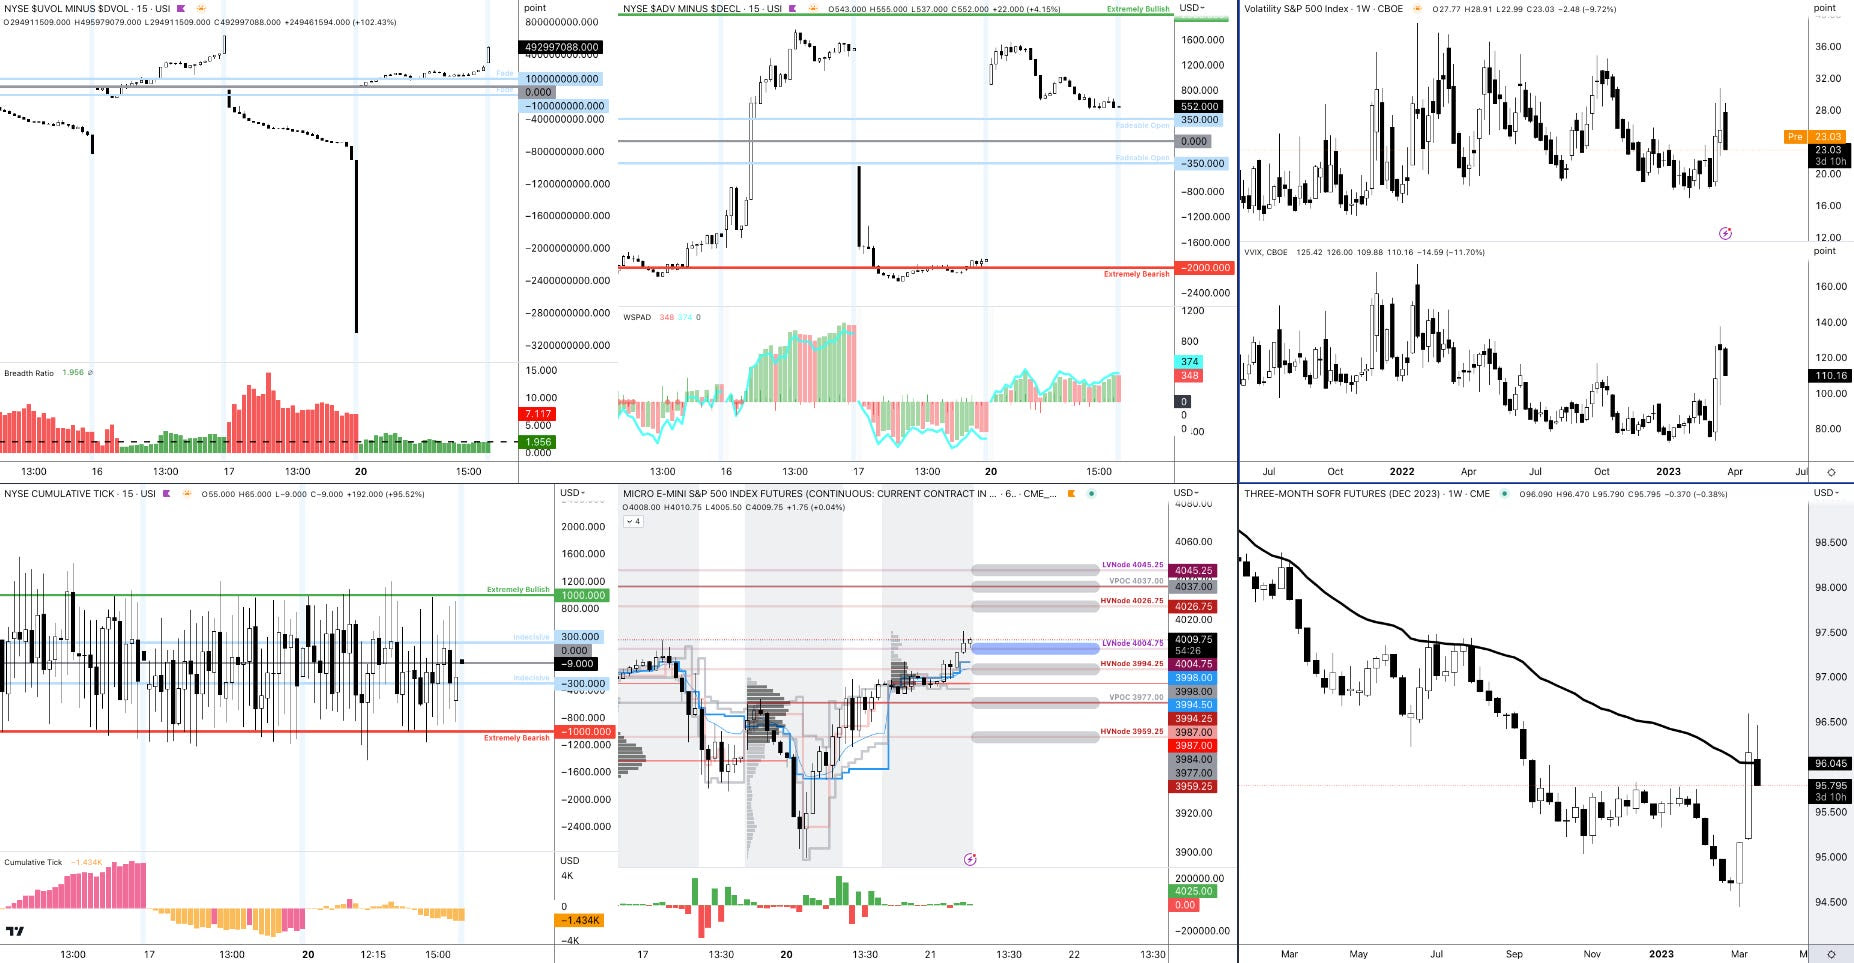
As of 8:55 AM ET, Thursday’s regular session (9:30 AM – 4:00 PM ET) in the S&P 500 will likely open in the middle part of a positively skewed overnight inventory inside the prior day’s range, suggesting a limited potential for immediate directional opportunity.

The S&P 500 pivot for today is $3,994.25. 

Key levels to the upside include $4,004.25, $4,017.00, and $4,026.75.

Key levels to the downside include $3,977.00, $3,959.25, and $3,946.75.

Disclaimer: Click here to load the updated key levels via the web-based TradingView platform. New links are produced daily. Quoted levels likely hold, barring an exogenous development.

Graphic: 65-minute profile chart of the Micro E-mini S&P 500 Futures.

Definitions

Volume Areas: Markets will build on areas of high-volume (HVNodes). Should the market trend for some time, this will be identified by a low-volume area (LVNodes). The LVNodes denote directional conviction and ought to offer support on any test.

If participants auction and find acceptance in an area of a prior LVNode, then future discovery ought to be volatile and quick as participants look to the nearest HVNodes for more favorable entry or exit.

POCs: Areas where two-sided trade was most prevalent in a prior day session. Participants will respond to future value tests as they offer favorable entry and exit.


About

The author, Renato Leonard Capelj, spends the bulk of his time at Physik Invest, an entity through which he invests and publishes free daily analyses to thousands of subscribers. The analyses offer him and his subscribers a way to stay on the right side of the market. 

Separately, Capelj is an accredited journalist with past works including interviews with investor Kevin O’Leary, ARK Invest’s Catherine Wood, FTX’s Sam Bankman-Fried, North Dakota Governor Doug Burgum, Lithuania’s Minister of Economy and Innovation Aušrinė Armonaitė, former Cisco chairman and CEO John Chambers, and persons at the Clinton Global Initiative.

Connect

Direct queries to renato@physikinvest.com. Find Physik Invest on TwitterLinkedInFacebook, and Instagram. Find Capelj on TwitterLinkedIn, and Instagram. Only follow the verified profiles.

Calendar

You may view this letter’s content calendar at this link.

Disclaimer

Do not construe this newsletter as advice. All content is for informational purposes. Capelj and Physik Invest manage their own capital and will not solicit others for it.

Categories
Commentary

Daily Brief For March 21, 2023

Physik Invest’s Daily Brief is read free by thousands of subscribers. Join this community to learn about the fundamental and technical drivers of markets.

Graphic updated 7:00 AM ET. Sentiment Risk-On if expected /MES open is above the prior day’s range. /MES levels are derived from the profile graphic at the bottom of this letter. Click here for the latest levels. SqueezeMetrics Dark Pool Index (DIX) and Gamma (GEX) with the latter calculated based on where the prior day’s reading falls with respect to the MAX and MIN of all occurrences available. A higher DIX is bullish. The lower the GEX, the more (expected) volatility. Click to learn the implications of volatility, direction, and moneyness. Breadth reflects a reading of the prior day’s NYSE Advance/Decline indicator. The CBOE VIX Volatility Index (INDEX: VVIX) reflects the attractiveness of owning volatility. UMBS prices via MNDClick here for the economic calendar.

Administrative

Not all doom and gloom. Make sure to read to the end!

Fundamental

In the Daily Brief for 3/20, we summarized the financial industry and policymaker responses that would turn asset fire sales into managed, orderly asset sales. 

Graphic: Retrieved from Sergei Perfiliev.

The net result of the intervention would be a reduction in credit creation, a tightening of financial conditions, as well as a slowing of the economy and inflation while, potentially, setting “a dangerous precedent that simply encourage[s] future irresponsible behavior” (e.g., risky lending/borrowing), the House Freedom Caucus put eloquently. Basically, the fear is in policymakers underwriting the losses of prevailing carry-type strategies and setting the stage for an even bigger unwind or so-called “Minsky moment,” the “sudden crash of markets and economies that are hooked on debt,” Bloomberg reports

The likes of Elon Musk express fear, too!

A systemic credit event is among strategists’ biggest fear, indeed. A Bank of America Corporation (NYSE: BAC) survey shows a credit event happening on the heels of a US shadow banking, corporate debt, and developed-market real-estate collapse. Recall this letter writer’s conversation with Simplify Asset Management’s Michael Green who said he sees “cracks in bubbles like commercial real estate” already appearing, too.

Bloomberg adds that JPMorgan Chase & Co (NYSE: JPM) strategists think the inverted yield curve signals recession and the stocks are likely nearing their high point.

Graphic: Retrieved from Callum Thomas’ Weekly S&P 500 ChartStorm.

JPM adds that market lows won’t occur until interest rate cuts ensue.

Graphic: Retrieved from BNP Paribas ADR (OTC: BNPQY).

Recall 3/20’s letter citing BAC research that finds selling markets on the last Fed rate hike is a good strategy. The “Minsky moment” comment/fear has others at JPM adding that investors should sell into relief bounces.

Graphic: Retrieved from Bank of American Corporation (NYSE: BAC) via The Market Ear.

Most participants foresee rates continuing to rise by at least 25 basis points, per the CME Group Inc’s (NASDAQ: CME) FedWatch Tool. Following Wednesday’s (expected) hike, the path forward appears uncertain. Yesterday, the terminal/peak rate was at 4.75-5.00%. Today, the peak has shifted higher to 5.00-5.25%.

Graphic: Retrieved from CME Group Inc (NASDAQ: CME).

Financials look ready to fall off a cliff, to add. If they do, the whole market likely goes.

Graphic: Retrieved from Callum Thomas’ Weekly S&P 500 ChartStorm.

Positioning

We keep referring back to our Daily Briefs published last week (e.g., 3/13 and 3/14). In those letters, we talked about the growing concern about markets enduring some exogenous shocks. 

We opted to take the less extreme side since policymakers’ response was likely to stem (or push into the future) turmoil. Additionally, with participants easing up on their long-equity exposure, equity markets were likely to stay contained, relative to bond markets where the lack of liquidity is an issue, some believe. Anyways, following important events including inflation updates (i.e., CPI) and derivatives expiries, short bursts of strength (particularly in some of the previously depressed products such as the Nasdaq 100 or NDX, as explained 3/17) were likely to ensue heading into the end of this month and next month. Additionally, certain rates trades via options we set forth on 3/14 were ripe for monetization, too.

Rotating into a money market or T-bill fund or box spreads, while allocating some remaining cash to leverage potential by way of some call options structures, appeared attractive. While the T-bill or box spread exposures did not budge much, call options structures as proposed on 3/14 worked (and are likely to continue to work) rather well. The monetization of the rate structures discussed on 3/14 was timely, also.

The potential for coming events including the Federal Reserve’s (Fed) interest rate decision on Wednesday 3/22 to assuage participants’ fears of slowing may, accordingly, prompt fears of missing out on the upside, Bloomberg reports. A response may be FOMO-type demand for call options exposures, coupled with CTAs further “raising their equity exposure” on trend signals and lower volatility, boosting markets into a “more combustible” state as explained on 2/17. This fear of missing out is visible in options volatility skew; traders are hedging those tail outcomes.

Technical

As of 7:00 AM ET, Tuesday’s regular session (9:30 AM – 4:00 PM ET), in the S&P 500, is likely to open in the upper part of a positively skewed overnight inventory, outside of the prior day’s range, suggesting a potential for immediate directional opportunity.

The S&P 500 pivot for today is $4,004.75. 

Key levels to the upside include $4,026.75, $4,037.00, and $4,045.25.

Key levels to the downside include $3,994.25, $3,977.00, and $3,959.25.

Disclaimer: Click here to load the updated key levels via the web-based TradingView platform. New links are produced daily. Quoted levels likely hold barring an exogenous development.

Graphic: 65-minute profile chart of the Micro E-mini S&P 500 Futures.

Definitions

Volume Areas: Markets will build on areas of high-volume (HVNodes). Should the market trend for a period of time, this will be identified by a low-volume area (LVNodes). The LVNodes denote directional conviction and ought to offer support on any test.

If participants auction and find acceptance in an area of a prior LVNode, then future discovery ought to be volatile and quick as participants look to the nearest HVNodes for more favorable entry or exit.

POCs: Areas where two-sided trade was most prevalent in a prior day session. Participants will respond to future tests of value as they offer favorable entry and exit.

Options Expiration (OPEX): Reduction in dealer Gamma exposure. There may be an increase in volatility after the removal of large options positions and associated hedging.

Volume-Weighted Average Prices (VWAPs): A metric highly regarded by chief investment officers, among other participants, for quality of trade. Additionally, liquidity algorithms are benchmarked and programmed to buy and sell around VWAPs.


About

The author, Renato Leonard Capelj, spends the bulk of his time at Physik Invest, an entity through which he invests and publishes free daily analyses to thousands of subscribers. The analyses offer him and his subscribers a way to stay on the right side of the market. 

Separately, Capelj is an accredited journalist with past works including interviews with investor Kevin O’Leary, ARK Invest’s Catherine Wood, FTX’s Sam Bankman-Fried, North Dakota Governor Doug Burgum, Lithuania’s Minister of Economy and Innovation Aušrinė Armonaitė, former Cisco chairman and CEO John Chambers, and persons at the Clinton Global Initiative.

Connect

Direct queries to renato@physikinvest.com. Find Physik Invest on TwitterLinkedInFacebook, and Instagram. Find Capelj on TwitterLinkedIn, and Instagram. Only follow the verified profiles.

Calendar

You may view this letter’s content calendar at this link.

Disclaimer

Do not construe this newsletter as advice. All content is for informational purposes. Capelj and Physik Invest manage their own capital and will not solicit others for it.