
The Daily Brief is a free glimpse into the prevailing fundamental and technical drivers of U.S. equity market products. Join the 200+ that read this report daily, below!
What Happened
Overnight, equity index futures auctioned lower alongside bonds and most commodities.
Ahead is data on wholesale inventories (10:00 AM ET) and Fed-speak (12:00 PM ET).
What To Expect
Fundamental: Improvements in the U.S. labor market and increased hawkishness from the Federal Reserve are some of the factors playing into a recent rotation.
With yields climbing and the 10-year benchmark breaking out toward 2.00%, there’s been a clear move out of growth- and innovation-names to value- and cyclical-type stocks.
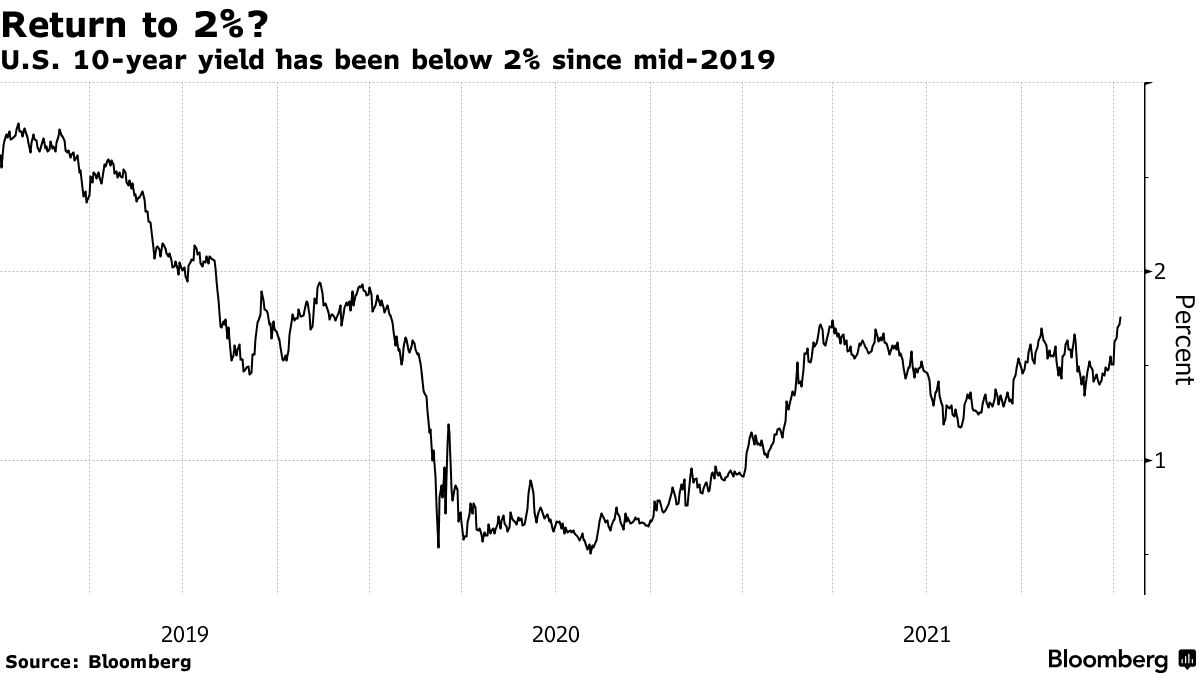
This is just as Goldman Sachs Group Inc (NYSE: GS) announced that it expects four interest rate hikes this year (in MAR, JUN, SEP, and DEC) and a balance sheet runoff to begin in July.
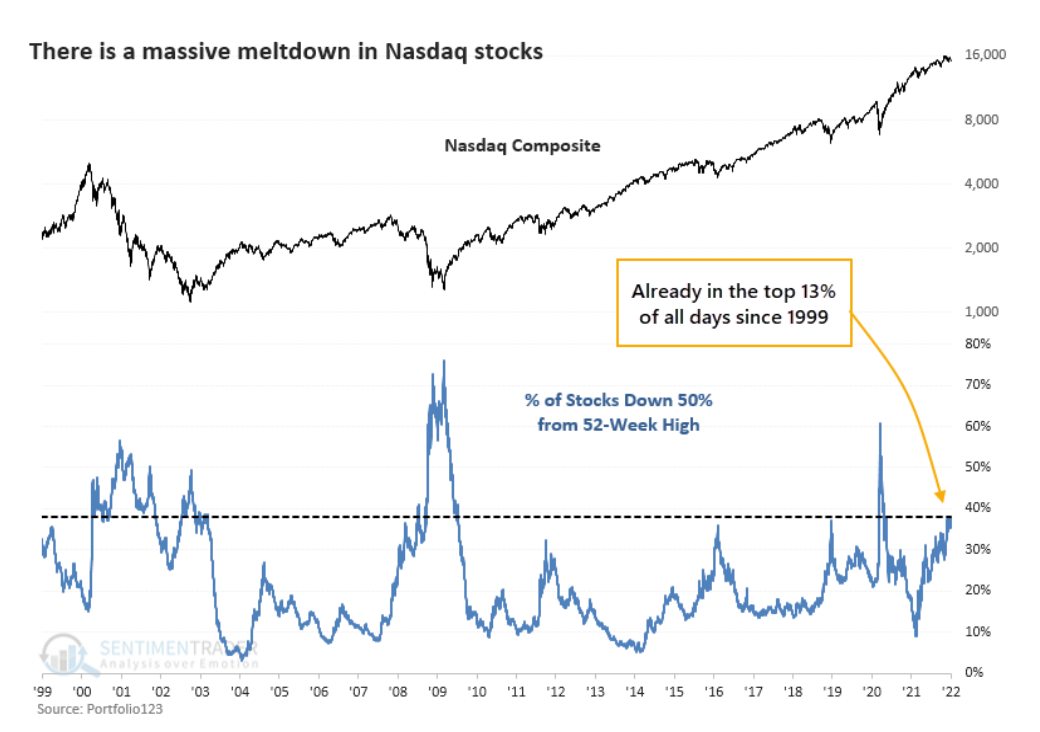
“Valuations are at historical highs, companies are raising billions based on fairy dust, and the Fed is signaling a tightening cycle,” said Jason Goepfert of Sundial Capital Research. “All of these are scaring investors that we’re on the cusp of a repeat of 1999-2000.”
Why are higher rates scary?
Though higher rates are to fend off inflation, they have the potential to decrease the present value of future earnings making stocks (especially high growth) less attractive.
For context, at no other point since the dot-com bubble has so many constituents have fallen while the index was so close to its peak.
Despite participation continuing to narrow, equities should be able to withstand rate hikes and balance sheet runoff amidst above-trend growth and a looming rebound in some international markets, JPMorgan Chase & Co (NYSE: JPM) adds.
“As long as yields are rising for the right reasons, including better growth, we believe that equities should be able to tolerate the move,” a JPMorgan note said.
“The rise in real rates should not be hurting equity markets, or economic activity, at least until they move into positive territory, or even as long as real rates are below the real potential growth.”
Positioning: As discussed in Friday’s detailed write-up, bonds and equities are down.
That’s due in part to the bond-stock relationship being upended as a result of monetary tightening to combat inflation.
“At stake are trillions of dollars that are managed at risk parity funds, balanced mutual funds, and pension funds that follow the framework of 60/40 asset allocation.”
As explained Friday, we mention this (broken) relationship as it forces us (participants, in general) to look elsewhere for protection.
The growing asset class of volatility, so to speak, is that protection. Investors are aware of both the protective and speculative efficiency afforded to them by options and that is the primary reason option volumes are so comparable to stock volumes, now.
If interested, read this primer on “Trading Volatility, Correlation, Term Structure, and Skew.”
With option volumes higher, related hedging flows can represent an increased share of volume in underlying stocks; the correlation of stock moves, versus options activity, is pronounced.
All that means is that we can look to the options market for context on where to next.
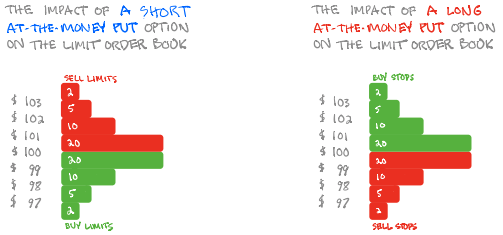
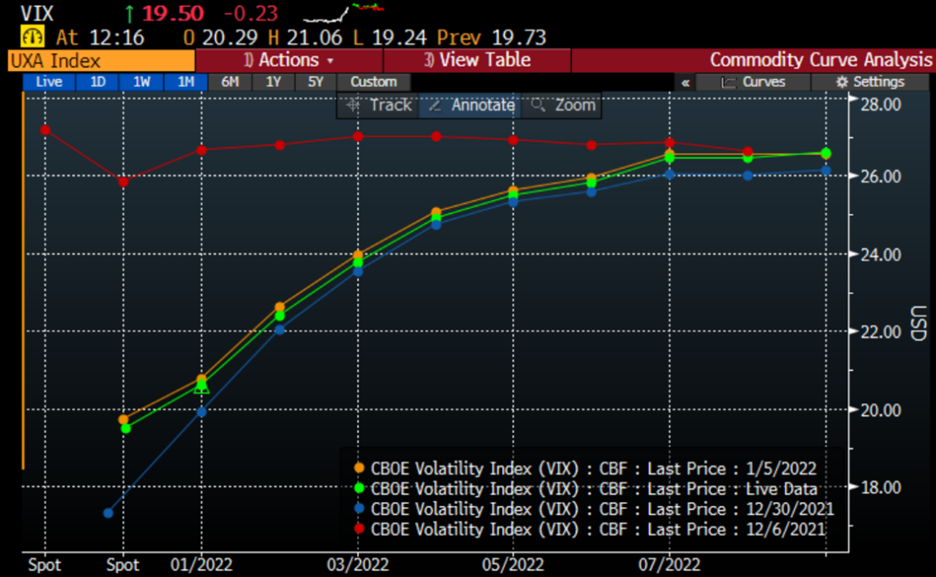
According to options modeling and data service SpotGamma (learn more here), the S&P 500, in particular, based on an earlier demand for protection is set up for higher volatility.
“End-of-week compression in volatility, in spite of a high-volatility, negative-gamma regime characterized by dealer hedging that exacerbates movement, sets markets up for instability in case of even lower prices and demand for protection.”
Why?
Knowing that demand for downside protection coincides with customers indirectly taking liquidity and destabilizing the market as the participant short the put will sell underlying to neutralize risk, participants ought to keep their eye out on whether implied volatility expands or contracts.
All else equal, higher implied volatility marks up options delta (exposure to direction) and this leads to more selling as hedging pressures exacerbate weakness.
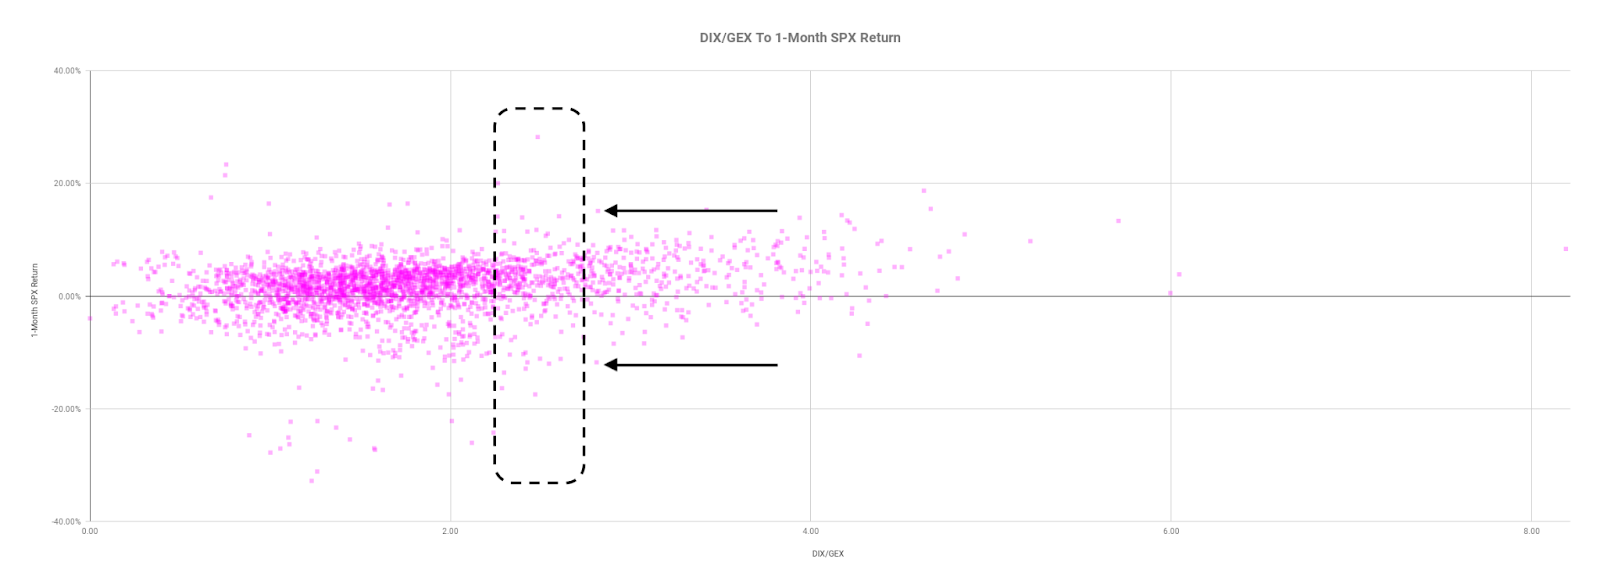
Taking into account options positioning, versus buying pressure (measured via short sales or liquidity provision on the market-making side), positioning metrics remain positively skewed.
In ending this section, Friday’s put-heavy expiration removed some negative gamma that was adding to instability, at least at the index level.
Though markets will tend toward instability so long as volatility is heightened and products (especially some constituents) remain in negative gamma, the dip lower and demand for protection may serve to prime the market for upside (when volatility starts to compress again and counterparties unwind hedges thus supporting any attempt higher).
“Failure to expand the range, lower, on the index level, at least, likely invokes supportive dealer hedging flows with respect to time (‘charm’) and volatility (‘vanna’),” SpotGamma adds.
At present, there’s a push-and-pull; “no-touch” garbage stocks in the S&P and Nasdaq 100 are gaining strength. If this dynamic persists, in light of what was discussed above, what happens?
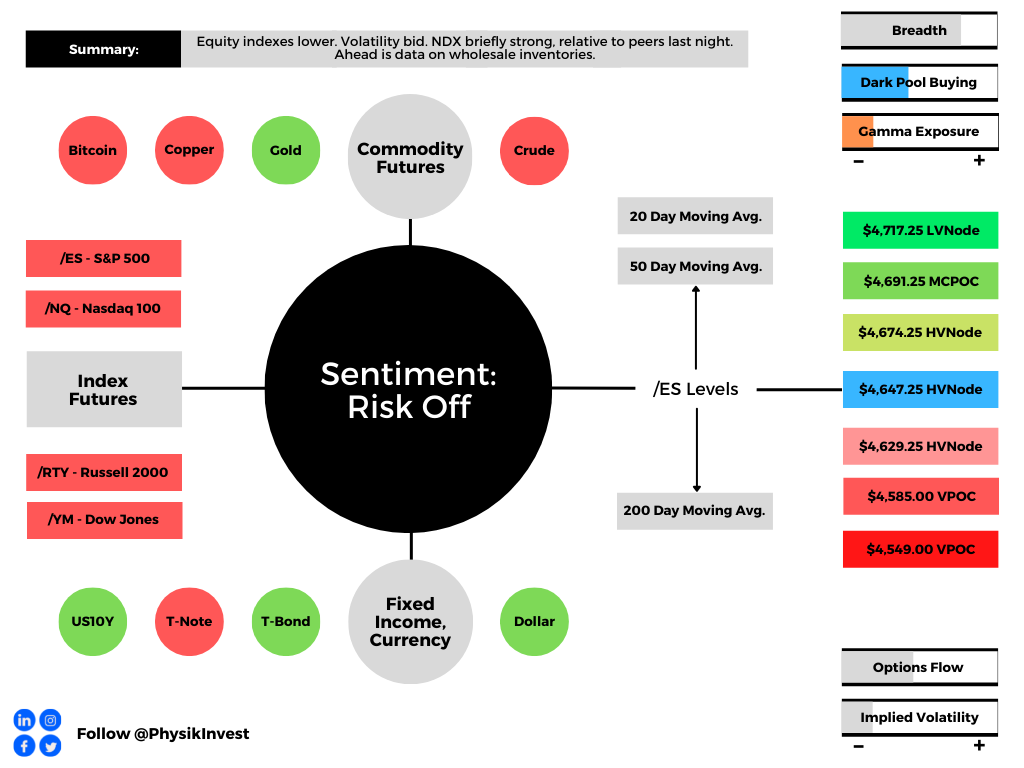
Technical: As of 6:30 AM ET, Monday’s regular session (9:30 AM – 4:00 PM ET), in the S&P 500, will likely open in the lower part of a negatively skewed overnight inventory, just inside of prior-range and -value, suggesting a limited potential for immediate directional opportunity.
Spike Scenario Still In Play: Spike’s mark the beginning of a break from value. Spikes higher (lower) are validated by trade at or above (below) the spike base (i.e., the origin of the spike).

Spike base is at $4,761.25. Above, bullish. Below, bearish.
In the best case, the S&P 500 trades higher; activity above the $4,647.25 high volume area (HVNode) puts in play the $4,674.25 HVNode. Initiative trade beyond the latter could reach as high as the $4,691.25 micro composite point of control (MCPOC) and $4,717.25 low volume area (LVNode).
In the worst case, the S&P 500 trades lower; activity below the $4,647.25 HVNode puts in play the $4,629.25 HVNode. Initiative trade beyond the latter could reach as low as the $4,585.00 and $4,549.00 untested point of control (VPOC), or lower.
Click here to load today’s key levels into the web-based TradingView charting platform. Note that all levels are derived using the 65-minute timeframe. New links are produced, daily.

What People Are Saying
Definitions
Volume Areas: A structurally sound market will build on areas of high volume (HVNodes). Should the market trend for long periods of time, it will lack sound structure, identified as low volume areas (LVNodes). LVNodes denote directional conviction and ought to offer support on any test.
If participants were to auction and find acceptance into areas of prior low volume (LVNodes), then future discovery ought to be volatile and quick as participants look to HVNodes for favorable entry or exit.
DIX: For every buyer is a seller (usually a market maker). Using DIX — which is derived from short sales (i.e., liquidity provision on the market-making side) — we can measure buying pressure.
Gamma: Gamma is the sensitivity of an option to changes in the underlying price. Dealers that take the other side of options trades hedge their exposure to risk by buying and selling the underlying. When dealers are short-gamma, they hedge by buying into strength and selling into weakness. When dealers are long-gamma, they hedge by selling into strength and buying into weakness. The former exacerbates volatility. The latter calms volatility.
Vanna: The rate at which the delta of an option changes with respect to volatility.
Charm: The rate at which the delta of an option changes with respect to time.
Options: If an option buyer was short (long) stock, he or she would buy a call (put) to hedge upside (downside) exposure. Option buyers can also use options as an efficient way to gain directional exposure.
POCs: POCs are valuable as they denote areas where two-sided trade was most prevalent in a prior day session. Participants will respond to future tests of value as they offer favorable entry and exit.
MCPOCs: POCs are valuable as they denote areas where two-sided trade was most prevalent over numerous day sessions. Participants will respond to future tests of value as they offer favorable entry and exit.
About
After years of self-education, strategy development, mentorship, and trial-and-error, Renato Leonard Capelj began trading full-time and founded Physik Invest to detail his methods, research, and performance in the markets.
Capelj is also a Benzinga finance and technology reporter interviewing the likes of Shark Tank’s Kevin O’Leary, JC2 Ventures’ John Chambers, FTX’s Sam Bankman-Fried, and ARK Invest’s Catherine Wood, as well as a SpotGamma contributor developing insights around impactful options market dynamics.
Disclaimer
Physik Invest does not carry the right to provide advice.
In no way should the materials herein be construed as advice. Derivatives carry a substantial risk of loss. All content is for informational purposes only.