Categories
Commentary

Daily Brief For January 24, 2022

The Daily Brief is a free glimpse into the prevailing fundamental and technical drivers of U.S. equity market products. Join the 200+ that read this report daily, below!

What Happened

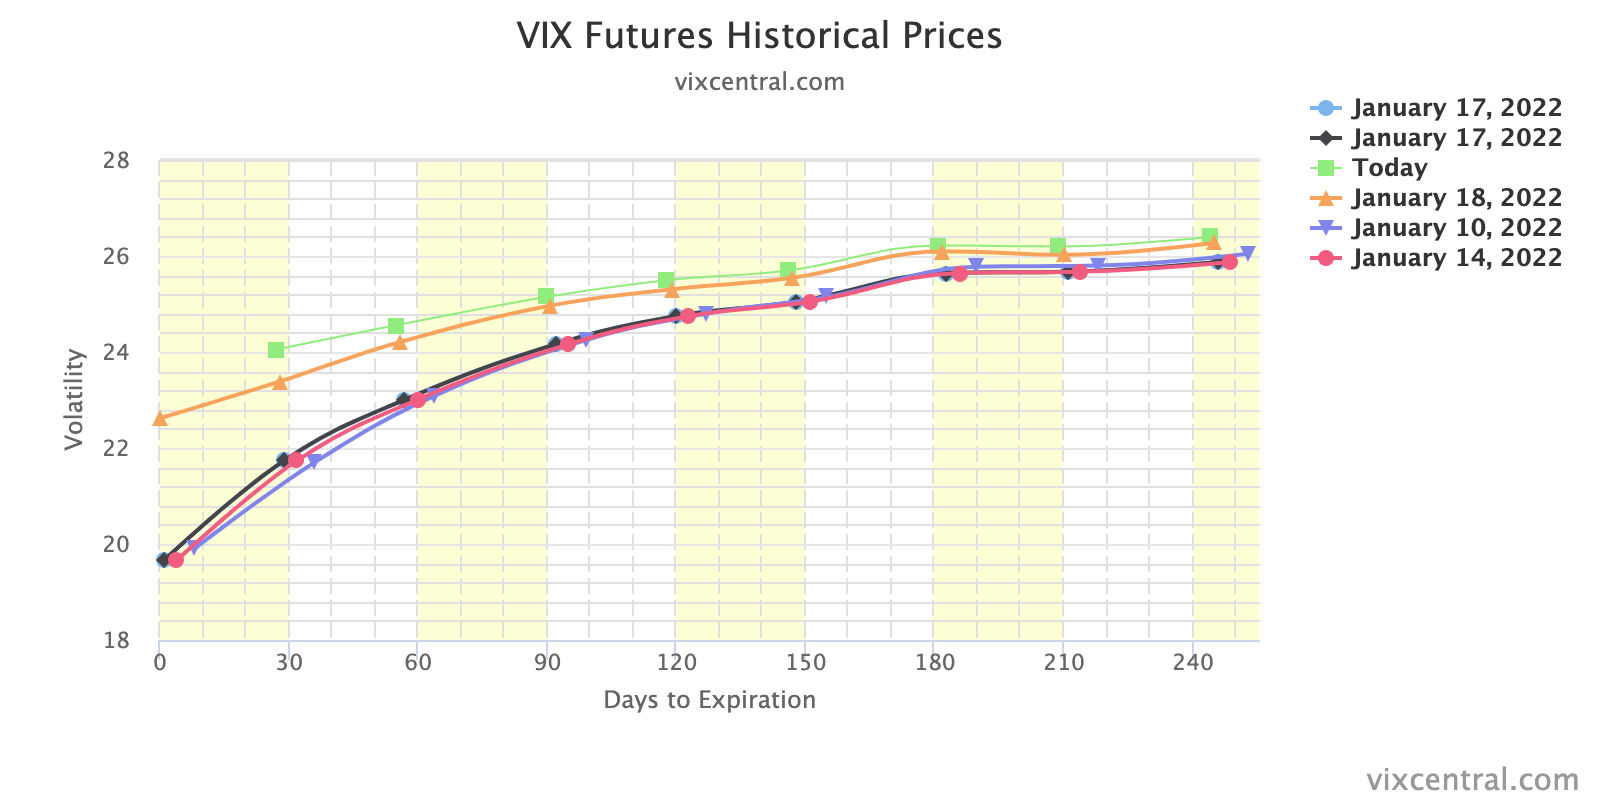
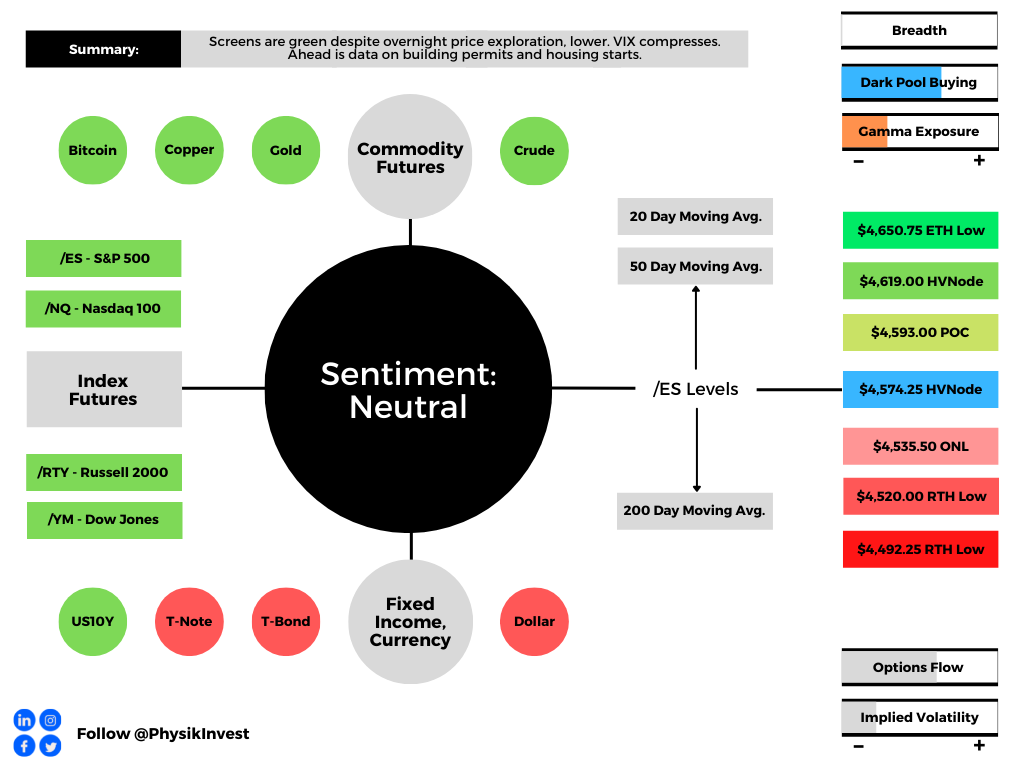
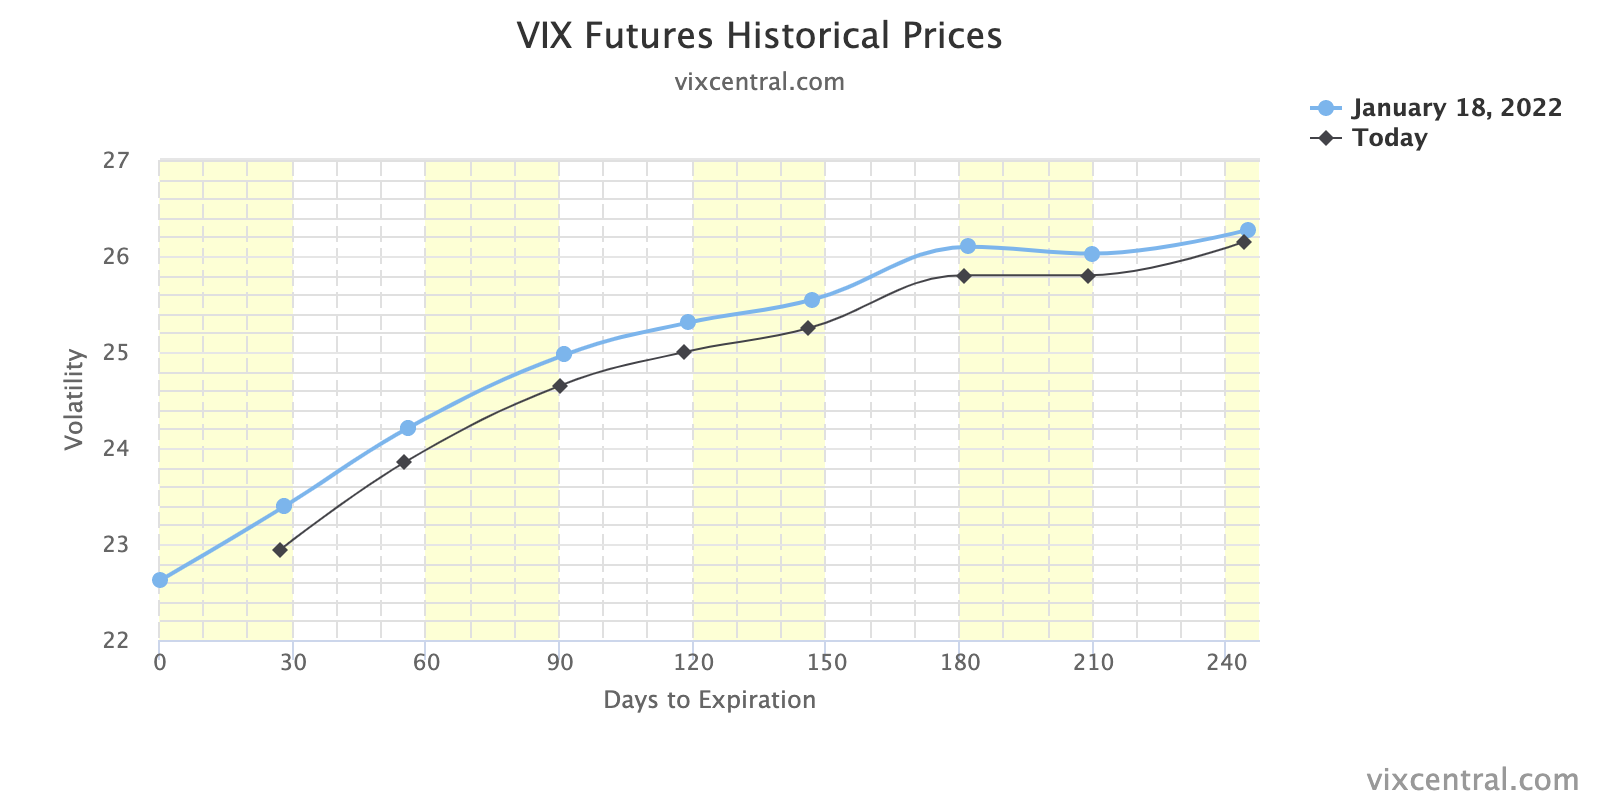
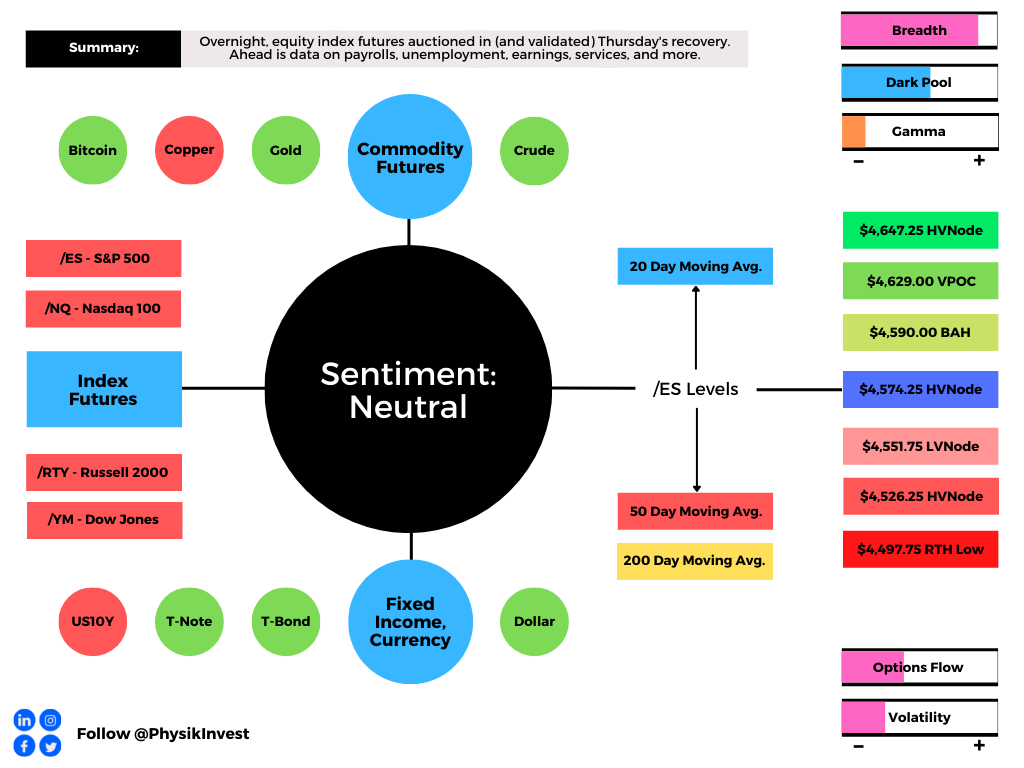
Overnight, equity index futures auctioned sideways to lower while measures of implied volatility expanded, which suggests increased fear and demand for protection.

This is in the context of an environment wherein the equity market, in particular, is positioned for heightened volatility, albeit potential strength, after Friday’s large monthly options expiration.

Ahead is data on Markit Manufacturing and Services PMI (9:45 AM ET).

Graphic updated 6:15 AM ET. Sentiment Risk-Off if expected /ES open is below the prior day’s range. /ES levels are derived from the profile graphic at the bottom of the following section. Levels may have changed since initially quoted; click here for the latest levels. SqueezeMetrics Dark Pool Index (DIX) and Gamma (GEX) calculations are based on where the prior day’s reading falls with respect to the MAX and MIN of all occurrences available. A higher DIX is bullish. At the same time, the lower the GEX, the more (expected) volatility. Learn the implications of volatility, direction, and moneyness. SHIFT data used for S&P 500 (INDEX: SPX) options activity. Note that options flow is sorted by the call premium spent; if more positive, then more was spent on call options. Breadth reflects a reading of the prior day’s NYSE Advance/Decline indicator. VIX reflects a current reading of the CBOE Volatility Index (INDEX: VIX) from 0-100.

What To Expect

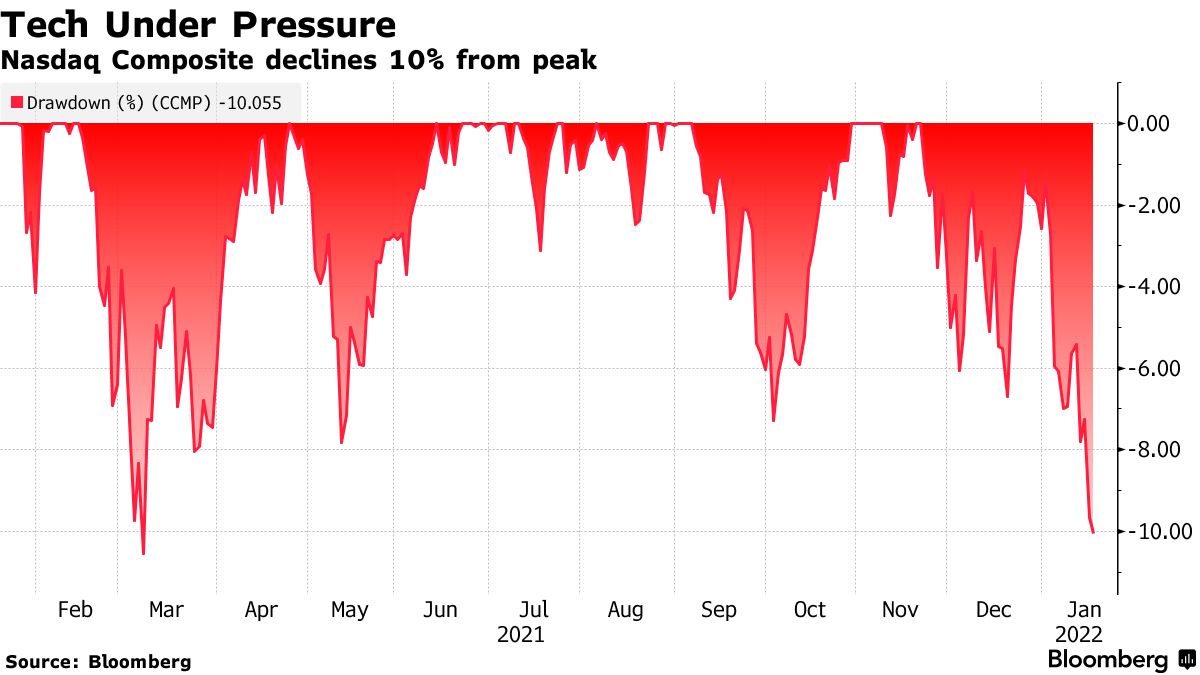
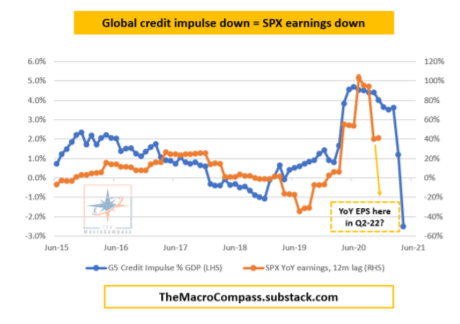
Fundamental: “The ratio of stocks hitting 52-week lows is at the highest since March 2020,” according to The Market Ear

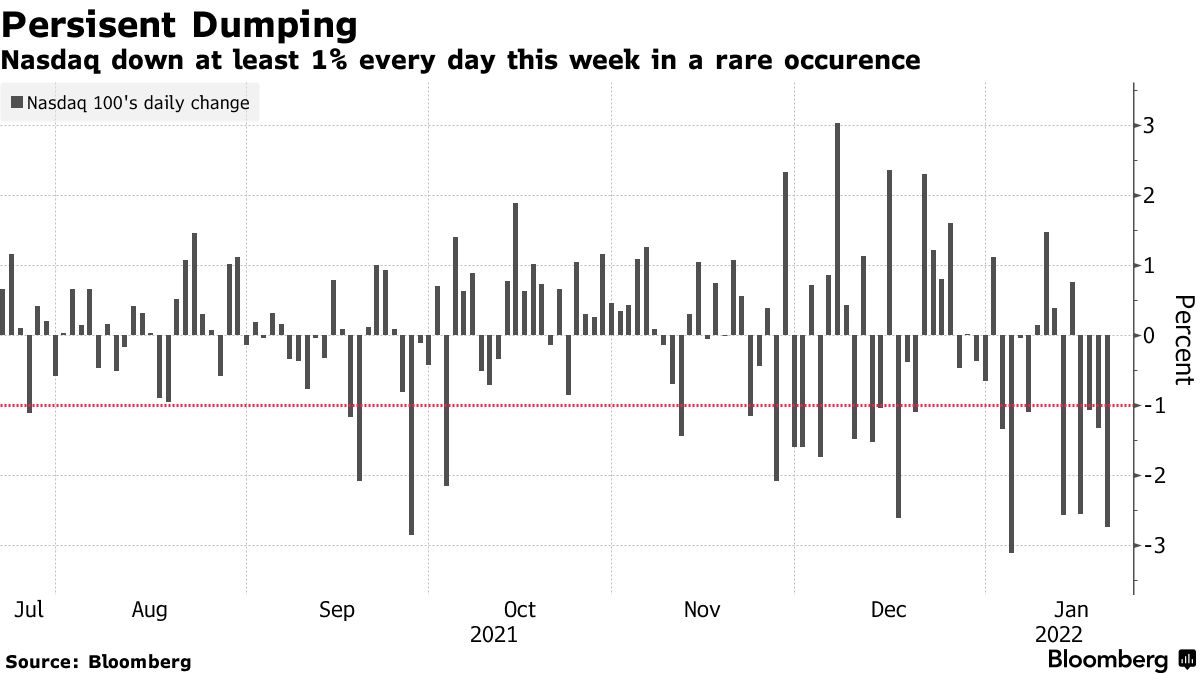
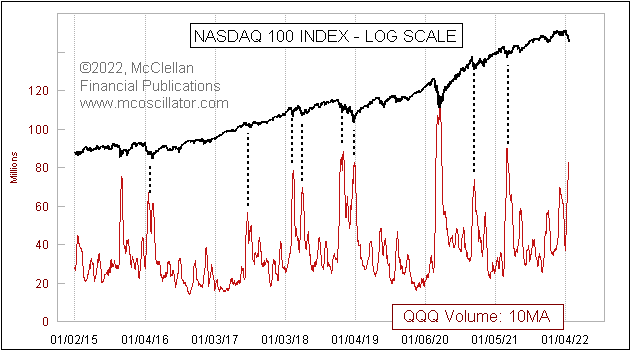
In fact, in the face of a traditionally bullish period, seasonally, this is the worst January on record for the Nasdaq.

Graphic: Per Bloomberg, “Down almost 12% in January, the Nasdaq 100 is on course for its worst month since the 2008 global financial crisis. On any four-day basis, the current streak of 1% drops was the first since 2018.”

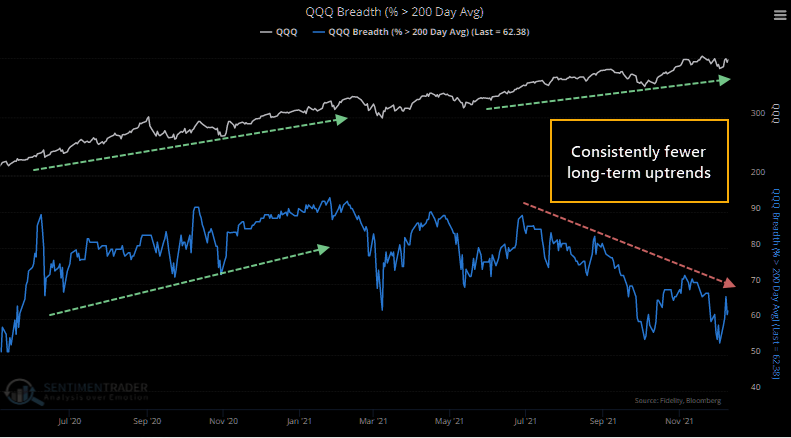
This weakness is in the context of months of divergent breadth by lesser weighted index constituents, geopolitical tensions, the prospects of reduced stimulus to combat high inflation, poor responses to earnings results, and disappointments in real demand and growth.

Graphic: @MacroAlf plots credit impulse as a percent of GDP and SPX year-over-year earnings.

The tone amongst retail participants is changing, too, with outflows starting for the first time since a major rush in account openings. When asked whether the selling is over, JPMorgan Chase & Co’s (NYSE: JPM) prime brokerage data suggests no.

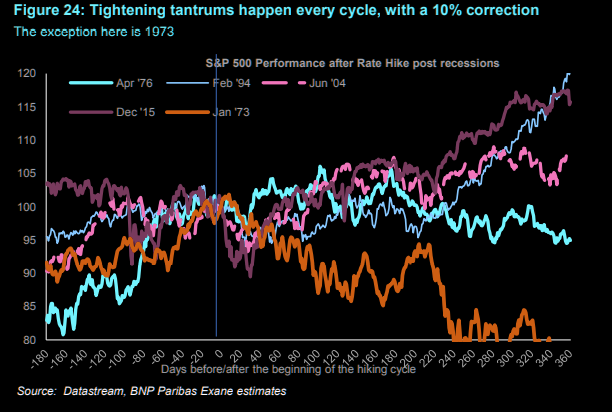
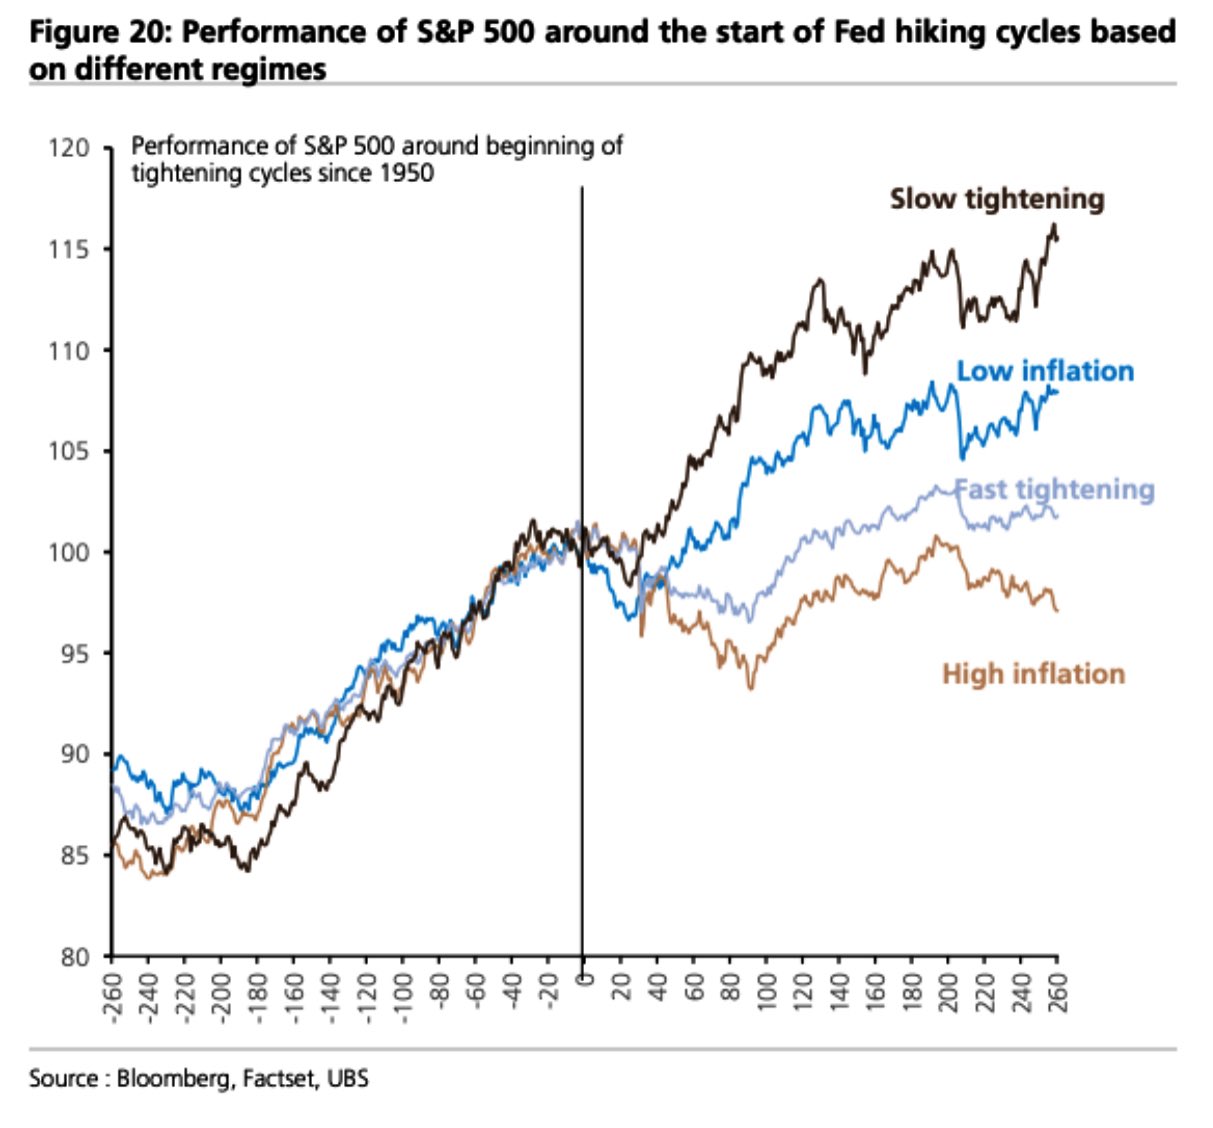
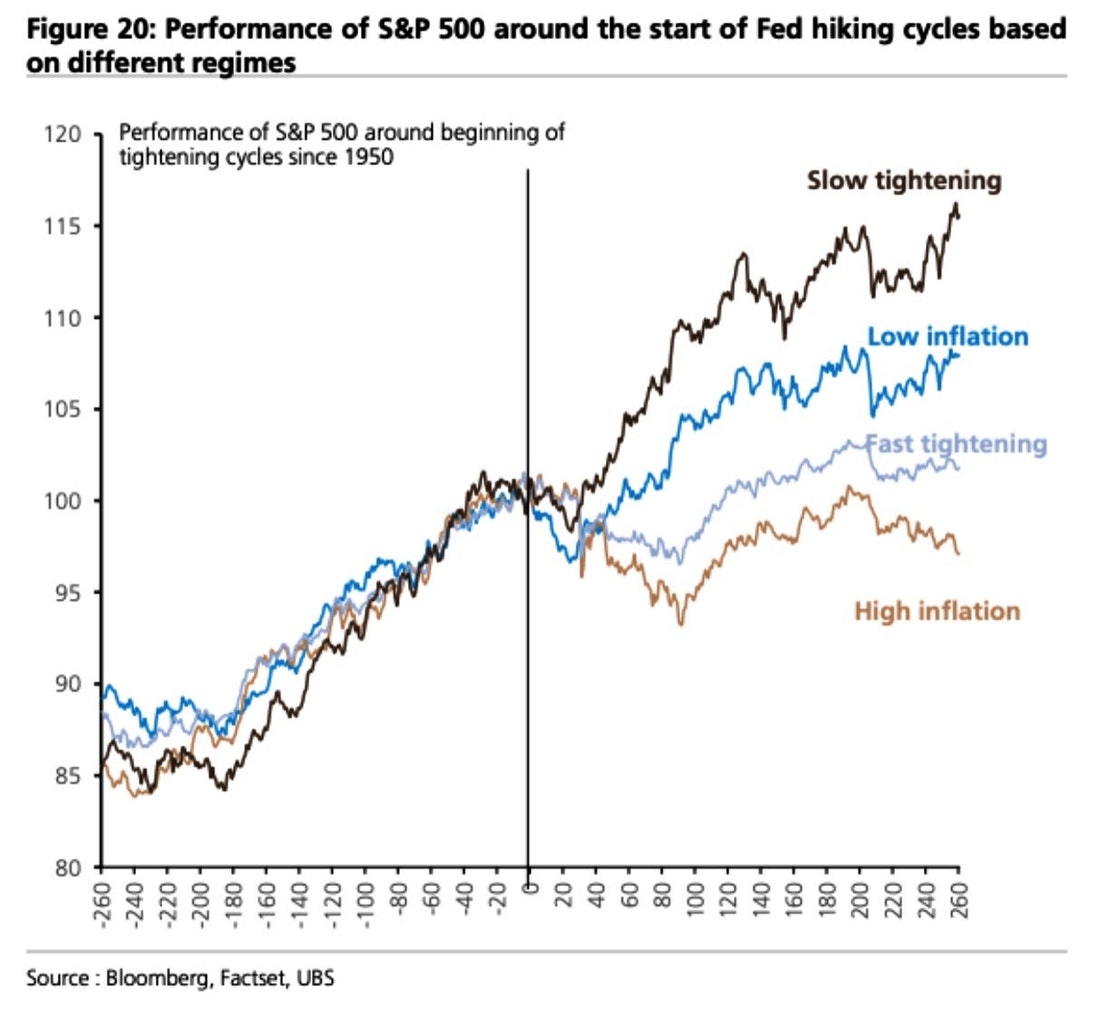
This is in opposition to the typical trend into the start of the Federal Reserve (Fed) hiking cycles.

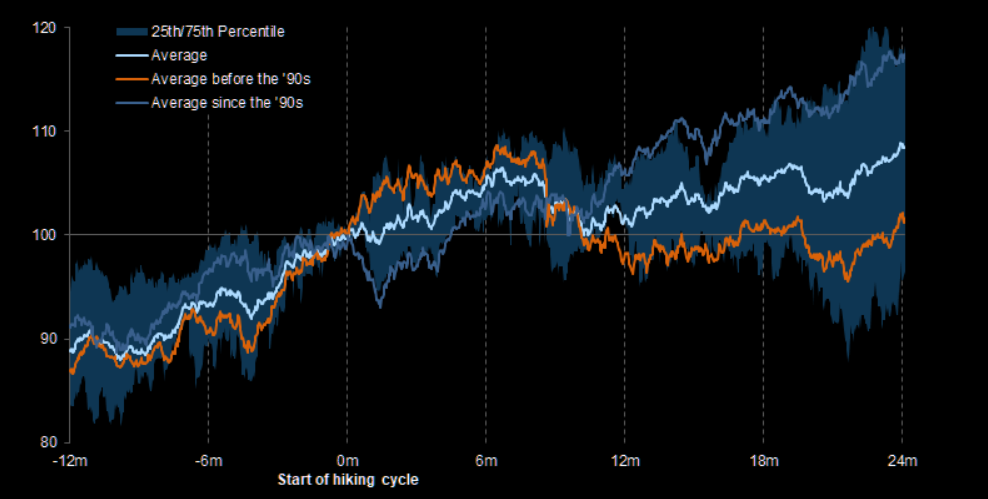
“U.S. equities have stumbled significantly on their way toward the first hike of this cycle, which is not the norm,” Jefferies Financial Group (NYSE: JEF) explained. “Performance tends to be poor immediately after the first hike, and can be worse if stocks are weakly into the first hike.”

Notwithstanding, Jefferies adds, “the SPX was higher in the 12 months that followed the start of each of the last 7 hike cycles.”

Graphic: S&P 500 performance before and after rate hikes.

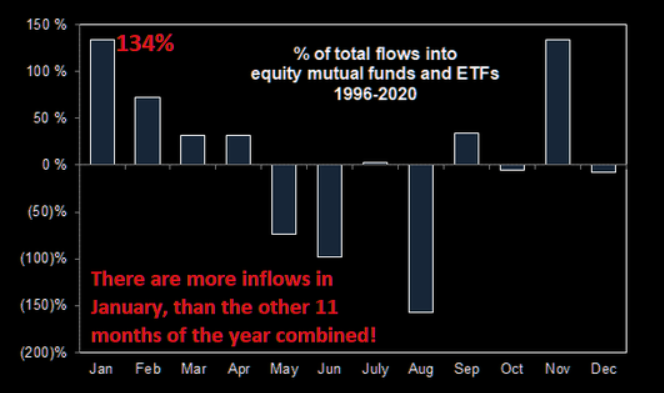
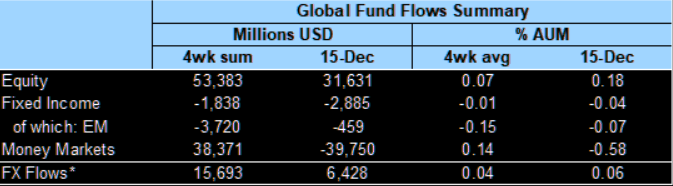
With some of that context in mind, what is there to look forward to? The corporate buyback blackout window ended after the close of business, Friday, and equity inflows remain robust.

What is there to be wary of? 

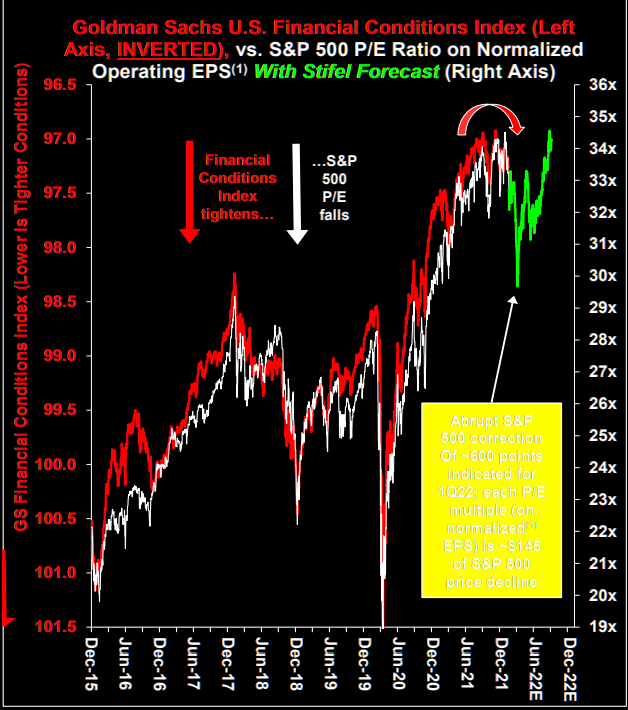
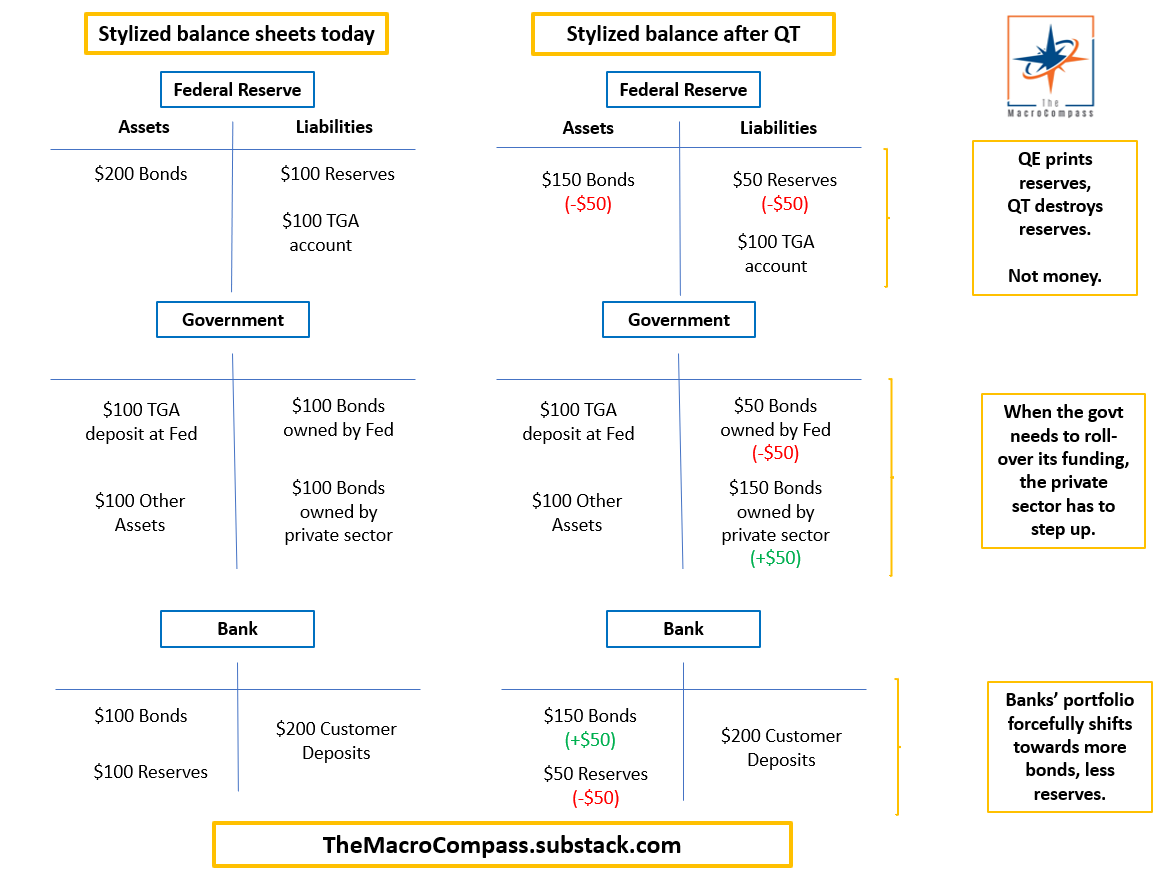
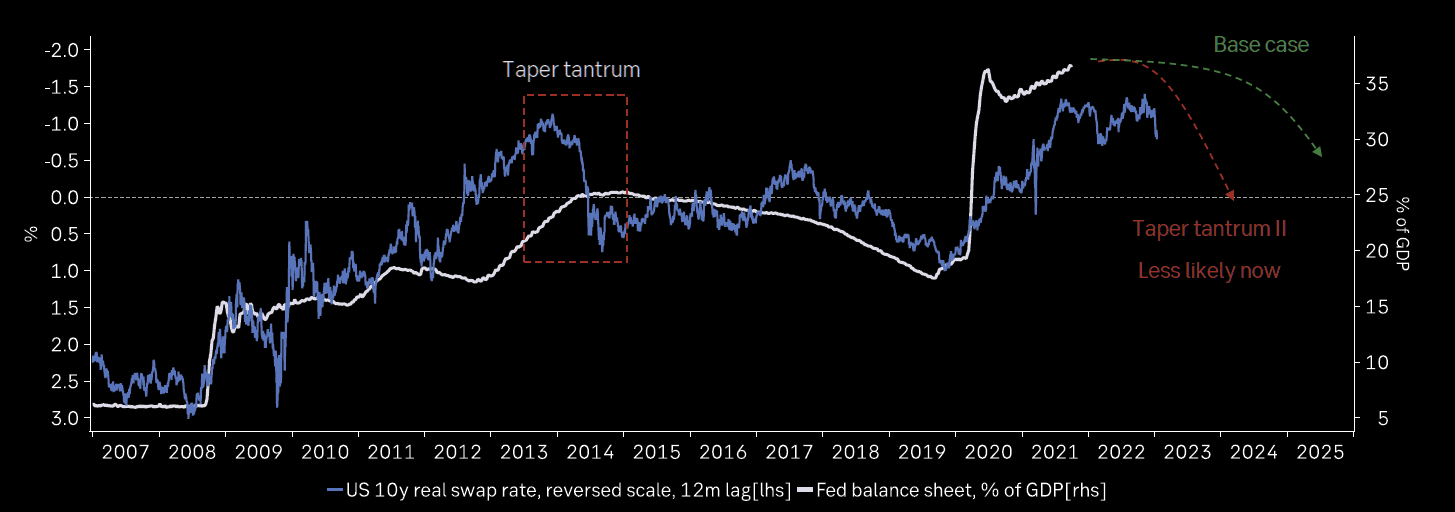
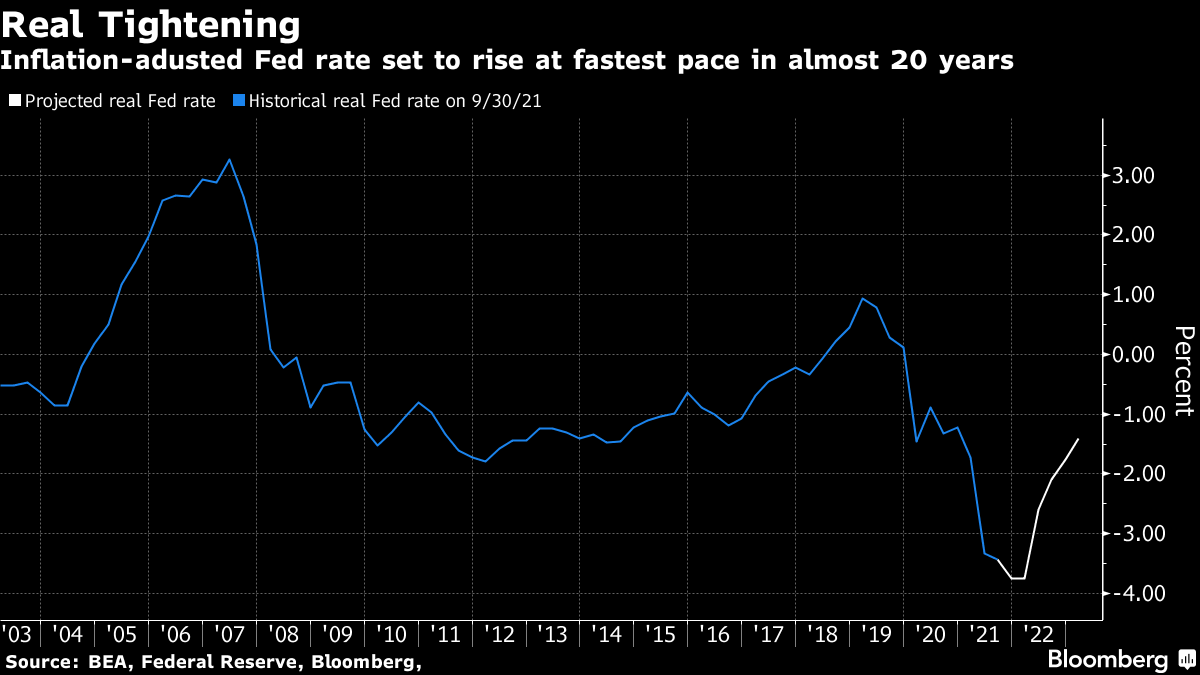
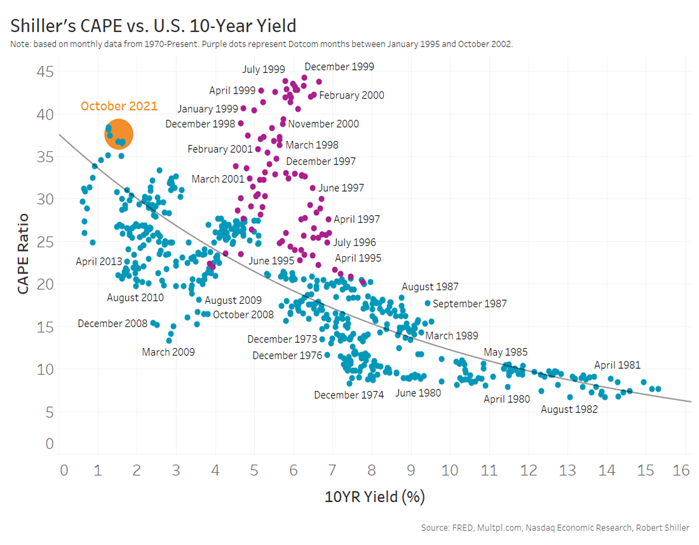
Well, given that “risk is being repriced to fit the world where real rates are a lot higher, and the Fed put [is] much lower thanks to the Fed’s need to fight inflation,” this week’s Federal Open Market Committee (FOMC) meeting shall provide market participants more context as to the “timing and pace of QT” which may assuage fears unless the Fed is all out to “drop QE next week itself.”

The odds of that happening are low.

Graphic: Per Bloomberg, “As Savita Subramanian of Bank of America Corporation (NYSE: BAC) shows in the following chart, expected earnings are far less helpful in explaining market outcomes since 2010 than they were before. Meanwhile, changes in the Fed’s balance sheet, the amount of money it’s making available to markets, have become hugely important.”

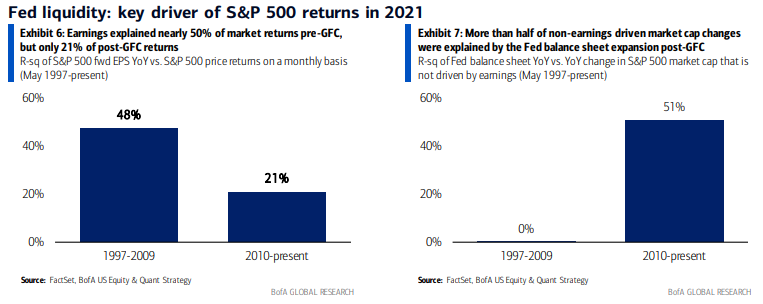
As Bloomberg’s John Authers puts it well: “Despite many scares, money has stayed plentiful for the last decade, rates have fallen, and anyone who did much to protect themselves against the risk of a decline would have done badly by it.”

Graphic: As Goldman Sachs Group Inc (NYSE: GS) “shows in this chart, companies are becoming ever more profitable in a way that seems to be sustained.”

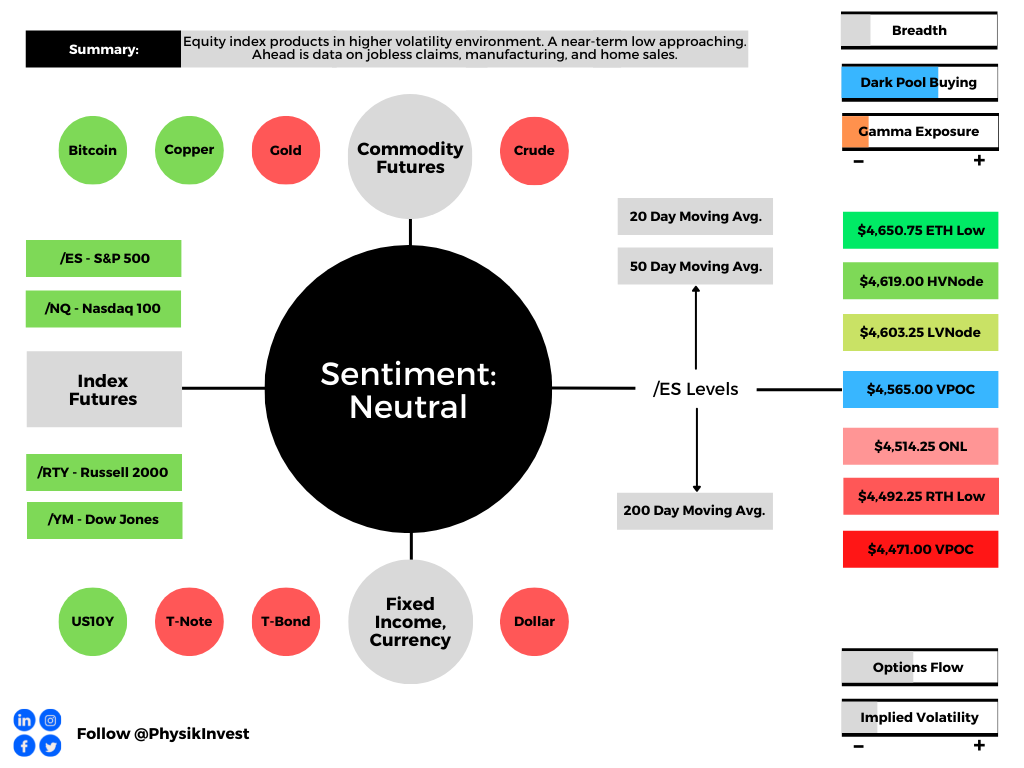
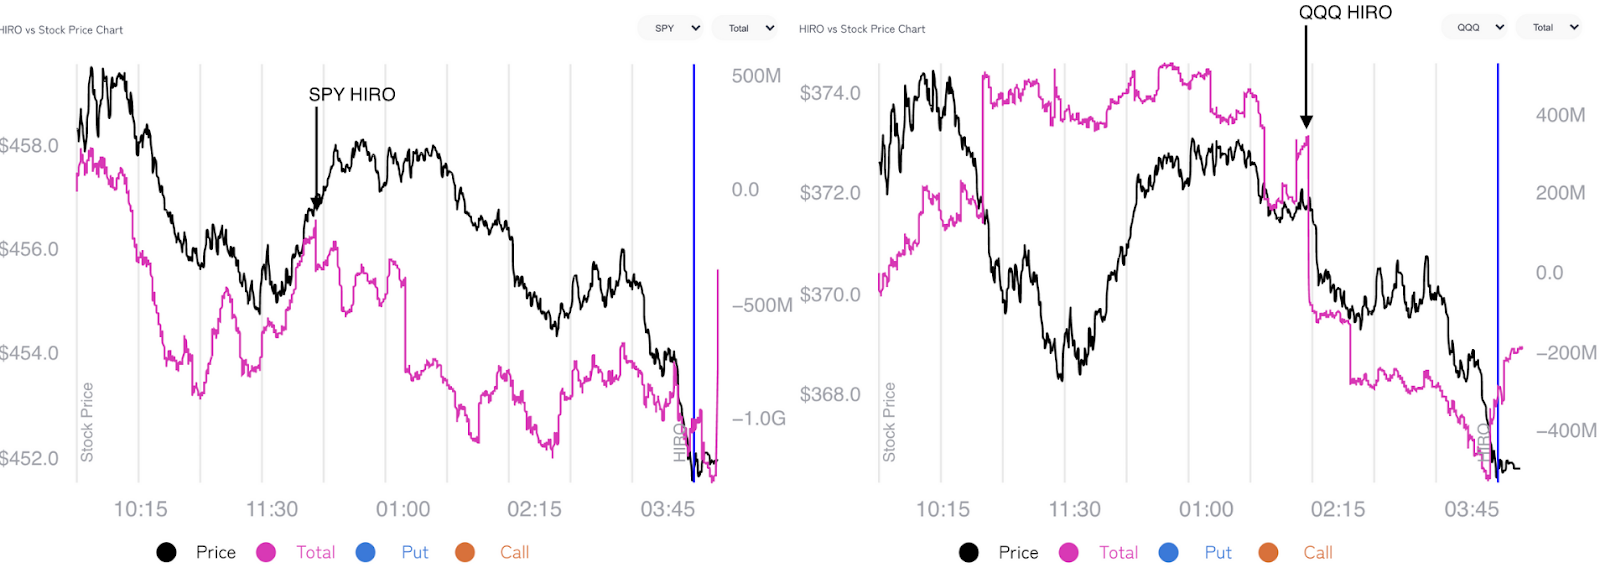
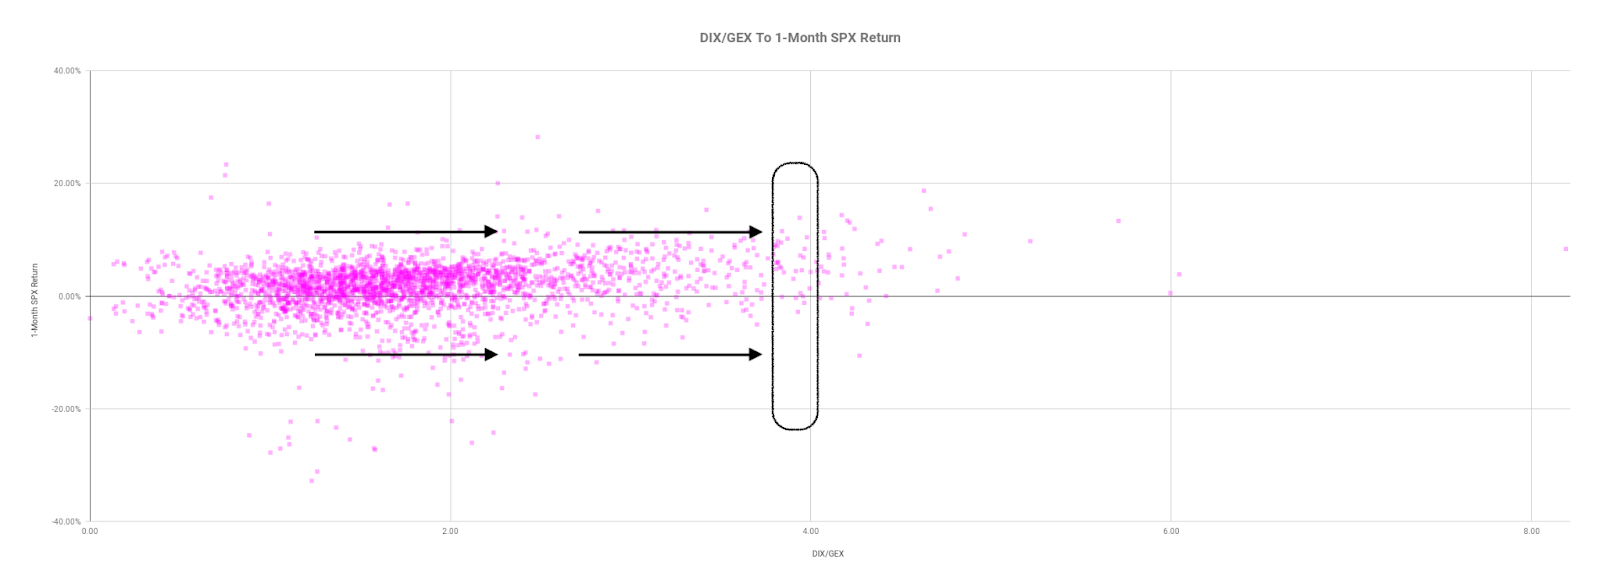
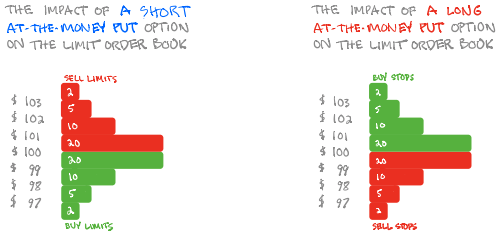
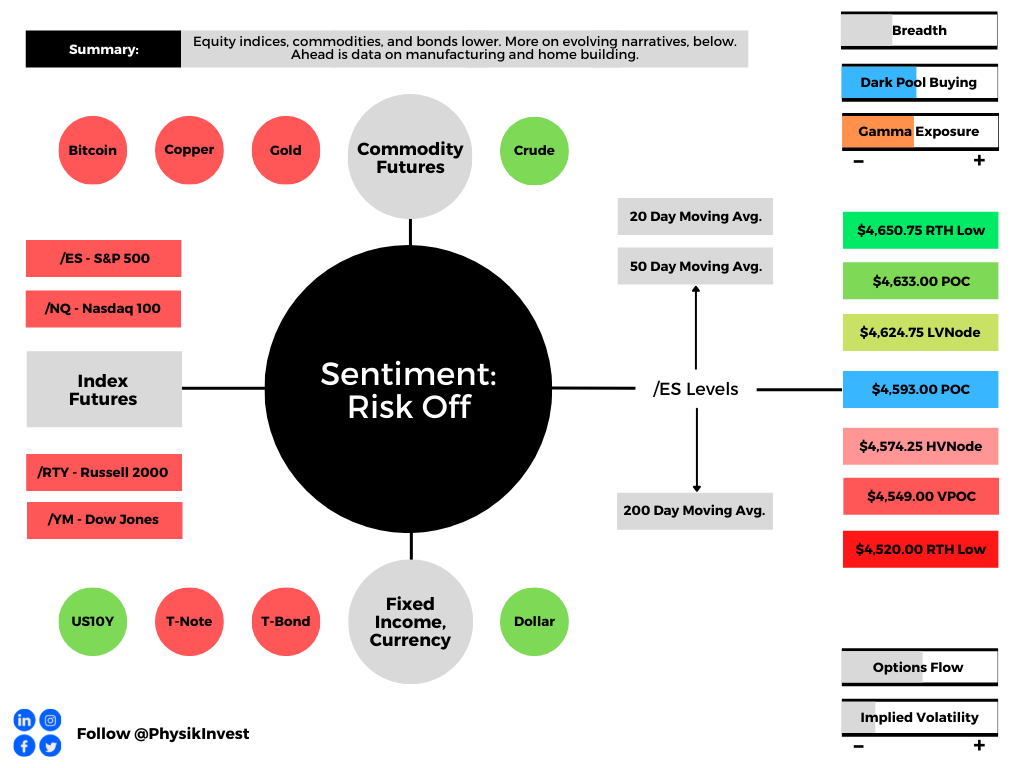
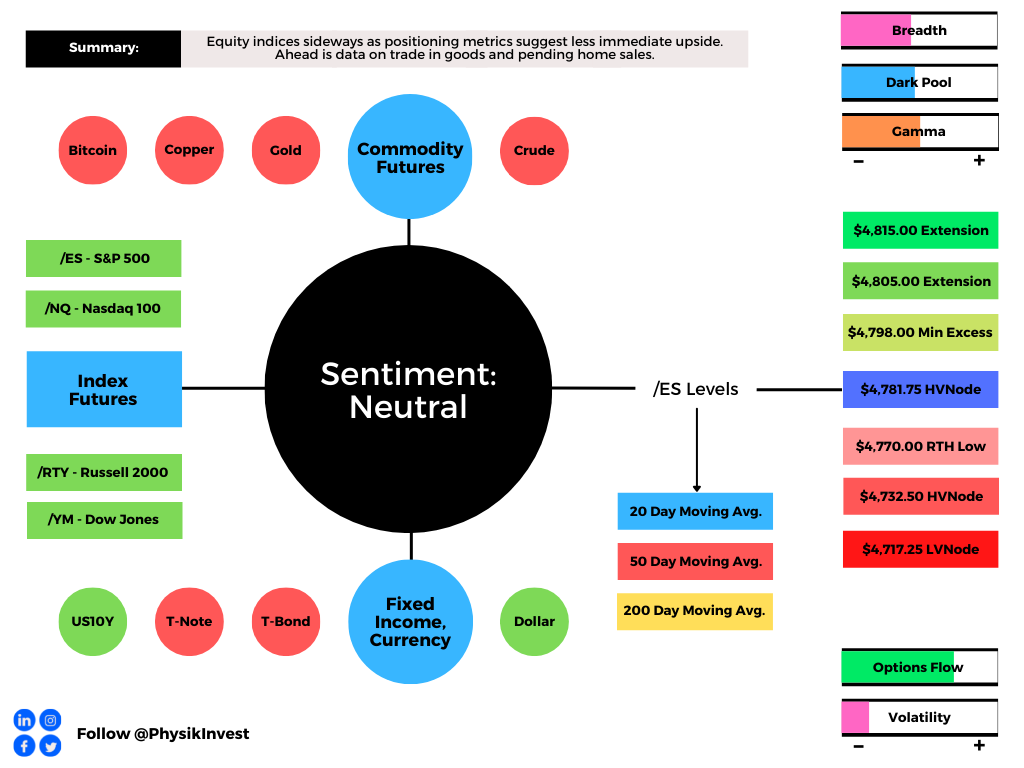
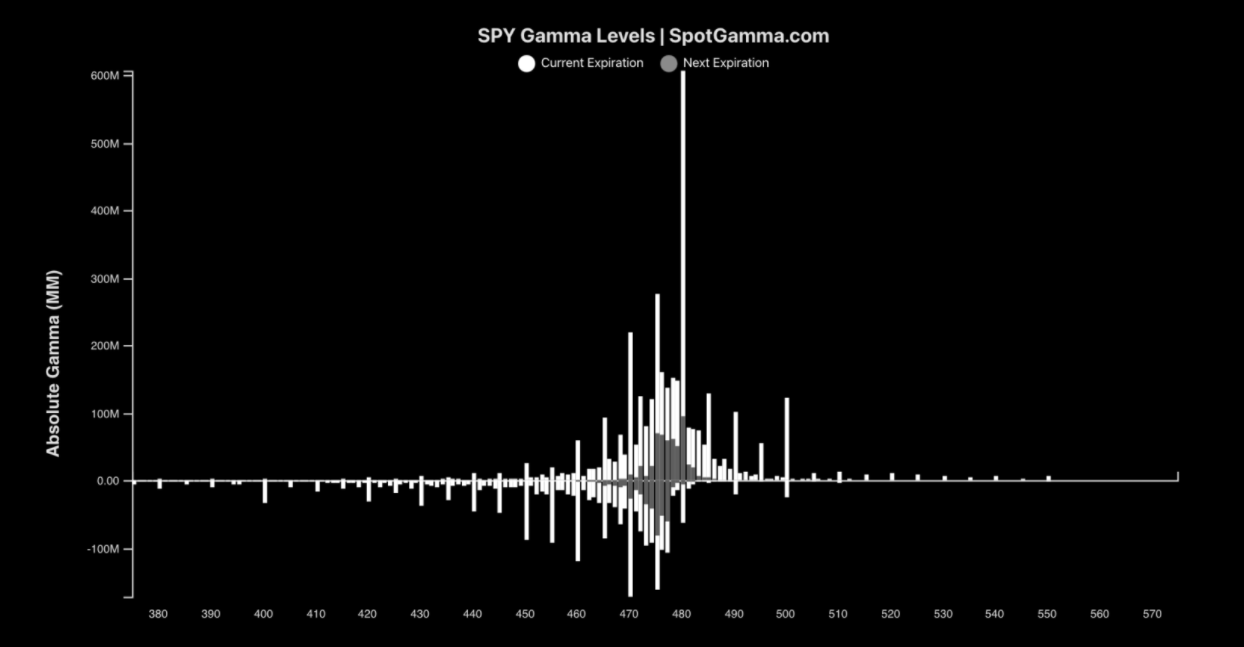
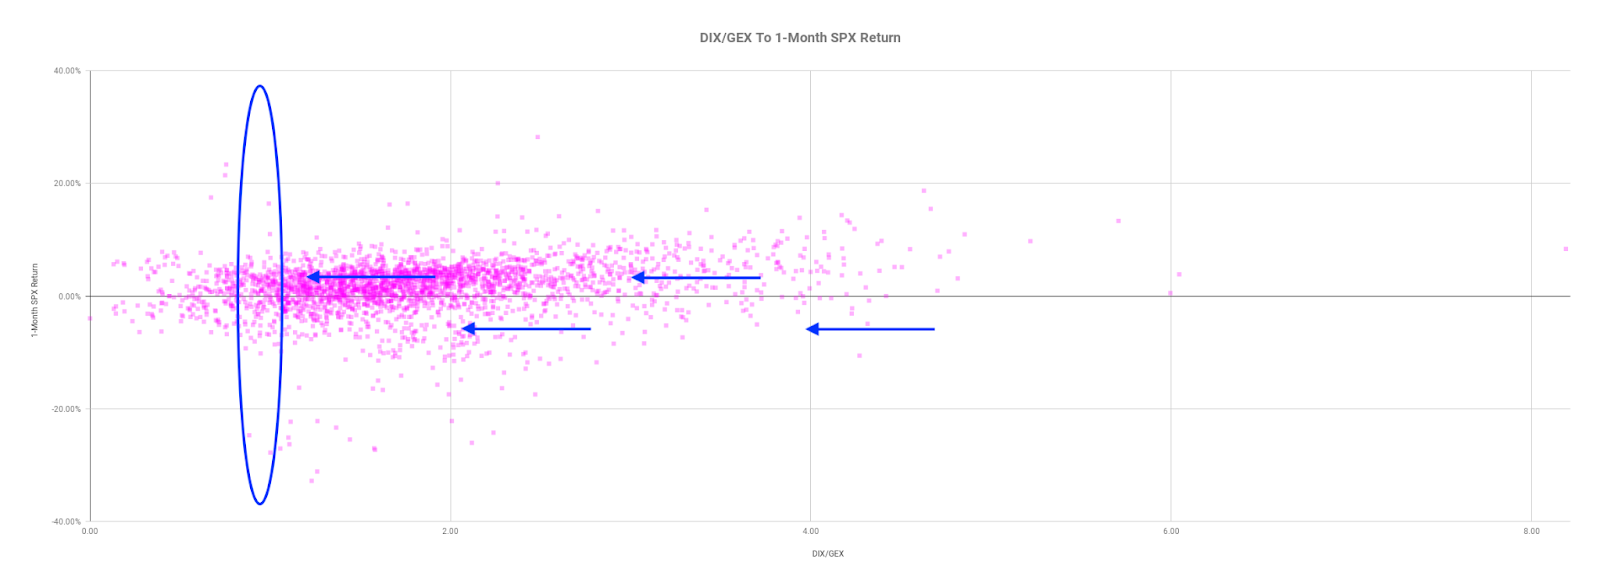
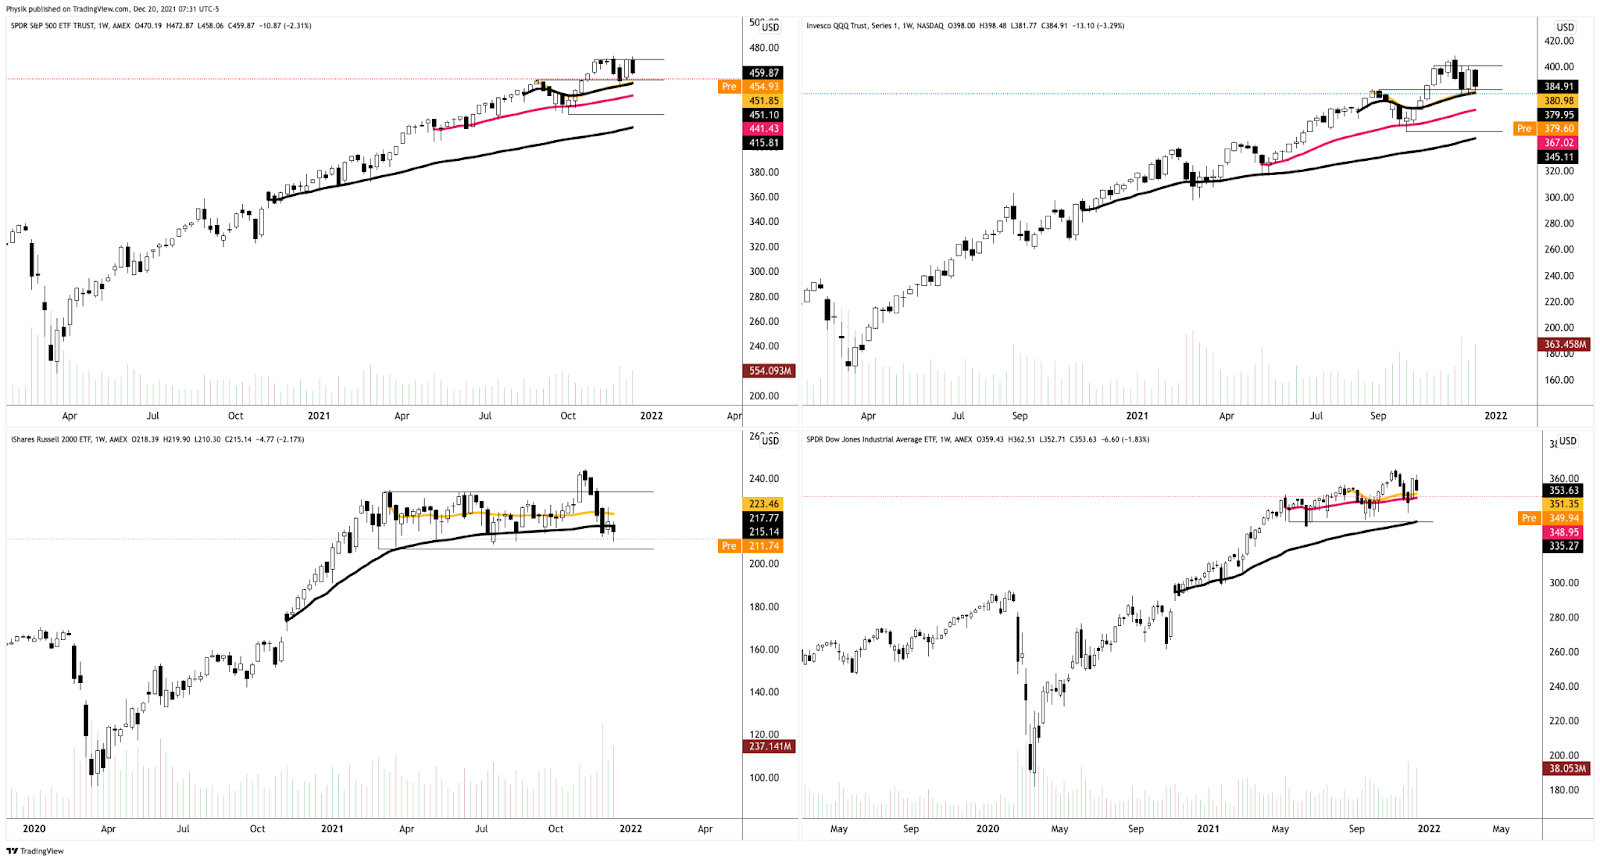
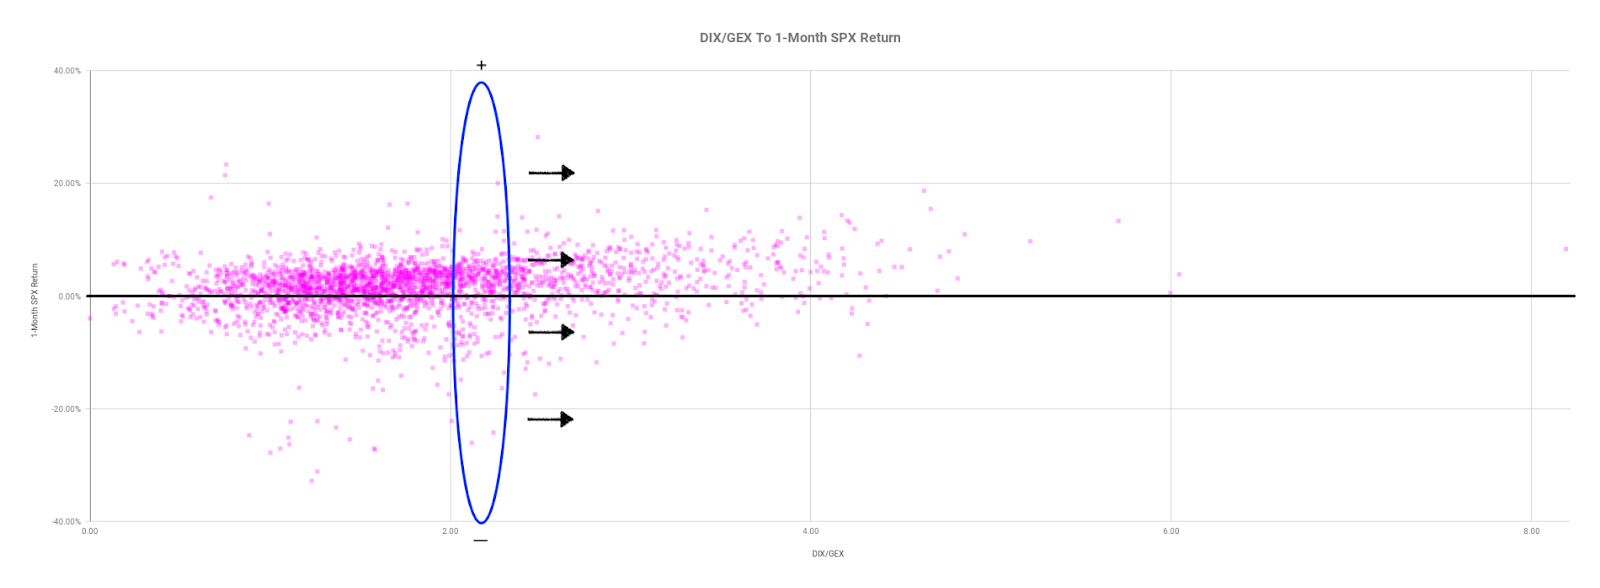
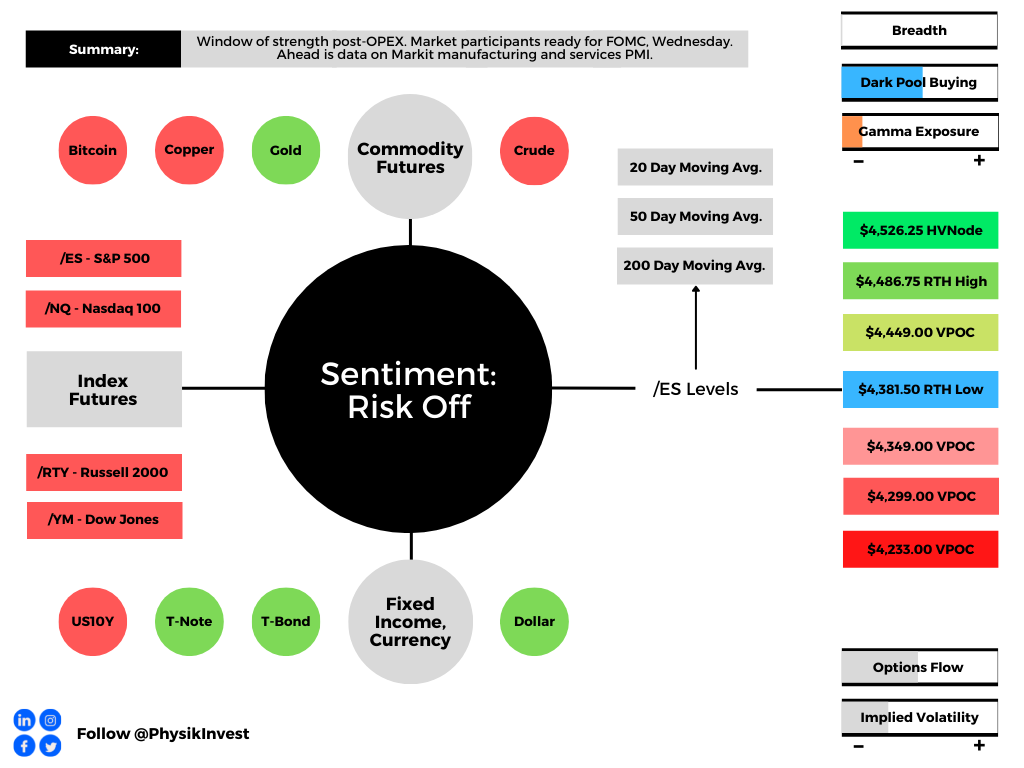
Positioning: The major broad market indices – the S&P 500, Nasdaq 100, and Russell 2000 – are in an environment characterized by negative gamma and heightened volumes. 

Graphic: Per Tom McClellan, “Persistently high volume late in QQQ is a sign of overly bearish sentiment worthy of a bottom. Key caveat: just because one notices a sentiment indication which should matter does not mean it has to matter right away.”

The negative gamma – in reference to the options counterparties reaction “when a position’s delta falls (rises) with stock or index price rises (falls)” – is what compounds the selling. 

With measures of implied volatility expanding, as is the case when there is heightened demand for downside put protection (a positive-delta trade for the dealers), protection is bid and the dealer’s exposure to positive delta rises, which solicits more selling in the underlying (addition of short-delta hedges).

Graphic: SqueezeMetrics details the implications of customer activity in the options market, on the underlying’s order book. For instance, in selling a put, customers add liquidity and stabilize the market. How? The market maker long the put will buy (sell) the underlying to neutralize directional risk as price falls (rises).

Moreover, in negative-gamma, dealers are selling weakness and buying strength, taking liquidity. 

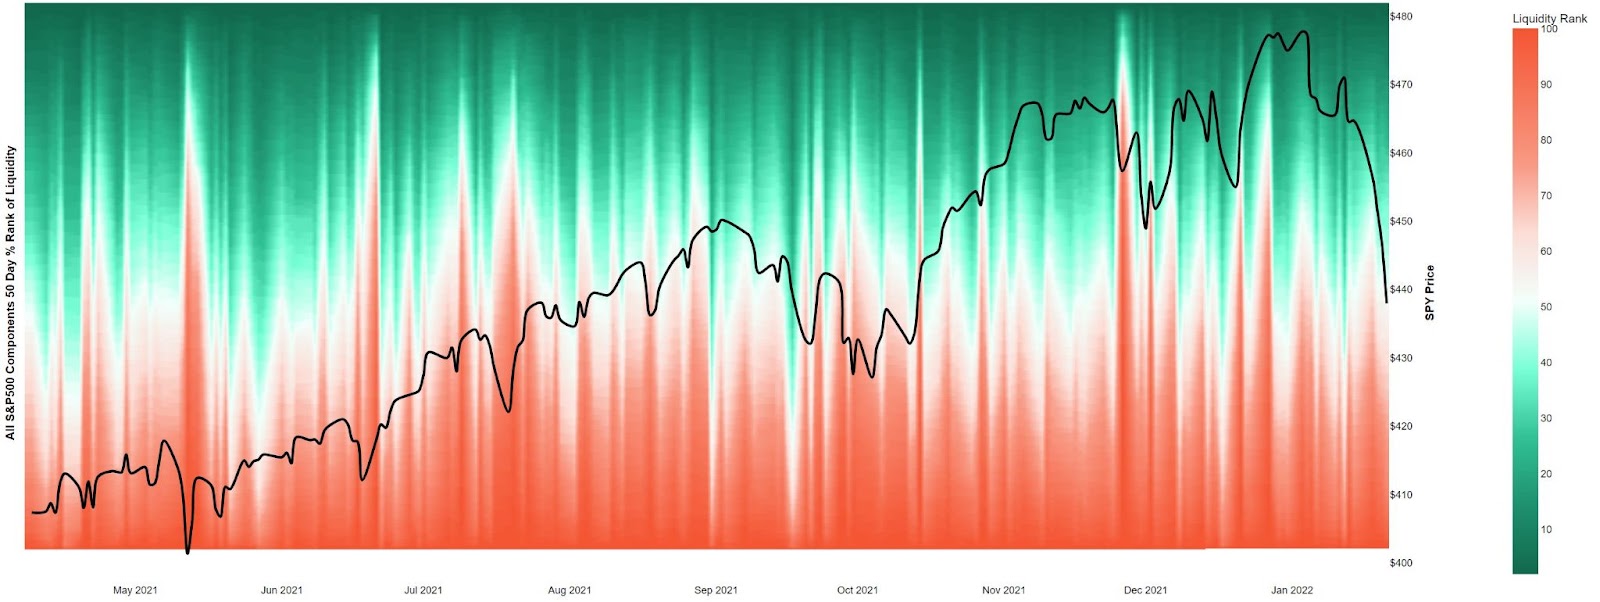
That’s destabilizing but it appears that “Friday in the markets did not have abnormal liquidity across S&P500 stocks.”

Graphic: Per @HalfersPower on Twitter, liquidity rankings for S&P 500 components. 

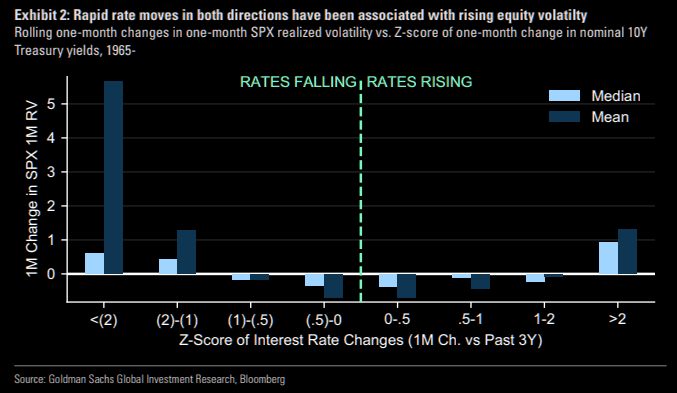
High readings in indicators like the put/call volume ratio, which denotes heightened trade of puts, relative to calls, as well as how calm equity market volatility is relative to rate volatility, could be the result of adequate hedging into the monthly options expiration (OPEX) and this week’s FOMC meeting.

“A very nasty flush out on a key polarized psychological level (S&P 500 $4,500.00) on the highest negative gamma day on an OPEX,” said Kris Sidial of The Ambrus Group on the increased potential for relief as a result of aggressive dip-buying. 

“Aggressive shorts piling in on an already dismantled tech selloff, leading into FOMC meeting after an 8% decline in the market, and Apple Inc (NASDAQ: AAPL) reporting earnings.”

Sidial’s opinion that the market is due for a counter-trend rally, in the face of an environment in which “there does not seem to be a direct hazard,” is aligned with the expectation that removal of put-heavy exposure, post-OPEX, and a reduction in embedded event premiums tied to the approaching FOMC, opens up a window of strength, wherein dealers have less positive delta exposure to sell against.

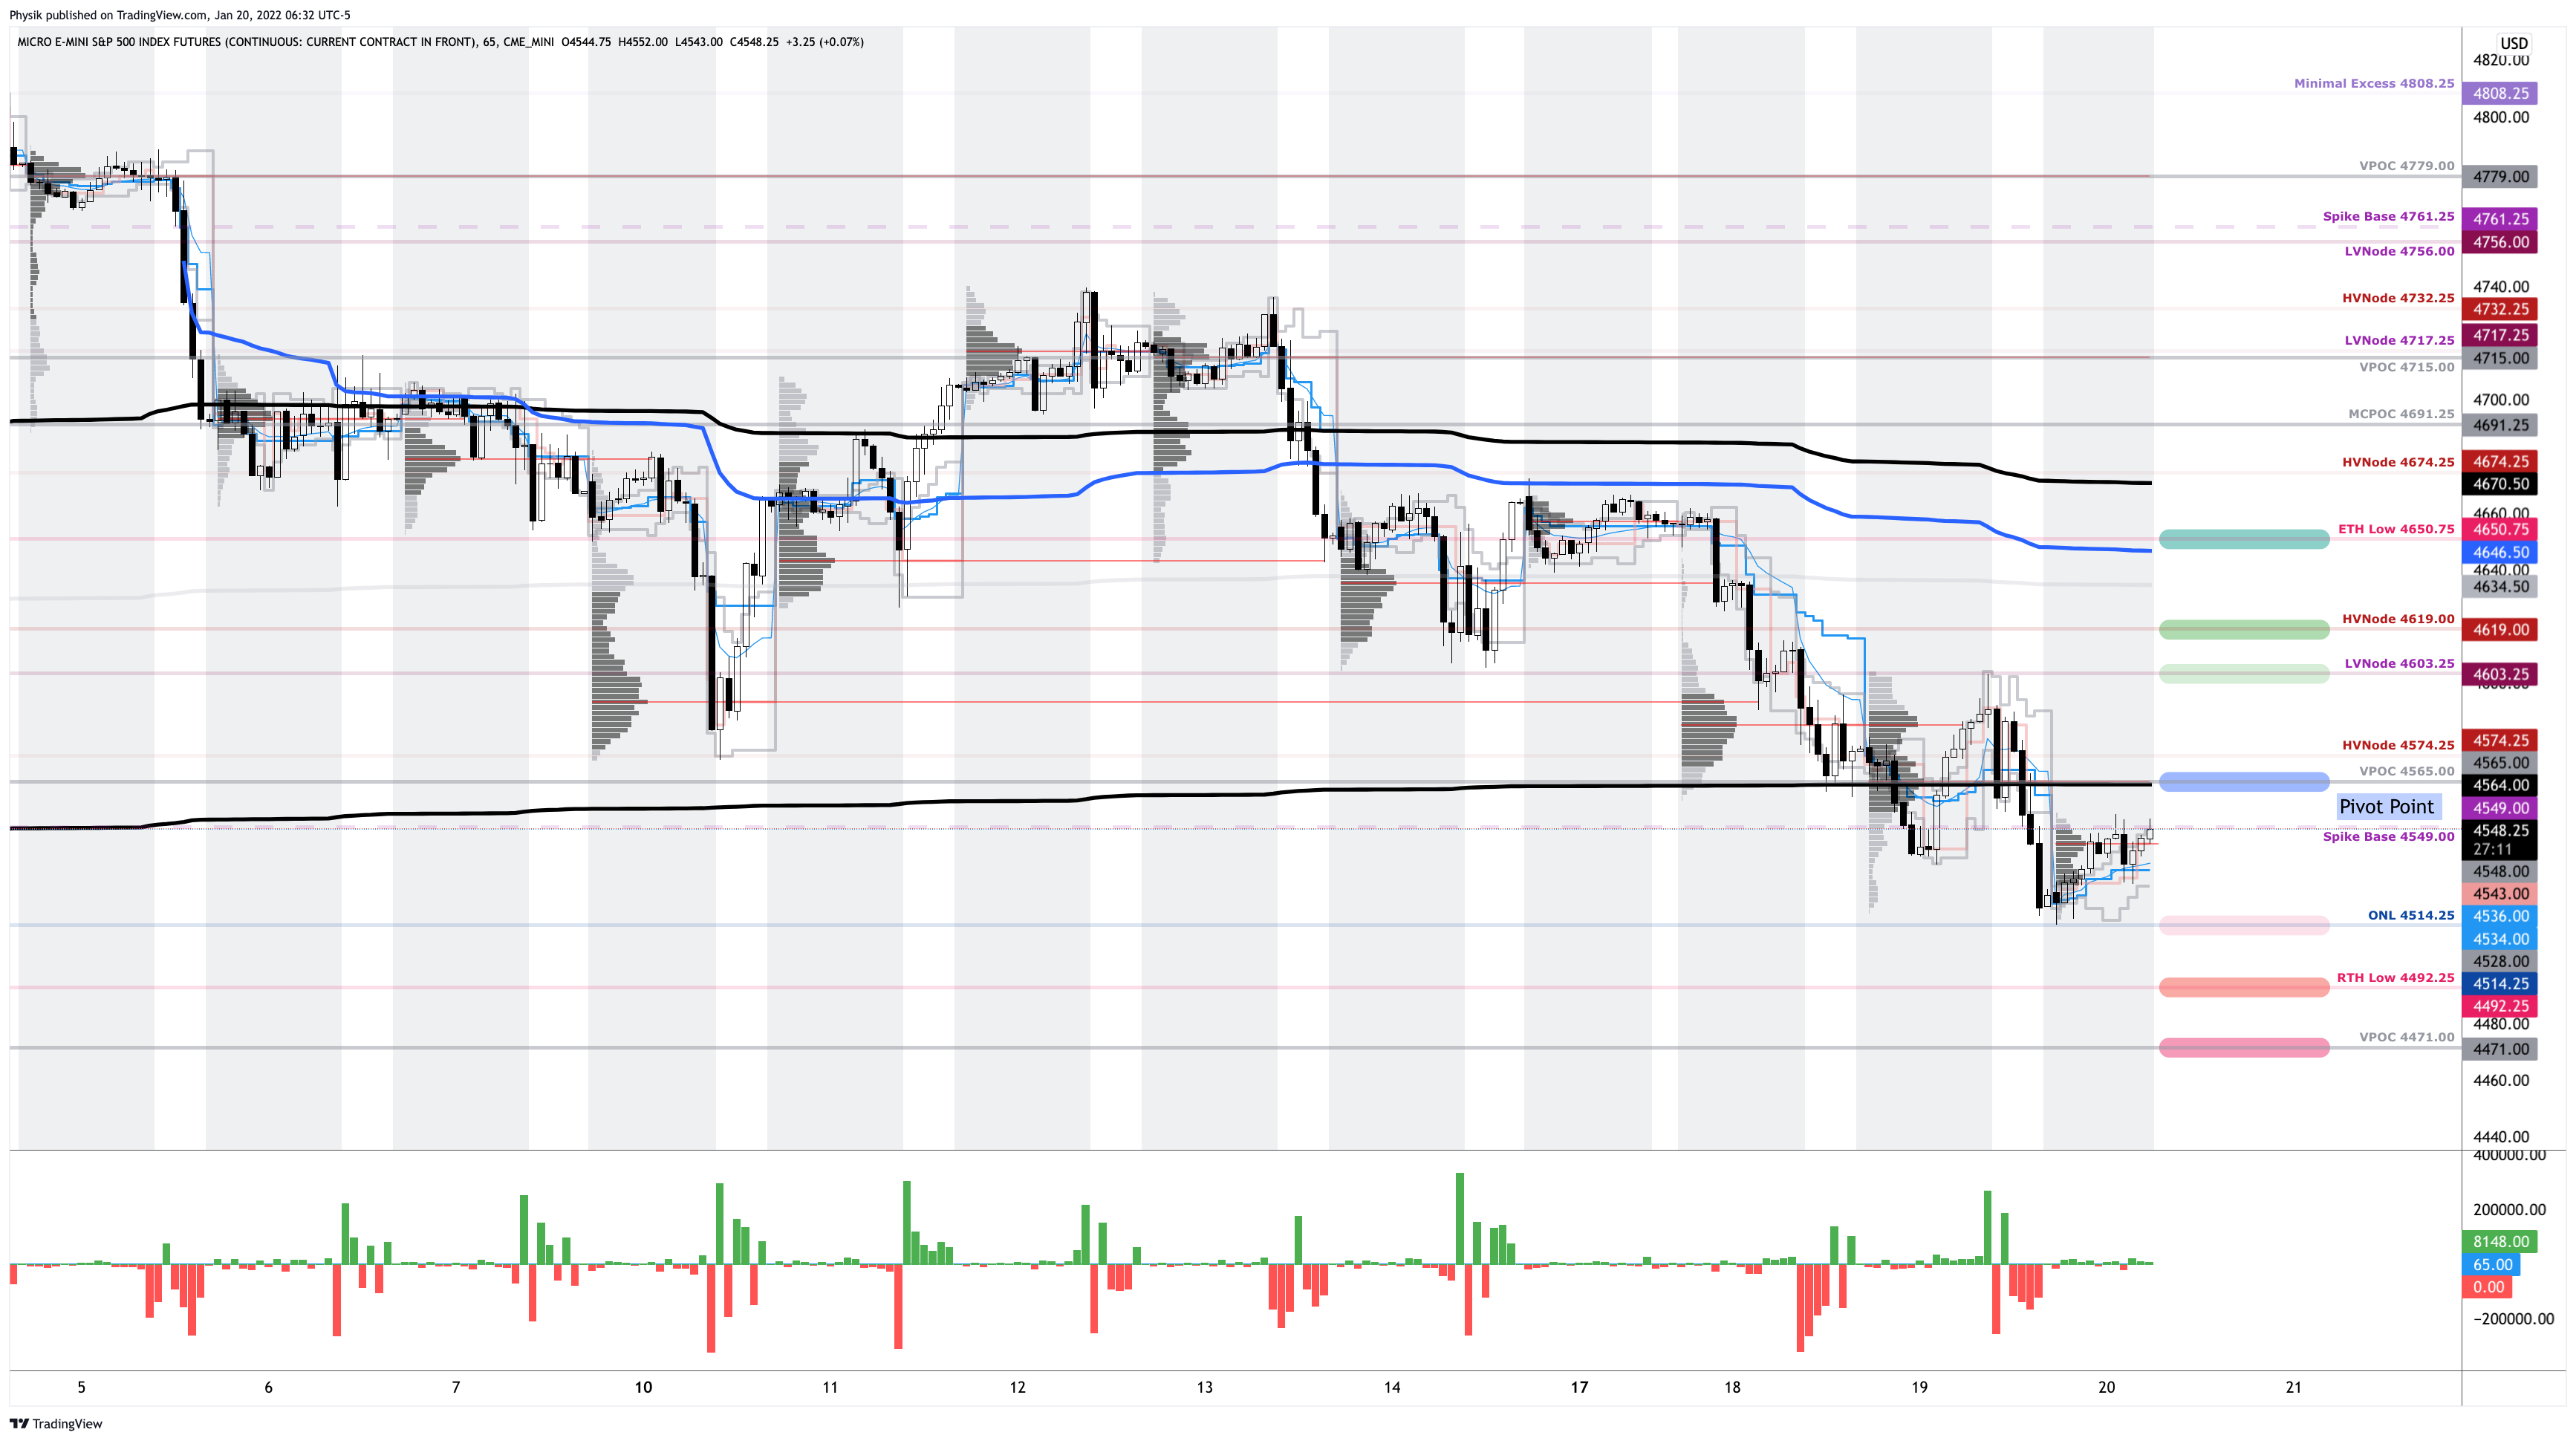
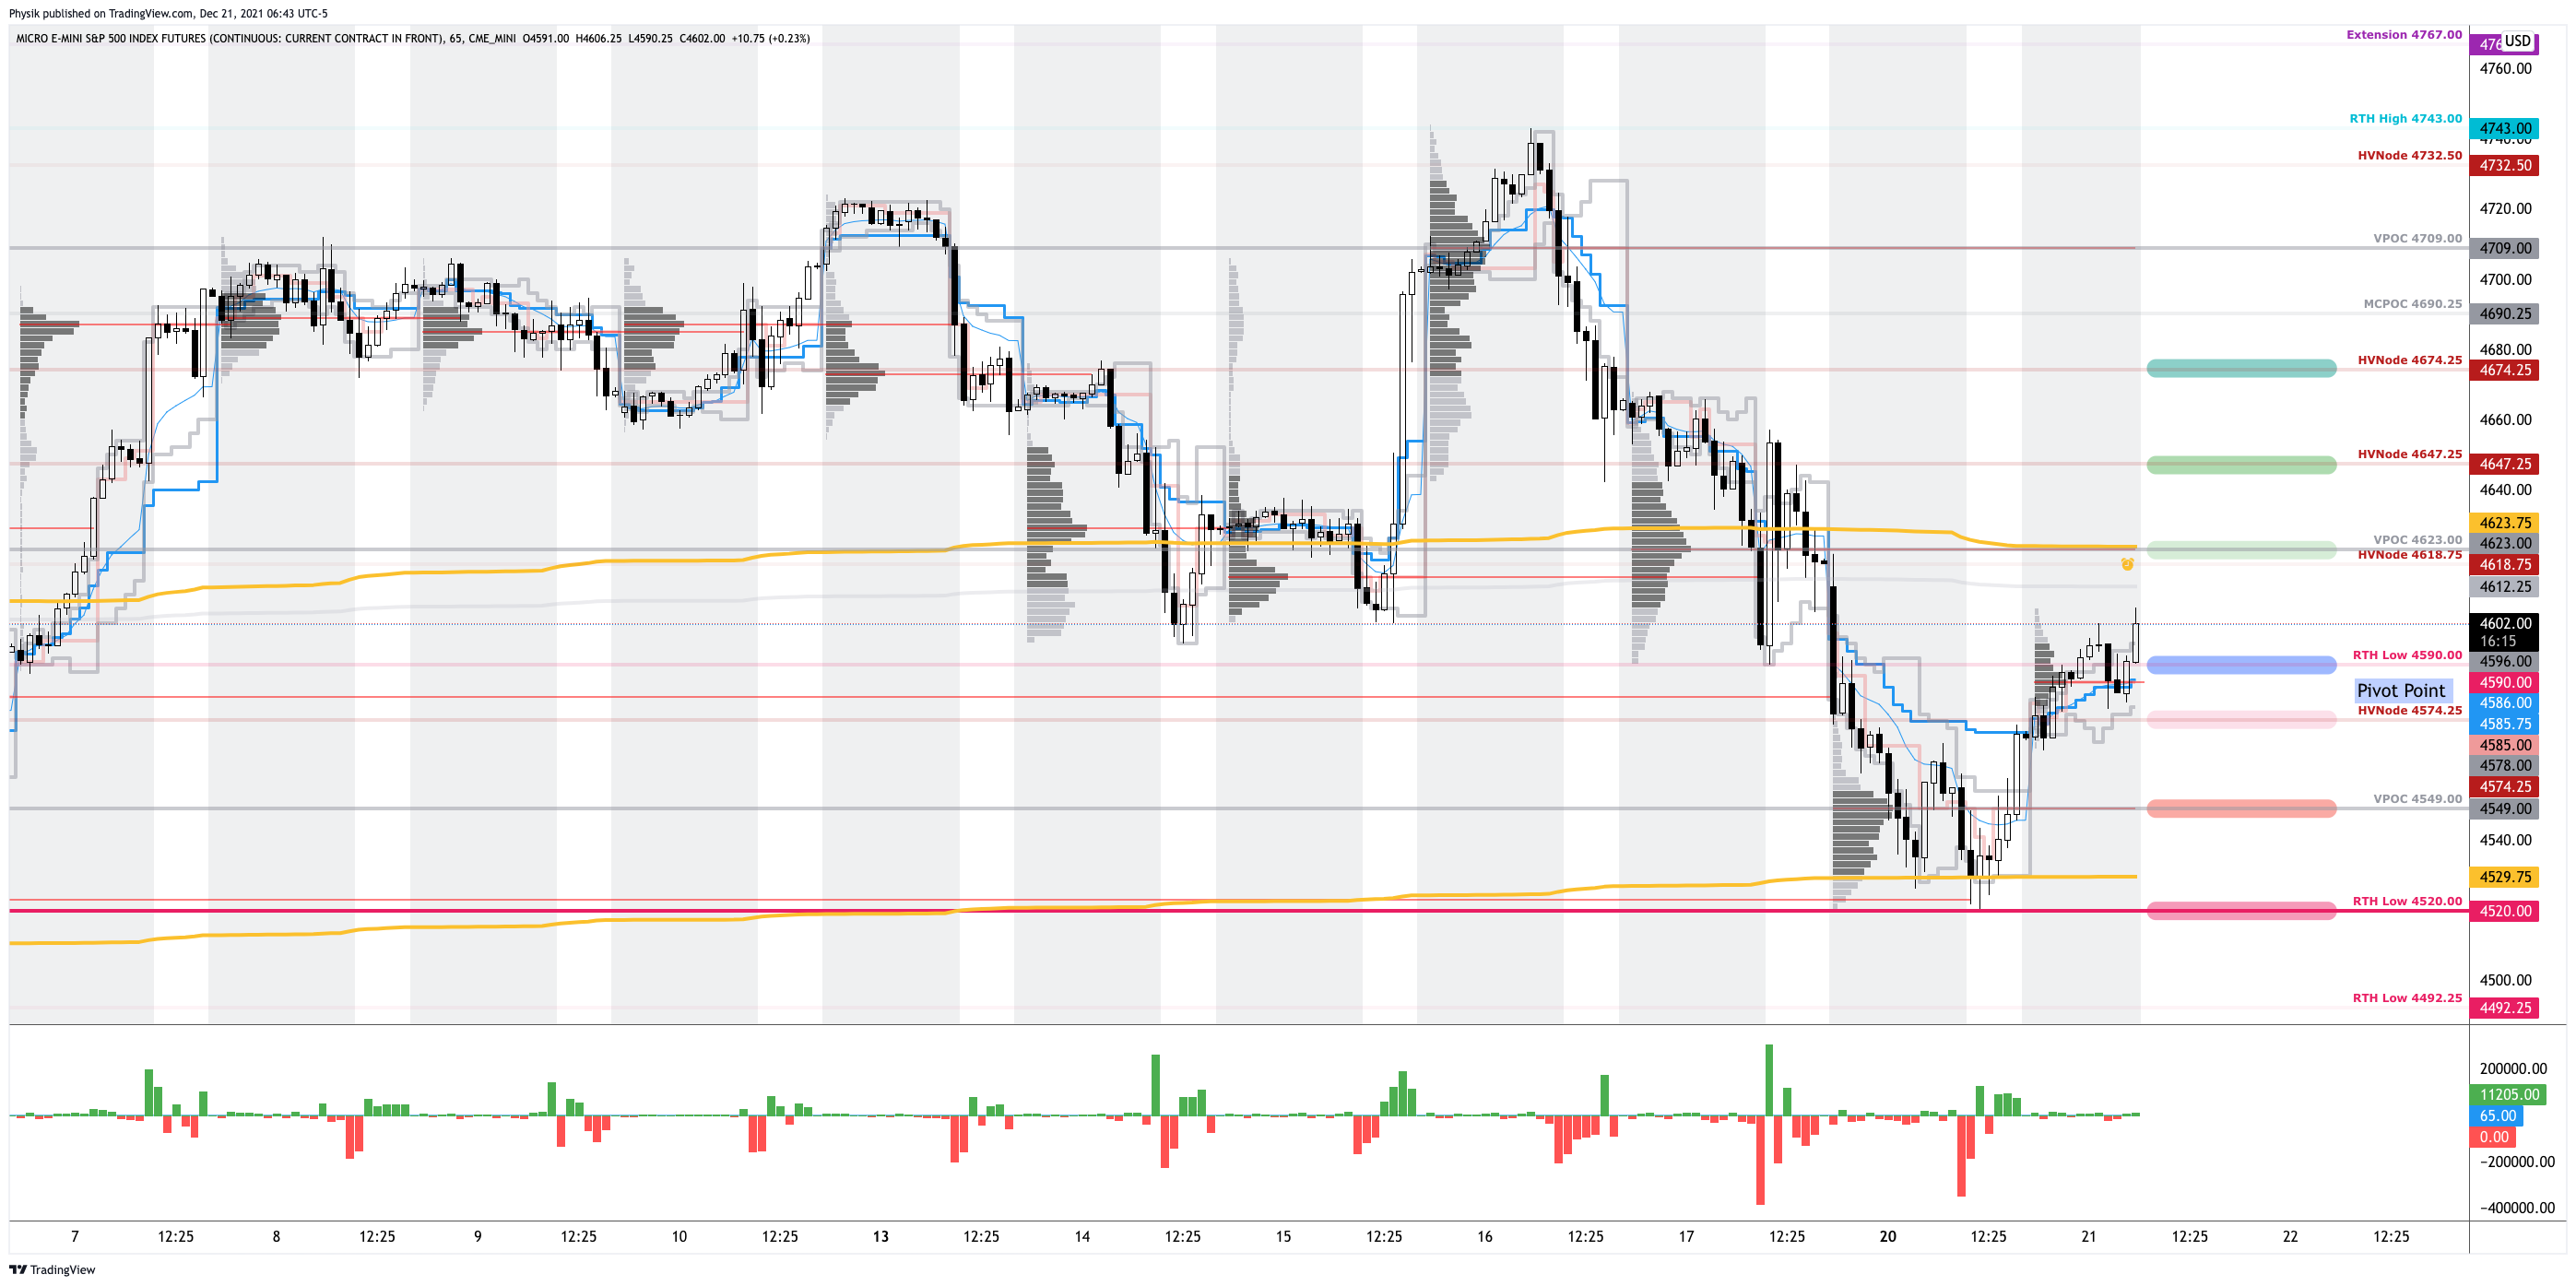
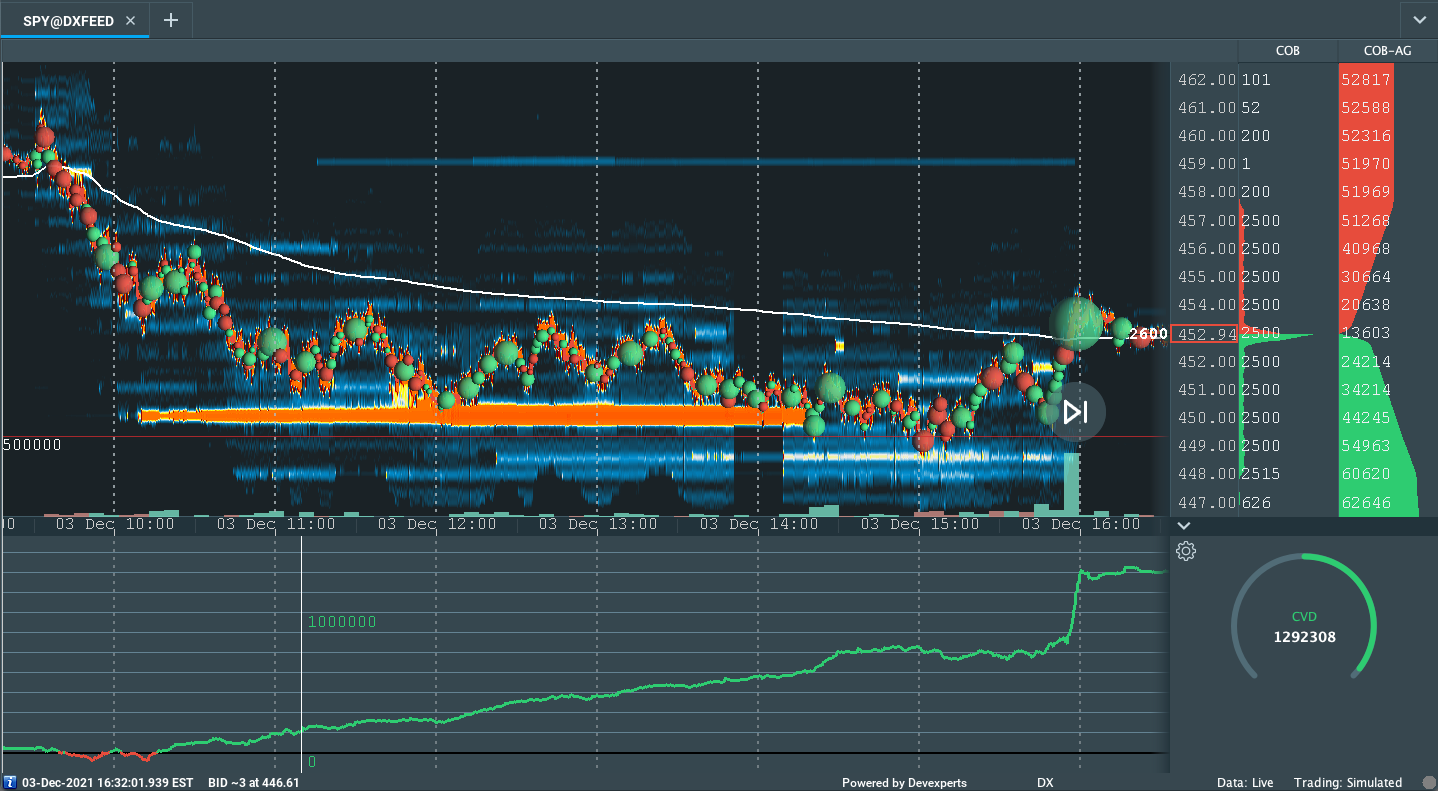
Technical: As of 6:15 AM ET, Monday’s regular session (9:30 AM – 4:00 PM ET), in the S&P 500, will likely open in the lower part of a balanced skewed overnight inventory, outside of prior-range and -value, suggesting a potential for immediate directional opportunity.

Gap Scenarios: Gaps ought to fill quickly. Should they not, that’s a signal of strength; do not fade. Leaving value behind on a gap-fill or failing to fill a gap (i.e., remaining outside of the prior session’s range) is a go-with indicator.

Auctioning and spending at least 1-hour of trade back in the prior range suggests a lack of conviction; in such a case, do not follow the direction of the most recent initiative activity.

In the best case, the S&P 500 trades higher; activity above the $4,381.50 regular trade low (RTH Low) puts in play the $4,449.00 untested point of control (VPOC). Initiative trade beyond the VPOC could reach as high as the $4,486.75 RTH High and $4,526.25 high volume area (HVNode), or higher.

In the worst case, the S&P 500 trades lower; activity below the $4,381.50 RTH Low puts in play the $4,349.00 VPOC. Initiative trade beyond the $4,349.00 VPOC could reach as low as the $4,299.00 and $4,233.00 VPOC, or lower.

Considerations: The daily, weekly, and monthly charts are in alignment. 

The loss of trend across higher timeframes suggests a clear change in tone. This does not discount the potential for fast, but short-lived counter-trend rallies.

Click here to load today’s key levels into the web-based TradingView charting platform. Note that all levels are derived using the 65-minute timeframe. New links are produced, daily.
Graphic: 65-minute profile chart of the Micro E-mini S&P 500 Futures.

Definitions

Volume Areas: A structurally sound market will build on areas of high volume (HVNodes). Should the market trend for long periods of time, it will lack sound structure, identified as low volume areas (LVNodes). LVNodes denote directional conviction and ought to offer support on any test. 

If participants were to auction and find acceptance into areas of prior low volume (LVNodes), then future discovery ought to be volatile and quick as participants look to HVNodes for favorable entry or exit.

POCs: POCs are valuable as they denote areas where two-sided trade was most prevalent in a prior day session. Participants will respond to future tests of value as they offer favorable entry and exit.

Options Expiration (OPEX): Traditionally, option expiries mark an end to pinning (i.e, the theory that market makers and institutions short options move stocks to the point where the greatest dollar value of contracts will expire) and the reduction dealer gamma exposure.

About

After years of self-education, strategy development, mentorship, and trial-and-error, Renato Leonard Capelj began trading full-time and founded Physik Invest to detail his methods, research, and performance in the markets.

Capelj is also a Benzinga finance and technology reporter interviewing the likes of Shark Tank’s Kevin O’Leary, JC2 Ventures’ John Chambers, FTX’s Sam Bankman-Fried, and ARK Invest’s Catherine Wood, as well as a SpotGamma contributor developing insights around impactful options market dynamics.

Disclaimer

Physik Invest does not carry the right to provide advice.

In no way should the materials herein be construed as advice. Derivatives carry a substantial risk of loss. All content is for informational purposes only.

Categories
Commentary

Daily Brief For January 20, 2022

The Daily Brief is a free glimpse into the prevailing fundamental and technical drivers of U.S. equity market products. Join the 200+ that read this report daily, below!

What Happened

Overnight, equity index futures auctioned upward, into the prior day’s range, after some overnight exploration, lower. 

As explained better below, some positioning metrics suggest a bottom (at least near-term) may be in the making.

Ahead is data on jobless claims and manufacturing (8:30 AM ET), as well as home sales (10:00 AM ET).

Graphic updated 6:40 AM ET. Sentiment Neutral if expected /ES open is inside of the prior day’s range. /ES levels are derived from the profile graphic at the bottom of the following section. Levels may have changed since initially quoted; click here for the latest levels. SqueezeMetrics Dark Pool Index (DIX) and Gamma (GEX) calculations are based on where the prior day’s reading falls with respect to the MAX and MIN of all occurrences available. A higher DIX is bullish. At the same time, the lower the GEX, the more (expected) volatility. Learn the implications of volatility, direction, and moneyness. SHIFT data used for S&P 500 (INDEX: SPX) options activity. Note that options flow is sorted by the call premium spent; if more positive, then more was spent on call options. Breadth reflects a reading of the prior day’s NYSE Advance/Decline indicator. VIX reflects a current reading of the CBOE Volatility Index (INDEX: VIX) from 0-100.

What To Expect

Fundamental: The prevailing narrative facing market participants in recent trade is centered around the prospects of contractionary monetary policy in the face of strong economic and earnings growth, as well as cooling inflation while “excess supply” of goods/services builds.

This, as Bloomberg puts it well, “threatens to inject more volatility across a range of assets.” 

As a result, the benefits afforded to holders of diversified portfolios are less.

“If current, priced in, inflation and growth expectations are exactly realized we predict that risk premiums on 30-year yields will increase by 15bp and equity risk premium by 30bp,” which would, according to Damped Spring Advisors, “generate a 2% headwind on long bond prices and a 10% headwind for equity prices.”

Participants are pricing in these expectations, selling heavy the rate-sensitive products, and pushing the Nasdaq into correction territory, yesterday.

Graphic: Per Bloomberg, “The rout pushed the Nasdaq Composite over the threshold into correction territory.”

“Right now you have people waiting before they go and buy back in,” said Jamie Cox, managing partner at Harris Financial Group.

“You have a Fed meeting coming up, so there’s not going to be a lot of movement anywhere until the Fed meeting is over with. You look around, there’s not a lot of problems in the economy, what you have is just the question of, ‘does all this add up to a faster rate hiking cycle that we anticipate?’ And I don’t think so. I think it’s not likely.”

Moreover, unlike the U.S., counterparts elsewhere, in China and Europe, for example, are not looking to tighten as quickly.

“If major economies slam on the brakes or take a U-turn in their monetary policies, there would be serious negative spillovers,” said Chinese President Xi Jinping. 

“They would present challenges to global economic and financial stability, and developing countries would bear the brunt of it.”

For context, China cut its benchmark interest rate to 3.70% (10 basis points), “cement[ing] the pivot to easing.”

Graphic: Per Topdown Charts, “China cuts benchmark interest rate -10bps to 3.70%. i.e. the 1-year LPR [Loan Prime Rate].  n.b. the PBOC also cut the 5-year loan prime rate by -5bps to 4.6%.”

Though this move away from tightening in China is good for assets in that country, emerging markets, and commodities, according to Callum Thomas, an economic slowdown there may foreshadow what is to come in other parts of the world.

Obviously, in saying that plainly, we’re discounting China’s clampdown on its housing and financial sector, but the data seems to suggest the “reopening [and] stimulus-driven global economic rebound may be losing steam headed into 2022.”

Graphic: Per Topdown Charts, OECD leading indicator down sharply from highs.

Stifel Financial Corporation’s (NYSE: SF) Barry Bannister provides us with the implications of tighter U.S. financial conditions: a correction down to $4,200.00 in the S&P 500, near-term.

And, with that, post-correction, equities risk the 3rd bubble in 100 years if the “Fed loses its nerve and cancels much of the tightening plan.”

Graphic: From The Market Ear.

As an aside, to temper some of the bearishness in the above section of the newsletter, here is a chart of S&P 500 returns during Federal Reserve hiking cycles.

Graphic: Via Goldman Sachs Group Inc (NYSE: GS), from The Market Ear.

Positioning: Despite elevated measures of implied volatility like the Cboe Volatility Index (INDEX: VIX), the VIX term structure remains upward sloping, albeit less so than before.

Graphic: VIX term structure shifts higher. The flows associated with hedging protection in the S&P complex ought to pressure the market, should this term structure continue higher.

This is as the unwind of large long-delta positions in heavily weighted index constituents, pre-monthly options expiry (OPEX), alongside demand for downside (put) protection, is finally feeding into the large index products.

Graphic: SpotGamma’s (beta) Hedging Impact Of Real-Time Options (HIRO) indicator suggests Negative options delta trades likely had dealers selling the S&P 500 and Nasdaq 100 ETFs, yesterday.

Moreover, further flattening or inversion of the VIX term structure would clearly coincide with destabilizing demand for protection (as a result of the counterparty supplying protection selling underlying to hedge).

Thus, any expansion in volatility (which could be construed as demand for protection), likely coincides with further weakness.

Notwithstanding, though conditions could worsen, if we take into account options positioning, versus buying pressure (measured via short sales or liquidity provision on the market-making side), metrics remain positively skewed, even more so than before. 

Some sort of bottom (at least near-term) may be in the making.

Graphic: Data SqueezeMetrics. Graph via Physik Invest.

Technical: As of 6:40 AM ET, Thursday’s regular session (9:30 AM – 4:00 PM ET), in the S&P 500, will likely open in the upper part of a positively skewed overnight inventory, inside of prior-range and -value, suggesting a limited potential for immediate directional opportunity.

Spike Scenario In Play: Spike’s mark the beginning of a break from value. Spikes higher (lower) are validated by trade at or above (below) the spike base (i.e., the origin of the spike).

The spike base is at $4,549.00. Above bullish. Below bearish.

In the best case, the S&P 500 trades higher; activity above the $4,565.00 untested point of control (VPOC) puts in play the $4,603.25 low volume area (LVNode). Initiative trade beyond the LVNode could reach as high as the $4,619.00 HVNode and $4,650.75 extended trade low (ETH Low), or higher.

In the worst case, the S&P 500 trades lower; activity below the $4,565.00 VPOC puts in play the $4,514.25 overnight low (ONL). Initiative trade beyond the ONL could reach as low as the $4,492.25 regular trade low (RTH Low) and $4,471.00 VPOC, or lower.

Click here to load today’s key levels into the web-based TradingView charting platform. Note that all levels are derived using the 65-minute timeframe. New links are produced, daily.
Graphic: 65-minute profile chart of the Micro E-mini S&P 500 Futures.

Definitions

Overnight Rally Highs (Lows): Typically, there is a low historical probability associated with overnight rally-highs (lows) ending the upside (downside) discovery process.

Volume Areas: A structurally sound market will build on areas of high volume (HVNodes). Should the market trend for long periods of time, it will lack sound structure, identified as low volume areas (LVNodes). LVNodes denote directional conviction and ought to offer support on any test. 

If participants were to auction and find acceptance into areas of prior low volume (LVNodes), then future discovery ought to be volatile and quick as participants look to HVNodes for favorable entry or exit.

POCs: POCs are valuable as they denote areas where two-sided trade was most prevalent in a prior day session. Participants will respond to future tests of value as they offer favorable entry and exit.

MCPOCs: POCs are valuable as they denote areas where two-sided trade was most prevalent over numerous day sessions. Participants will respond to future tests of value as they offer favorable entry and exit.

Options Expiration (OPEX): Traditionally, option expiries mark an end to pinning (i.e, the theory that market makers and institutions short options move stocks to the point where the greatest dollar value of contracts will expire) and the reduction dealer gamma exposure.

About

After years of self-education, strategy development, mentorship, and trial-and-error, Renato Leonard Capelj began trading full-time and founded Physik Invest to detail his methods, research, and performance in the markets.

Capelj is also a Benzinga finance and technology reporter interviewing the likes of Shark Tank’s Kevin O’Leary, JC2 Ventures’ John Chambers, FTX’s Sam Bankman-Fried, and ARK Invest’s Catherine Wood, as well as a SpotGamma contributor developing insights around impactful options market dynamics.

Disclaimer

Physik Invest does not carry the right to provide advice.

In no way should the materials herein be construed as advice. Derivatives carry a substantial risk of loss. All content is for informational purposes only.

Categories
Commentary

Daily Brief For January 19, 2022

The Daily Brief is a free glimpse into the prevailing fundamental and technical drivers of U.S. equity market products. Join the 200+ that read this report daily, below!

What Happened

Overnight, equity index futures explored lower and hammered out a low. On that recovery, measures of implied volatility fell, and most commodity products and yields moved higher.

Ahead is data on Building Permits and Housing Starts (8:30 AM ET).

Graphic updated 6:30 AM ET. Sentiment Neutral if expected /ES open is inside of the prior day’s range. /ES levels are derived from the profile graphic at the bottom of the following section. Levels may have changed since initially quoted; click here for the latest levels. SqueezeMetrics Dark Pool Index (DIX) and Gamma (GEX) calculations are based on where the prior day’s reading falls with respect to the MAX and MIN of all occurrences available. A higher DIX is bullish. At the same time, the lower the GEX, the more (expected) volatility. Learn the implications of volatility, direction, and moneyness. SHIFT data used for S&P 500 (INDEX: SPX) options activity. Note that options flow is sorted by the call premium spent; if more positive, then more was spent on call options. Breadth reflects a reading of the prior day’s NYSE Advance/Decline indicator. VIX reflects a current reading of the CBOE Volatility Index (INDEX: VIX) from 0-100.

What To Expect

Fundamental: Narratives discussed, before, remain valid. 

Mainly, expected is strong economic and earnings growth, as well as cooling inflation.

However, according to a note published by Andy Constan of Damped Spring Advisors, “The lack of additional liquidity provided by Fed purchase will also remove a damper for the market and the economy keeping asset volatility well bid, while also causing asset diversification benefit to fall, generating rising portfolio volatility and the risk demanded to hold assets.”

Graphic: From Goldman Sachs (NYSE: GS). The Market Ear recaps: “Bigger moves in yields eventually spill over to SPX. We basically had the 2 sigma move in rates…and equities are behaving as they should.”

The Ambrus Group’s Kris Sidial made a great point, yesterday, too.

Basically, despite that the market is off about 5% from its highs, the go-to 60/40 portfolio and “diversified funds” are in turmoil.

This newsletter has touched on the “bonds down, equities down” dynamic in the past. 

In short, over the past 40 or so years, monetary policy was used as a crutch to support the economy. This promoted deflation, innovation, and the subsequent rise in valuations.

With rates near zero and lifting, that’s a headwind; coupled with participants’ increased exposure to rate and equity market risk, which can play into cross-market hedging and de-leveraging cascades, 60/40 turns into somewhat of a poor hedge.

Why? Higher rates have the potential to decrease the present value of future earnings, making stocks, especially those that are high growth, less attractive.

Putting it all together, per Constan, “If current, priced in, inflation and growth expectations are exactly realized we predict that risk premiums on 30-year yields will increase by 15bp and equity risk premium by 30bp,” Constan adds. 

“These risk premium expansions will generate a 2% headwind on long bond prices and a 10% headwind for equity prices.”

Morgan Stanley (NYSE: MS) strategists are in agreement.

“With our economic team’s new Fed forecast for the end of QE, 4 rate hikes, and the beginning of balance sheet normalization this year, our call for falling valuations is likely to happen faster and more broadly than our prior forecast.”

Also: “Companies have expedited supplies, they’ve hired a bunch of labor at higher prices and if there’s excess supply now in the first or second quarter, potentially temporarily that could lead to margin compressions.”

Graphic: Via comments made by Morgan Stanley’s (NYSE: MS) U.S. equity strategist Michael Wilson, “Our new Fed forecast simply brings forward our call for lower equity valuations and raises the risk in the first half of the year. The median stock remains expensive even though the most egregiously priced stocks have corrected.”

It’s looking like Ark Invest’s Catherine Wood hit the nail on the head with respect to her comments on inventory build-ups. 

Early in November, as this newsletter highlighted, the CIO said inflation was likely on its way out due to (1) productivity increases, (2) China housing and financial sector turmoil depressing commodity prices, (3) inventory build-ups, and (4) disruptive innovation.

“This is unsustainable,” she had said. “I’m wondering if even the housing market inflation is going to give way, here.”

Positioning: Despite elevated measures of implied volatility like the Cboe Volatility Index (INDEX: VIX) marking higher, the VIX term structure remains upward sloping. 

Graphic: VIX term structure via Vix Central. 

All that means is that we have yet to similar levels of destabilizing demand for protection. 

Graphic: SqueezeMetrics details the implications of customer activity in the options market, on the underlying’s order book. In buying a put, customers indirectly take liquidity as dealers, short the put, sell underlying to hedge. With higher levels of implied volatility, dealers’ exposure to direction increases. They hedge by selling more underlying.

Though conditions could worsen, taking into account options positioning, versus buying pressure (measured via short sales or liquidity provision on the market-making side), metrics remain positively skewed, more so than before.

Graphic: Data SqueezeMetrics. Graph via Physik Invest.

Any expansion in volatility, however, likely coincides with further weakness.

As a result, this, coupled with data that suggests “OPEX week returns peaked in 2016 and have trended lower since,” cautions us on trade into and after this week’s expiration of options on the VIX and equity products.

Technical: As of 6:30 AM ET, Wednesday’s regular session (9:30 AM – 4:00 PM ET), in the S&P 500, will likely open in the upper part of a negatively skewed overnight inventory, inside of prior-range and -value, suggesting a limited potential for immediate directional opportunity.

In the best case, the S&P 500 trades higher; activity above the $4,574.25 high volume area (HVNode) puts in play the $4,593.00 point of control (POC). Initiative trade beyond the POC could reach as high as the $4,619.00 HVNode and $4,650.75 extended trading hours low (ETH Low), or higher.

In the worst case, the S&P 500 trades lower; activity below the $4,574.25 HVNode puts in play the $4,535.50 overnight low (ONL). Initiative trade beyond the ONL could reach as low as the $4,520.00 and $4,492.00 regular trade low (RTH Low), or lower.

Click here to load today’s key levels into the web-based TradingView charting platform. Note that all levels are derived using the 65-minute timeframe. New links are produced, daily.
Graphic: 65-minute profile chart of the Micro E-mini S&P 500 Futures.

Definitions

Overnight Rally Highs (Lows): Typically, there is a low historical probability associated with overnight rally-highs (lows) ending the upside (downside) discovery process.

Volume Areas: A structurally sound market will build on areas of high volume (HVNodes). Should the market trend for long periods of time, it will lack sound structure, identified as low volume areas (LVNodes). LVNodes denote directional conviction and ought to offer support on any test. 

If participants were to auction and find acceptance into areas of prior low volume (LVNodes), then future discovery ought to be volatile and quick as participants look to HVNodes for favorable entry or exit.

DIX: For every buyer is a seller (usually a market maker). Using DIX — which is derived from short sales (i.e., liquidity provision on the market-making side) — we can measure buying pressure.

Vanna: The rate at which the delta of an option changes with respect to volatility.

Charm: The rate at which the delta of an option changes with respect to time.

POCs: POCs are valuable as they denote areas where two-sided trade was most prevalent in a prior day session. Participants will respond to future tests of value as they offer favorable entry and exit.

MCPOCs: POCs are valuable as they denote areas where two-sided trade was most prevalent over numerous day sessions. Participants will respond to future tests of value as they offer favorable entry and exit.

Options Expiration (OPEX): Traditionally, option expiries mark an end to pinning (i.e, the theory that market makers and institutions short options move stocks to the point where the greatest dollar value of contracts will expire) and the reduction dealer gamma exposure.

Inversion Of VIX Futures Term Structure: Longer-dated VIX expiries are less expensive; is a warning of elevated near-term risks for equity market stability.

About

After years of self-education, strategy development, mentorship, and trial-and-error, Renato Leonard Capelj began trading full-time and founded Physik Invest to detail his methods, research, and performance in the markets.

Capelj is also a Benzinga finance and technology reporter interviewing the likes of Shark Tank’s Kevin O’Leary, JC2 Ventures’ John Chambers, FTX’s Sam Bankman-Fried, and ARK Invest’s Catherine Wood, as well as a SpotGamma contributor developing insights around impactful options market dynamics.

Disclaimer

Physik Invest does not carry the right to provide advice.

In no way should the materials herein be construed as advice. Derivatives carry a substantial risk of loss. All content is for informational purposes only.

Categories
Commentary

Daily Brief For January 18, 2022

The Daily Brief is a free glimpse into the prevailing fundamental and technical drivers of U.S. equity market products. Join the 200+ that read this report daily, below!

What Happened

Overnight, equity index futures auctioned lower alongside a surge in bond yields. Rate-sensitive sectors were weakest in pre-market trade, in comparison to the value and cyclical names. 

Earnings are now in focus. Participants shall use earnings updates to gauge how companies are performing in spite of omicron, among other challenges.

Ahead is data on the Empire Manufacturing Index (8:30 AM ET) and NAHB Home Builders Index (10:00 AM ET). 

Graphic updated 6:30 AM ET. Sentiment Risk-Off if expected /ES open is below the prior day’s range. /ES levels are derived from the profile graphic at the bottom of the following section. Levels may have changed since initially quoted; click here for the latest levels. SqueezeMetrics Dark Pool Index (DIX) and Gamma (GEX) calculations are based on where the prior day’s reading falls with respect to the MAX and MIN of all occurrences available. A higher DIX is bullish. At the same time, the lower the GEX, the more (expected) volatility. Learn the implications of volatility, direction, and moneyness. SHIFT data used for S&P 500 (INDEX: SPX) options activity. Note that options flow is sorted by the call premium spent; if more positive, then more was spent on call options. Breadth reflects a reading of the prior day’s NYSE Advance/Decline indicator. VIX reflects a current reading of the CBOE Volatility Index (INDEX: VIX) from 0-100.

What To Expect

Fundamental: Ahead of earnings releases from Goldman Sachs Group (NYSE: GS), Morgan Stanley (NYSE: MS), Bank of America (NYSE: BAC), and Netflix (NASDAQ: NFLX), as well as key rate decisions, indices sold heavy. 

The Nasdaq 100 led the decline after holiday-trade, Monday, as yields surged alongside concerns central banks would tighten monetary policy sooner than expected.

This is as higher rates have the potential to decrease the present value of future earnings, making stocks, especially those that are high growth, less attractive. 

“The rationale behind this is the trade-off,” Grit Capital put well in a recent newsletter

“Why would I park my money somewhere that is only yielding 1%, when I can invest in riskier assets that can raise my return?”

Graphic: Per Grit Capital, “A common proxy that a lot of people look at is the S&P500’s earnings yield (yellow) vs. the 10yr (white).”

At the same time, narratives around quantitative tightening (i.e., the reduction in the size of the Federal Reserve’s balance sheet) are growing louder.

Graphic: QT mechanics per The Macro Compass.

This is what Andy Constan of Damped Spring Advisors refers to as the QT drumbeat. 

This drumbeat is to intensify in spite of strong economic and earnings growth, as well as a moderation in inflation, Constan says

“The lack of additional liquidity provided by Fed purchase will also remove a damper for the market and the economy keeping asset volatility well bid, while also causing asset diversification benefit to fall, generating rising portfolio volatility and the risk demanded to hold assets.”

Note: Check out this Constan’s really interesting story, below!

Graphic: Via The Market Ear, “Temporary relief from Powell – slow reverse QE’ confirmed. Powell says Fed will stop replacing maturing bonds, but will not sell holdings: slow QT.”

“If current, priced in, inflation and growth expectations are exactly realized we predict that risk premiums on 30-year yields will increase by 15bp and equity risk premium by 30bp,” Constan adds. “These risk premium expansions will generate a 2% headwind on long bond prices and a 10% headwind for equity prices.”

Constan’s comments line up with that of Morgan Stanley’s which sees markets selling down 10-20% during H1 2022, as expectations call for five 25 bp hikes. History is in alignment, below.

Graphic: S&P 500 performance before and after rate hikes, via The Market Ear.

So, despite recent inflows and “light positioning,” taking all of the above comments together, the window for stocks to rally is closing.

Positioning: The coming January 19 expiration of options on the Cboe Volatility Index (INDEX: VIX) and January 21 monthly equity options expiration (OPEX) has major implications.

According to Constan, the “[o]ptions expiration which includes lots of LEAP contracts will be a catalyst for a squeeze rally and a post-OpEx sell-off.”

This is as, according to Kai Volatility’s Cem Karsan, there is a constant structural positioning that naturally drives markets higher.

“I use this analogy of a jet,” he explained, referencing the three factors – the change in the underlying price (gamma), implied volatility (vanna), and time (charm) – that are well known to impact an options exposure to directional risk or delta. 

“[T]he hedging vanna and charm flows, and whatnot will push the markets higher.”

To note, though, with narratives around higher rates and QT strengthening, so to speak, divergences between the S&P 500 and metrics like the Bond Closed-End Fund (CEF) Advance-Decline line have already appeared.

As McClellan Financial Publications explains, “liquidity has suddenly become a problem, and it is affecting the more liquidity-sensitive issues first. That can be a prelude to that same illiquidity coming around and biting the big cap stocks that drive the major averages.”

Graphic: Bond CEF A-D showing liquidity problems, via McClellan Financial Publications.

As an aside, some believe that the Fed’s removal of liquidity has the potential to prick the bubble, prompting a cascading reaction that exacerbates underlying price movements.

“It’s not a coincidence that the mid-February to mid-March 2020 downturn literally started the day after February expiration and ended the day of March quarterly expiration,” Karsan adds. 

“These derivatives are incredibly embedded in how the tail reacts and there’s not enough liquidity, given the leverage, if the Fed were to taper.”

Technical: As of 6:30 AM ET, Tuesday’s regular session (9:30 AM – 4:00 PM ET), in the S&P 500, will likely open in the lower part of a negatively skewed overnight inventory, outside of prior-range and -value, suggesting a potential for immediate directional opportunity.

Gap Scenarios: Gaps ought to fill quickly. Should they not, that’s a signal of strength; do not fade. Leaving value behind on a gap-fill or failing to fill a gap (i.e., remaining outside of the prior session’s range) is a go-with indicator.

Auctioning and spending at least 1-hour of trade back in the prior range suggests a lack of conviction; in such a case, do not follow the direction of the most recent initiative activity.

In the best case, the S&P 500 trades higher; activity above the $4,593.00 point of control (POC) puts in play the $4,624.75 low volume area (LVNode). Initiative trade beyond the LVNode could reach as high as the $4,633.00 POC and $4,650.75 regular trade low (RTH Low), or higher.

In the worst case, the S&P 500 trades lower; activity below the $4,593.00 POC puts in play the $4,574.25 high volume area (HVNode). Initiative trade beyond the HVNode could reach as low as the $4,549.00 VPOC and $4,520.00 RTH Low, or lower.

Considerations: The S&P 500 remains above its 200-day simple moving average. The long-term trend remains up.

Click here to load today’s key levels into the web-based TradingView charting platform. Note that all levels are derived using the 65-minute timeframe. New links are produced, daily.
Graphic: 65-minute profile chart of the Micro E-mini S&P 500 Futures.

Definitions

Volume Areas: A structurally sound market will build on areas of high volume (HVNodes). Should the market trend for long periods of time, it will lack sound structure, identified as low volume areas (LVNodes). LVNodes denote directional conviction and ought to offer support on any test. 

If participants were to auction and find acceptance into areas of prior low volume (LVNodes), then future discovery ought to be volatile and quick as participants look to HVNodes for favorable entry or exit.

POCs: POCs are valuable as they denote areas where two-sided trade was most prevalent in a prior day session. Participants will respond to future tests of value as they offer favorable entry and exit.

MCPOCs: POCs are valuable as they denote areas where two-sided trade was most prevalent over numerous day sessions. Participants will respond to future tests of value as they offer favorable entry and exit.

Options Expiration (OPEX): Traditionally, option expiries mark an end to pinning (i.e, the theory that market makers and institutions short options move stocks to the point where the greatest dollar value of contracts will expire) and the reduction dealer gamma exposure.

About

After years of self-education, strategy development, mentorship, and trial-and-error, Renato Leonard Capelj began trading full-time and founded Physik Invest to detail his methods, research, and performance in the markets.

Capelj is also a Benzinga finance and technology reporter interviewing the likes of Shark Tank’s Kevin O’Leary, JC2 Ventures’ John Chambers, FTX’s Sam Bankman-Fried, and ARK Invest’s Catherine Wood, as well as a SpotGamma contributor developing insights around impactful options market dynamics.

Disclaimer

Physik Invest does not carry the right to provide advice.

In no way should the materials herein be construed as advice. Derivatives carry a substantial risk of loss. All content is for informational purposes only.

Categories
Commentary

Daily Brief For December 29, 2021

Notice: Given travel commitments, commentaries will be suspended until January 3, 2022. 

As an aside, I’m sincerely honored to have you as a subscriber. 

This newsletter began as a tool to hold myself accountable for objectively assessing dominant narratives and market-generated information. 

Since launching, this commentary has grown. Content and engagement have improved.

Now, with many of the 200 or so of you that are reading this actively, I have spoken with via email, and the like, regarding trader development, among many other things.

When it comes to markets, at the end of the day, whether you’re at a bank (as some of you are) or at home, we’re all alone. The implications of this are staggering.

How are we to objectively assess and act on what the market is signaling to us with no framework or community to work off of?

That’s the problem and I hope to make a bigger impact, going forward.

Wishing you good health and success next year and beyond!

Best, 

Renato

What Happened

In the face of a “stealth correction,” and an “off-loading of risk” by professionals, the S&P 500 remains strong further bolstered by options selling and volatility compression.

This is as less heavily-weighted constituents remain volatile; with hedging pressures sticky at the index level, the only reconciliation can be a decline in correlation. 

As liquidity remains “holiday-thinned,” so to speak, coming into Friday’s weighty “Quarterlys” options expiration, positioning metrics suggest indices ought to stick at higher prices.

Thereafter, expect increased movement.

Moreover, ahead is data on trade in goods (8:30 AM ET) and pending home sales (10:00 AM ET).

Graphic updated 6:30 AM ET. Sentiment Neutral if expected /ES open is inside of the prior day’s range. /ES levels are derived from the profile graphic at the bottom of the following section. Levels may have changed since initially quoted; click here for the latest levels. SqueezeMetrics Dark Pool Index (DIX) and Gamma (GEX) calculations are based on where the prior day’s reading falls with respect to the MAX and MIN of all occurrences available. A higher DIX is bullish. At the same time, the lower the GEX, the more (expected) volatility. Learn the implications of volatility, direction, and moneyness. SHIFT data used for S&P 500 (INDEX: SPX) options activity. Note that options flow is sorted by the call premium spent; if more positive then more was spent on call options. Breadth reflects a reading of the prior day’s NYSE Advance/Decline indicator. VIX reflects a current reading of the CBOE Volatility Index (INDEX: VIX) from 0-100.

What To Expect

Given the persistence of responses to technical levels, weaker-handed participants (which seldom bear the wherewithal to defend retests) carry a heavier hand in recent price discovery.

Via volume profile analysis, we see a plethora of low-volume pockets – voids, if you will – that likely hold virgin tests. Successful penetration often portends follow-through as the participants that were most active at those levels (quickly run for the exits when wrong).

Context: In the face of market internals that look weaker than at any time since March of last year, the S&P 500 remains strong, relative to its counterparts.

As alluded to in a prior section, the commitment of capital on lower volatility is upping the dealers’ addition of liquidity, which supports high prices but may limit further price discovery.

Why? When a position’s delta rises with stock or index price rises, gamma – the expected change in delta given movement in the underlying – is added to delta. 

According to SpotGamma, “[a]s participants keep adding to their bets at $4,800.00, the dealer only takes on more exposure to positive gamma.”

Graphic: Via SpotGamma. “Based on the fact that we are at the S&P Call Wall and are approaching this large OPEX, we look for a pause and some consolidation in markets here.”

So, with liquidity “holiday-thinned,” so to speak, and participants’ concentration of activity in near-the-money options strikes, coming into this week’s “Quarterlys” options expiration, indices are to remain pinned.

After Friday, the market is more susceptible to fundamental forces as, according to SpotGamma, there will be “a decrease in sticky gamma hedging.”

Couple current options positioning and buying pressure – via short sales or liquidity provision on the market-making side – metrics suggest middling returns 1-month out, or so.

Graphic: Data SqueezeMetrics. Graph via Physik Invest.

Moreover, the expectation is that positive fundamental forces and dealers’ covering of hedges to remaining “put-heavy” positioning bolster seasonally-aligned price rise in January.

Graphic: Per The Market Ear, “January typically sees 134% of inflows (the rest of the 11 months -34%). And with every private wealth manager in the world right now pitching increased allocations into equities (out of cash and out of bonds), Goldman calculates that keeping 2021 pace, This would be $125BN worth of inflows quickly in January.”

In anticipation of higher prices, low cost, complex options structures like call-side calendars, butterflies, and ratio spreads are still top of mind. 

After a fast move higher over the past week or so, with positioning metrics as they are, it does not make sense to commit massive debits to static or variable long-delta trades. Cost matters.

Graphic: Via Banco Santander SA (NYSE: SAN) research, the return profile, at expiry, of a classic 1×2 (long 1, short 2 further away) ratio spread.

Expectations: As of 6:30 AM ET, Wednesday’s regular session (9:30 AM – 4:00 PM ET), in the S&P 500, will likely open in the middle part of a balanced overnight inventory, inside of prior-range and -value, suggesting a limited potential for immediate directional opportunity.

Spike Rules In Play: Spike’s mark the beginning of a break from value. Spikes higher (lower) are validated by trade at or above (below) the spike base (i.e., the origin of the spike). 

The spike base is $4,776.00. Below bearish (change in tone). Above bullish (status quo).

In the best case, the S&P 500 trades sideways or higher; activity above the $4,781.75 high volume area (HVNode) puts in play the $4,798.00 minimal excess. Initiative trade beyond the minimal excess could reach as high as the $4,805.50 and $4,815.00 extension, or higher.

In the worst case, the S&P 500 trades lower; activity below the $4,781.75 HVNode puts in play the $4,770.50 regular trade low (RTH Low). Initiative trade beyond the RTH Low could reach as low as the $4,732.50 HVNode and $4,717.25 low volume area (LVNode), or lower.

Click here to load today’s key levels into the web-based TradingView charting platform. Note that all levels are derived using the 65-minute timeframe. New links are produced, daily.
Graphic: 65-minute profile chart of the Micro E-mini S&P 500 Futures. Learn about the profile.

What People Are Saying

Definitions

Volume Areas: A structurally sound market will build on areas of high volume (HVNodes). Should the market trend for long periods of time, it will lack sound structure, identified as low volume areas (LVNodes). LVNodes denote directional conviction and ought to offer support on any test. 

If participants were to auction and find acceptance into areas of prior low volume (LVNodes), then future discovery ought to be volatile and quick as participants look to HVNodes for favorable entry or exit.

Excess: A proper end to price discovery; the market travels too far while advertising prices. Responsive, other-timeframe (OTF) participants aggressively enter the market, leaving tails or gaps which denote unfair prices.

Volume-Weighted Average Prices (VWAPs): A metric highly regarded by chief investment officers, among other participants, for quality of trade. Additionally, liquidity algorithms are benchmarked and programmed to buy and sell around VWAPs.

About

After years of self-education, strategy development, and trial-and-error, Renato Leonard Capelj began trading full-time and founded Physik Invest to detail his methods, research, and performance in the markets.

Additionally, Capelj is a Benzinga finance and technology reporter interviewing the likes of Shark Tank’s Kevin O’Leary, JC2 Ventures’ John Chambers, and ARK Invest’s Catherine Wood, as well as a SpotGamma contributor, helping develop insights around impactful options market dynamics.

Disclaimer

At this time, Physik Invest does not carry the right to provide advice. In no way should the materials herein be construed as advice. Derivatives carry a substantial risk of loss. All content is for informational purposes only.

Categories
Commentary

Daily Brief For December 21, 2021

What Happened

After Monday’s post-options expiration (OPEX) positioning reset, equity index futures traded higher alongside no impactful news developments.

The rate-sensitive and growth-heavy Russell 2000 and Nasdaq 100 led the advance, a change in tone. The S&P 500 was up nearly 1.00% in early trade while volatility came in, markedly, with the CBOE Volatility Index printing 21 versus 27, yesterday.

Ahead is data on the current account deficit (8:30 AM ET).

Graphic updated 6:40 AM ET. Sentiment Risk-On if expected /ES open is above the prior day’s range. /ES levels are derived from the profile graphic at the bottom of the following section. Levels may have changed since initially quoted; click here for the latest levels. SqueezeMetrics Dark Pool Index (DIX) and Gamma (GEX) calculations are based on where the prior day’s reading falls with respect to the MAX and MIN of all occurrences available. A higher DIX is bullish. At the same time, the lower the GEX, the more (expected) volatility. Learn the implications of volatility, direction, and moneyness. SHIFT data used for S&P 500 (INDEX: SPX) options activity. Note that options flow is sorted by the call premium spent; if more positive then more was spent on call options. Breadth reflects a reading of the prior day’s NYSE Advance/Decline indicator. VIX reflects a current reading of the CBOE Volatility Index (INDEX: VIX) from 0-100.

What To Expect

On weak intraday breadth and divergent market liquidity metrics, the best case outcome occurred; responsive buyers surfaced at key areas of resting liquidity.

The response just so happened to coincide with the $4,523.00 /ES untested point of control (VPOC). This technically-sensitive trade seems to suggest that weaker-handed participants, which act on visual cues, are very much in control.

Moreover, the overnight follow-through on that buying resulted in a large gap that places the S&P 500 back in prior range, a clear rejection of Monday’s bearish price exploration.

Graphic: Divergent delta (i.e., non-committed selling as measured by volume delta or buying and selling power as calculated by the difference in volume traded at the bid and offer) in SPDR S&P 500 ETF Trust (NYSE: SPY), one of the largest ETFs that track the S&P 500 index, via Bookmap. The readings are supportive of responsive trade (i.e., rotational trade that suggests current prices offer favorable entry and exit; the market is in balance).

Context: Have to keep it short, today, sorry!

In recapping yesterday’s on-point write-up, the thesis is as follows: divergent breadth, and what remained of “put-heavy” positioning, coupled with recent fundamental developments, fed into lower index prices.

According to the options modeling and analysis service SpotGamma, the December 17 options expiration (OPEX) cleared quite a bit of negative delta (e.g., the ARK Innovation ETF [NYSE: ARKK] had $1.5 billion in notional put delta expire) which, in theory, should open a window of strength and realized volatility, wherein positive fundamental forces and dealers’ covering of hedges would bolster any recovery.

With breadth still to recover, early expansion of range, this week, placed major products at key visual support; to note, responsive buying by short-term, visual traders seldom are defended.

At the same time, presented were dynamics such as the eventual management of big S&P positions, and relentless, seasonally-aligned “passive buying support,” in the face of expectations there will be “the strongest quarterly nominal [economic] growth in more than three decades.”

Graphic: Positively skewed return distribution amidst “natural, passive buying,” and supportive positioning metrics. Data SqueezeMetrics. Graph via Physik Invest.

Data Trek made comments with respect to the path of earnings surprises, a factor behind the persistence of this year’s S&P 500 rally; “This week’s upward revisions should have the same ability to backstop equities as we wrap up the year. The operative word is ‘should’, of course, and we do expect further volatility this week.”

With participants flush with cash, so to speak, will FOMO (fear of missing out) sentiment appear?

Net flows into global equity funds, out of cash equivalents, is one indicator to watch.

Graphic: Via The Market Ear. “Net flows into global equity funds rebounded in the week ending December 15 (+$32bn vs +$11bn the prior week) due to a surge in demand for US-dedicated products. Money market fund assets declined by $40bn.”

Expectations: As of 6:40 AM ET, Tuesday’s regular session (9:30 AM – 4:00 PM ET), in the S&P 500, will likely open in the upper part of a positively skewed overnight inventory, outside of prior-range and -value, suggesting a potential for immediate directional opportunity.

Gap Scenarios: Gaps ought to fill quickly. Should they not, that’s a signal of strength; do not fade. Leaving value behind on a gap-fill or failing to fill a gap (i.e., remaining outside of the prior session’s range) is a go-with indicator.

Auctioning and spending at least 1-hour of trade back in the prior range suggests a lack of conviction; in such a case, do not follow the direction of the most recent initiative activity.

In the best case, the S&P 500 trades sideways or higher; activity above the $4,590.00 regular trade low (RTH Low) puts in play the $4,623.00 VPOC. Initiative trade beyond the VPOC could reach as high as the $4,647.25 and $4,674.25 high volume area (HVNode), or higher.

In the worst case, the S&P 500 trades lower; activity below the $4,590.00 RTH Low puts in play the $4,574.25 high volume area (HVNode). Initiative trade beyond the HVNode could reach as low as the $4,549.00 VPOC and $4,520.00 RTH Low, or lower.

Click here to load today’s key levels into the web-based TradingView charting platform. Note that all levels are derived using the 65-minute timeframe. New links are produced, daily.
Graphic: 65-minute profile chart of the Micro E-mini S&P 500 Futures. Learn about the profile.

What People Are Saying

Definitions

Volume Areas: A structurally sound market will build on areas of high volume (HVNodes). Should the market trend for long periods of time, it will lack sound structure, identified as low volume areas (LVNodes). LVNodes denote directional conviction and ought to offer support on any test. 

If participants were to auction and find acceptance into areas of prior low volume (LVNodes), then future discovery ought to be volatile and quick as participants look to HVNodes for favorable entry or exit.

POCs: POCs are valuable as they denote areas where two-sided trade was most prevalent in a prior day session. Participants will respond to future tests of value as they offer favorable entry and exit.

Volume-Weighted Average Prices (VWAPs): A metric highly regarded by chief investment officers, among other participants, for quality of trade. Additionally, liquidity algorithms are benchmarked and programmed to buy and sell around VWAPs.

Rates: Low rates have to potential to increase the present value of future earnings making stocks, especially those that are high growth, more attractive. To note, inflation and rates move inversely to each other. Low rates stimulate demand for loans (i.e., borrowing money is more attractive).

About

After years of self-education, strategy development, and trial-and-error, Renato Leonard Capelj began trading full-time and founded Physik Invest to detail his methods, research, and performance in the markets.

Additionally, Capelj is a Benzinga finance and technology reporter interviewing the likes of Shark Tank’s Kevin O’Leary, JC2 Ventures’ John Chambers, and ARK Invest’s Catherine Wood, as well as a SpotGamma contributor, helping develop insights around impactful options market dynamics.

Disclaimer

At this time, Physik Invest does not carry the right to provide advice. In no way should the materials herein be construed as advice. Derivatives carry a substantial risk of loss. All content is for informational purposes only.

Categories
Commentary

Daily Brief For December 20, 2021

What Happened

Overnight, equity index futures auctioned sideways to lower with growth-heavy and rate-sensitive names bearing the brunt of the move.

This is as Goldman Sachs Group (NYSE: GS) economists reduced their U.S. economic growth expectations, Senator Joe Manchin rejected a $2 trillion tax-and-spending package, hawkish central bank pivots, and rising COVID-19 lockdown risks. 

Ahead is data on leading economic indicators (10:00 AM ET).

Graphic updated 6:40 AM ET. Sentiment Risk-Off if expected /ES open is below the prior day’s range. /ES levels are derived from the profile graphic at the bottom of the following section. Levels may have changed since initially quoted; click here for the latest levels. SqueezeMetrics Dark Pool Index (DIX) and Gamma (GEX) calculations are based on where the prior day’s reading falls with respect to the MAX and MIN of all occurrences available. A higher DIX is bullish. At the same time, the lower the GEX, the more (expected) volatility. Learn the implications of volatility, direction, and moneyness. SHIFT data used for S&P 500 (INDEX: SPX) options activity. Note that options flow is sorted by the call premium spent; if more positive then more was spent on call options. Breadth reflects a reading of the prior day’s NYSE Advance/Decline indicator. VIX reflects a current reading of the CBOE Volatility Index (INDEX: VIX) from 0-100.

What To Expect

Divergent breadth in less heavily-weighted constituents, and what remains of “put-heavy” positioning, coupled with recent fundamental developments, is feeding into lower index prices.

Graphic: Sentimentrader writes: “Fewer than 65% of NDX stocks are currently trading above their 200-day moving averages. That is a stark change from a year ago when internal trends improved as the NDX marched steadily higher.”

Though the December 17 options expiration (OPEX) cleared positive delta and quite a bit of negative delta (e.g., the ARK Innovation ETF [NYSE: ARKK] had $1.5 billion in notional put delta expire) which, in theory, should open a window of strength and realized volatility, wherein positive fundamental forces and dealers’ covering of hedges would bolster any recovery, the January 21 expiry still carries $1.7 billion in notional put delta.

Continued weakness and higher volatility, among other things, likely solicits dealer hedging of exposure to increasing positive delta; weakness has dealers selling against short-dated, increasingly sensitive negative gamma positioning.

With breadth still to recover, a clear expansion of range places the S&P 500 below its 20- and 50-day simple moving averages, the levels which solicited responsive buying by short-term, visual traders who often lack the wherewithal (both emotional and financial) to defend retests.

Graphic: Monthly charts of the S&P 500 (top left), Nasdaq 100 (top right), Russell 2000 (bottom left), Dow Jones Industrial Average (bottom right). All indices come into major support areas.

Context: “The Fed is seen responding to the inflation fears stalking businesses by leaning toward an older playbook of prioritizing the fight against price pressures — even if that risks weaker growth over the longer term,” per Bloomberg.

Notwithstanding, per Nasdaq, “growth in earnings is so far stronger than the multiple compression caused by rising rates,” and that is what has helped support this year’s rally.

Couple that with the management of massive S&P positions, and relentless, seasonally-aligned “passive buying support,” in the face of expectations there will be “the strongest quarterly nominal [economic] growth in more than three decades,” weakness (especially in growth-heavy and rate-sensitive names) remains.

Graphic: Positively skewed return distribution amidst “natural, passive buying,” and supportive positioning metrics. Data SqueezeMetrics. Graph via Physik Invest.

That’s due in part to some of the dynamics discussed in an earlier section, coupled with some negative fundamental developments like the rejection of an economic stimulus package, cuts to Goldman Sachs Group’s GDP forecasts, among other things.

I end with a note from JPMorgan Chase & Co’s (NYSE: JPM) Marko Kolanovic who expects a year-end rally to be driven by stocks targeted by short-sellers. 

“For short-selling campaigns to succeed, there have to be positioning, liquidity and often systematic amplifiers of the selloff,” Kolanovic wrote. 

“We believe these conditions are not met, and hence this market episode may end up in a short squeeze and cyclical rally into year-end and January.” 

That aligns with light positioning, improving seasonality metrics, and data that suggests equity markets tend to rally into the first hike.

Graphic: S&P 500 performance before and after rate hikes.

Expectations: As of 6:40 AM ET, Monday’s regular session (9:30 AM – 4:00 PM ET), in the S&P 500, will likely open in the middle part of a negatively skewed overnight inventory, outside of prior-range and -value, suggesting a potential for immediate directional opportunity.

Gap Scenarios: Gaps ought to fill quickly. Should they not, that’s a signal of strength; do not fade. Leaving value behind on a gap-fill or failing to fill a gap (i.e., remaining outside of the prior session’s range) is a go-with indicator.

Auctioning and spending at least 1-hour of trade back in the prior range suggests a lack of conviction; in such a case, do not follow the direction of the most recent initiative activity.

In the best case, the S&P 500 trades sideways or higher; activity above the $4,548.75 low volume area (LVNode) puts in play the $4,574.25 high volume area (HVNode). Initiative trade beyond the HVNode could reach as high as the $4,590.00 regular trade low (RTH Low) and $4,623.00 untested point of control (VPOC), or higher.

In the worst case, the S&P 500 trades lower; activity below the $4,548.75 LVNode puts in play the $4,523.00 VPOC. Initiative trade beyond the VPOC could reach as low as the $4,492.25 RTH Low and $4,471.00 VPOC, or lower.

Click here to load today’s key levels into the web-based TradingView charting platform. Note that all levels are derived using the 65-minute timeframe. New links are produced, daily.
Graphic: 65-minute profile chart of the Micro E-mini S&P 500 Futures. Learn about the profile.

Definitions

Volume Areas: A structurally sound market will build on areas of high volume (HVNodes). Should the market trend for long periods of time, it will lack sound structure, identified as low volume areas (LVNodes). LVNodes denote directional conviction and ought to offer support on any test. 

If participants were to auction and find acceptance into areas of prior low volume (LVNodes), then future discovery ought to be volatile and quick as participants look to HVNodes for favorable entry or exit.

POCs: POCs are valuable as they denote areas where two-sided trade was most prevalent in a prior day session. Participants will respond to future tests of value as they offer favorable entry and exit.

MCPOCs: POCs are valuable as they denote areas where two-sided trade was most prevalent over numerous day sessions. Participants will respond to future tests of value as they offer favorable entry and exit.

Volume-Weighted Average Prices (VWAPs): A metric highly regarded by chief investment officers, among other participants, for quality of trade. Additionally, liquidity algorithms are benchmarked and programmed to buy and sell around VWAPs.

About

After years of self-education, strategy development, and trial-and-error, Renato Leonard Capelj began trading full-time and founded Physik Invest to detail his methods, research, and performance in the markets.

Additionally, Capelj is a Benzinga finance and technology reporter interviewing the likes of Shark Tank’s Kevin O’Leary, JC2 Ventures’ John Chambers, and ARK Invest’s Catherine Wood, as well as a SpotGamma contributor, helping develop insights around impactful options market dynamics.

Disclaimer

At this time, Physik Invest does not carry the right to provide advice. In no way should the materials herein be construed as advice. Derivatives carry a substantial risk of loss. All content is for informational purposes only.

Categories
Commentary

Daily Brief For December 17, 2021

What Happened

Overnight, equity index futures auctioned sideways to lower.

This is alongside news that South Africa’s hospitalization rates plunged, Democratic leaders abandoned plans to pass a $2 trillion social spending and climate plan, and central banks looked to fight inflation with tighter monetary policies.

Ahead is Fed-speak at 8:30 AM ET and 1:00 PM ET. Today, also, is a large derivatives expiry.

Graphic updated 6:15 AM ET. Sentiment Neutral if expected /ES open is inside of the prior day’s range. /ES levels are derived from the profile graphic at the bottom of the following section. Levels may have changed since initially quoted; click here for the latest levels. SqueezeMetrics Dark Pool Index (DIX) and Gamma (GEX) calculations are based on where the prior day’s reading falls with respect to the MAX and MIN of all occurrences available. A higher DIX is bullish. At the same time, the lower the GEX, the more (expected) volatility. Learn the implications of volatility, direction, and moneyness. SHIFT data used for S&P 500 (INDEX: SPX) options activity. Note that options flow is sorted by the call premium spent; if more positive then more was spent on call options. Breadth reflects a reading of the prior day’s NYSE Advance/Decline indicator. VIX reflects a current reading of the CBOE Volatility Index (INDEX: VIX) from 0-100.

What To Expect

After an open outside of prior-range and -value (i.e., levels at which 70% of the day’s volume was transacted), the S&P 500 Index took back the near-vertical post-Federal Open Market Committee price rise. 

As evidenced by the volume-weighted average price anchored from FOMC, the average buyer, since that event is in a losing position. Ouch!

There are some factors (outside of lackluster intraday breadth and market liquidity metrics) that pointed to a difficulty – at least on the index level – to expand directionally. Read more here!

The expectation, though, after this week is for an expansion of range amidst a reduction in the sticky options-related hedging forces that promote consolidation/pinning.

Graphic: Delta (i.e., committed selling as measured by volume delta or buying and selling power as calculated by the difference in volume traded at the bid and offer) in SPDR S&P 500 ETF Trust (NYSE: SPY), one of the largest ETFs that track the S&P 500 index, via Bookmap.

Context: Keeping it brief, today.

For numerous days now, there has been no shortage in notes forecasting market moves the year ahead. What is common, among these notes, is a belief that markets ought to be bullish going into 2022. Later, though, there are threats that could dent performance.

What does that mean? In sticking to the ruling narrative, so to speak, participants are anchored to the Federal Reserve’s (Fed) intent in adjusting monetary policy.

Based on comments earlier this week, the Fed will accelerate its taper to bond-buying. Thereafter, “the plot now shows three hikes for next year.”

So, why does this matter to me?

Rising rates, among other factors, have the potential to decrease the present value of future earnings, thereby making stocks, especially those that are high growth, less attractive. 

Couple that notion with some markedly divergent breadth and extreme relative weakness, especially in rate-sensitive names, pension rebalancings, increased exposure to leverage, among other things, it’s easy to lose sight of the positives

As stated, previously, though, today’s rates support validations better than in the ‘90s.

At the same time, equity markets tend to rally into the first hike; Moody’s Corporation’s (NYSE: MCO) forecast aligns with that – “the Dow Jones Industrial Average increases this quarter and peaks in early 2022, … [followed by] steady decline through 2022.”

Graphic: S&P 500 performance before and after rate hikes.

In support is relentless, seasonally-aligned “passive buying support” in the face of expectations there will be “the strongest quarterly nominal [economic] growth in more than three decades.”

Graphic: Positively skewed return distribution amidst “natural, passive buying,” and supportive positioning metrics. Data SqueezeMetrics. Graph via Physik Invest.

That’s all good to know. However, tell me what I should know for right now.

Sure. 

As stated, yesterday, the market is in a positive-gamma environment wherein the counterparties to customer options trades add market liquidity and help temper realized volatility.

The expectation, into the end of this week, was that participants would continue to step in and commit increased capital on lower directional volatility (as they had into the start of this week).

The decrease in dealer supply (short delta) post-OPEX, via the covering of short stock/futures hedges to put-heavy positioning, ought to bolster any attempt higher.

Couple that with participants’ commitment of capital to strikes higher in price and out in time, the bullish thesis is emboldened. 

I end with a note from options modeling service SpotGamma: “There was a VIX low around November 5th, and using that as a barometer … the current VIX structure remains elevated above those Nov ‘blue sky’ levels (pre-Omnicron, pre-Taper concerns).”

“There is a fairly large expiration on 12/31, and we’d anecdotally note that implied vol often holds a bid into that expiration. The point here is that there is arguably a bit more ‘vanna fuel’ left in the tank, but it’s going to take ‘real buyers’ (i.e. not volatility short covering) to continue the Santa Rally.”

Expectations: As of 6:15 AM ET, Friday’s regular session (9:30 AM – 4:00 PM ET), in the S&P 500, will likely open in the middle part of a negatively skewed overnight inventory, inside of prior-range and -value, suggesting a limited potential for immediate directional opportunity.

In the best case, the S&P 500 trades sideways or higher; activity above the $4,647.25 high volume area (HVNode) puts in play the $4,674.25 HVNode. Initiative trade beyond the HVNode could reach as high as the $4,690.25 micro-composite point of control (MCPOC) and $4,709.00 untested point of control (VPOC), or higher.

In the worst case, the S&P 500 trades lower; activity below the $4,647.25 HVNode puts in play the $4,615.00 VPOC. Initiative trade beyond the SIGNPOST could reach as low as the $4,597.25 regular trade low (RTH Low) and $4,581.00 VPOC, or lower.

Click here to load today’s key levels into the web-based TradingView charting platform. Note that all levels are derived using the 65-minute timeframe. New links are produced, daily.
Graphic: 65-minute profile chart of the Micro E-mini S&P 500 Futures. Learn about the profile.

What People Are Saying

Definitions

Volume Areas: A structurally sound market will build on areas of high volume (HVNodes). Should the market trend for long periods of time, it will lack sound structure, identified as low volume areas (LVNodes). LVNodes denote directional conviction and ought to offer support on any test. 

If participants were to auction and find acceptance into areas of prior low volume (LVNodes), then future discovery ought to be volatile and quick as participants look to HVNodes for favorable entry or exit.

POCs: POCs are valuable as they denote areas where two-sided trade was most prevalent in a prior day session. Participants will respond to future tests of value as they offer favorable entry and exit.

MCPOCs: POCs are valuable as they denote areas where two-sided trade was most prevalent over numerous day sessions. Participants will respond to future tests of value as they offer favorable entry and exit.

Options Expiration (OPEX): Traditionally, option expiries mark an end to pinning (i.e, the theory that market makers and institutions short options move stocks to the point where the greatest dollar value of contracts will expire) and the reduction dealer gamma exposure.

Volume-Weighted Average Prices (VWAPs): A metric highly regarded by chief investment officers, among other participants, for quality of trade. Additionally, liquidity algorithms are benchmarked and programmed to buy and sell around VWAPs.

About

After years of self-education, strategy development, and trial-and-error, Renato Leonard Capelj began trading full-time and founded Physik Invest to detail his methods, research, and performance in the markets.

Additionally, Capelj is a Benzinga finance and technology reporter interviewing the likes of Shark Tank’s Kevin O’Leary, JC2 Ventures’ John Chambers, and ARK Invest’s Catherine Wood, as well as a SpotGamma contributor, helping develop insights around impactful options market dynamics.

Disclaimer

At this time, Physik Invest does not carry the right to provide advice. In no way should the materials herein be construed as advice. Derivatives carry a substantial risk of loss. All content is for informational purposes only.

Categories
Commentary

Daily Brief For December 6, 2021

What Happened

Overnight, equity index futures auctioned sideways to higher after Friday’s liquidation had the S&P 500 undercutting its 50-day simple moving average (SMA), a visual go/no-go level.

Strength shifted, again, to the Russell 2000 while the tech-heavy Nasdaq 100 was underwater. This comes as policymakers look to temper inflation with the tightening of monetary policy.

In regards to news, China’s central bank looked to boost liquidity for its slowing economy. It was also found that a new virus variant was not fueling a surge in hospitalizations; the U.S.’s adviser on the issue, Anthony Fauci, said there wasn’t “a great degree of severity to omicron.”

That didn’t stop the economists at Goldman Sachs Group Inc (NYSE: GS) from cutting their forecasts for U.S. GDP next year; the estimates were revised down on an expectation the omicron strain would drag growth.

Ahead are no important releases on fundamental data.

Graphic updated 6:30 AM ET. Sentiment Neutral if expected /ES open is inside of the prior day’s range. /ES levels are derived from the profile graphic at the bottom of the following section. Levels may have changed since initially quoted; click here for the latest levels. SqueezeMetrics Dark Pool Index (DIX) and Gamma (GEX) calculations are based on where the prior day’s reading falls with respect to the MAX and MIN of all occurrences available. A higher DIX is bullish. At the same time, the lower the GEX, the more (expected) volatility. Learn the implications of volatility, direction, and moneyness. SHIFT data used for S&P 500 (INDEX: SPX) options activity. Note that options flow is sorted by the call premium spent; if more positive then more was spent on call options. Breadth reflects a reading of the prior day’s NYSE Advance/Decline indicator. VIX reflects a current reading of the CBOE Volatility Index (INDEX: VIX) from 0-100.

What To Expect

On weak intraday breadth and divergent market liquidity metrics, the worst outcome occurred; there was an expansion of range, to the downside, and participants spent the majority of the session building value at lower prices (i.e., levels at which 70% of that day’s volume occurred).

The lower bound of Friday’s range was $4,500.00 or so, at which the 50-day SMA corresponded with a large base of resting liquidity. 

To note, the 50-day is visual level at which short-term, technically-driven participants were likely buying in response to probes below developing balance. 

Successfully auctioning beneath the 50-day is a concern. Those short-term participants lack the wherewithal (both emotional and financial) to defend retests.

Continuation lower, in such a case, is likely.

Graphic: Divergent delta (i.e., non-committed selling as measured by volume delta or buying and selling power as calculated by the difference in volume traded at the bid and offer) in SPDR S&P 500 ETF Trust (NYSE: SPY), one of the largest ETFs that track the S&P 500 index, via Bookmap. The readings are supportive of responsive trade (i.e., rotational trade that suggests current prices offer favorable entry and exit; the market is in balance).

Context: The Fed’s intent to moderate stimulus and uncertainty with regards to how a new COVID-19 variant will impact the global recovery.

According to Bloomberg, “the Fed is seen responding to the inflation fears stalking businesses by leaning toward an older playbook of prioritizing the fight against price pressures — even if that risks weaker growth over the longer term.”

In line with the aforementioned, traders already started pricing in potential rate overshoots with the “December 2024 eurodollar yields [rising] above December 2025 contracts, a curve inversion that signals expectations the central bank may consider cutting rates in 2025.”

The result is that the U.S. may realize the swiftest tightening in financial conditions since 2005 if the Fed was to hike rates three times next year.

Graphic: Via Bloomberg, trades price in a rapid increase in the real Fed rate.

This development carries weight; now, more than during the tech-and-telecom bubble, low rates support current valuations.

Graphic: Low rates support current valuations better than the ‘90s, according to Nasdaq.

The reason being? 

“Lower interest rates lead to future cashflow discounting less – leading to higher valuations. From another perspective, a company with a 5% profit margin is a much more attractive investment when long-term borrow costs are less than 2%, as they are now than when it costs 5%-7% to borrow money back in the ‘90s.”

The Fed’s intent to taper faster, and eventually hike rates, just as liquidity conditions have deteriorated, pushed “the orange dot [in the above graphic] toward the right during the year.”

Notwithstanding, “growth in earnings is so far stronger than the multiple compression caused by rising rates (blue line),” and that is helping support this year’s rally.

The intent to moderate stimulus is likely to serve as a headwind; there’s always a possibility of unanticipated policy adjustments, in the face of a resurgent COVID-19 digging further into the economy’s growth.

That’s partially why we saw Goldman Sachs cut their forecasts for GDP. 

Graphic: Via The Market Ear. Goldman Sachs cut its forecast for GDP.

But, for every negative view, there is a positive (either by the same institution or a competitor).

We see JPMorgan Chase & Co (NYSE: JPM), among others, doubling down on their bullishness.

“We are calling for another year of positive earnings surprises, relative to current consensus estimates.”

Similarly, the market may shrug off omicron just as it did beta and delta

Graphic: Via The Market Ear, the market shrugs off COVID-19 variants with ease.

And, despite the market’s trade in short-gamma (a “negative [gamma] implies the opposite [selling into lows, buying into highs], thus magnifying market volatility”) destabilizing demand for downside protection is concentrated in shorter-dated options

Graphic: A roll lower in the VIX term structure brings in supportive flows. Via The Market Ear.

Once that short-dated protection rolls off the table (and/or is monetized), counterparties will quickly reverse and support the market, buying to close their existing stock/futures hedges.

This flow is stabilizing and may play into a seasonally-aligned rally into Christmas as participants see defenses rolled out against the new COVID-19 variant, and the positive effects of pro-cyclical inflation, economic growth, and improvements in global trade.

Such development plays into a thesis held by Moody’s Corporation (NYSE: MCO). 

“The forecast is that the Dow Jones Industrial Average increases this quarter and peaks in early 2022. However, the rest of the contours of the forecast didn’t change. We expect the DJIA to steadily decline throughout 2022, but because it will now peak later than previously thought, the level of the DJIA will be higher at the end of next year and over the near-term forecast.”

Similarly, here are some views by Morgan Stanley (NYSE: MS), compiled by The Market Ear. 

“The Morgan Stanley’s Global Risk Demand Index (GRDI) [fell] to a 10Y low reading of -4.2SD, last Friday (currently -3.SD). Historically, such a level has proved to be a solid buy signal over the next 3m. Other signs that investor sentiment has overshot to the downside include the VIX > 30, a steep put-call skew, and the AAII survey where 42% of respondents are bearish (90th percentile reading). Over the last decade, MSCI ACWI has risen 98% of the time over the next 3m post this signal and by an average of 10%.”

Expectations: As of 6:30 AM ET, Monday’s regular session (9:30 AM – 4:00 PM ET), in the S&P 500, will likely open in the middle part of a positively skewed overnight inventory, inside of prior-range and -value, suggesting a limited potential for immediate directional opportunity.

Balance-Break Scenarios: A change in the market (i.e., the transition from two-time frame trade, or balance, to one-time frame trade, or trend) may occur.

Monitor for acceptance (i.e., more than 1-hour of trade) outside of the developing balance area. Rejection (i.e., return inside of balance) portends a move to the opposite end of the balance.

In the best case, the S&P 500 trades sideways or higher; activity above the $4,523.00 untested point of control (VPOC) puts in play the $4,551.75 low volume area (LVNode). Initiative trade beyond the LVNode could reach as high as the $4,574.25 high volume area (HVNode) and $4,590.00 balance area high (BAH), or higher.

In the worst case, the S&P 500 trades lower; activity below the $4,523.00 VPOC puts in play the $4,492.25 regular trade low (RTH Low). Initiative trade beyond the RTH Low could reach as low as the $4,471.00 and $4,425.00 VPOC, or lower.

Click here to load today’s updated key levels into the web-based TradingView charting platform. Note that all levels are derived using the 65-minute timeframe. New links are produced, daily.
Graphic: 65-minute profile chart of the Micro E-mini S&P 500 Futures. Learn about the profile.

What People Are Saying

Definitions

Volume Areas: A structurally sound market will build on areas of high volume (HVNodes). Should the market trend for long periods of time, it will lack sound structure, identified as low volume areas (LVNodes). LVNodes denote directional conviction and ought to offer support on any test. 

If participants were to auction and find acceptance into areas of prior low volume (LVNodes), then future discovery ought to be volatile and quick as participants look to HVNodes for favorable entry or exit.

Liquidation Breaks: The profile shape suggests participants were “too” long and had poor location.

POCs: POCs are valuable as they denote areas where two-sided trade was most prevalent in a prior day session. Participants will respond to future tests of value as they offer favorable entry and exit.

About

After years of self-education, strategy development, and trial-and-error, Renato Leonard Capelj began trading full-time and founded Physik Invest to detail his methods, research, and performance in the markets.

Additionally, Capelj is a Benzinga finance and technology reporter interviewing the likes of Shark Tank’s Kevin O’Leary, JC2 Ventures’ John Chambers, and ARK Invest’s Catherine Wood, as well as a SpotGamma contributor, developing insights around impactful options market dynamics.

Disclaimer

At this time, Physik Invest does not manage outside capital and is not licensed. In no way should the materials herein be construed as advice. Derivatives carry a substantial risk of loss. All content is for informational purposes only.

Categories
Commentary

Daily Brief For December 3, 2021

What Happened

Overnight, equity index futures auctioned in-sync, within the confines of yesterday’s recovery. 

This is as participants position themselves for Friday’s data dump that may shed light on how fast the Federal Reserve (Fed) intends to tighten monetary policy.

Ahead is data on nonfarm payrolls, the unemployment rate, and average hourly earnings (8:30 AM ET). Later is Fed-speak by James Bullard (9:15 AM ET), Markit services PMI (9:45 AM ET), as well as ISM services, factory orders, and core capital goods orders (10:00 AM ET).

Graphic updated 6:45 AM ET. Sentiment Neutral if expected /ES open is inside of the prior day’s range. /ES levels are derived from the profile graphic at the bottom of the following section. Levels may have changed since initially quoted; click here for the latest levels. SqueezeMetrics Dark Pool Index (DIX) and Gamma (GEX) calculations are based on where the prior day’s reading falls with respect to the MAX and MIN of all occurrences available. A higher DIX is bullish. At the same time, the lower the GEX, the more (expected) volatility. Learn the implications of volatility, direction, and moneyness. SHIFT data used for S&P 500 (INDEX: SPX) options activity. Note that options flow is sorted by the call premium spent; if more positive then more was spent on call options. Breadth reflects a reading of the prior day’s NYSE Advance/Decline indicator. VIX reflects a current reading of the CBOE Volatility Index (INDEX: VIX) from 0-100.

What To Expect

In the face of strong intraday breadth, the best case outcome occurred, evidenced by the recovery of Wednesday’s value (i.e., the prices at which 70% of that day’s volume occurred).

This action negated the knee-jerk selling that coincided with COVID-19 variant news.

As a result, the S&P 500 is back inside of a short-term consolidation; participants had no interest in transacting the S&P 500 on prices advertised below the balance area.

Context: The Fed’s intent to moderate stimulus and uncertainty with regards to how a new COVID-19 variant will impact the global recovery.

In the face of it all, according to Bloomberg, “The market is again pricing June 2022 as the most likely timing for the first Fed rate hike, same as on Nov. 24. At various stages over the intervening days traders looked at July, or even as late as September.”

This is as an emerging trend from the Fed, confirmed by Chair Jerome Powell’s Congressional testimony – for weeks into this most recent equity – resulted in a re-pricing of bond market risk. 

That fear – demand for protection in the bond market – failed to appear in the equity market. 

Instead, there was an insatiable appetite for stocks, according to Bloomberg, with investors pouring more cash in 2021 than in the past 19 years, combined. 

That appetite for risk fed into the activity of some high-flyers like Tesla Inc (NASDAQ: TSLA), and, more recently Apple Inc (NASDAQ: AAPL). At the same time, the broader market was weakening, evidenced by a decline in breadth. 

With indices pinned, heading into the November monthly options expiration (OPEX), as a result of sticky and supportive hedging flows, correlations declined. 

Think about it. If heavily weighted index constituents are higher and the indices are pinned, then something has to give! 

After OPEX, the removal of certain hedging flows had the market succumb to fundamental forces. The addition of participants’ underexposure to downside put protection, according to SpotGamma, resulted in more rampant two-way volatility.

The reason being? The market quickly entered into an environment known as short-gamma. 

“What the heck is that? Please explain to me like I’m ten.” Okay, hold my beer.

Basically, funds holding long equity, in the interest of lower volatility returns, hedge. The S&P 500 is a benchmark and one of the best places to hedge, given liquidity, and so on.

These participants will sell calls against their long equity exposure. The proceeds from that sale will be put toward downside protection. Long equity, short call, long put. Get it?

The counterparty to this dominant positioning is a buyer (seller) of upside (downside) protection, a carry trade (i.e., long delta). 

This exposure is hedged, yes! However, this exposure will also decay, in time, all else equal. 

Volatility will slide down its term structure (vanna) and time will pass (charm); “as volatility ebbs and time passes, the unwind of these hedges brings in positive flows that can lead to lengthy sprints.” – Cem Karsan of Kai Volatility.

Now, within a certain range, said counterparties are, long-gamma also. Gamma is basically “the rate of change of delta per 1-point move in the underlying,” according to SqueezeMetrics.

As volatility and time to expiration decline, the gamma of at-the-money options rises; “option market-makers will hedge their positions in a fashion that stifles volatility (buying into lows, selling into highs).”

There are times, also, when the market is in a short-gamma; a “negative [gamma] implies the opposite (selling into lows, buying into highs), thus magnifying market volatility.”

With participants underexposed to downside protection, post-OPEX demand kicked the market into short-gamma; the conditions worsened when much of the activity was concentrated in shorter-dated tenors where the sensitivity of options to direction is higher, as stated.

Graphic: VIX term structure 11/25. Backwardation signaled an entry into an unstable environment with activity concentrated at the front-end of the curve.

Once that short-dated protection rolls off the table (and/or is monetized), counterparties will quickly reverse and support the market, buying to close their existing stock/futures hedges.

Graphic: SpotGamma’s Hedging Impact of Real-Time Options (HIRO) indicator on 12/2 shows positive options delta trades firing off, which likely had dealers buying stock/futures into the close.

This flow is stabilizing and may play into a seasonally-aligned rally into Christmas as participants see defenses rolled out against the new COVID-19 variant, and the positive effects of pro-cyclical inflation and economic growth, improvements in global trade, and continuity at the Fed, among other dynamics, play out.

We see participants opportunistically buying the dip, already, via metrics like DIX that’s derived from liquidity provision on the market-making side.

Graphic: Earnings are rising and helping support historic PE multiples, via Nasdaq

Notwithstanding, the market is still in short-gamma and unless participants began betting on the upside (i.e., committing increased capital to calls at strikes higher in price and out in time), and we cross over to long-gamma, volatility ought to remain.

To assuage fears, though, here is a quote from Goldman Sachs Group Inc (NYSE: GS): 

“We find that the market has already priced in a significant downgrade in the growth outlook off the back of Omicron concerns. While we don’t believe that the most extreme downside scenarios are fully reflected in current market pricing, there are clearly still scenarios that could prove better than anticipated by the sharp shift in pricing in recent weeks, in our view”.

Expectations: As of 6:45 AM ET, Friday’s regular session (9:30 AM – 4:00 PM ET), in the S&P 500, will likely open in the upper part of a negatively skewed overnight inventory, inside of prior-range and -value, suggesting a limited potential for immediate directional opportunity.

In the best case, the S&P 500 trades sideways or higher; activity above the $4,574.25 high volume area (HVNode) puts in play the $4,590.00 balance area high (BAH). Initiative trade beyond the BAH could reach as high as the $4,629.00 untested point of control (VPOC) and $4,647.25 HVNode, or higher.

In the worst case, the S&P 500 trades lower; activity below the $4,574.25 HVNode puts in play the $4,551.75 low volume area (LVNode). Initiative trade beyond the LVNode could reach as low as the $4,526.25 HVNode and $4,497.75 regular trade low (RTH Low), or lower.

Click here to load today’s updated key levels into the web-based TradingView charting platform. Note that all levels are derived using the 65-minute timeframe. New links are produced, daily.
Graphic: 65-minute profile chart of the Micro E-mini S&P 500 Futures. Learn about the profile.

What People Are Saying

Definitions

Volume Areas: A structurally sound market will build on areas of high volume (HVNodes). Should the market trend for long periods of time, it will lack sound structure, identified as low volume areas (LVNodes). LVNodes denote directional conviction and ought to offer support on any test. 

If participants were to auction and find acceptance into areas of prior low volume (LVNodes), then future discovery ought to be volatile and quick as participants look to HVNodes for favorable entry or exit.

DIX: For every buyer is a seller (usually a market maker). Using DIX — which is derived from short sales (i.e., liquidity provision on the market-making side) — we can measure buying pressure.

Gamma: Gamma is the sensitivity of an option to changes in the underlying price. Dealers that take the other side of options trades hedge their exposure to risk by buying and selling the underlying. When dealers are short-gamma, they hedge by buying into strength and selling into weakness. When dealers are long-gamma, they hedge by selling into strength and buying into weakness. The former exacerbates volatility. The latter calms volatility.

Vanna: The rate at which the delta of an option changes with respect to volatility.

Charm: The rate at which the delta of an option changes with respect to time.

POCs: POCs are valuable as they denote areas where two-sided trade was most prevalent in a prior day session. Participants will respond to future tests of value as they offer favorable entry and exit.

Options Expiration (OPEX): Traditionally, option expiries mark an end to pinning (i.e, the theory that market makers and institutions short options move stocks to the point where the greatest dollar value of contracts will expire) and the reduction dealer gamma exposure.

Balance (Two-Timeframe Or Bracket): Rotational trade that denotes current prices offer favorable entry and exit. Balance-areas make it easy to spot a change in the market (i.e., the transition from two-time frame trade, or balance, to one-time frame trade, or trend). 

Modus operandi is responsive trade (i.e., fade the edges), rather than initiative trade (i.e., play the break).

Value-Area Placement: Perception of value unchanged if value overlapping (i.e., inside day). Perception of value has changed if value not overlapping (i.e., outside day). Delay trade in the former case.

Rates: Low rates have to potential to increase the present value of future earnings making stocks, especially those that are high growth, more attractive. To note, inflation and rates move inversely to each other. Low rates stimulate demand for loans (i.e., borrowing money is more attractive).

About

After years of self-education, strategy development, and trial-and-error, Renato Leonard Capelj began trading full-time and founded Physik Invest to detail his methods, research, and performance in the markets.

Additionally, Capelj is a Benzinga finance and technology reporter interviewing the likes of Shark Tank’s Kevin O’Leary, JC2 Ventures’ John Chambers, and ARK Invest’s Catherine Wood, as well as a SpotGamma contributor, developing insights around impactful options market dynamics.

Disclaimer

At this time, Physik Invest does not manage outside capital and is not licensed. In no way should the materials herein be construed as advice. Derivatives carry a substantial risk of loss. All content is for informational purposes only.