What Happened
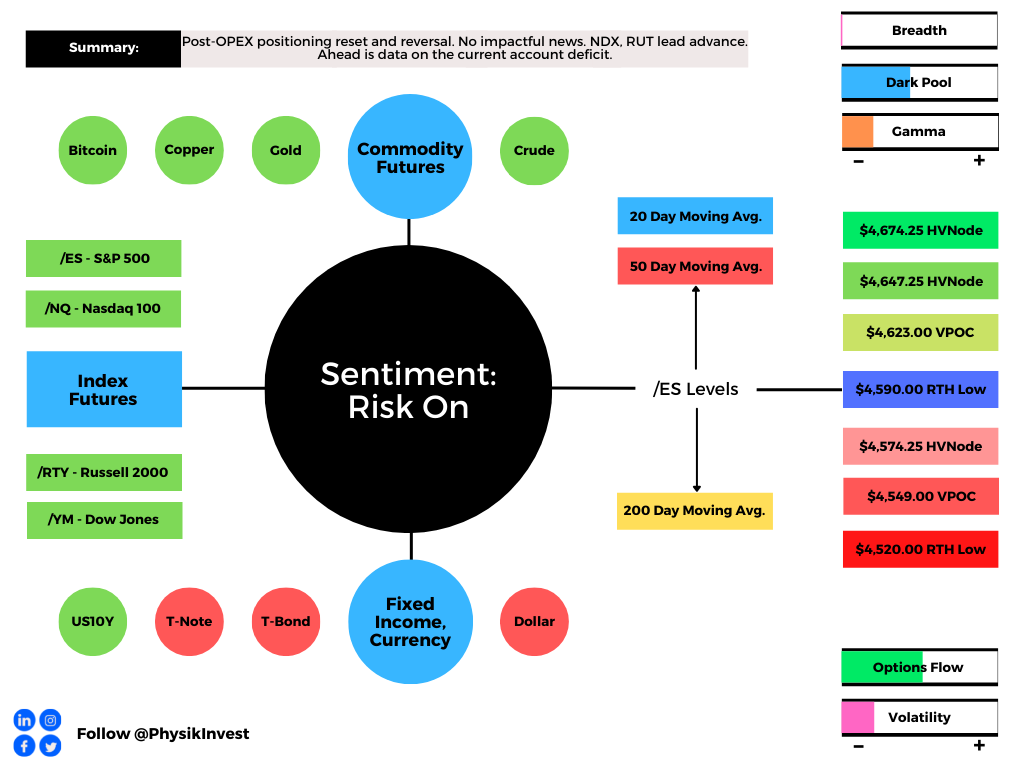
After Monday’s post-options expiration (OPEX) positioning reset, equity index futures traded higher alongside no impactful news developments.
The rate-sensitive and growth-heavy Russell 2000 and Nasdaq 100 led the advance, a change in tone. The S&P 500 was up nearly 1.00% in early trade while volatility came in, markedly, with the CBOE Volatility Index printing 21 versus 27, yesterday.
Ahead is data on the current account deficit (8:30 AM ET).
What To Expect
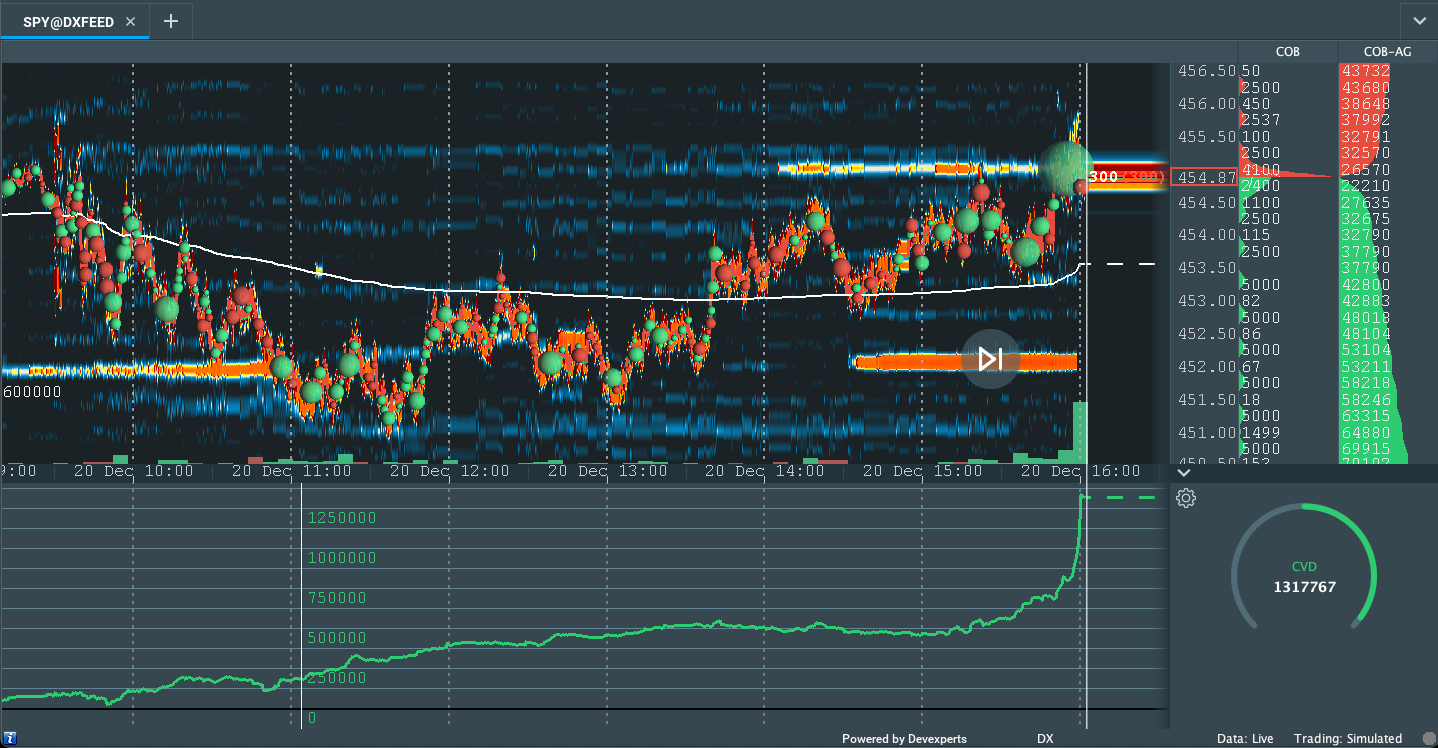
On weak intraday breadth and divergent market liquidity metrics, the best case outcome occurred; responsive buyers surfaced at key areas of resting liquidity.
The response just so happened to coincide with the $4,523.00 /ES untested point of control (VPOC). This technically-sensitive trade seems to suggest that weaker-handed participants, which act on visual cues, are very much in control.
Moreover, the overnight follow-through on that buying resulted in a large gap that places the S&P 500 back in prior range, a clear rejection of Monday’s bearish price exploration.
Context: Have to keep it short, today, sorry!
In recapping yesterday’s on-point write-up, the thesis is as follows: divergent breadth, and what remained of “put-heavy” positioning, coupled with recent fundamental developments, fed into lower index prices.
According to the options modeling and analysis service SpotGamma, the December 17 options expiration (OPEX) cleared quite a bit of negative delta (e.g., the ARK Innovation ETF [NYSE: ARKK] had $1.5 billion in notional put delta expire) which, in theory, should open a window of strength and realized volatility, wherein positive fundamental forces and dealers’ covering of hedges would bolster any recovery.
With breadth still to recover, early expansion of range, this week, placed major products at key visual support; to note, responsive buying by short-term, visual traders seldom are defended.
At the same time, presented were dynamics such as the eventual management of big S&P positions, and relentless, seasonally-aligned “passive buying support,” in the face of expectations there will be “the strongest quarterly nominal [economic] growth in more than three decades.”
Data Trek made comments with respect to the path of earnings surprises, a factor behind the persistence of this year’s S&P 500 rally; “This week’s upward revisions should have the same ability to backstop equities as we wrap up the year. The operative word is ‘should’, of course, and we do expect further volatility this week.”
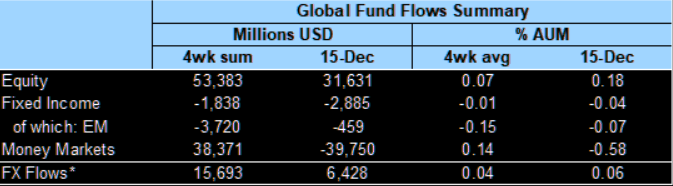
With participants flush with cash, so to speak, will FOMO (fear of missing out) sentiment appear?
Net flows into global equity funds, out of cash equivalents, is one indicator to watch.
Expectations: As of 6:40 AM ET, Tuesday’s regular session (9:30 AM – 4:00 PM ET), in the S&P 500, will likely open in the upper part of a positively skewed overnight inventory, outside of prior-range and -value, suggesting a potential for immediate directional opportunity.
Gap Scenarios: Gaps ought to fill quickly. Should they not, that’s a signal of strength; do not fade. Leaving value behind on a gap-fill or failing to fill a gap (i.e., remaining outside of the prior session’s range) is a go-with indicator.

Auctioning and spending at least 1-hour of trade back in the prior range suggests a lack of conviction; in such a case, do not follow the direction of the most recent initiative activity.
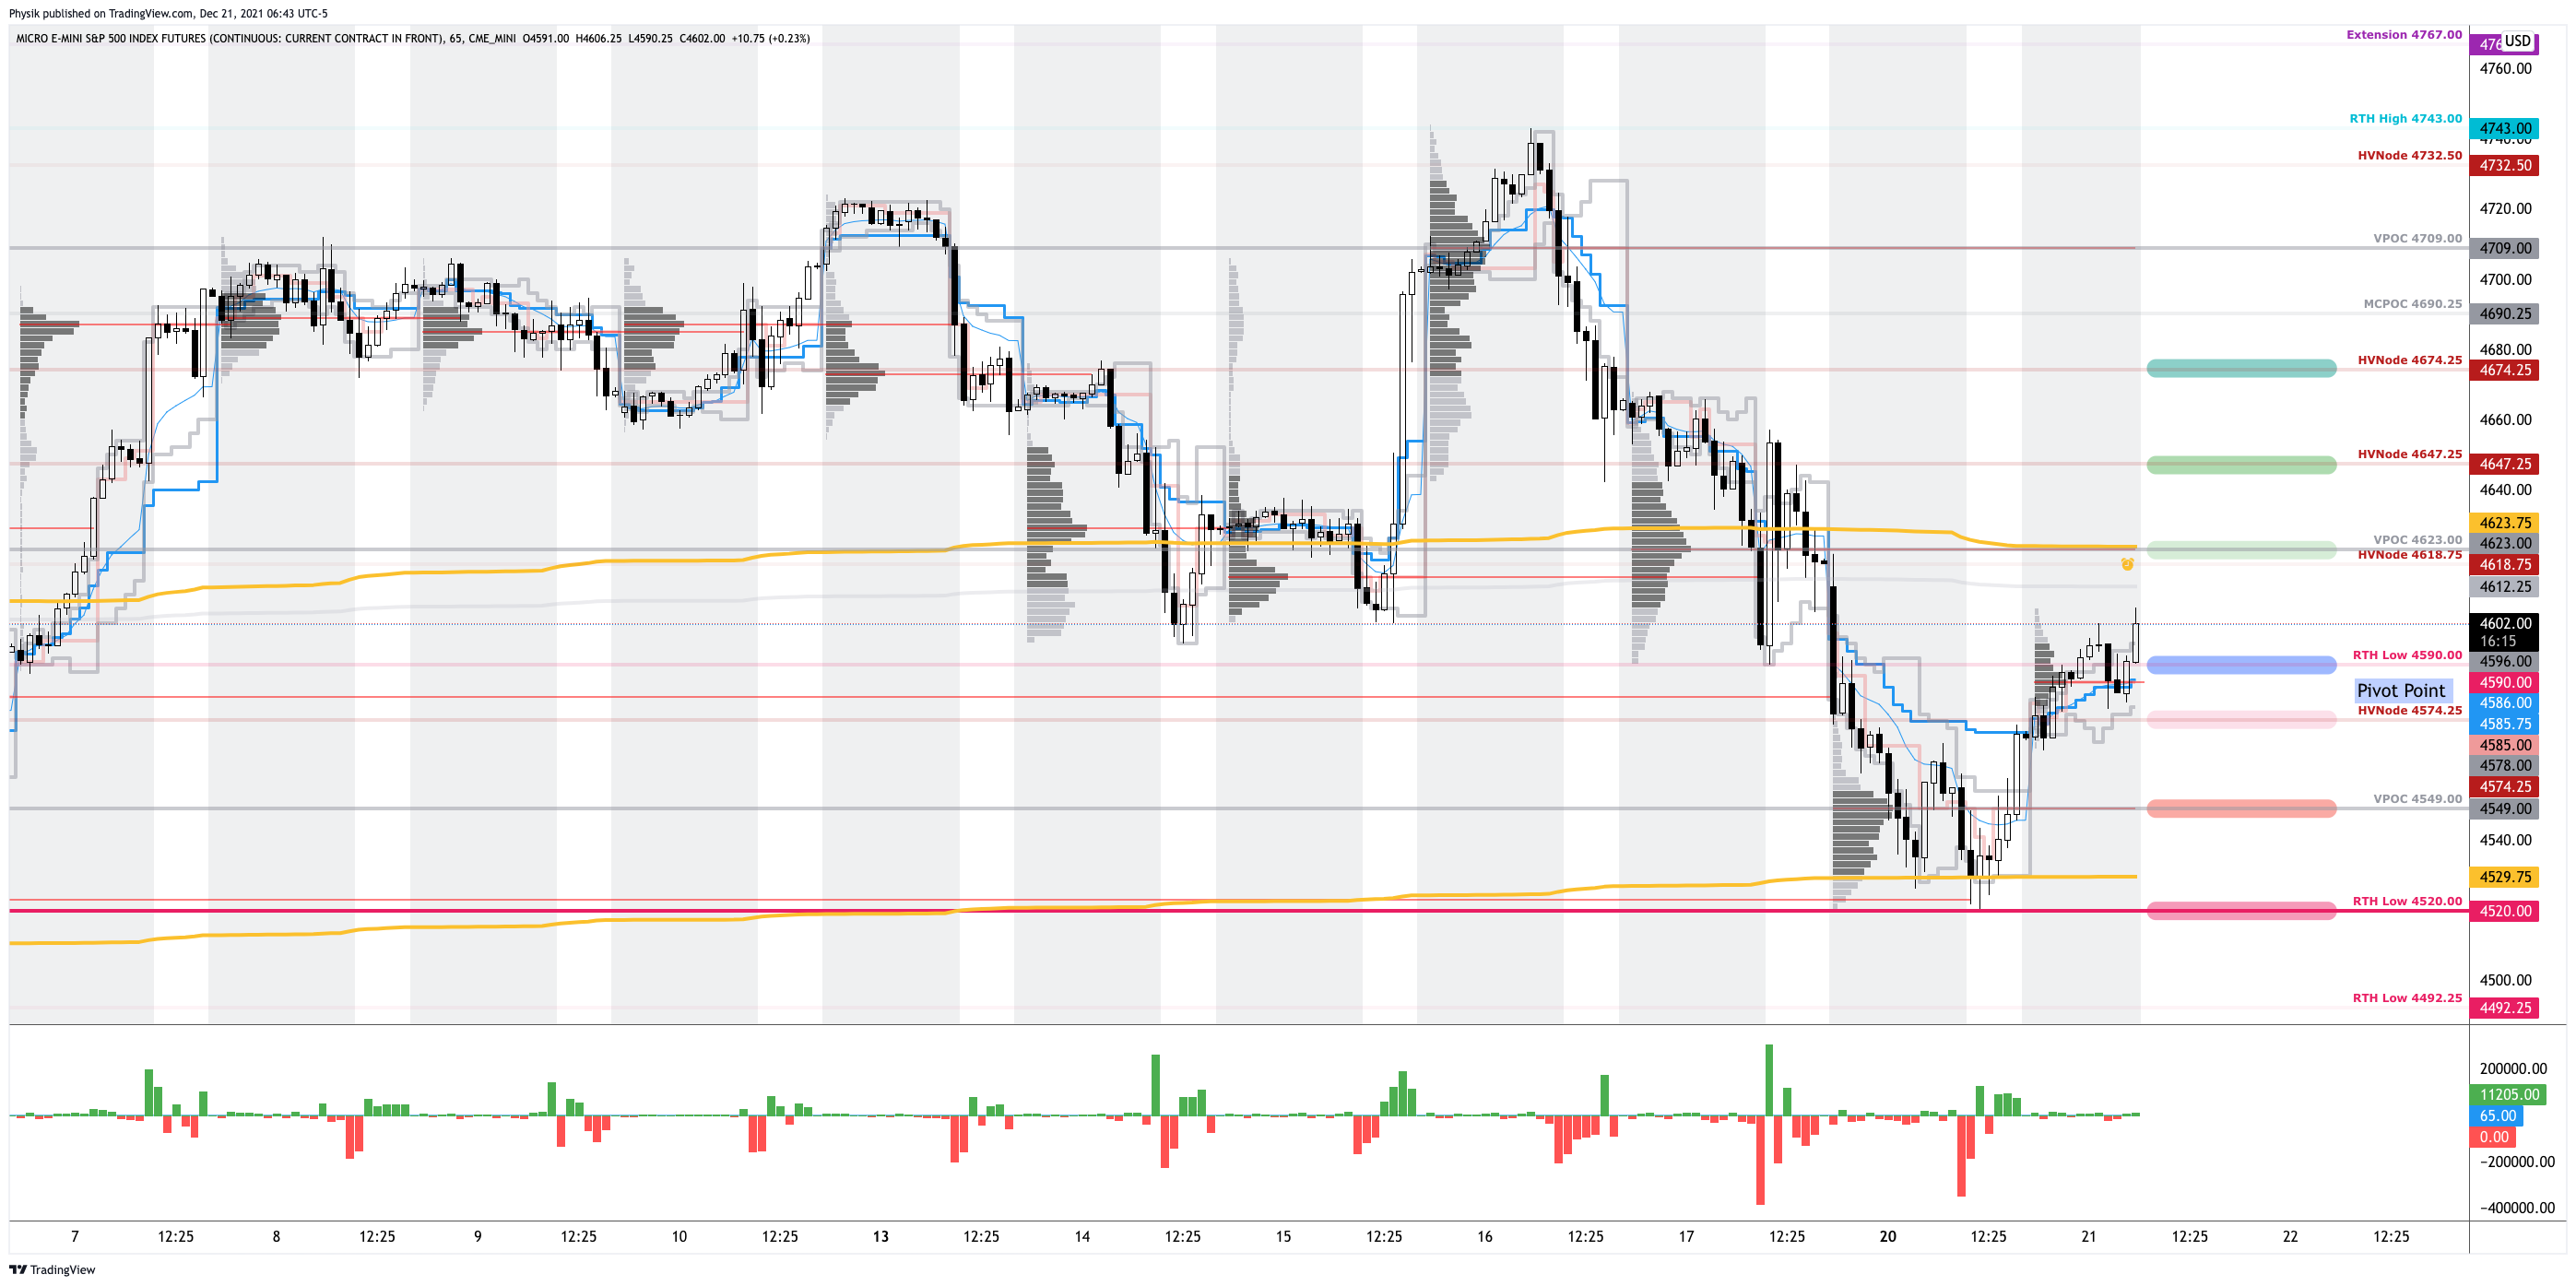
In the best case, the S&P 500 trades sideways or higher; activity above the $4,590.00 regular trade low (RTH Low) puts in play the $4,623.00 VPOC. Initiative trade beyond the VPOC could reach as high as the $4,647.25 and $4,674.25 high volume area (HVNode), or higher.
In the worst case, the S&P 500 trades lower; activity below the $4,590.00 RTH Low puts in play the $4,574.25 high volume area (HVNode). Initiative trade beyond the HVNode could reach as low as the $4,549.00 VPOC and $4,520.00 RTH Low, or lower.
Click here to load today’s key levels into the web-based TradingView charting platform. Note that all levels are derived using the 65-minute timeframe. New links are produced, daily.

What People Are Saying
Definitions
Volume Areas: A structurally sound market will build on areas of high volume (HVNodes). Should the market trend for long periods of time, it will lack sound structure, identified as low volume areas (LVNodes). LVNodes denote directional conviction and ought to offer support on any test.
If participants were to auction and find acceptance into areas of prior low volume (LVNodes), then future discovery ought to be volatile and quick as participants look to HVNodes for favorable entry or exit.
POCs: POCs are valuable as they denote areas where two-sided trade was most prevalent in a prior day session. Participants will respond to future tests of value as they offer favorable entry and exit.
Volume-Weighted Average Prices (VWAPs): A metric highly regarded by chief investment officers, among other participants, for quality of trade. Additionally, liquidity algorithms are benchmarked and programmed to buy and sell around VWAPs.
Rates: Low rates have to potential to increase the present value of future earnings making stocks, especially those that are high growth, more attractive. To note, inflation and rates move inversely to each other. Low rates stimulate demand for loans (i.e., borrowing money is more attractive).
About
After years of self-education, strategy development, and trial-and-error, Renato Leonard Capelj began trading full-time and founded Physik Invest to detail his methods, research, and performance in the markets.
Additionally, Capelj is a Benzinga finance and technology reporter interviewing the likes of Shark Tank’s Kevin O’Leary, JC2 Ventures’ John Chambers, and ARK Invest’s Catherine Wood, as well as a SpotGamma contributor, helping develop insights around impactful options market dynamics.
Disclaimer
At this time, Physik Invest does not carry the right to provide advice. In no way should the materials herein be construed as advice. Derivatives carry a substantial risk of loss. All content is for informational purposes only.