
What Happened
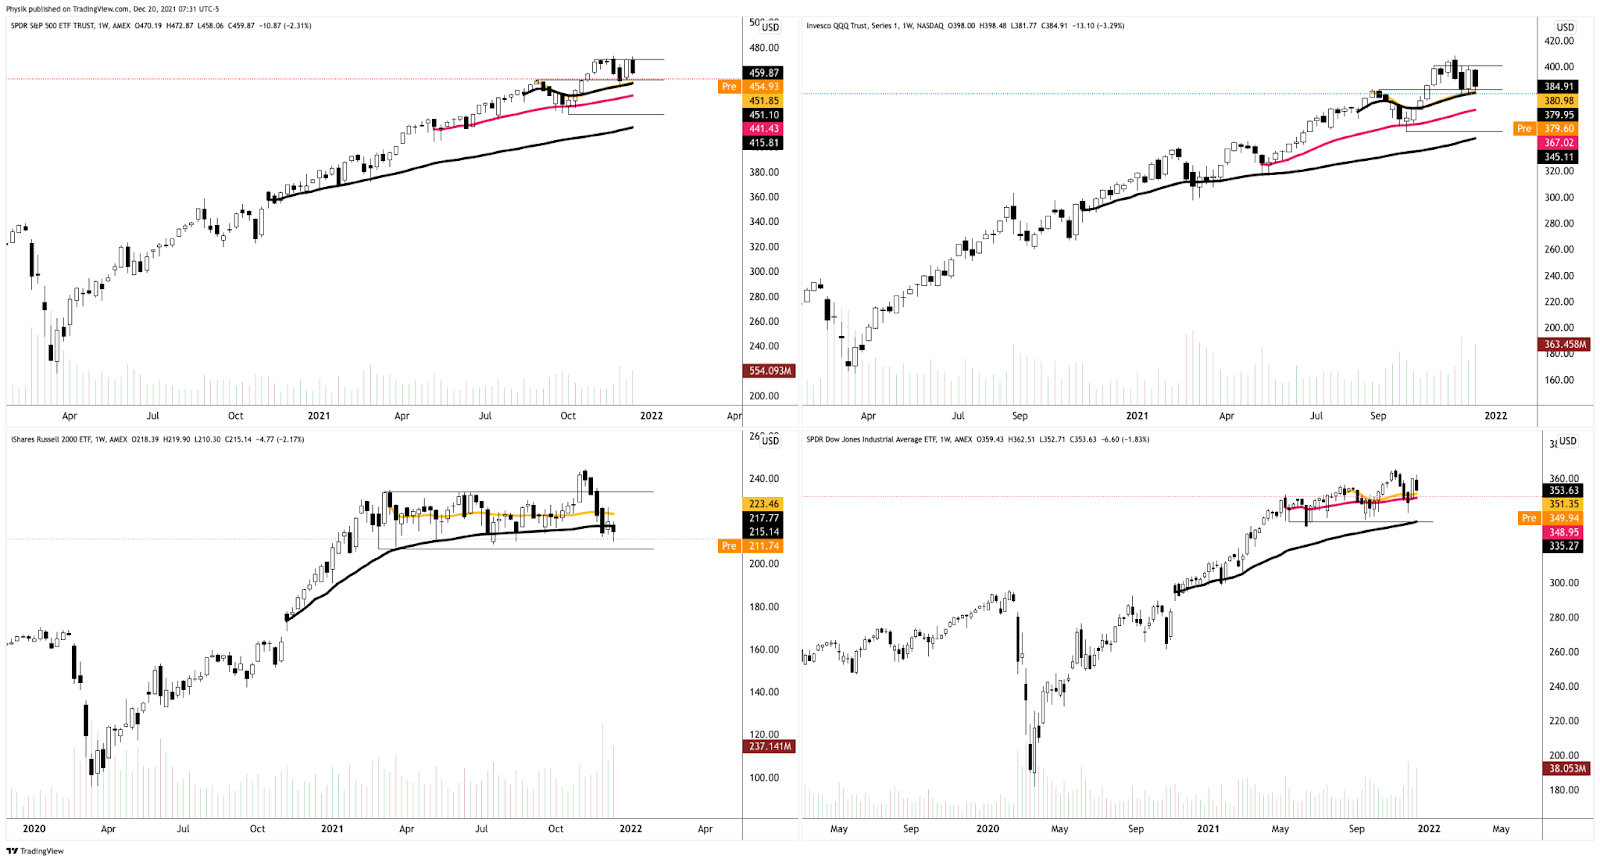
Overnight, equity index futures auctioned sideways to lower with growth-heavy and rate-sensitive names bearing the brunt of the move.
This is as Goldman Sachs Group (NYSE: GS) economists reduced their U.S. economic growth expectations, Senator Joe Manchin rejected a $2 trillion tax-and-spending package, hawkish central bank pivots, and rising COVID-19 lockdown risks.
Ahead is data on leading economic indicators (10:00 AM ET).
What To Expect
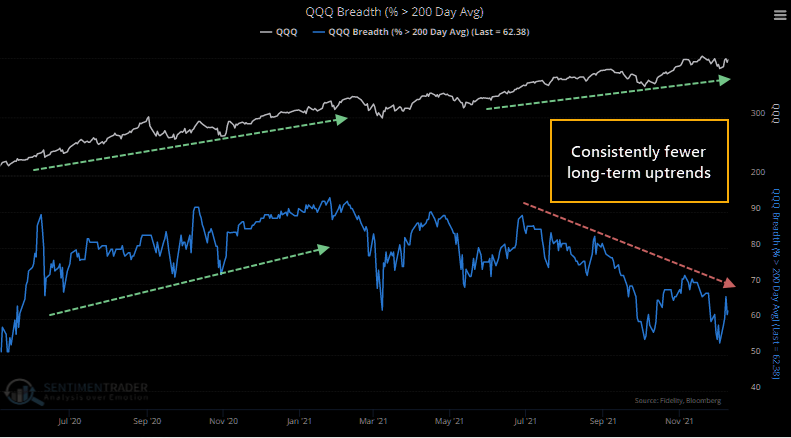
Divergent breadth in less heavily-weighted constituents, and what remains of “put-heavy” positioning, coupled with recent fundamental developments, is feeding into lower index prices.
Though the December 17 options expiration (OPEX) cleared positive delta and quite a bit of negative delta (e.g., the ARK Innovation ETF [NYSE: ARKK] had $1.5 billion in notional put delta expire) which, in theory, should open a window of strength and realized volatility, wherein positive fundamental forces and dealers’ covering of hedges would bolster any recovery, the January 21 expiry still carries $1.7 billion in notional put delta.
Continued weakness and higher volatility, among other things, likely solicits dealer hedging of exposure to increasing positive delta; weakness has dealers selling against short-dated, increasingly sensitive negative gamma positioning.
With breadth still to recover, a clear expansion of range places the S&P 500 below its 20- and 50-day simple moving averages, the levels which solicited responsive buying by short-term, visual traders who often lack the wherewithal (both emotional and financial) to defend retests.
Context: “The Fed is seen responding to the inflation fears stalking businesses by leaning toward an older playbook of prioritizing the fight against price pressures — even if that risks weaker growth over the longer term,” per Bloomberg.
Notwithstanding, per Nasdaq, “growth in earnings is so far stronger than the multiple compression caused by rising rates,” and that is what has helped support this year’s rally.
Couple that with the management of massive S&P positions, and relentless, seasonally-aligned “passive buying support,” in the face of expectations there will be “the strongest quarterly nominal [economic] growth in more than three decades,” weakness (especially in growth-heavy and rate-sensitive names) remains.
That’s due in part to some of the dynamics discussed in an earlier section, coupled with some negative fundamental developments like the rejection of an economic stimulus package, cuts to Goldman Sachs Group’s GDP forecasts, among other things.
I end with a note from JPMorgan Chase & Co’s (NYSE: JPM) Marko Kolanovic who expects a year-end rally to be driven by stocks targeted by short-sellers.
“For short-selling campaigns to succeed, there have to be positioning, liquidity and often systematic amplifiers of the selloff,” Kolanovic wrote.
“We believe these conditions are not met, and hence this market episode may end up in a short squeeze and cyclical rally into year-end and January.”
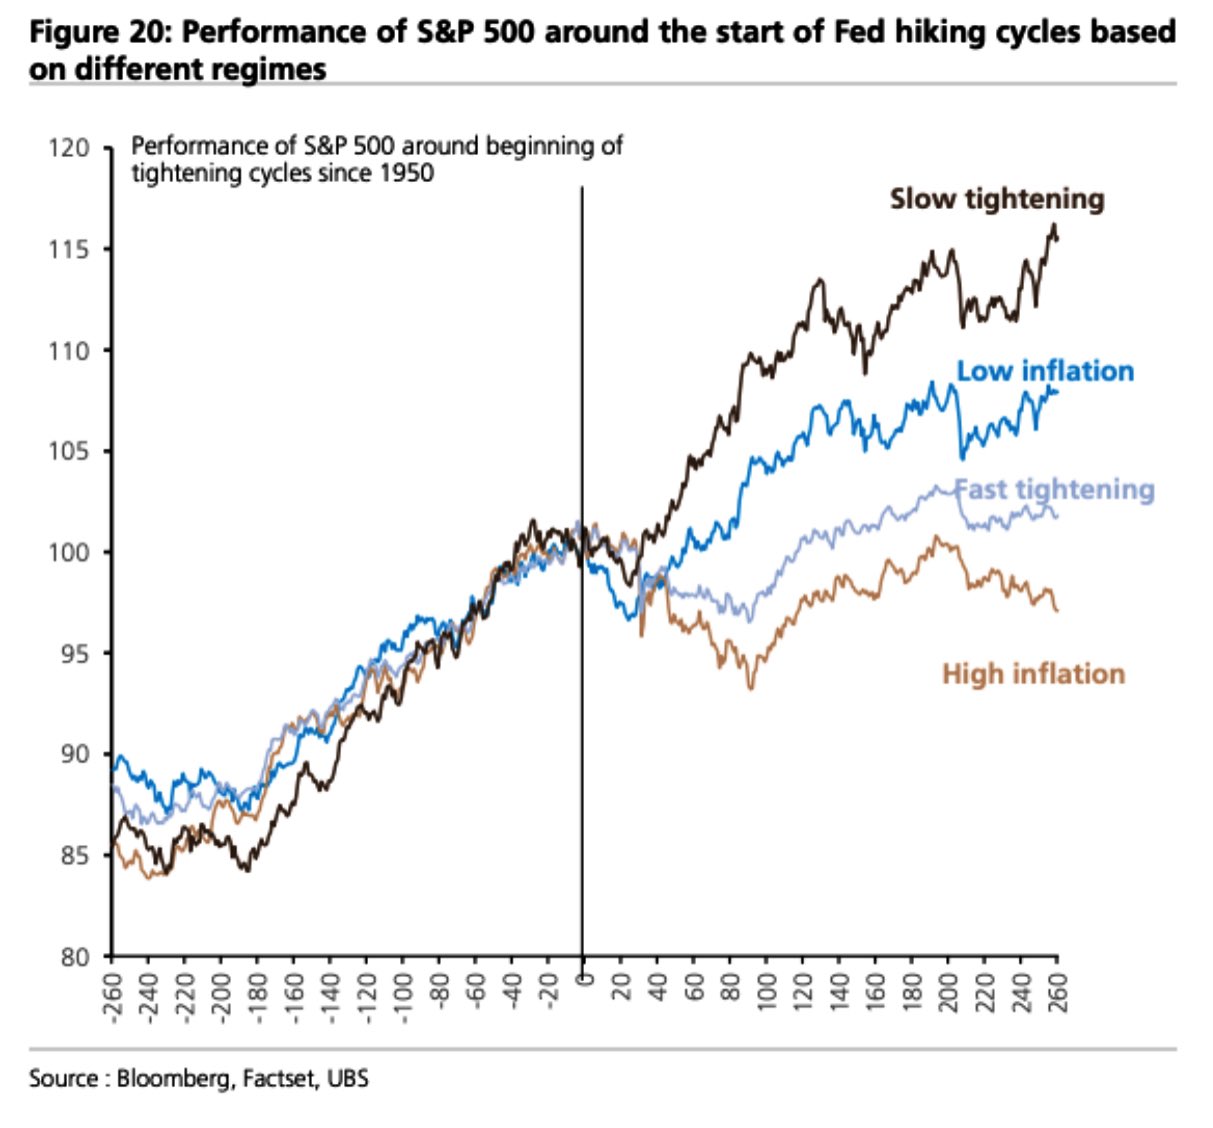
That aligns with light positioning, improving seasonality metrics, and data that suggests equity markets tend to rally into the first hike.
Expectations: As of 6:40 AM ET, Monday’s regular session (9:30 AM – 4:00 PM ET), in the S&P 500, will likely open in the middle part of a negatively skewed overnight inventory, outside of prior-range and -value, suggesting a potential for immediate directional opportunity.
Gap Scenarios: Gaps ought to fill quickly. Should they not, that’s a signal of strength; do not fade. Leaving value behind on a gap-fill or failing to fill a gap (i.e., remaining outside of the prior session’s range) is a go-with indicator.

Auctioning and spending at least 1-hour of trade back in the prior range suggests a lack of conviction; in such a case, do not follow the direction of the most recent initiative activity.
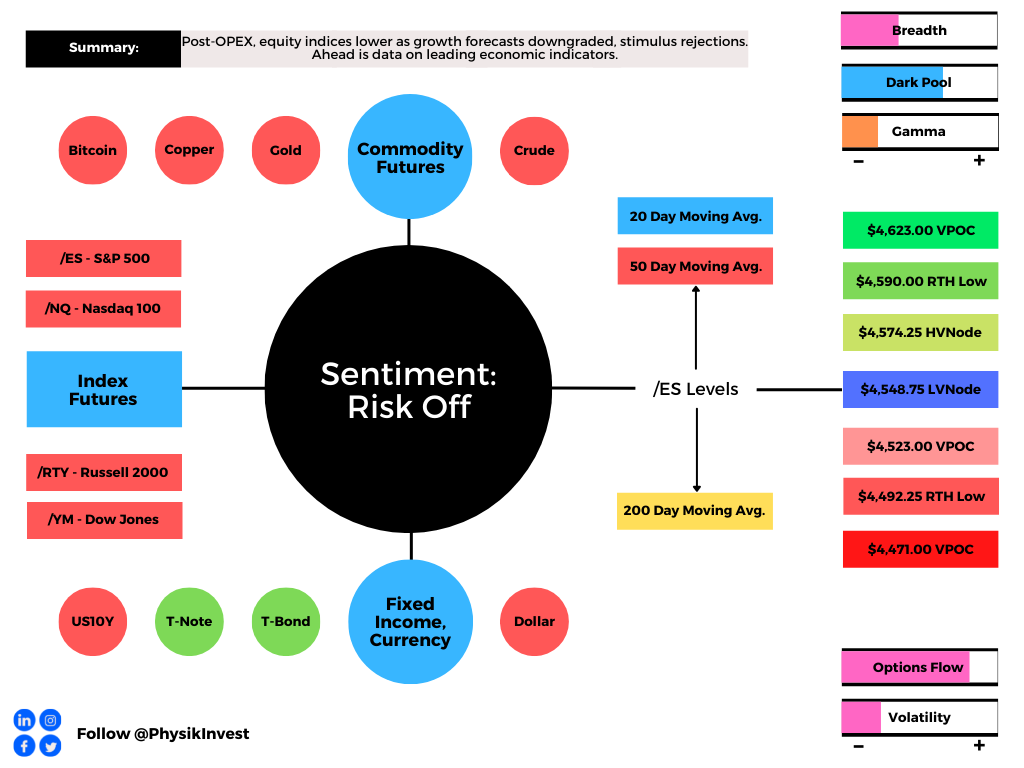
In the best case, the S&P 500 trades sideways or higher; activity above the $4,548.75 low volume area (LVNode) puts in play the $4,574.25 high volume area (HVNode). Initiative trade beyond the HVNode could reach as high as the $4,590.00 regular trade low (RTH Low) and $4,623.00 untested point of control (VPOC), or higher.
In the worst case, the S&P 500 trades lower; activity below the $4,548.75 LVNode puts in play the $4,523.00 VPOC. Initiative trade beyond the VPOC could reach as low as the $4,492.25 RTH Low and $4,471.00 VPOC, or lower.
Click here to load today’s key levels into the web-based TradingView charting platform. Note that all levels are derived using the 65-minute timeframe. New links are produced, daily.

Definitions
Volume Areas: A structurally sound market will build on areas of high volume (HVNodes). Should the market trend for long periods of time, it will lack sound structure, identified as low volume areas (LVNodes). LVNodes denote directional conviction and ought to offer support on any test.
If participants were to auction and find acceptance into areas of prior low volume (LVNodes), then future discovery ought to be volatile and quick as participants look to HVNodes for favorable entry or exit.
POCs: POCs are valuable as they denote areas where two-sided trade was most prevalent in a prior day session. Participants will respond to future tests of value as they offer favorable entry and exit.
MCPOCs: POCs are valuable as they denote areas where two-sided trade was most prevalent over numerous day sessions. Participants will respond to future tests of value as they offer favorable entry and exit.
Volume-Weighted Average Prices (VWAPs): A metric highly regarded by chief investment officers, among other participants, for quality of trade. Additionally, liquidity algorithms are benchmarked and programmed to buy and sell around VWAPs.
About
After years of self-education, strategy development, and trial-and-error, Renato Leonard Capelj began trading full-time and founded Physik Invest to detail his methods, research, and performance in the markets.
Additionally, Capelj is a Benzinga finance and technology reporter interviewing the likes of Shark Tank’s Kevin O’Leary, JC2 Ventures’ John Chambers, and ARK Invest’s Catherine Wood, as well as a SpotGamma contributor, helping develop insights around impactful options market dynamics.
Disclaimer
At this time, Physik Invest does not carry the right to provide advice. In no way should the materials herein be construed as advice. Derivatives carry a substantial risk of loss. All content is for informational purposes only.