Editor’s Note: The Daily Brief is a free glimpse into the prevailing fundamental and technical drivers of U.S. equity market products. Join the 200+ that read this report daily, below!
What Happened
Overnight, equity indices auctioned lower, further into the thick of Monday’s wide trading range.
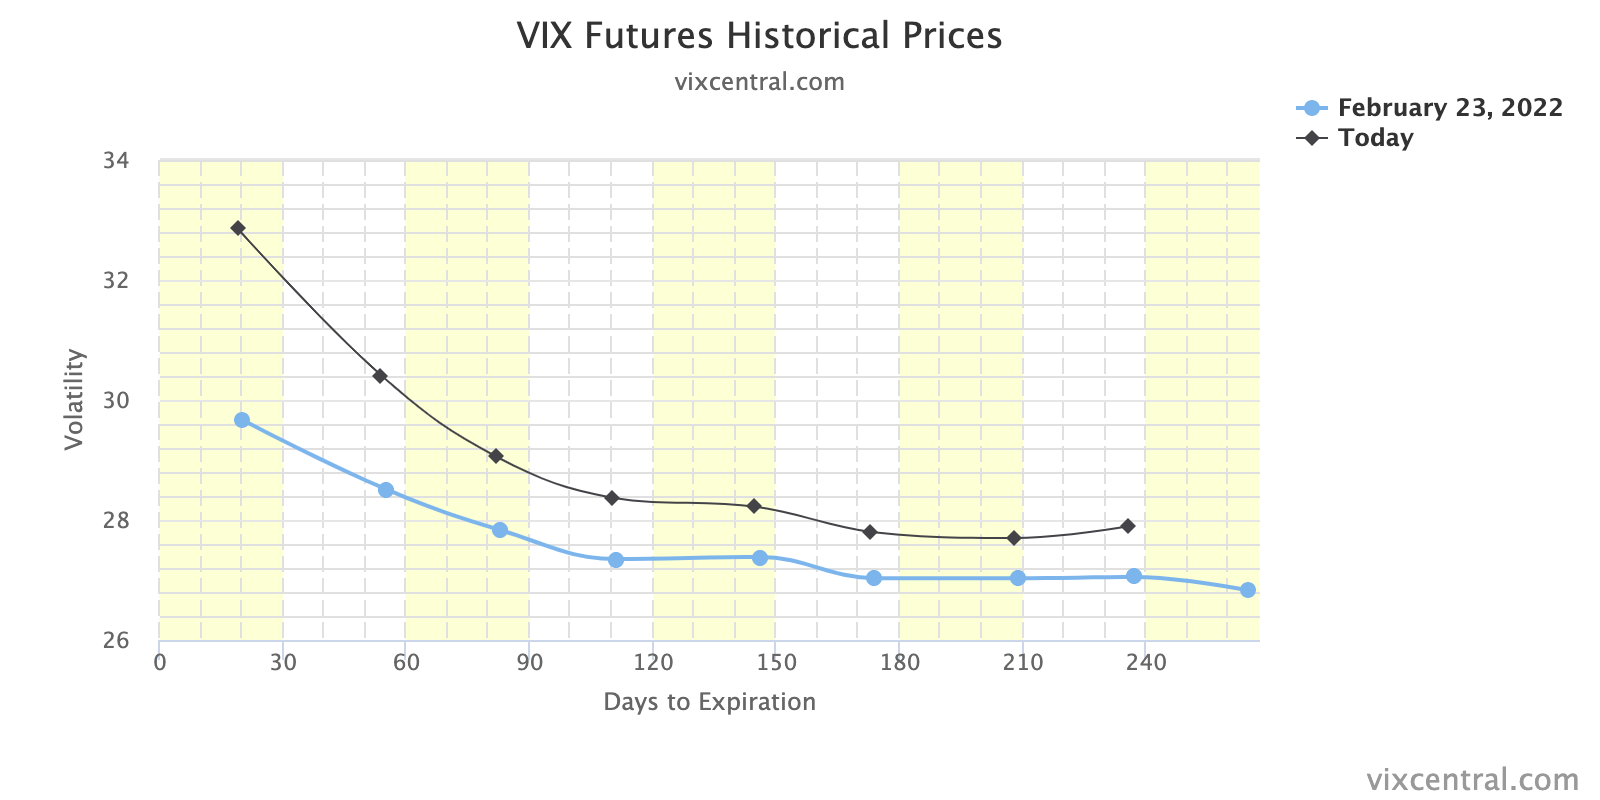
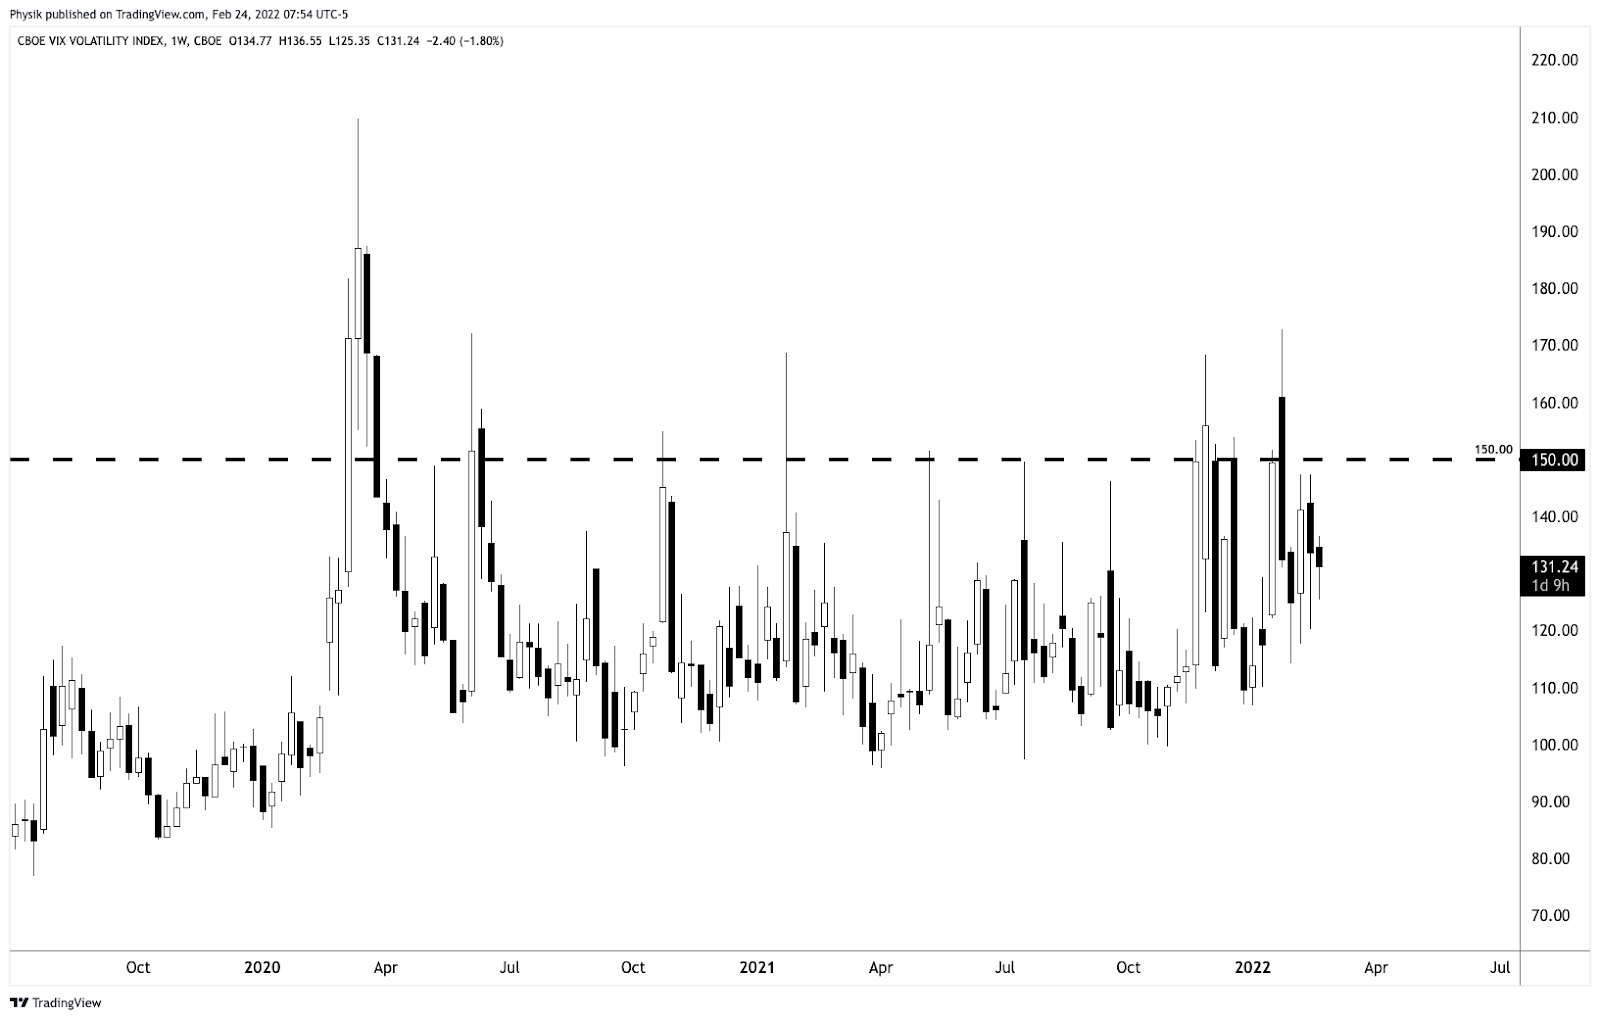
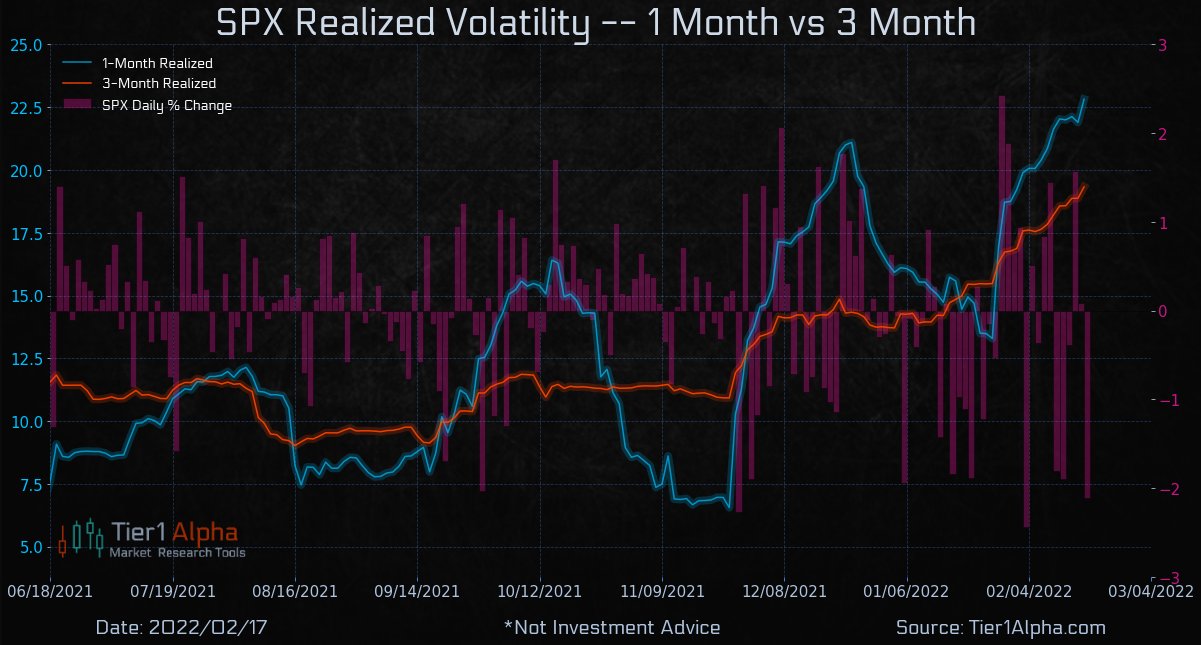
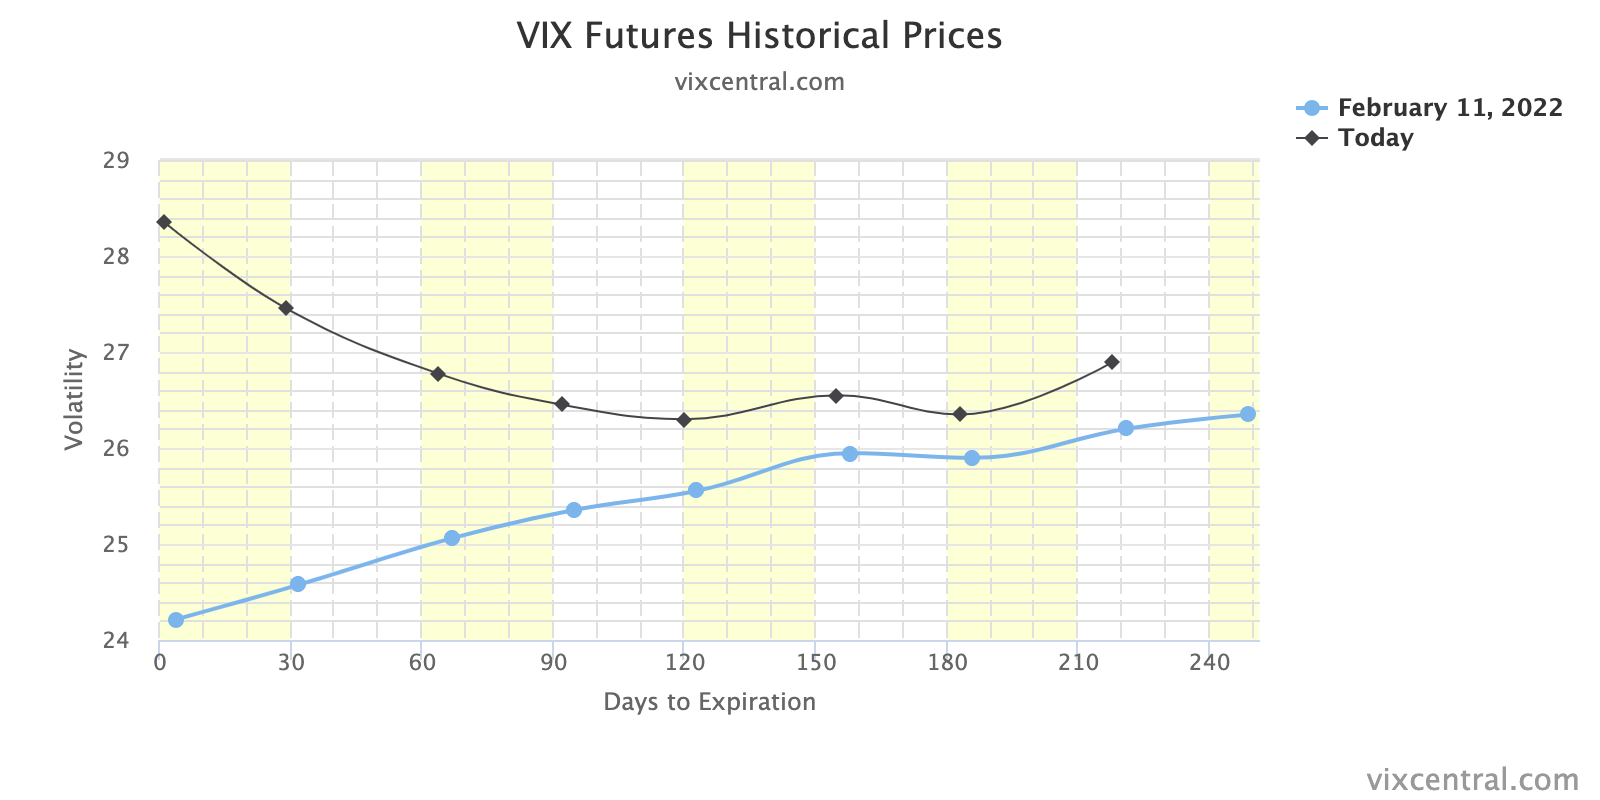
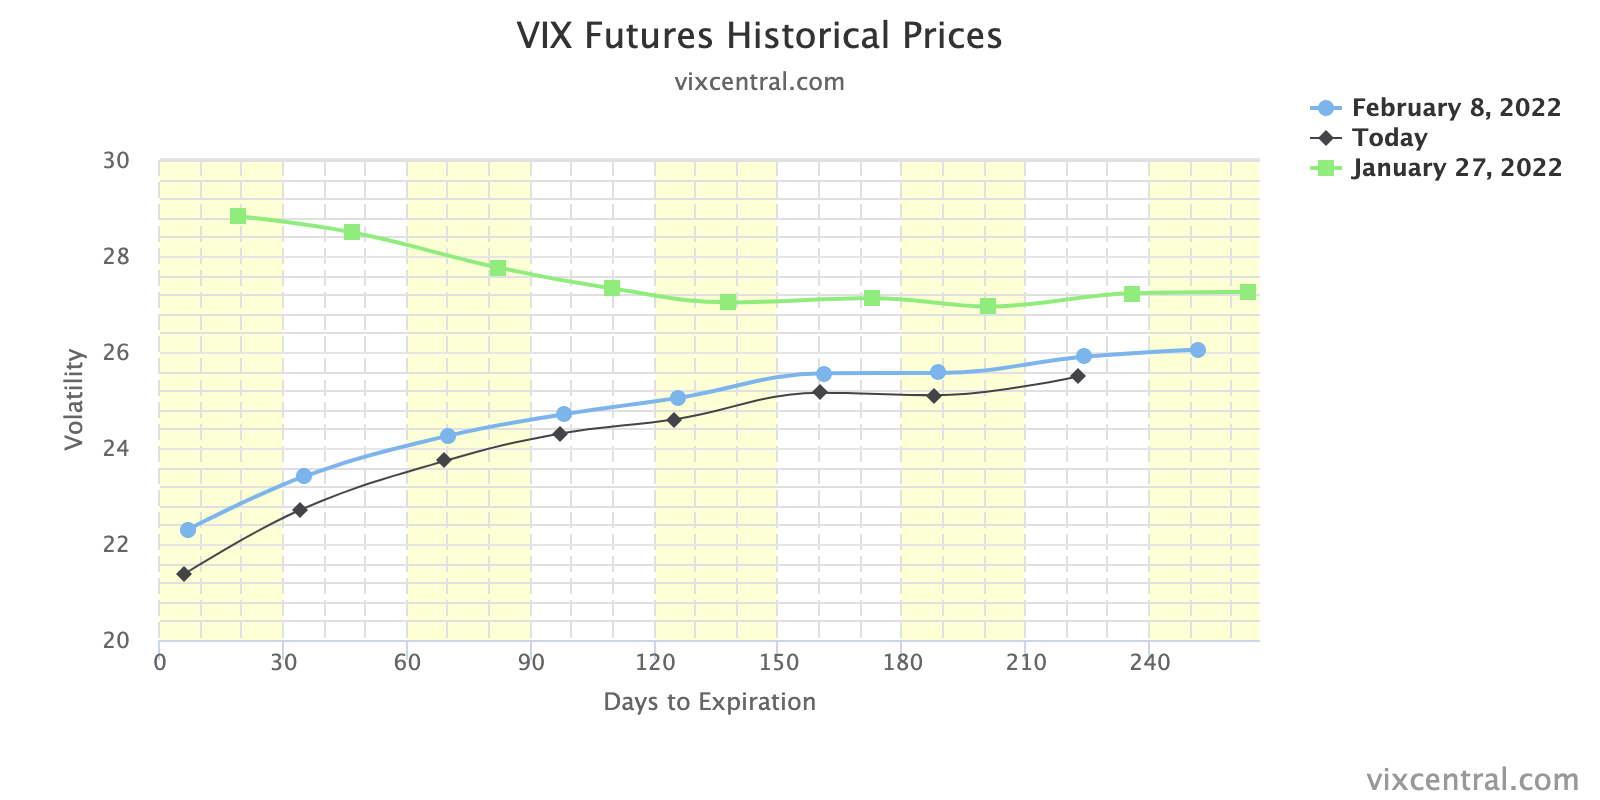
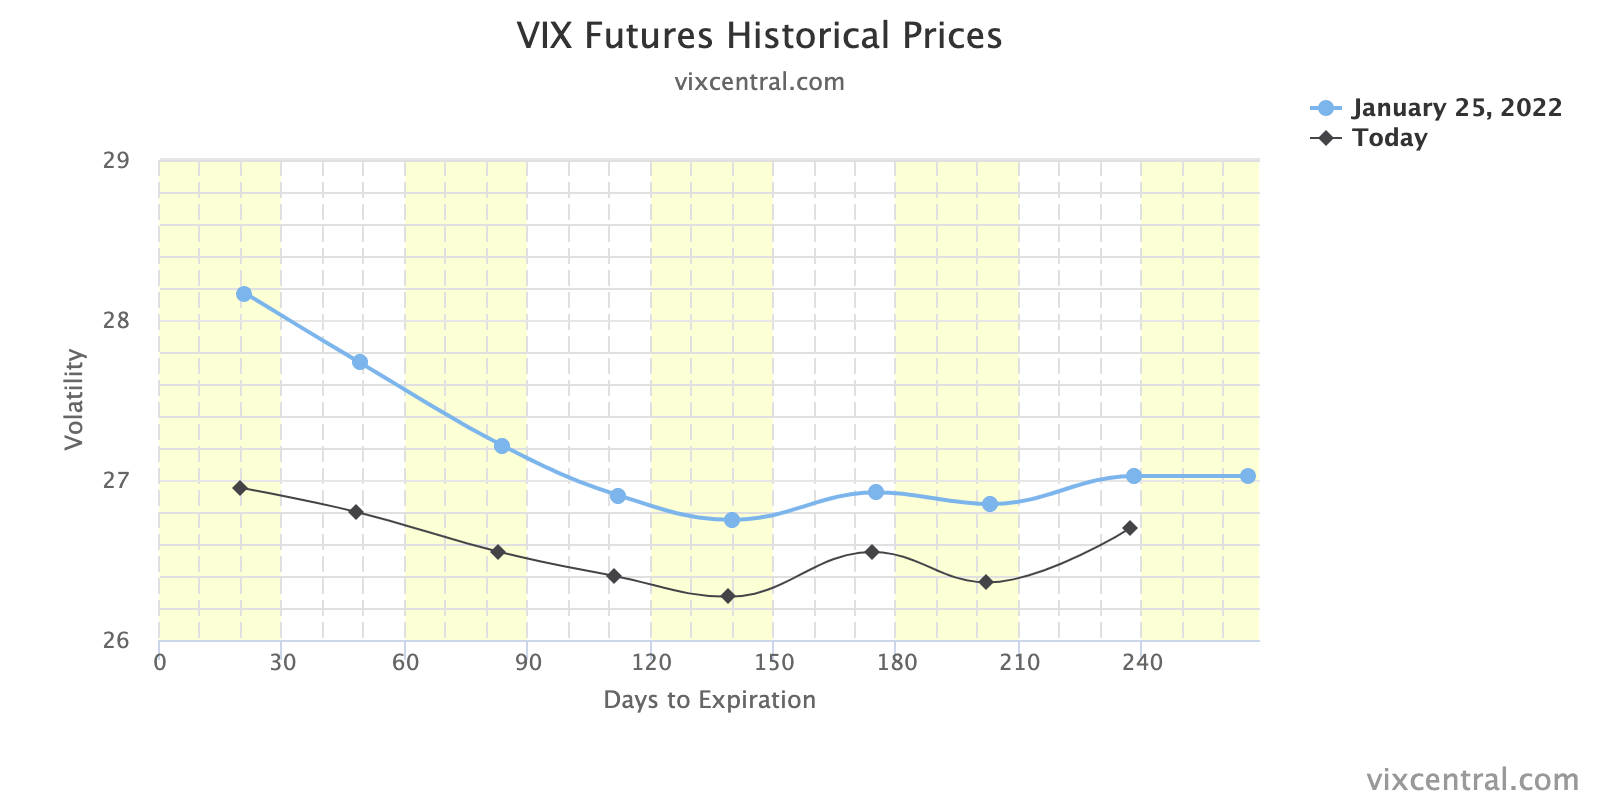
The implied volatility (VIX) term structure is downward sloping as front-month contracts price higher than those in the back as a result of participants’ heightened fear in the short-term.
The take by some on current events and their impact on markets is mixed.
Some suggest the ‘worst might be behind us’ while others suggest markets may tend toward instability until participants’ fears are assuaged at the next Federal Reserve meeting, and the decline in so-called negative gamma exposures post-options expiry later this month.
Ahead is data on Markit manufacturing PMI (9:45 AM ET), as well as ISM manufacturing index and constructions spending (10:00 AM ET).
What To Expect
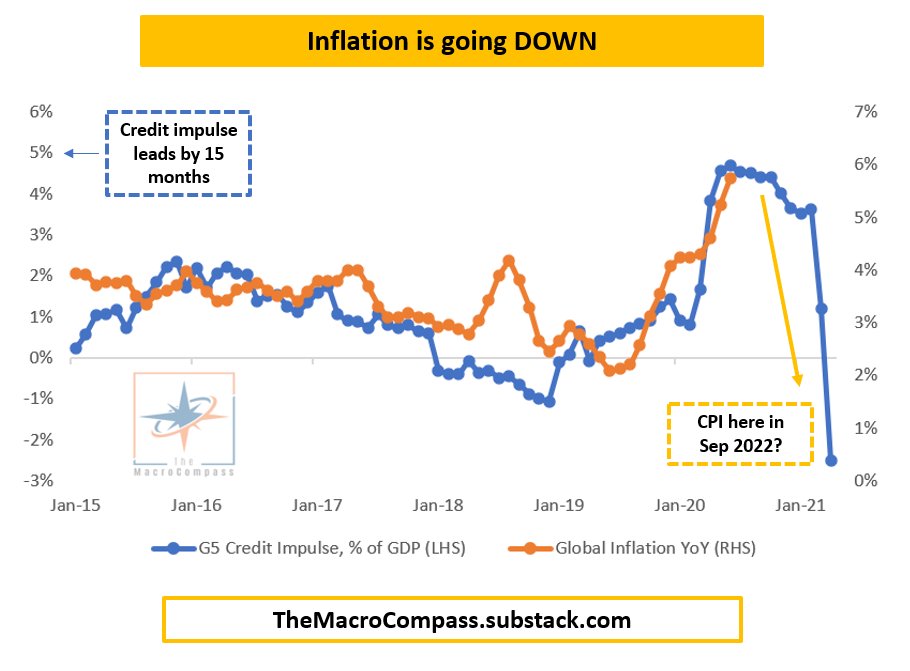
Fundamental: Pursuant to remarks this commentary disclosed yesterday from Credit Suisse Group AG’s (NYSE: CS) Zoltan Pozsar, other strategists, like JPMorgan Chase & Co’s (NYSE: JPM) Marko Kolanovic believe geopolitical conflicts (and harsh responses) are likely to dim the prospects for aggressive Federal Reserve monetary tightening initiatives.
“The worst might be behind us for risk assets,” Kolanovic said. The strategist sees heightened short-term opportunity in growth stocks such as tech and medium-term value in value stocks and commodity-linked assets.
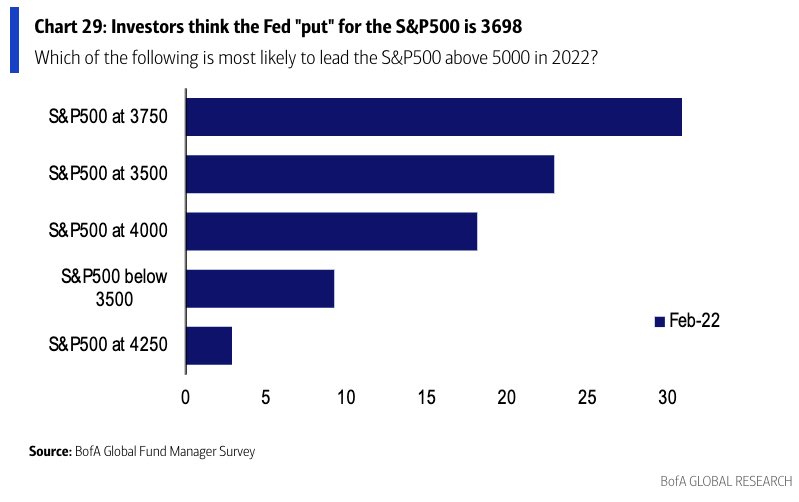
“Indirect risks are more substantial, given effects of higher commodity prices on inflation, growth, and consumers; however, one silver lining is that the crisis forced a dovish reassessment of the Fed by the market.”

This is in opposition to valuation worries by Morgan Stanley’s (NYSE: MS) Mike Wilson.
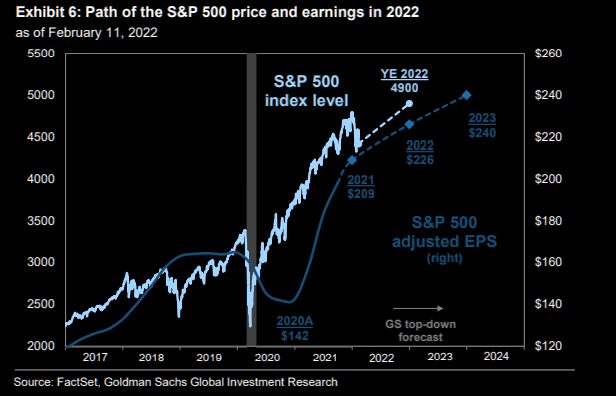
“The median stock forward P/E for the S&P is still 19x (94th percentile of historical levels back 40 years). We think this lends support to the idea that multiples across the index have room to compress due to our Ice thesis even after discounting the geopolitical developments of the last couple of weeks as well as a hawkish Fed.”
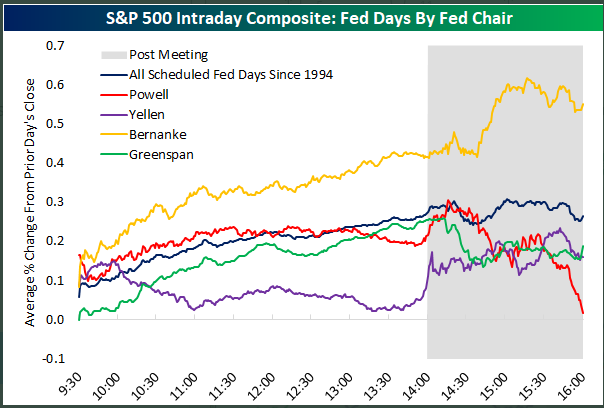
To note, historically speaking, though “big stock gains tend to happen late in a mid-term year, … be aware that March tends to see strength,” LPL Financial’s Ryan Detrick says.

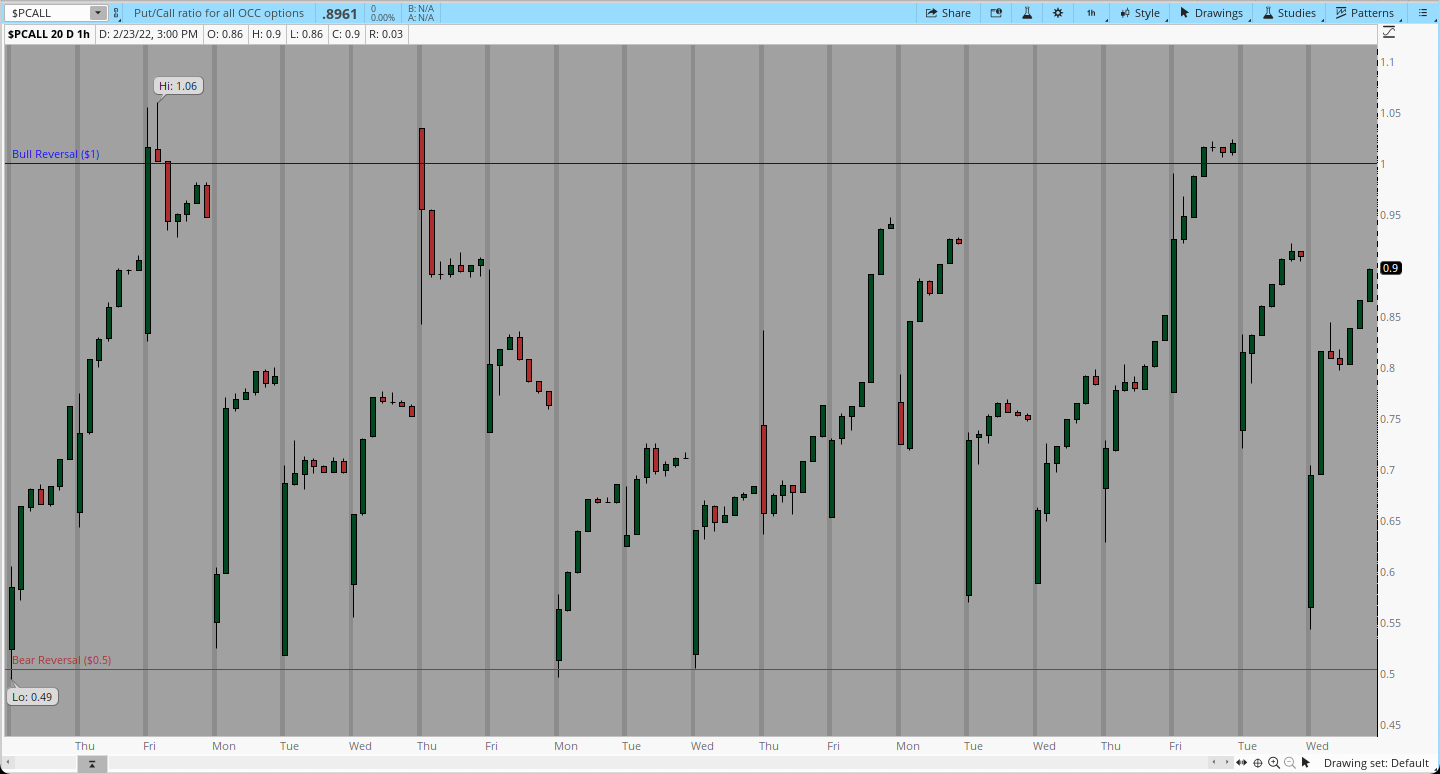
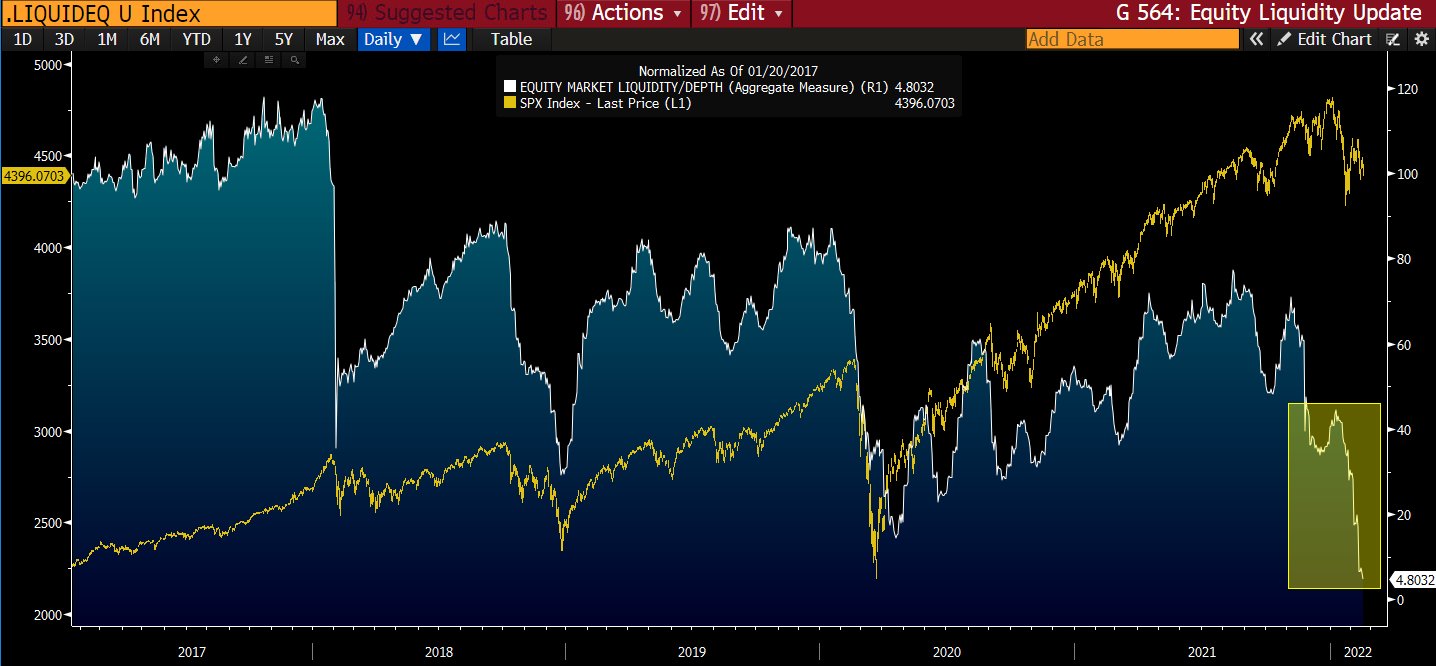
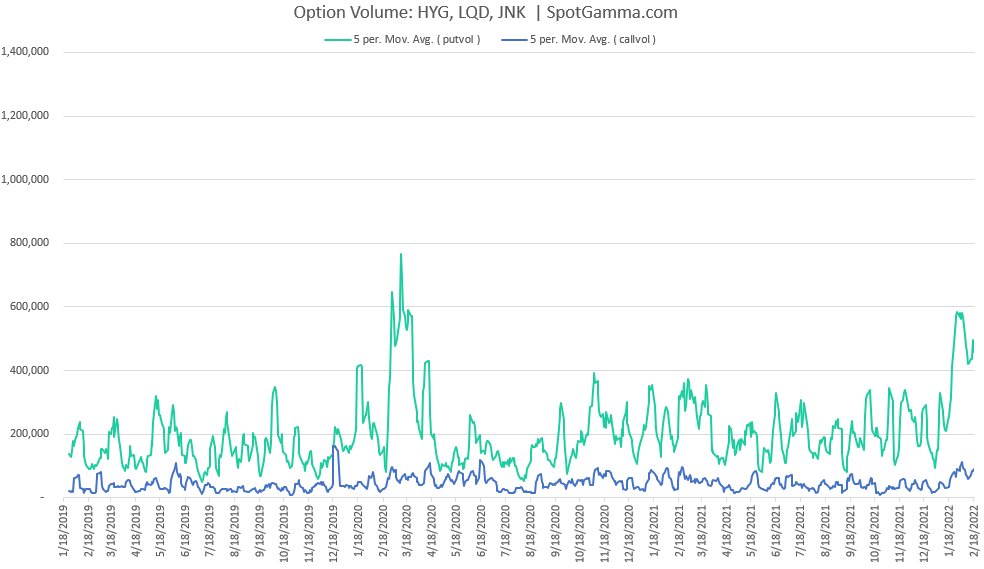
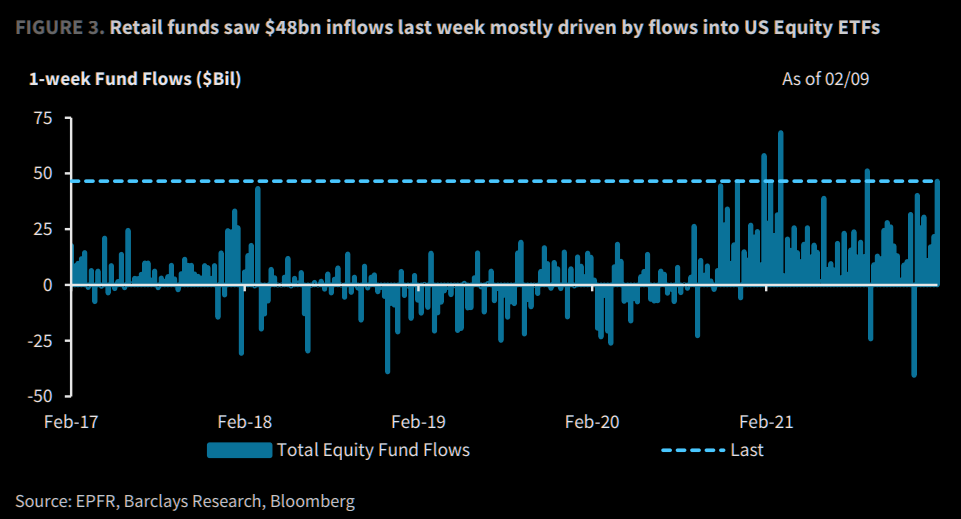
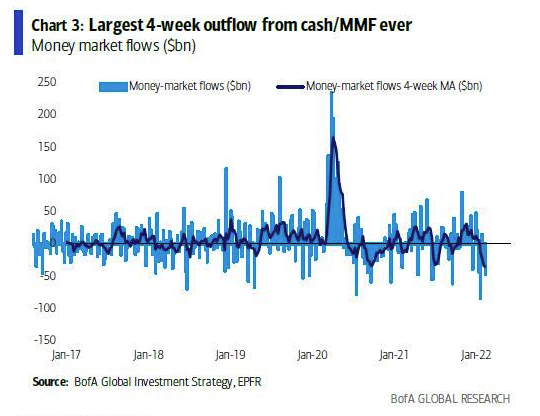
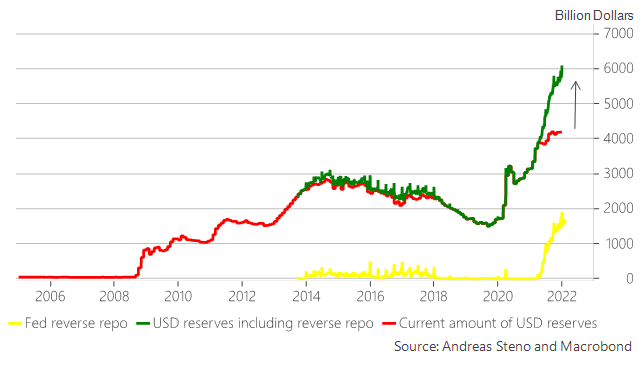
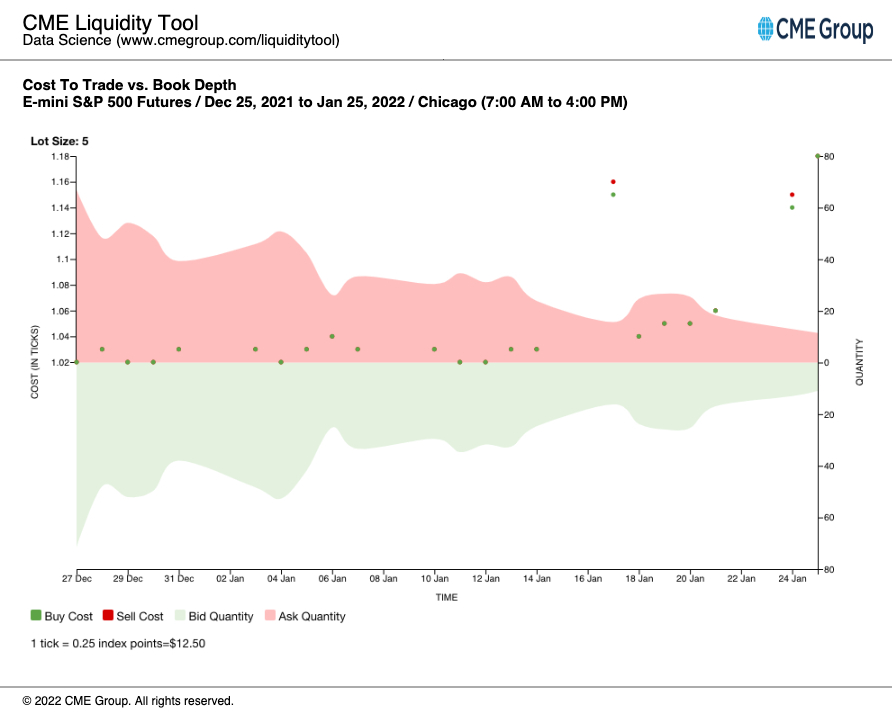
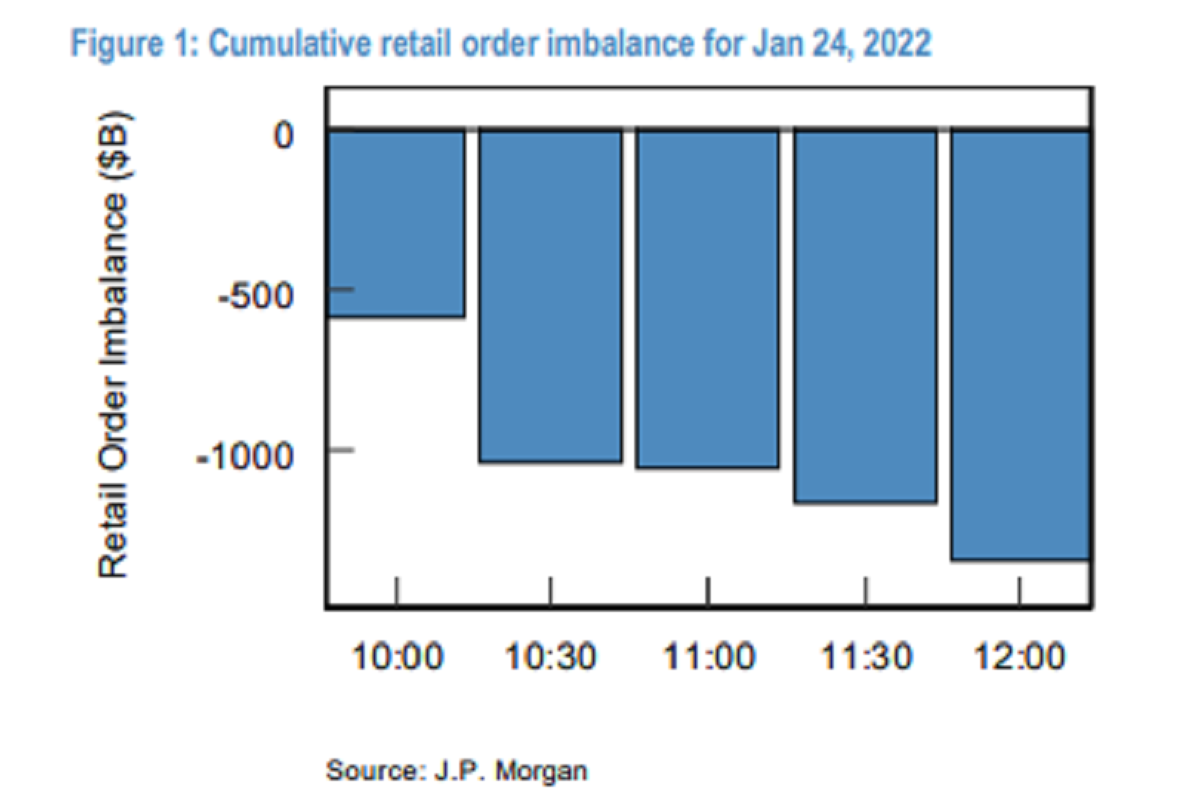
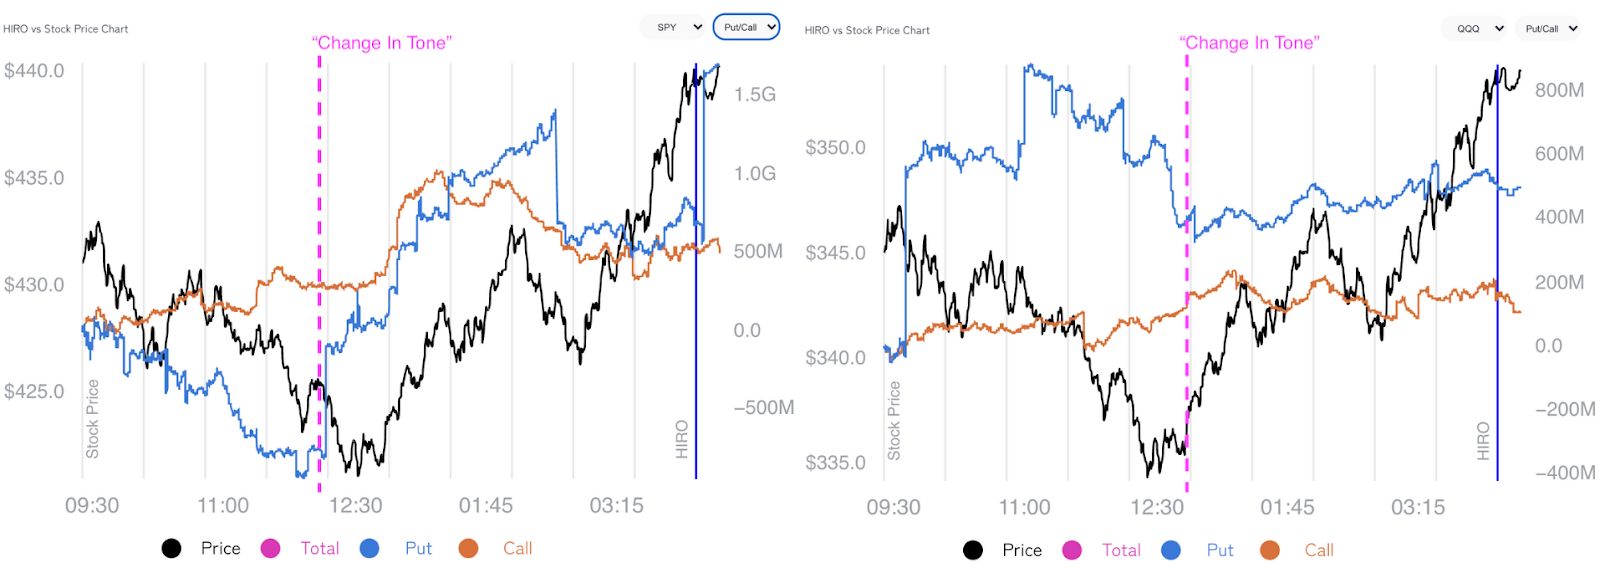
Positioning: As stated, yesterday, there is strong passive buying support (via buybacks and retail inflows), and this is in the face of a negative-gamma, lower liquidity, high-volatility regime.

Participants have pulled forward their bets and are trading in some of the most short-dated contracts, and this is evidenced still via a downward sloping VIX term structure.
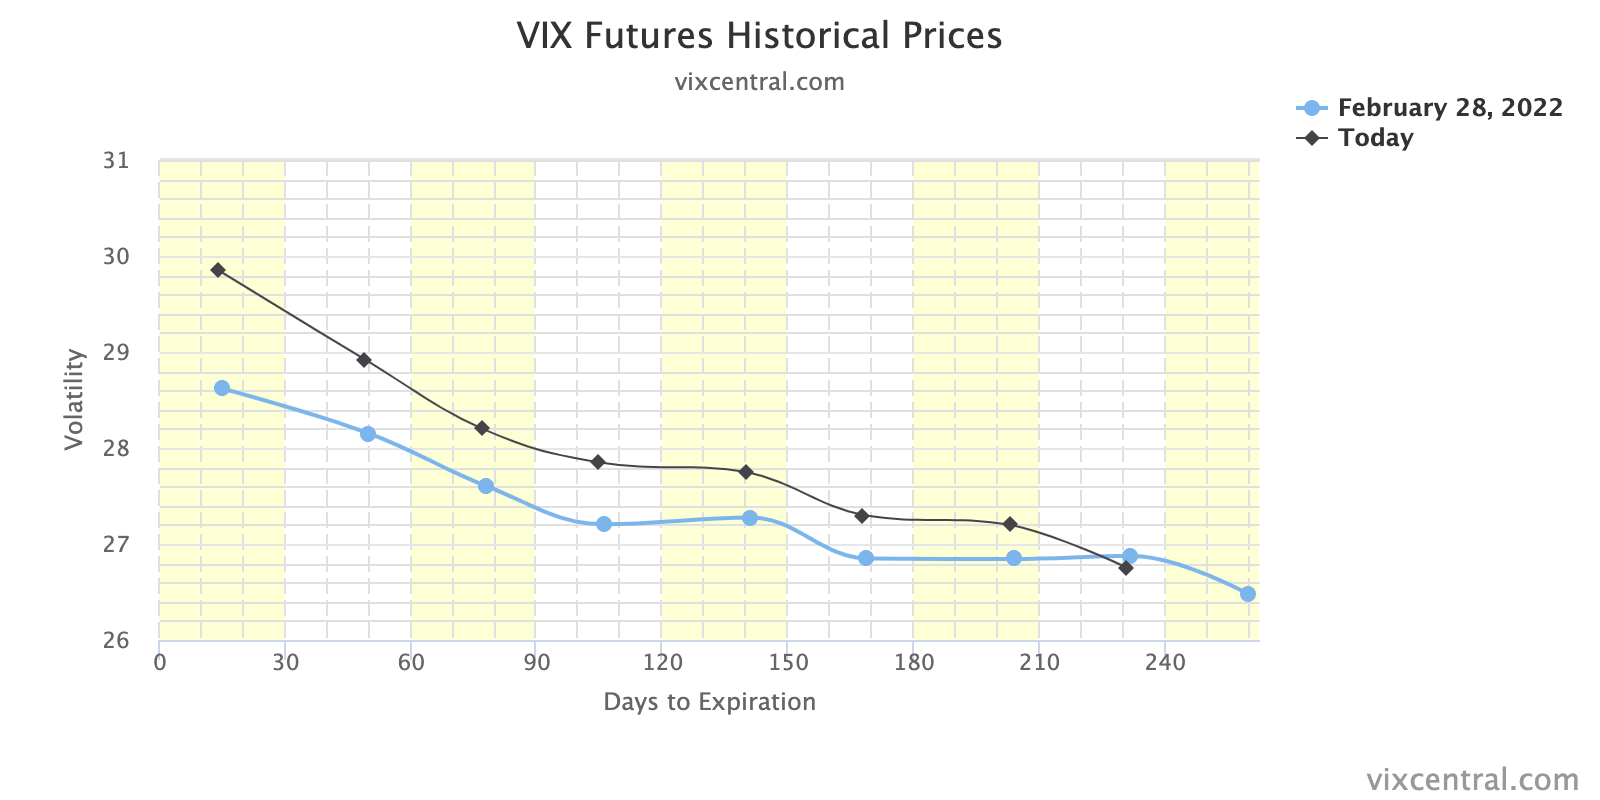
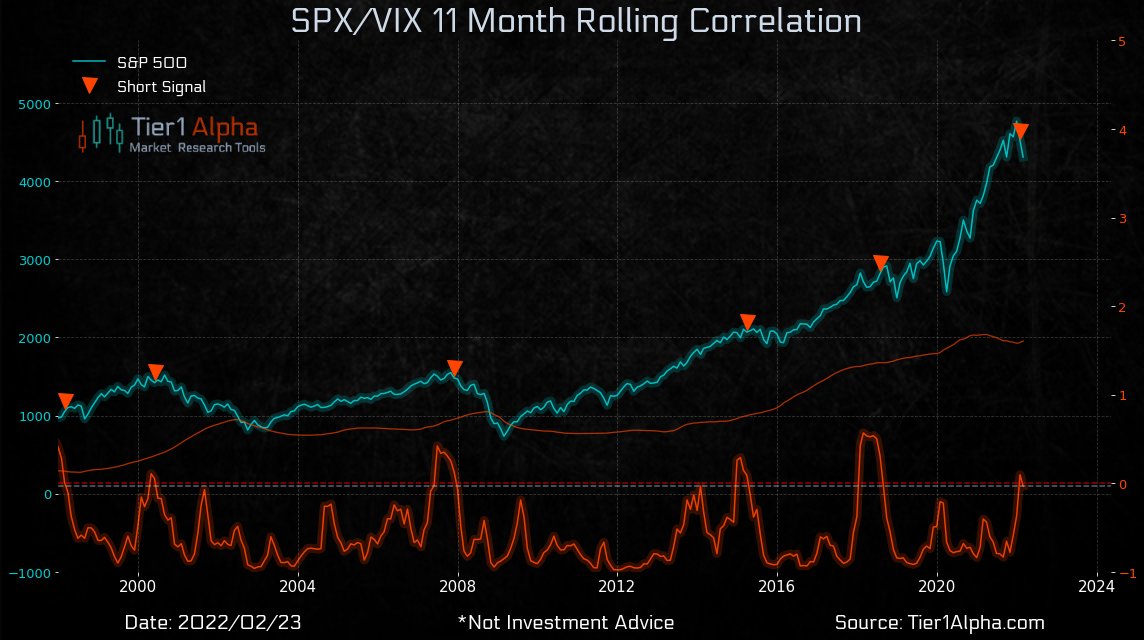
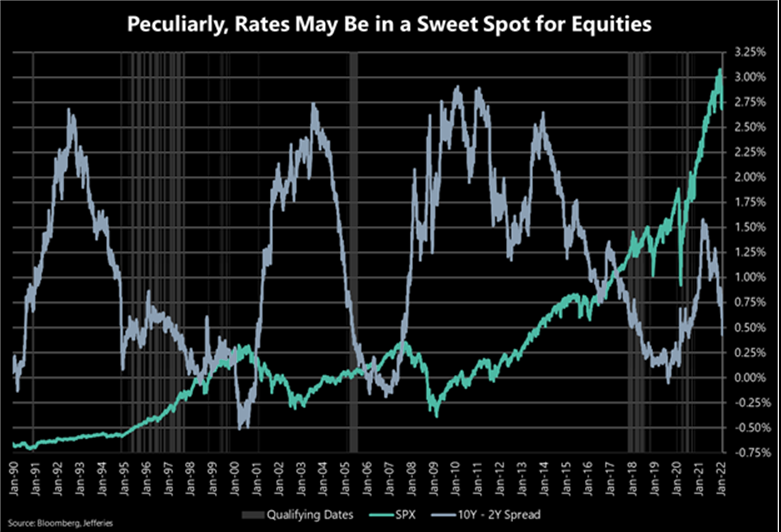
Jefferies Financial Group (NYSE: JEF) ran an analysis and found that VIX inversions often precede positive resolve.
“[W]e ran SPX performance from VIX inversions going back to 2004. While the performance seems a bit middling, outside of the GFC, it balloons, with 6M SPX performance over 6% and 12M over 12%. In addition, the inversion we saw on Wednesday was over 3 handles, which has led to even better performance. Outside of the GFC, 12M SPX performance has averaged over 17% and been positive in every single instance.”

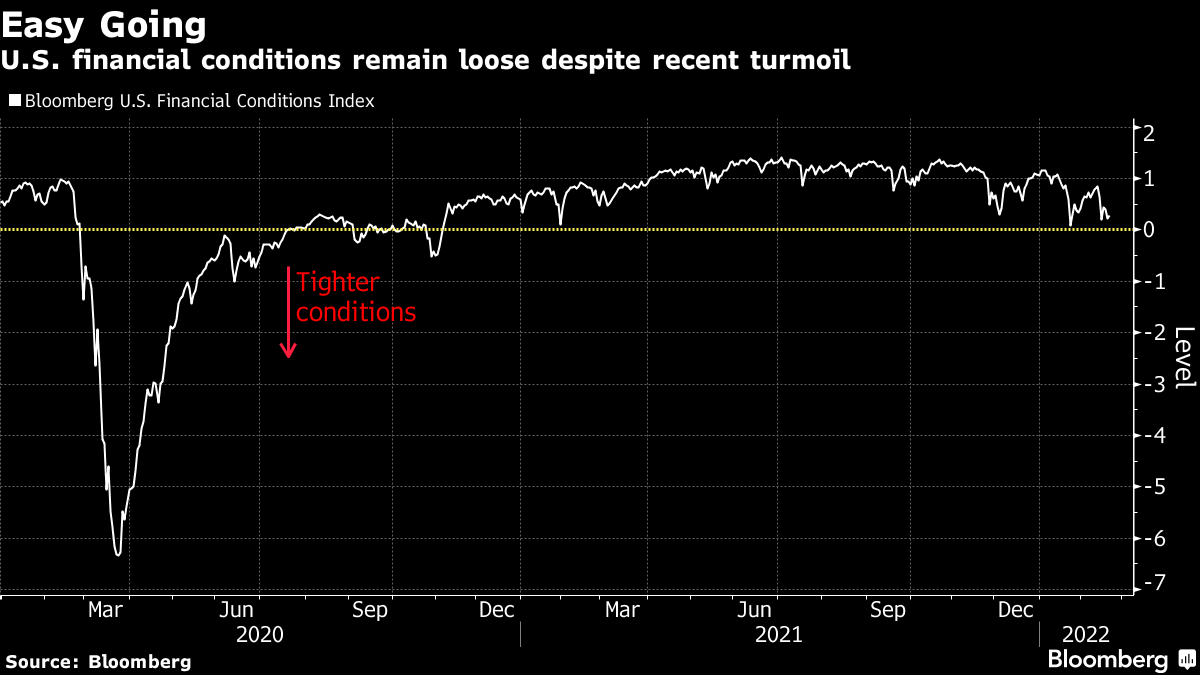
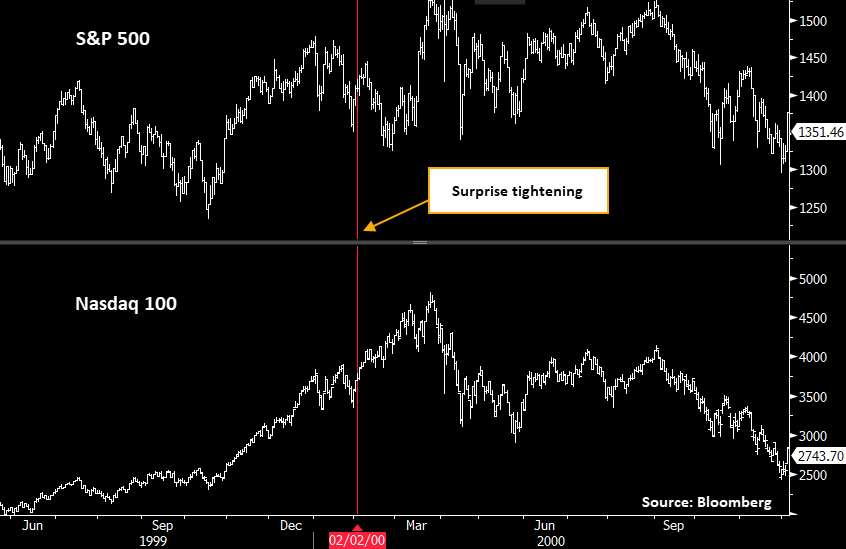
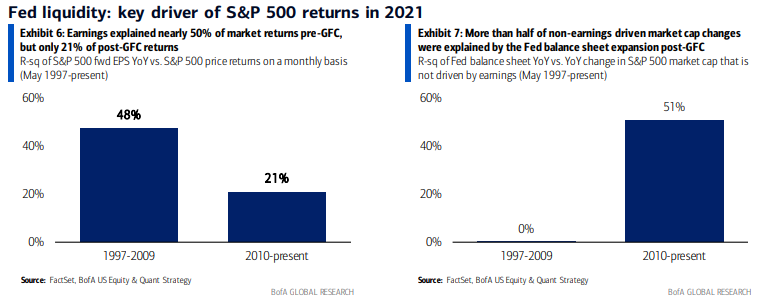
Further, prevailing monetary frameworks and max liquidity promoted a large divergence in price from fundamentals. The evolution of monetary policy may make valuations much less justifiable.
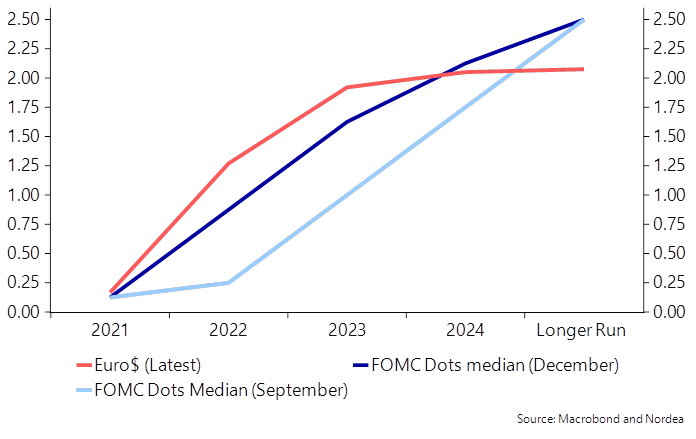
Therefore, participants are looking to events such as the March Federal Open Market Committee (FOMC) meeting mid-March (March 15-16) for clarity on policy.
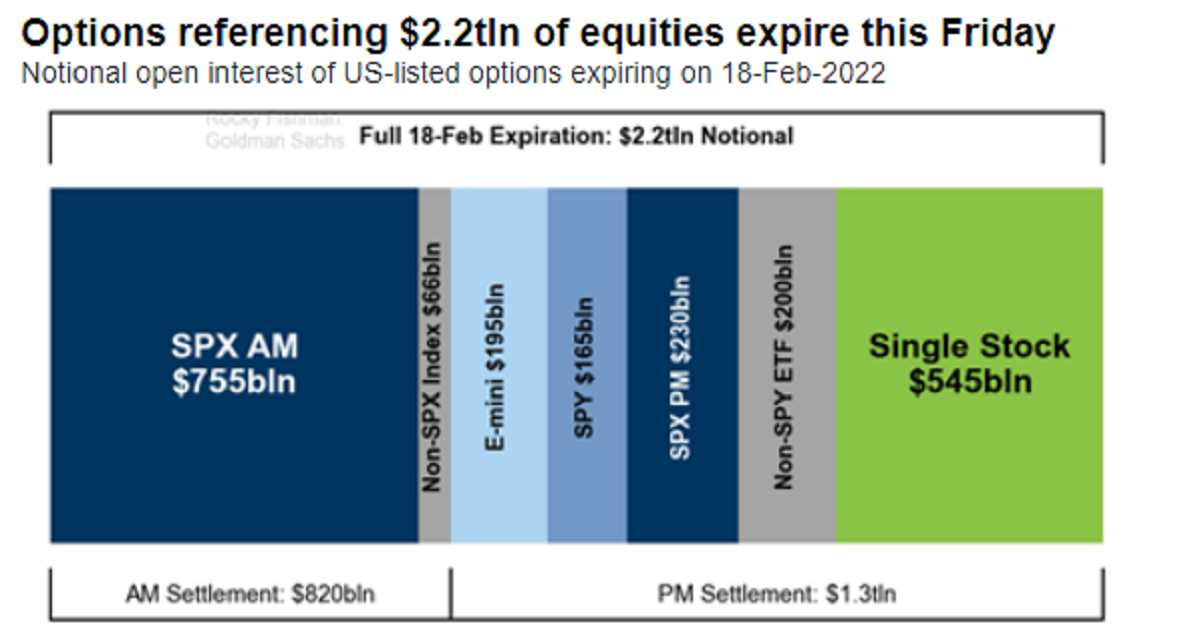
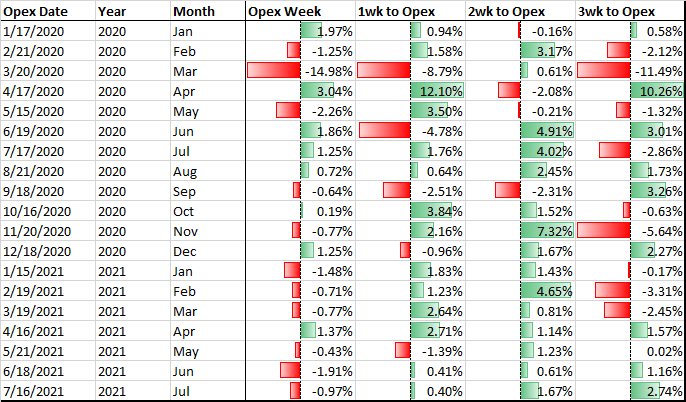
After this event provides clarity and potentially assuages participants of their fears, there is a large options expiration the same week.
Participants having less fear likely coincides with the lesser need to hedge, while the large options expiration is to “reset” options counterparty gamma exposures.
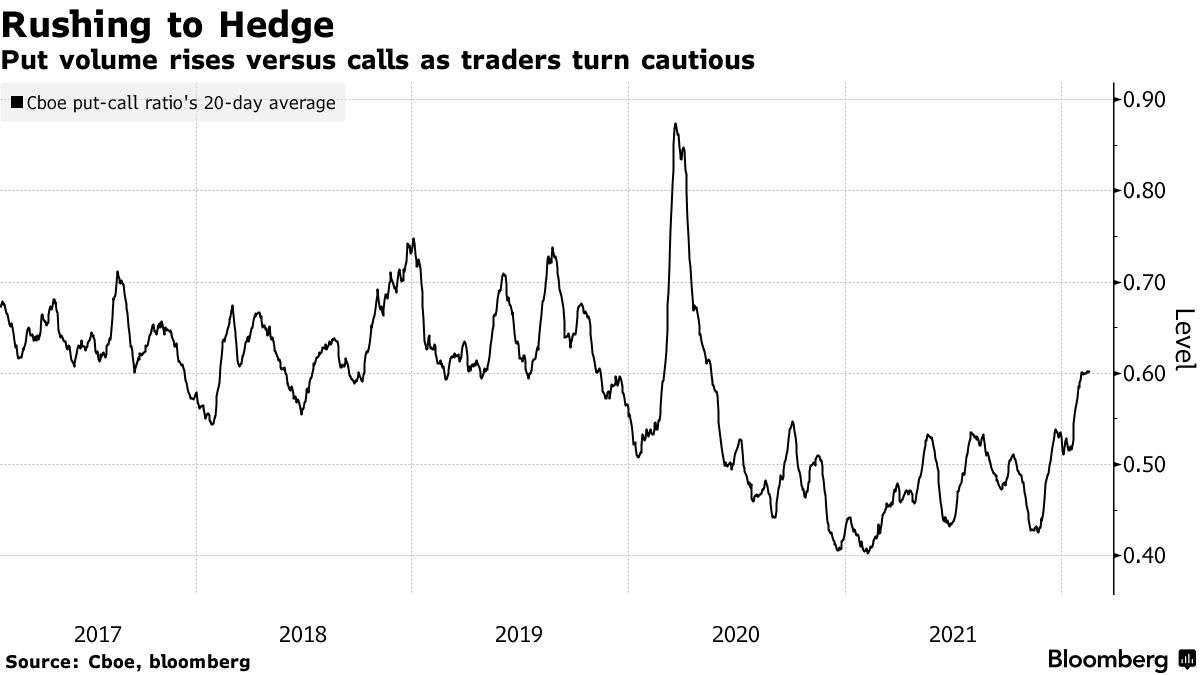
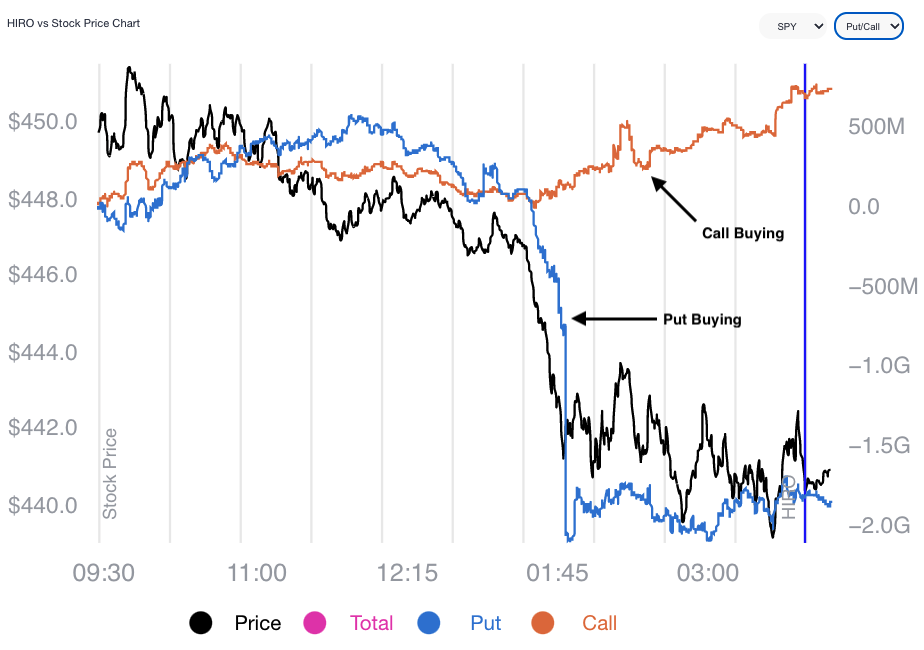
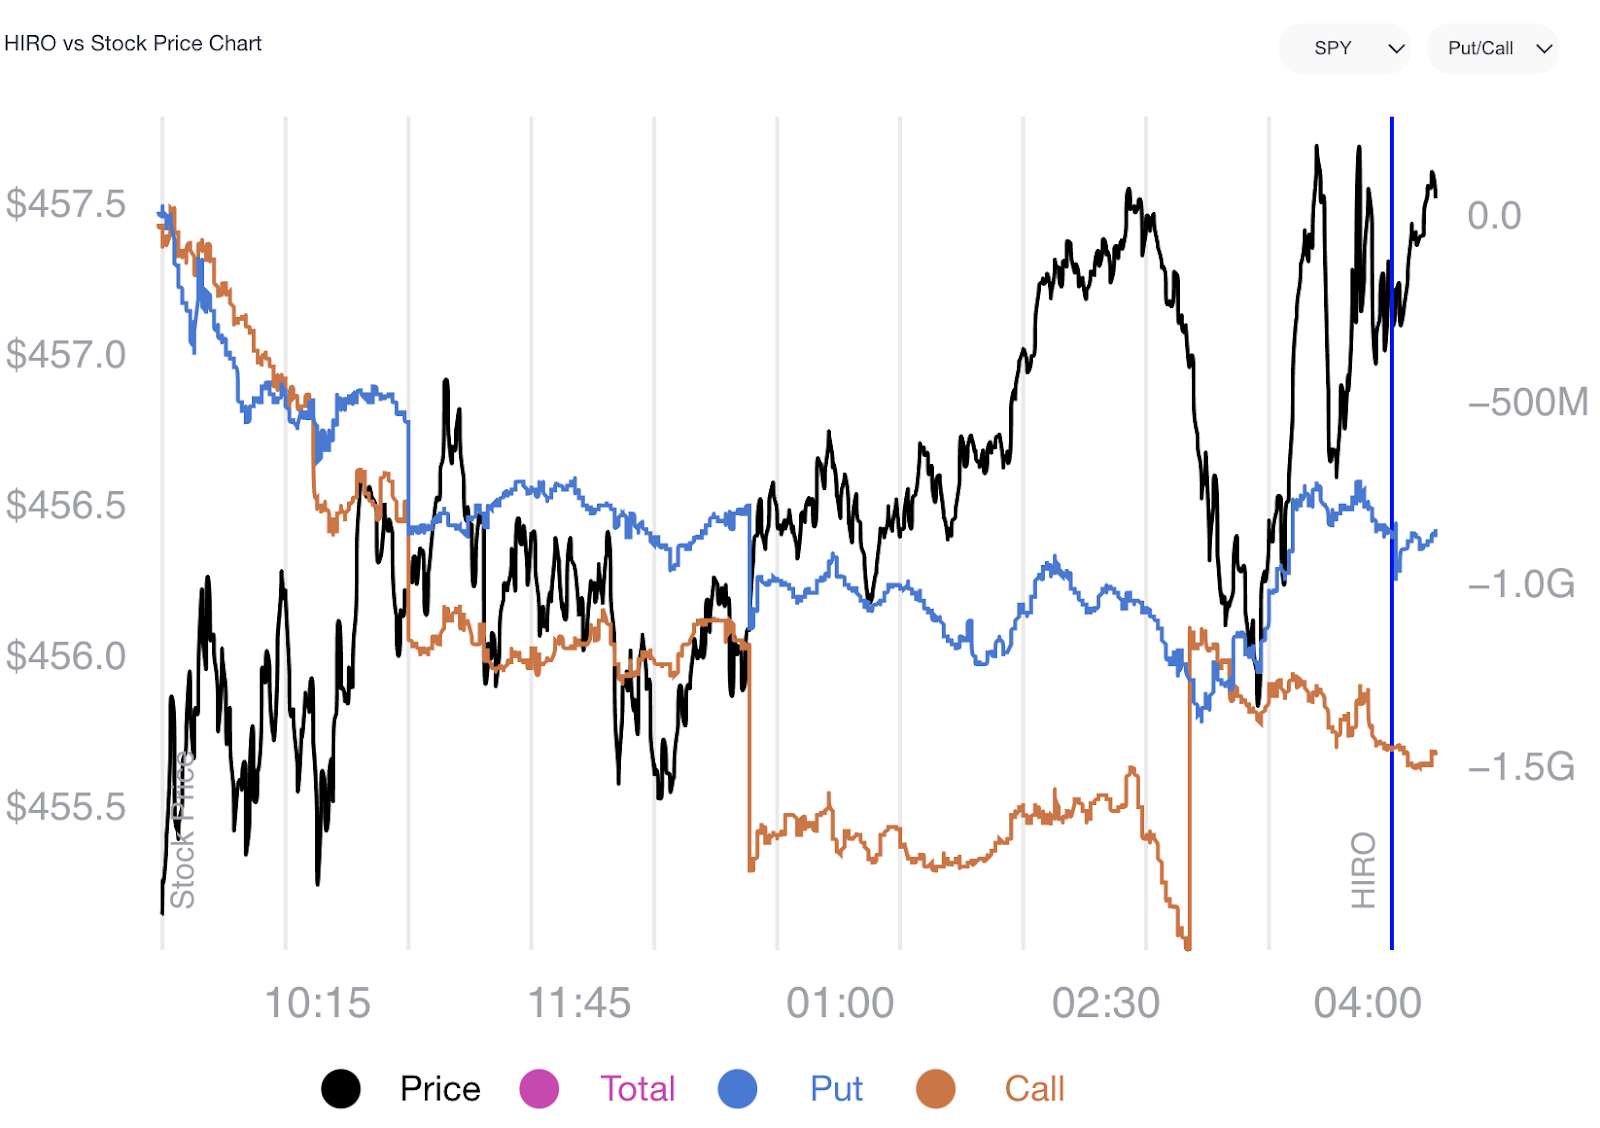
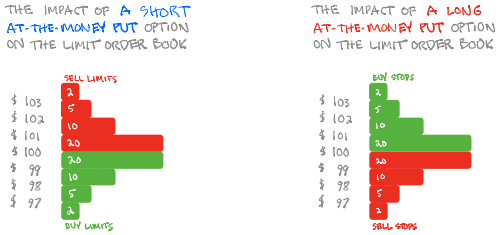
At present, the demand for downside (put) protection leaves counterparties short puts (i.e., a positive-delta, negative-gamma trade in which losses are amplified on increases in volatility or trade lower).
Options expirations work to clear this exposure and therefore are to reduce the amount of negative gamma. In having less negative gamma to hedge, there will be counterparty-based support (i.e., a buy-back of the short stock and futures hedges to the short put exposures).
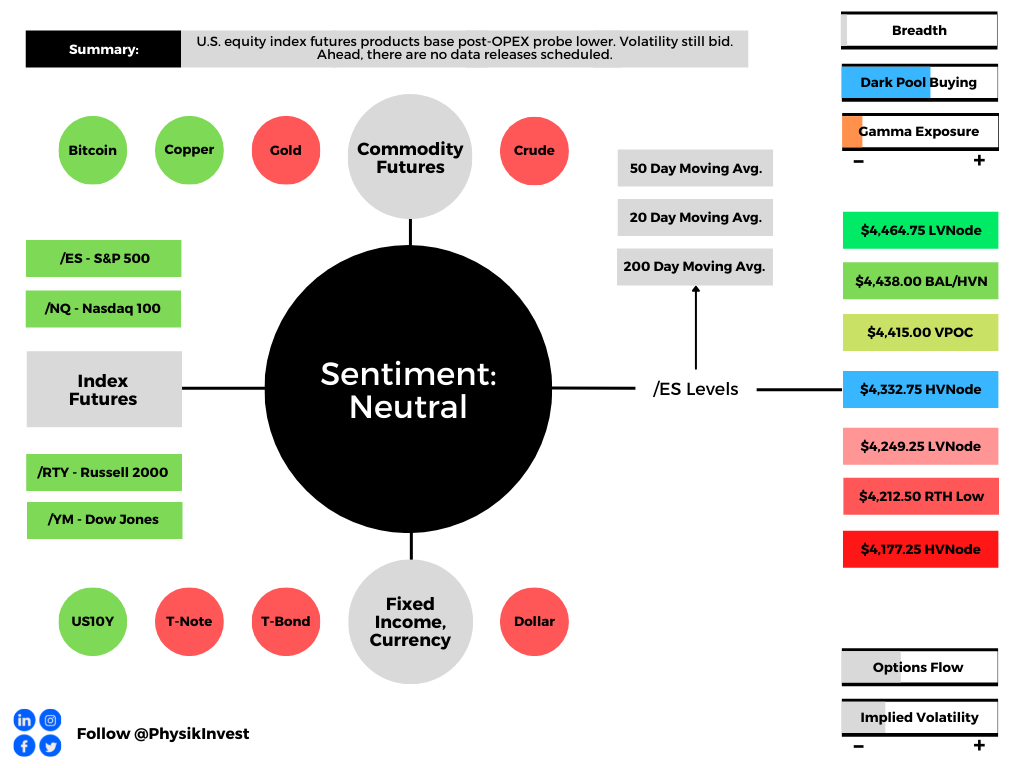
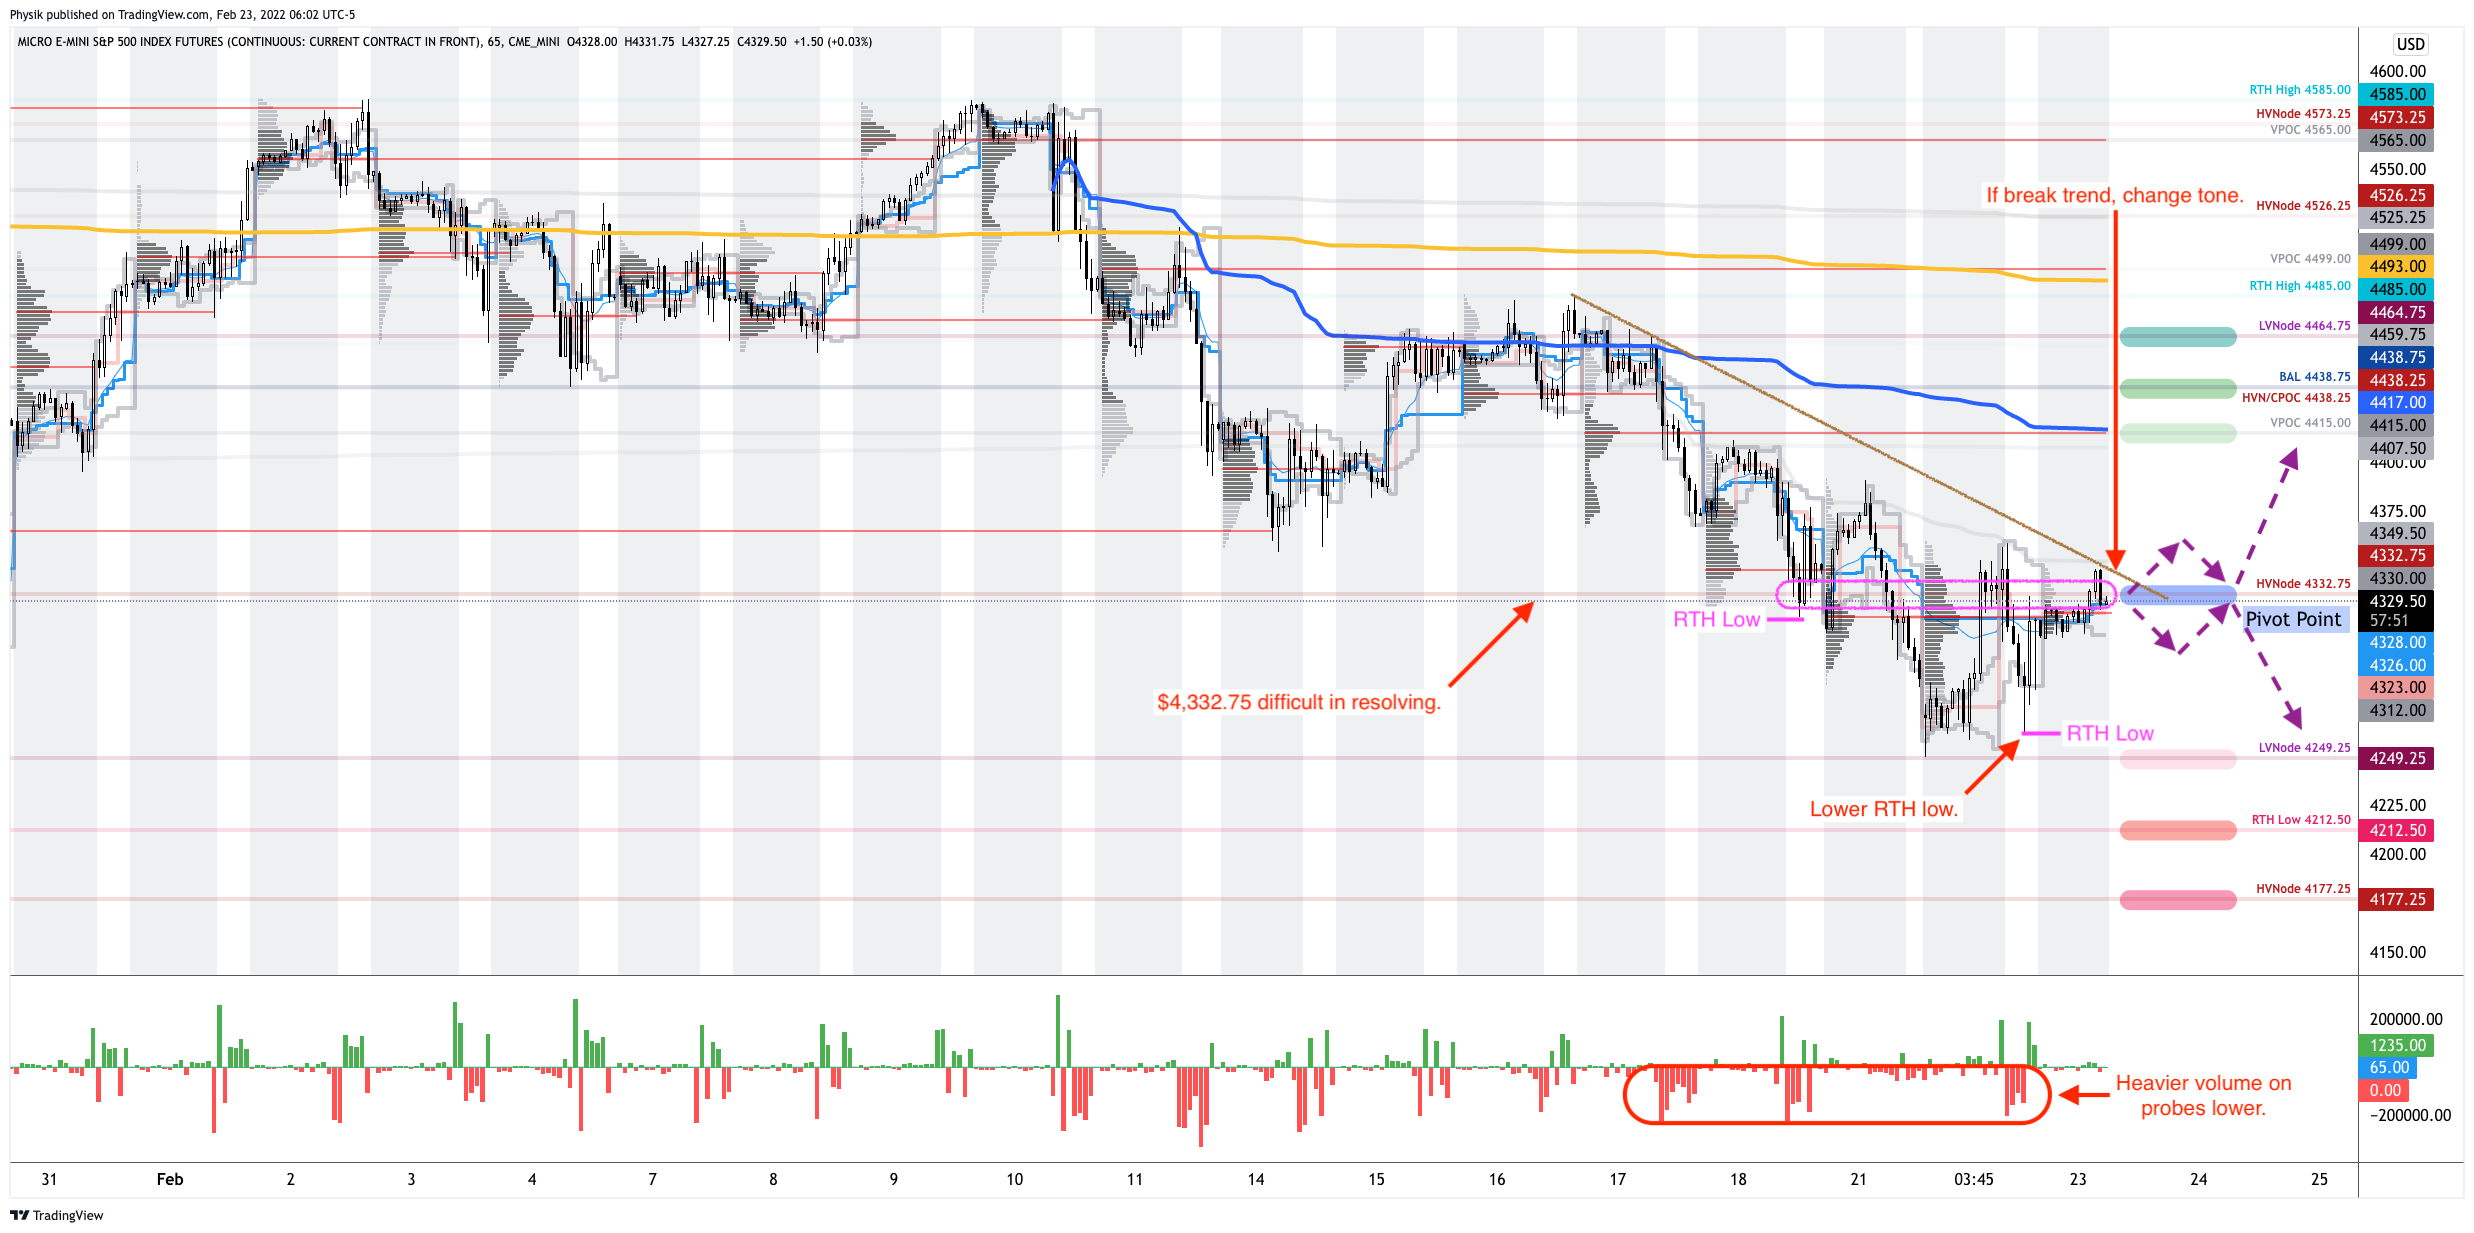
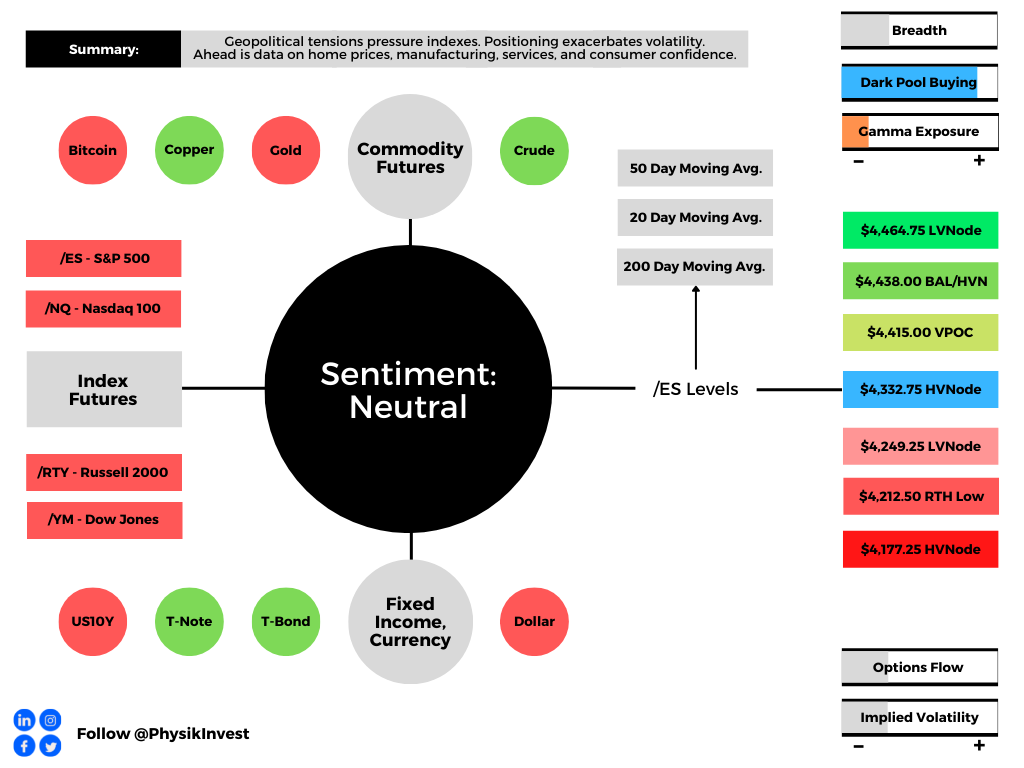
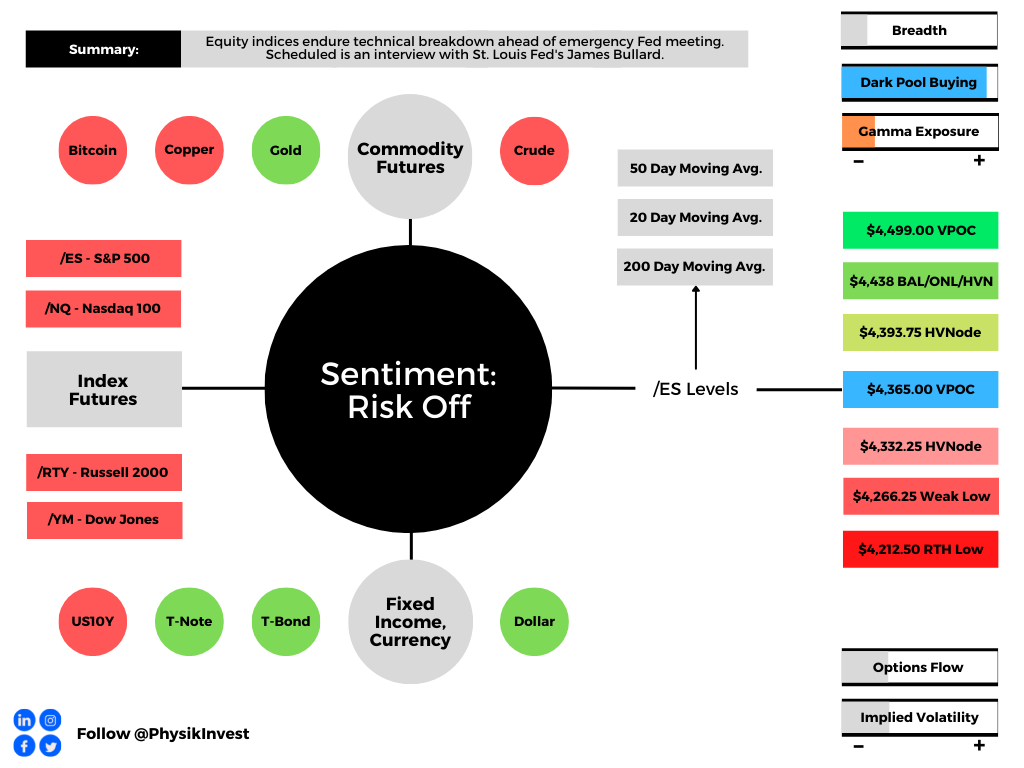
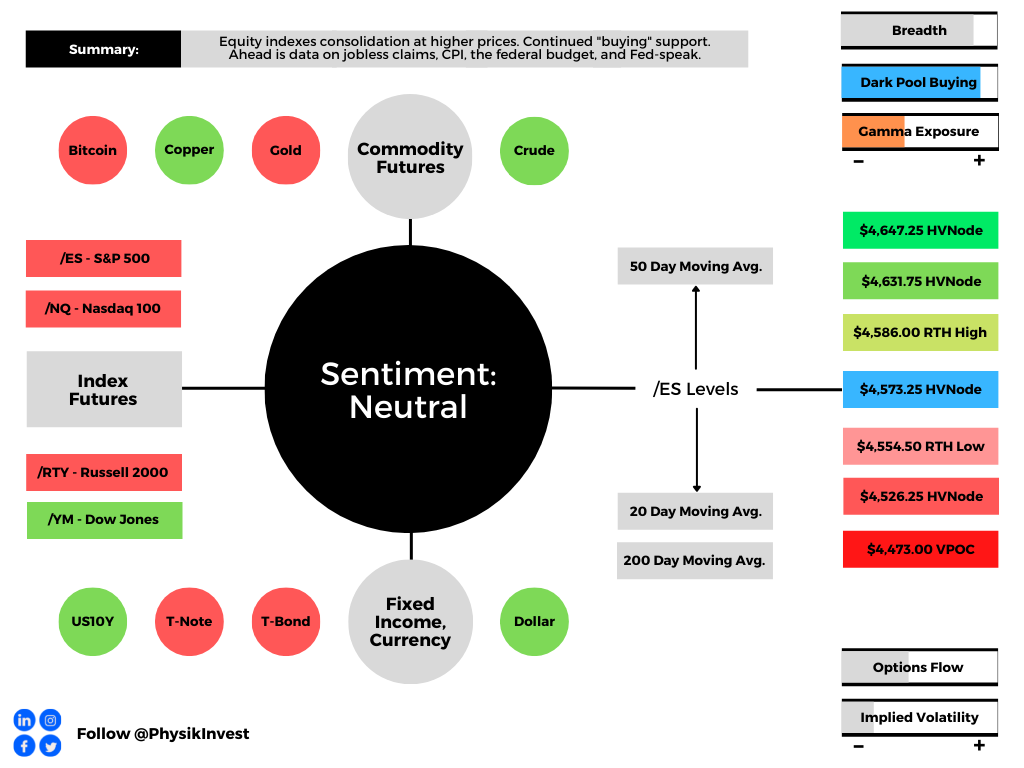
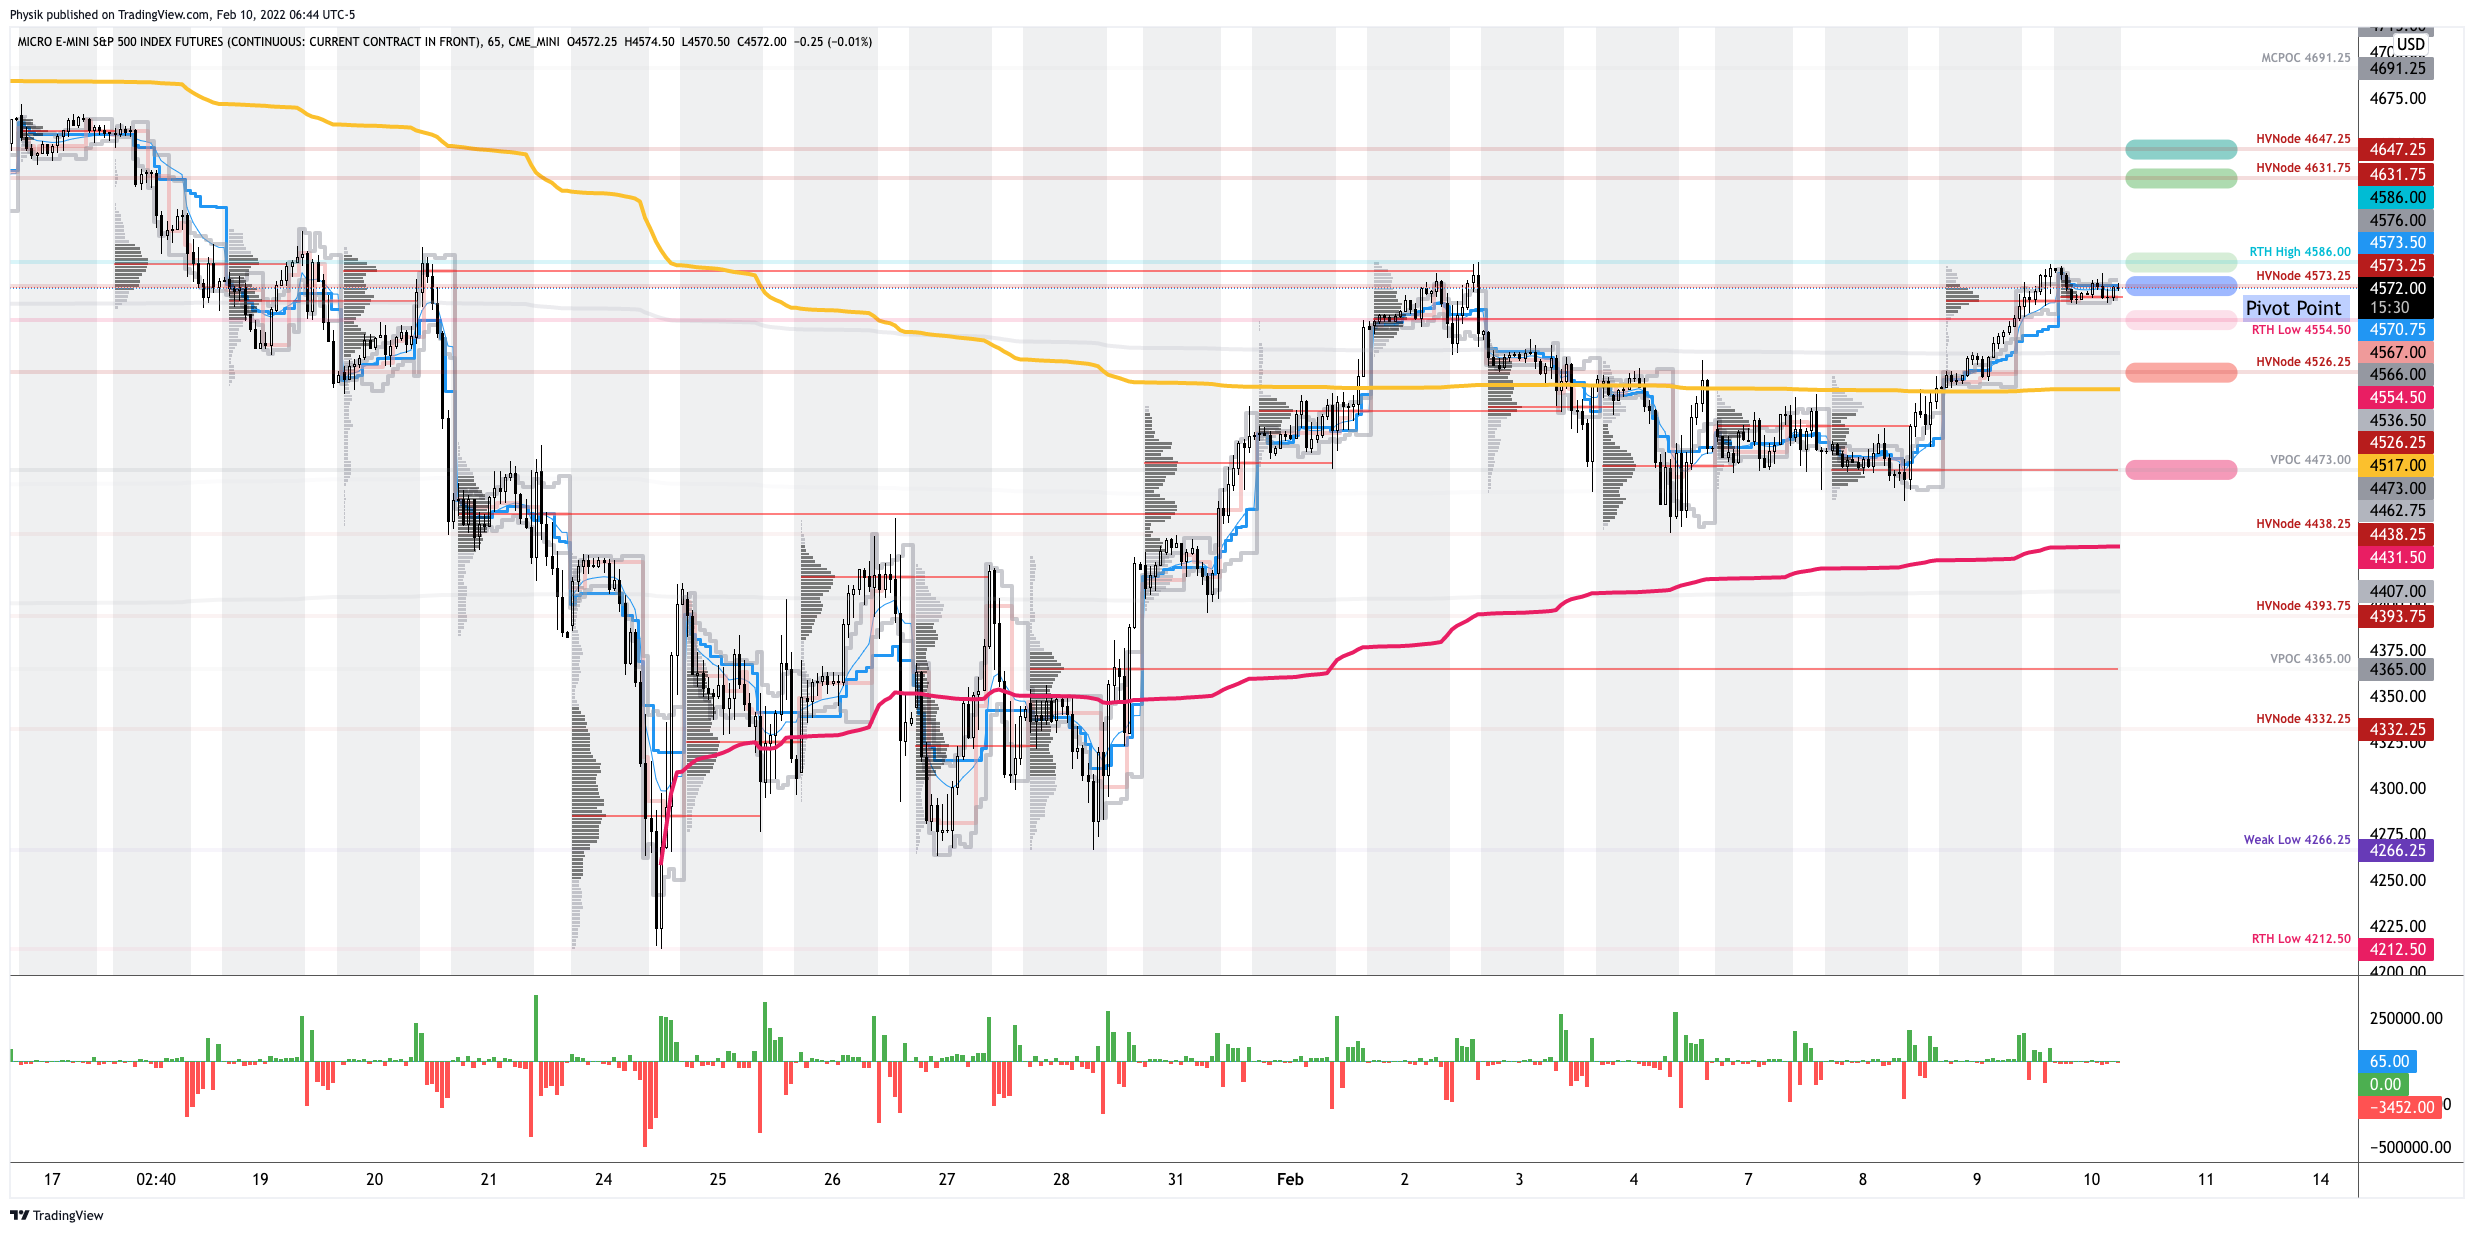
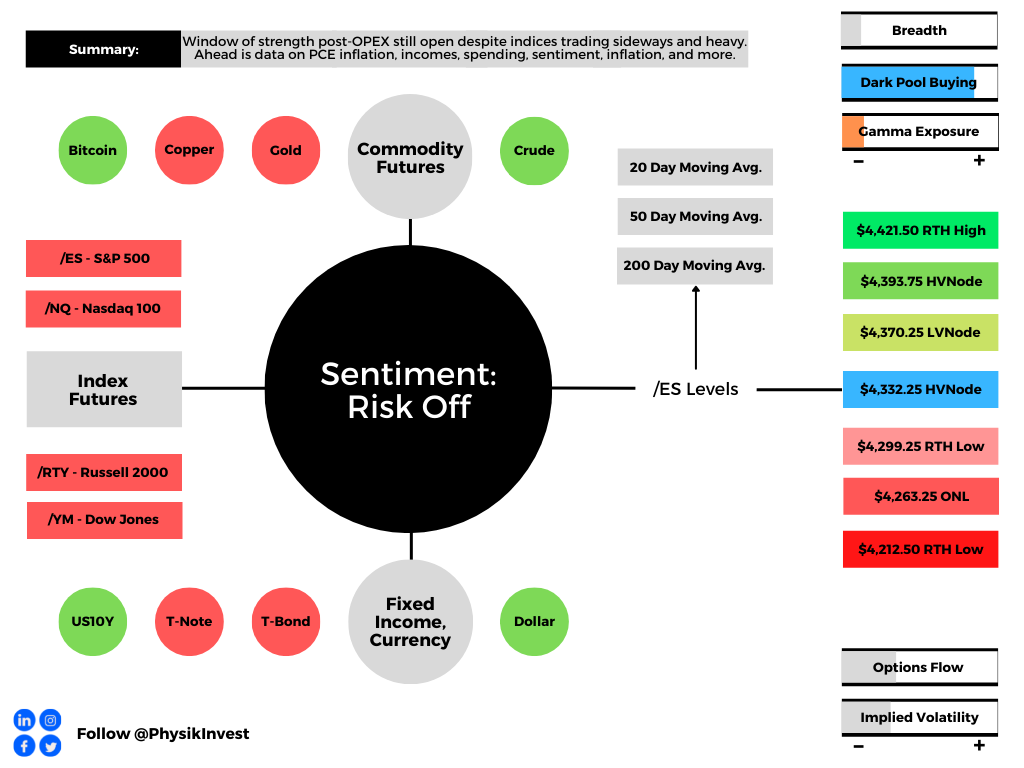
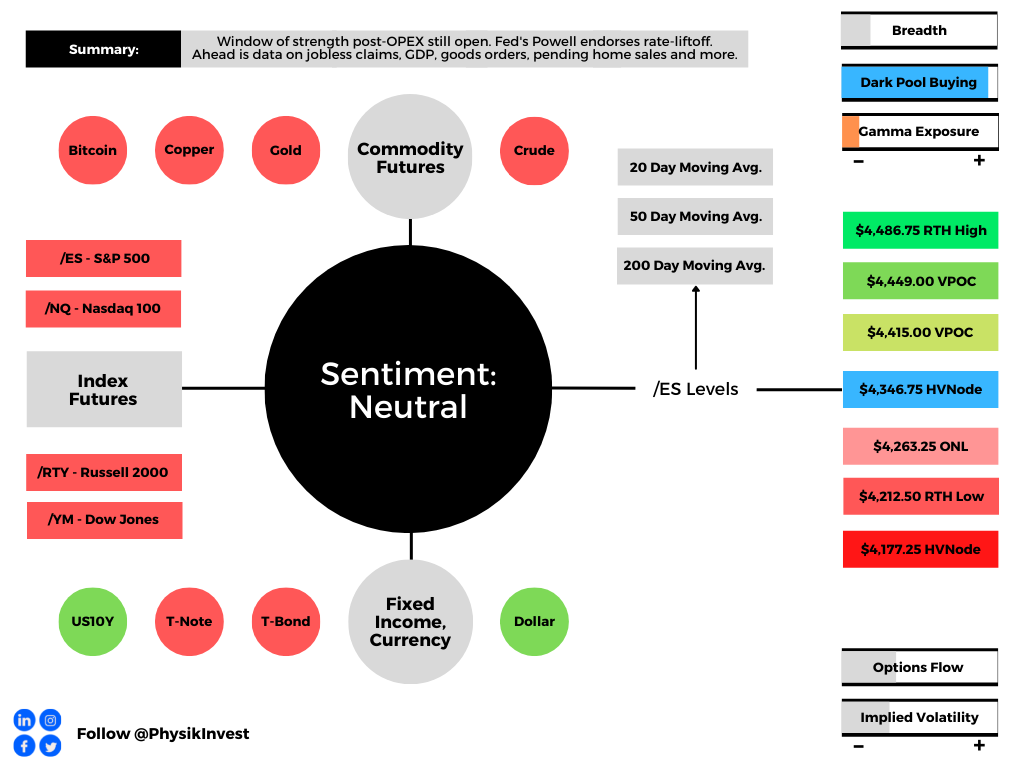
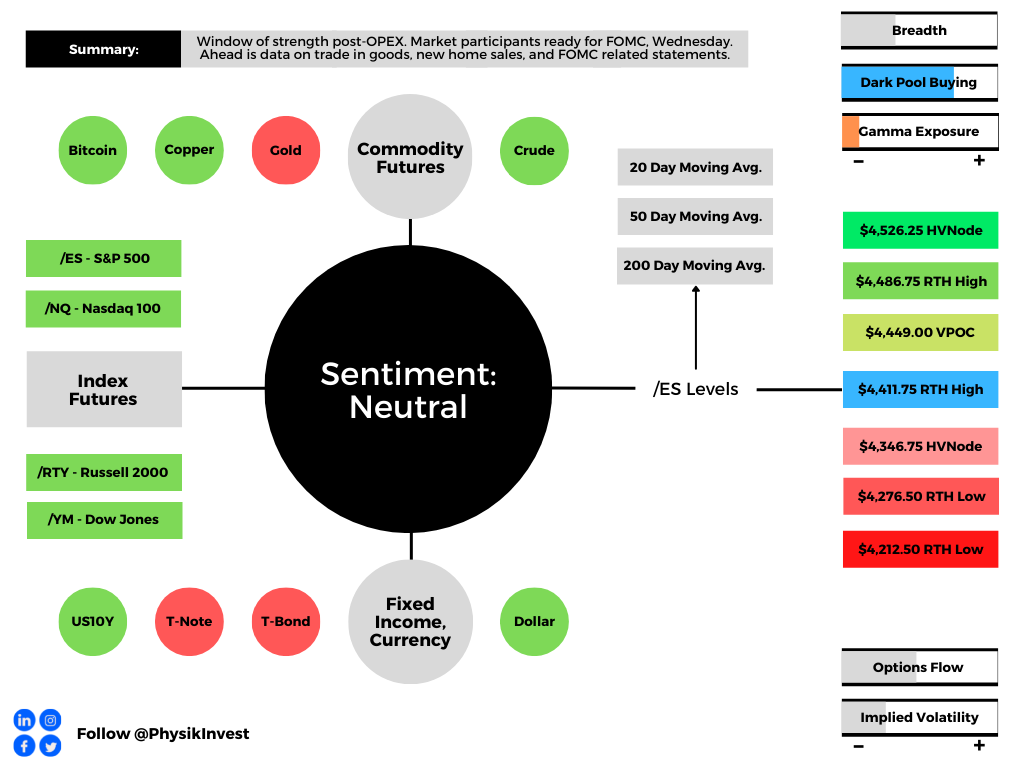
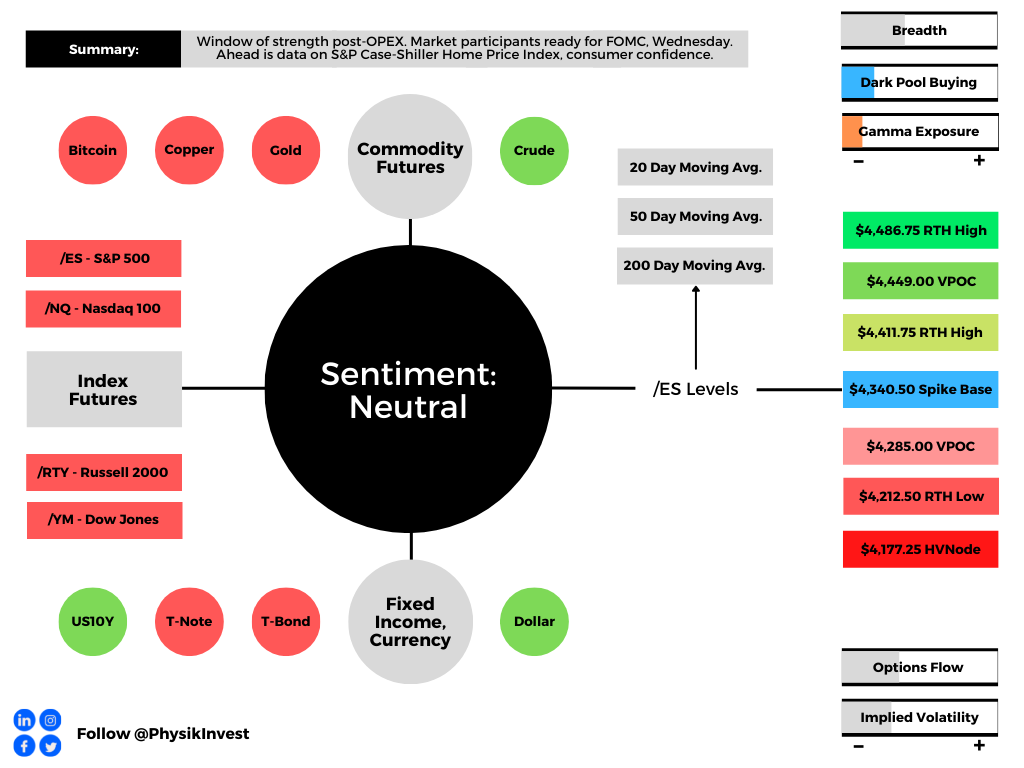
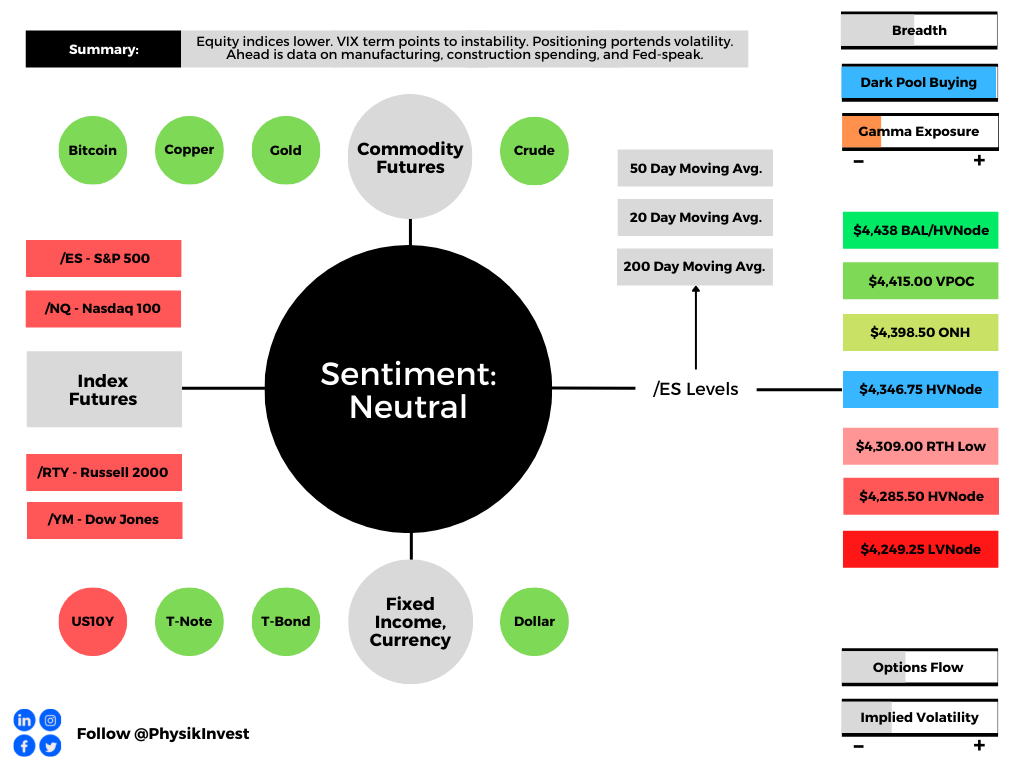
Technical: As of 6:30 AM ET, Tuesday’s regular session (9:30 AM – 4:00 PM ET), in the S&P 500, will likely open in the lower part of a balanced overnight inventory, inside of prior-range and -value, suggesting a limited potential for immediate directional opportunity.
In the best case, the S&P 500 trades higher; activity above the $4,346.75 high volume area (HVNode) puts in play the $4,398.50 overnight high (ONH). Initiative trade beyond the ONH could reach as high as the $4,415.00 untested point of control (VPOC) and $4,438.75 key response area, or higher.
In the worst case, the S&P 500 trades lower; activity below the $4,346.75 HVNode puts in play the $4,309.00 regular trade low (RTH Low). Initiative trade beyond the RTH Low could reach as low as the $4,285.50 HVNode and $4,249.25 low volume area (LVNode), or lower.
Click here to load today’s key levels into the web-based TradingView charting platform. Note that all levels are derived using the 65-minute timeframe. New links are produced, daily.

Definitions
Cave-Fill Process: Widened the area deemed favorable to transact at by an increased share of participants. This is a good development.
Overnight Rally Highs (Lows): Typically, there is a low historical probability associated with overnight rally-highs (lows) ending the upside (downside) discovery process.
Volume Areas: A structurally sound market will build on areas of high volume (HVNodes). Should the market trend for long periods of time, it will lack sound structure, identified as low volume areas (LVNodes). LVNodes denote directional conviction and ought to offer support on any test.
If participants were to auction and find acceptance into areas of prior low volume (LVNodes), then future discovery ought to be volatile and quick as participants look to HVNodes for favorable entry or exit.
Gamma: Gamma is the sensitivity of an option to changes in the underlying price. Dealers that take the other side of options trades hedge their exposure to risk by buying and selling the underlying. When dealers are short-gamma, they hedge by buying into strength and selling into weakness. When dealers are long-gamma, they hedge by selling into strength and buying into weakness. The former exacerbates volatility. The latter calms volatility.
Vanna: The rate at which the delta of an option changes with respect to volatility.
POCs: POCs are valuable as they denote areas where two-sided trade was most prevalent in a prior day session. Participants will respond to future tests of value as they offer favorable entry and exit.
About
After years of self-education, strategy development, mentorship, and trial-and-error, Renato Leonard Capelj began trading full-time and founded Physik Invest to detail his methods, research, and performance in the markets.
Capelj is also a Benzinga finance and technology reporter interviewing the likes of Shark Tank’s Kevin O’Leary, JC2 Ventures’ John Chambers, FTX’s Sam Bankman-Fried, and ARK Invest’s Catherine Wood, as well as a SpotGamma contributor developing insights around impactful options market dynamics.
Disclaimer
Physik Invest does not carry the right to provide advice.
In no way should the materials herein be construed as advice. Derivatives carry a substantial risk of loss. All content is for informational purposes only.