
The daily brief is a free glimpse into the prevailing fundamental and technical drivers of U.S. equity market products. Join the 850+ that read this report daily, below!
Positioning
In our last letter, it was put forth that markets were stretched after a ~20% multi-month advance on macro-type re-leveraging flows (given such things as a strong earnings season) and rotation out of volatility and commodity hedges.
To continue the advance, needed was more macro re-leveraging and demand for positive Delta exposure via equity or options, lower prints of consumer price data, as well as maintenance of a dovish Federal Reserve (Fed) undertone, among other things.
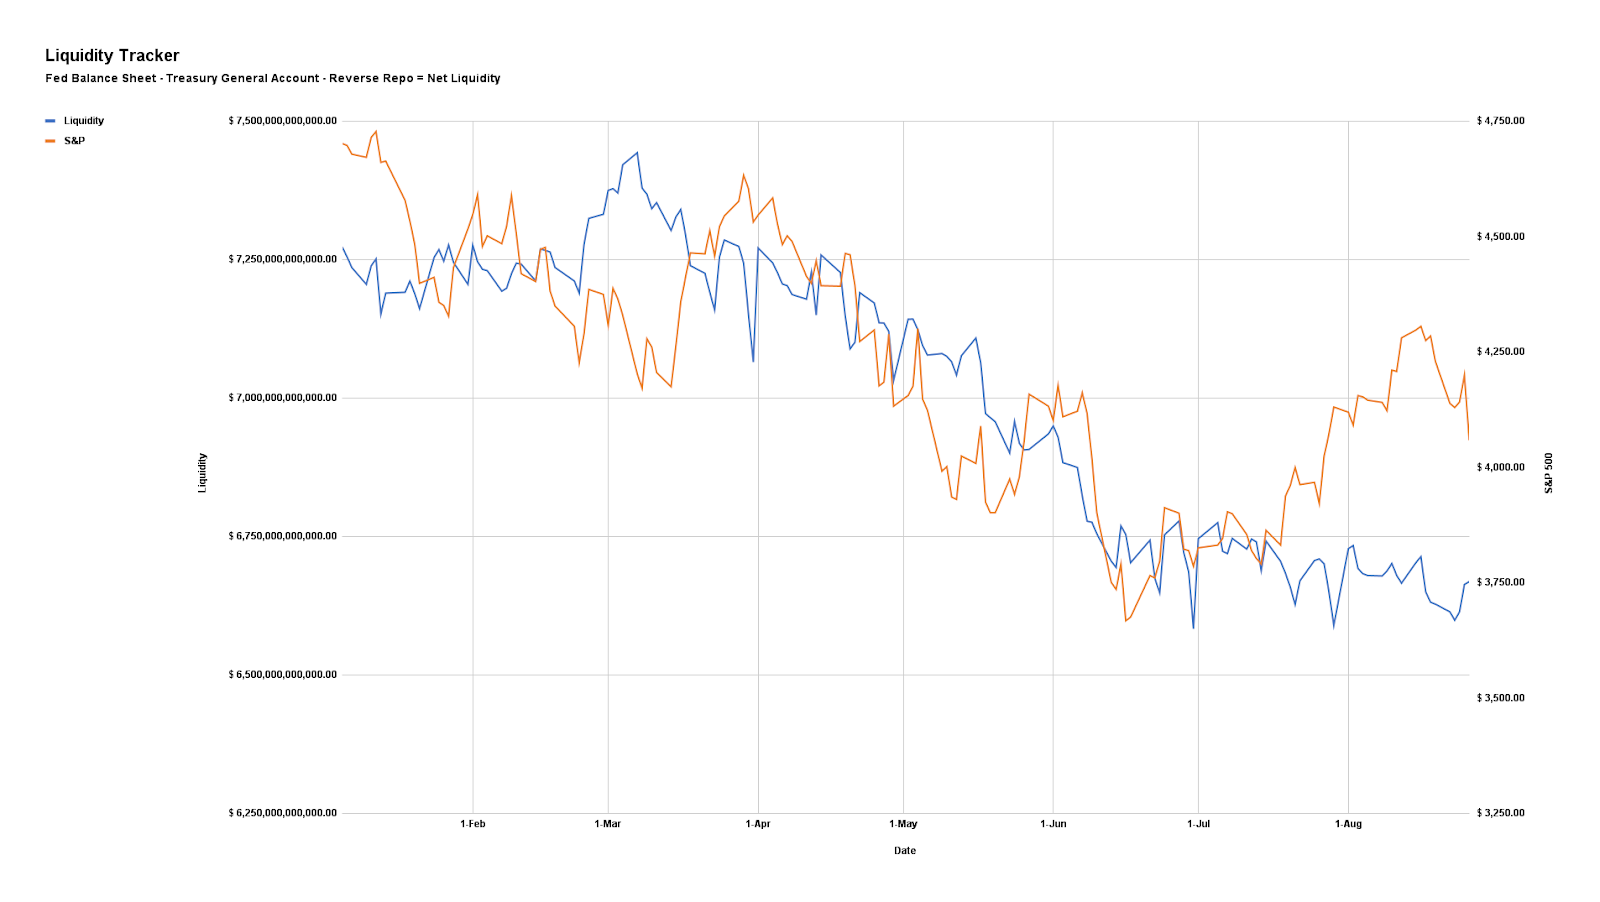
As an aside, participants’ dumping of poor-performing hedges (which we talked about in our last letter) left them “less hedged” and markets far more susceptible to “core macro factors” like “the incremental effects” of liquidity, a negative at present, particularly after OPEX or August monthly options expiration.
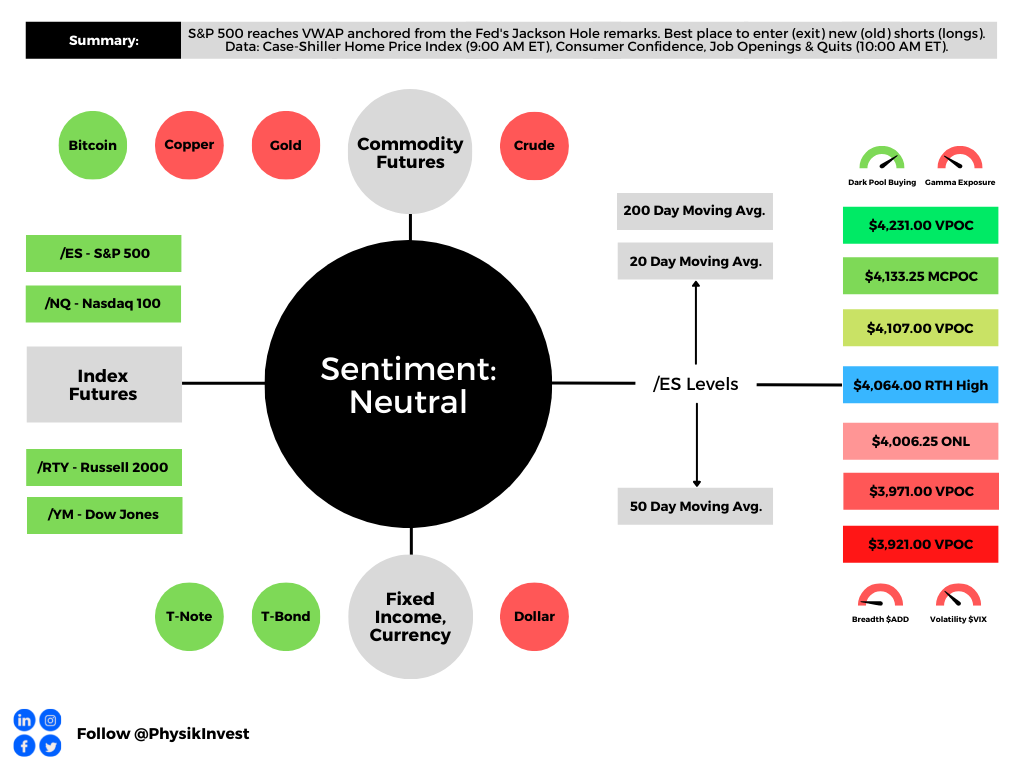
And so, when the Fed’s Jerome Powell gave a message that they would stay tough on the war against inflation, the context was set for much larger trading ranges and increased potential for downside volatility.
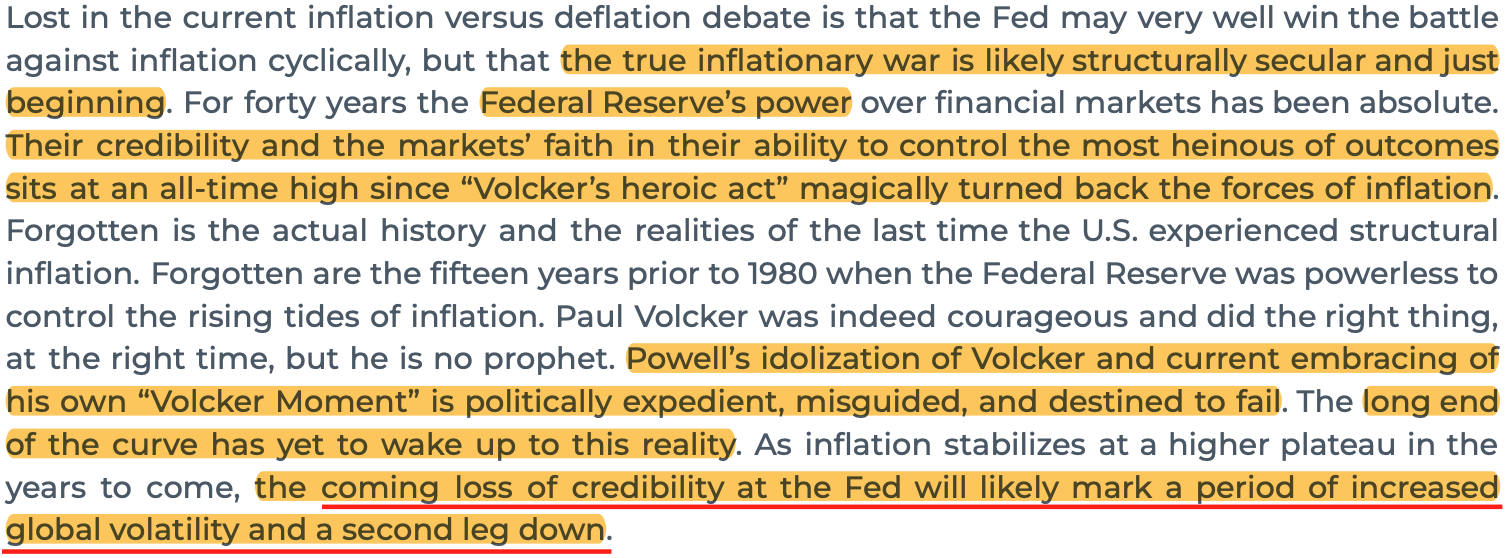
During the subsequent rollover, the shock from Fed comments bolstered demand for protection (i.e., options) and boosted implied volatility, accordingly.
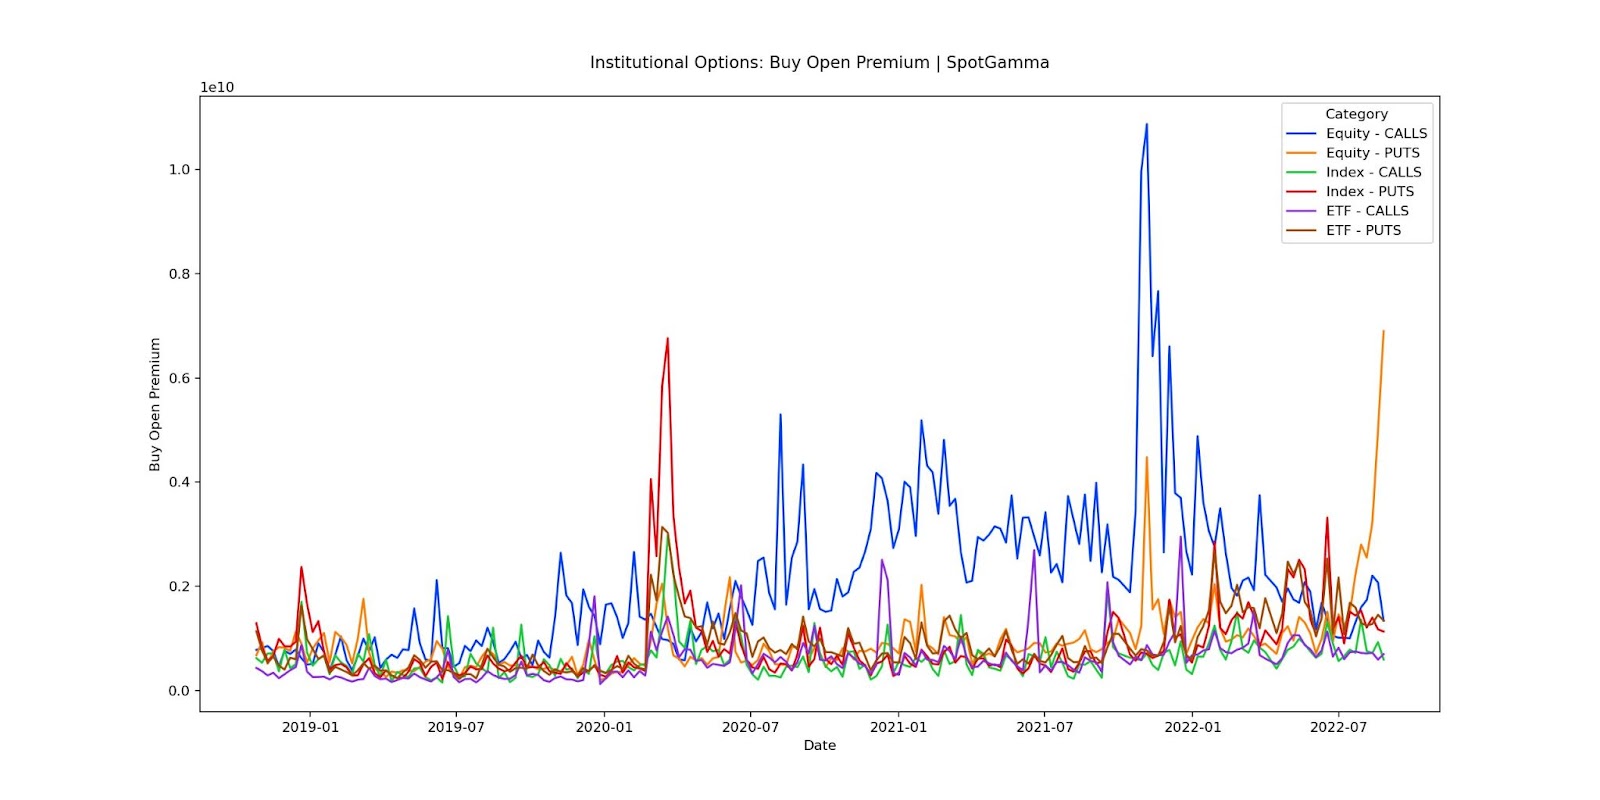
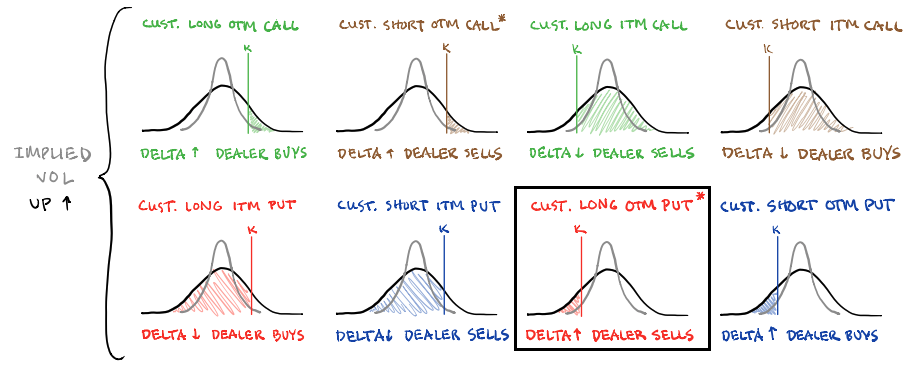
The reason being is that in a falling market, characterized by demand for put options, those who are on the other side of options trades, hedge in a manner that may pressure the market (i.e., the theory is that if customers buy puts, then counterparties sell puts + sell stock to hedge).
In our August 18, 2022 letter, we suggested wide Short Ratio Put Spreads would offer traders cheap but efficient exposure across very short time horizons. That trade panned out and, now, traders should be looking to monetize (i.e., turn to cash) these bets into any further declines.
Technical
As of 8:30 AM ET, Tuesday’s regular session (9:30 AM – 4:00 PM ET), in the S&P 500, is likely to open in the upper part of a positively skewed overnight inventory, just inside of prior-range and -value, suggesting a limited potential for immediate directional opportunity.
In the best case, the S&P 500 trades higher.
Any activity above the $4,064.00 RTH High pivot puts into play the $4,107.00 VPOC. Initiative trade beyond the VPOC could reach as high as the $4,133.25 and $4,231.00 POCs, or higher.
In the worst case, the S&P 500 trades lower.
Any activity below the $4,064.00 RTH High pivot puts into play the $4,006.25 ONL. Initiative trade beyond the ONL could reach as low as the $3,971.00 and $3,921.00 POCs, or lower.
Click here to load today’s key levels into the web-based TradingView charting platform. Note that all levels are derived using the 65-minute timeframe. New links are produced, daily.

Definitions
Overnight Rally Highs (Lows): Typically, there is a low historical probability associated with overnight rally-highs (lows) ending the upside (downside) discovery process.
Volume Areas: A structurally sound market will build on areas of high volume (HVNodes). Should the market trend for long periods of time, it will lack sound structure, identified as low volume areas (LVNodes). LVNodes denote directional conviction and ought to offer support on any test.
If participants were to auction and find acceptance into areas of prior low volume (LVNodes), then future discovery ought to be volatile and quick as participants look to HVNodes for favorable entry or exit.
Gamma: Gamma is the sensitivity of an option to changes in the underlying price. Dealers that take the other side of options trades hedge their exposure to risk by buying and selling the underlying. When dealers are short-gamma, they hedge by buying into strength and selling into weakness. When dealers are long-gamma, they hedge by selling into strength and buying into weakness. The former exacerbates volatility. The latter calms volatility.
POCs: POCs are valuable as they denote areas where two-sided trade was most prevalent in a prior day session. Participants will respond to future tests of value as they offer favorable entry and exit.
MCPOCs: POCs are valuable as they denote areas where two-sided trade was most prevalent over numerous day sessions. Participants will respond to future tests of value as they offer favorable entry and exit.
Volume-Weighted Average Prices (VWAPs): A metric highly regarded by chief investment officers, among other participants, for quality of trade. Additionally, liquidity algorithms are benchmarked and programmed to buy and sell around VWAPs.
About
After years of self-education, strategy development, mentorship, and trial-and-error, Renato Leonard Capelj began trading full-time and founded Physik Invest to detail his methods, research, and performance in the markets.
Capelj also develops insights around impactful options market dynamics at SpotGamma and is a Benzinga reporter.
Some of his works include conversations with ARK Invest’s Catherine Wood, investors Kevin O’Leary and John Chambers, FTX’s Sam Bankman-Fried, ex-Bridgewater Associate Andy Constan, Kai Volatility’s Cem Karsan, The Ambrus Group’s Kris Sidial, among many others.
Disclaimer
In no way should the materials herein be construed as advice. Derivatives carry a substantial risk of loss. All content is for informational purposes only.


One reply on “Daily Brief For August 30, 2022”
[…] September 1 letter [HERE] for depth into some fundamental market contexts, the August 30 letter [HERE] for a recap of big trades we structured, as well as the reasons we had to take them off, which we […]