Categories
Commentary

Daily Brief For June 9, 2022

The daily brief is a free glimpse into the prevailing fundamental and technical drivers of U.S. equity market products. Join the 300+ that read this report daily, below!

What Happened

U.S. markets were weighed by action abroad before recovering late in the overnight session. 

This was ahead of a European Central Bank (ECB) decision that likely results in a tightening of monetary policies in that region of the world. The expectation is that the ECB will end its bond purchases this month. Then, hike rates in July and September. 

At home, in the U.S., the Securities and Exchange Commission (SEC) is looking to change the business model of wholesalers. In consideration is a model in which different firms compete with each other to fill investors’ trades. Some suggest this would increase trading costs.

Elsewhere, one of the largest U.S. export plants of liquified natural gas (LNG) is to shut down due to a facility explosion, raising the risk of shortages in Europe, according to Reuters.

Ahead is data on jobless claims (8:30 AM ET), as well as real household net worth and domestic financial debt (12:00 PM ET).

Graphic updated 6:40 AM ET. Sentiment Neutral if expected /ES open is inside of the prior day’s range. /ES levels are derived from the profile graphic at the bottom of the following section. Levels may have changed since initially quoted; click here for the latest levels. SqueezeMetrics Dark Pool Index (DIX) and Gamma (GEX) calculations are based on where the prior day’s reading falls with respect to the MAX and MIN of all occurrences available. A higher DIX is bullish. At the same time, the lower the GEX, the more (expected) volatility. Learn the implications of volatility, direction, and moneyness. SHIFT data used for S&P 500 (INDEX: SPX) options activity. Note that options flow is sorted by the call premium spent; if more positive, then more was spent on call options. Breadth reflects a reading of the prior day’s NYSE Advance/Decline indicator. VIX reflects a current reading of the CBOE Volatility Index (INDEX: VIX) from 0-100.

What To Expect

In the past week, a narrative on bearish bets in funds such as the iShares iBoxx $ High Yield Corporate Bond ETF (NYSE: HYG) surfaced.

The ETF saw some of the largest volumes since March of 2020, presumably as traders looked to hedge for low cost, the Federal Reserve’s (FED) hawkishness. 

Graphic: Via Bloomberg. “Given that HYG’s realized volatility is still relatively low, it’s an inexpensive way to hedge the impact of tightening monetary policy on corporate credit.”

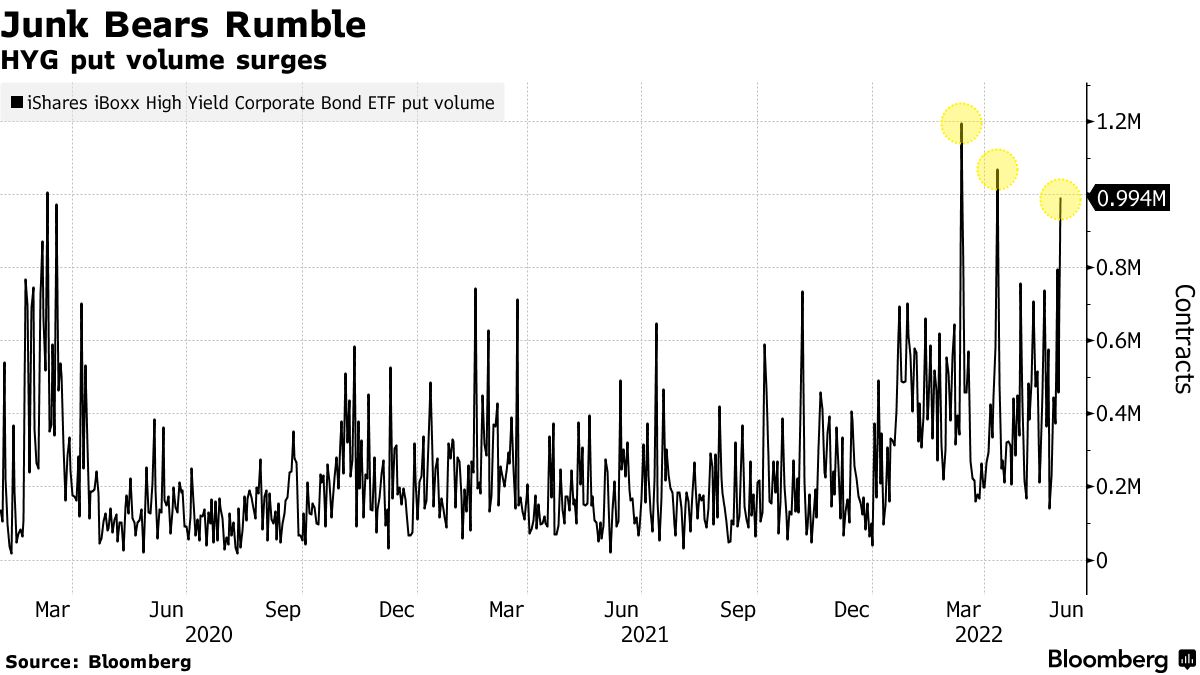
According to The Ambrus Group’s Kris Sidial, “a lot of banks continue to push credit vol[atility] as a cheap hedge. Every month, at least four banks push the theme on that trade because of ‘value.’”

This is “also, another reason why every month you see HYG put spreads hit the tape with big size, relatively speaking,” he adds.

Adding, Bridgewater Associates, which was founded by Ray Dalio in 1975, is betting on the sale of corporate bonds via credit default swaps (CDS), which are used to transfer and hedge credit exposure on fixed income products.

Bridgewater’s Co-Chief Investment Officer Greg Jensen explained their bet against corporate bonds is based on inflation remaining stubborn, resulting in the Fed to “tighten in a very strong way, which would then crack the economy and probably crack the weaker [companies].”

Here’s why that matters. 

The firms facing challenges, “are creations of easy credit,” according to Bloomberg and, now, for some of them, their time is running short as they “aren’t earning enough to cover their interest expenses, let alone turn a profit.” 

“When interest rates are at or close to zero, it’s very easy to get credit, and under those circumstances, the difference between a good company and a bad company is narrow,” said Komal Sri-Kumar of Sri-Kumar Global Strategies. 

“It’s only when the tide runs out that you figure out who is swimming naked.”

Graphic: Via Bloomberg.

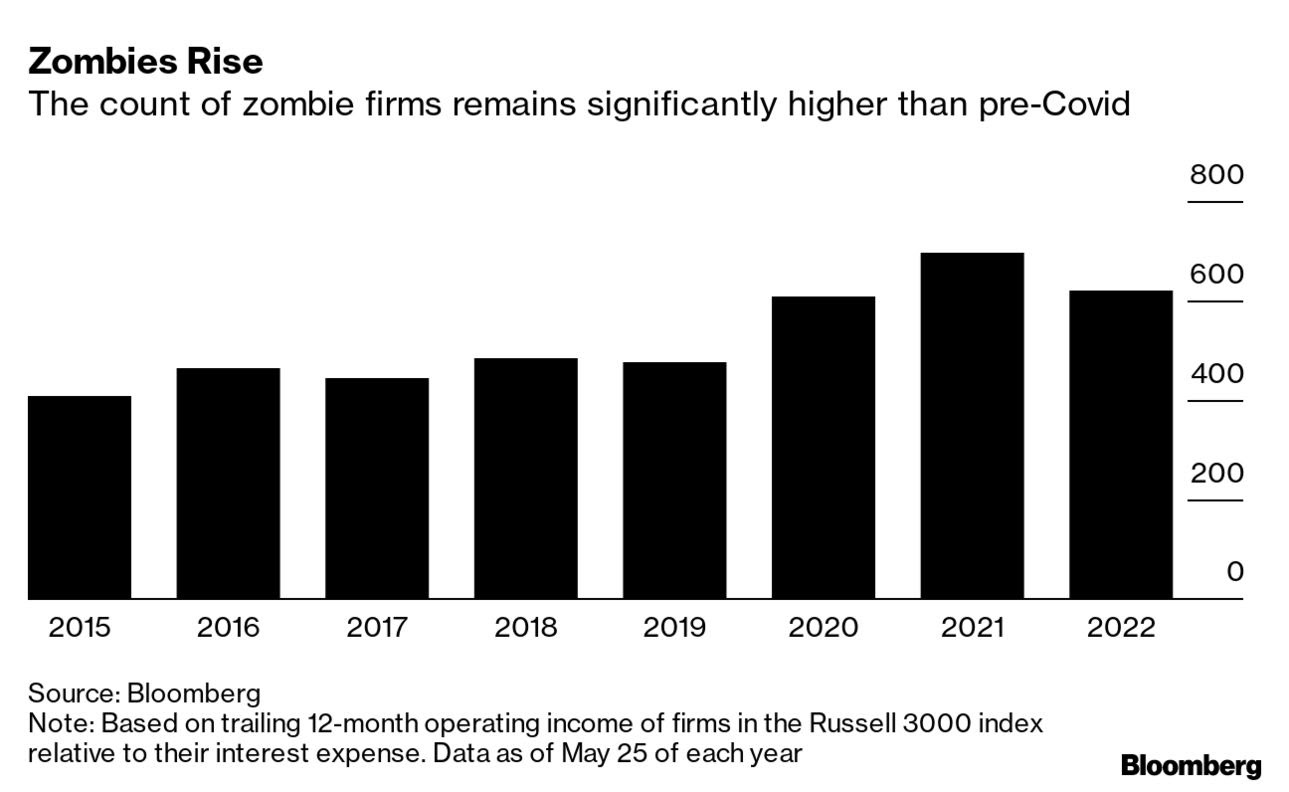
Despite many of these companies having debt that could last them “months, even years,” Vincent Reinhart explains that “[a]s rates rise, it pushes more of those firms into distress, and amplifies the tightening by the Fed of financial conditions and credit availability.”

As stated yesterday, financial conditions are “the mechanism through which the Fed [impacts] the economy,” and “if the data doesn’t slow, financial conditions will need to tighten more,” potentially feeding into a freezing of credit and a harder hit on still-frothy areas of the market “with the greatest systemic risk.”

As we quoted Simplify Asset Management’s Mike Green explaining in early May, we’re more than halfway through a dot-com type collapse that’s happened “underneath the surface of the indices.” 

That’s noteworthy since still-strong passive flows continue to support the largest stocks within the index.

That said, with bonds “not acting as a hedge and appear to be becoming less ‘money’ like due persistent declines in price and elevated rate vol,” per Joseph Wang, who was a trader at the Fed, “[i]nvestors in both bonds and stocks are reaching for cash by selling their assets, driving further asset price declines. For non-bank investors, ‘cash’ means bank deposits.”

How to think about trades?

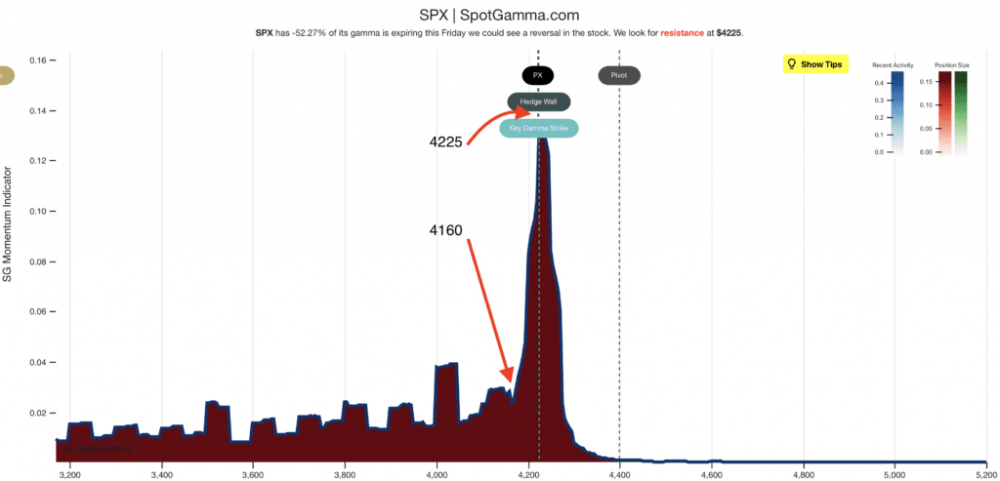
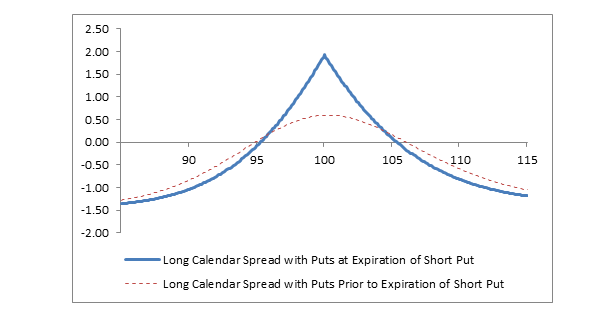
As explained, yesterday, the marginal impact of further volatility compression is likely to do less to bolster equity market upside. Heading into the Federal Open Market Committee (FOMC) event, next week, according to SpotGamma, short-dated, pre-event volatility is likely to get sold (further promoting market consolidation) while that which is farter-dated is likely to be bought.

To capitalize on a resolution of the index-level pinning, participants, too, could sell short-dated volatility (which capitalizes on pinning and the rapid decay of soon-to-expire options) and use those proceeds to fund farther dated options. 

Such a structure would assist in lower the cost of directional exposure.

Graphic: The risk profile of a long put calendar spread, via Fidelity.

Alternatively, if bearish on volatility, one could buy a butterfly (short two times at the money and long above and below out of the money options). 

Graphic: The risk profile of a long call butterfly spread, via Fidelity.

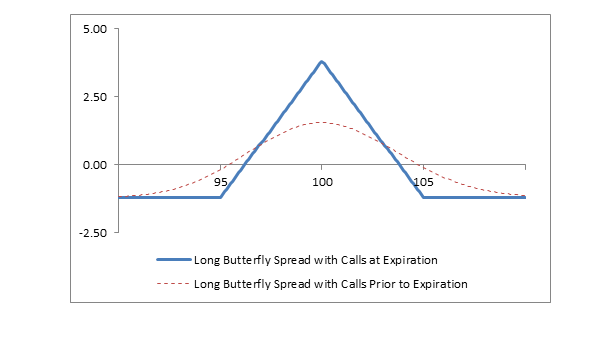
In such a case, the trader becomes long implied skew convexity. This is a play on the comments above, coupled with the fact that the Cboe VVIX Index (INDEX: VVIX), the expected volatility of the 30-day forward price of the VIX, or the volatility of volatility (a naive but useful measure of skew), dropped off largely, too, in comparison to the VIX, itself.

Graphic: Text taken from Exotic Options and Hybrids: A Guide to Structuring, Pricing and Trading.

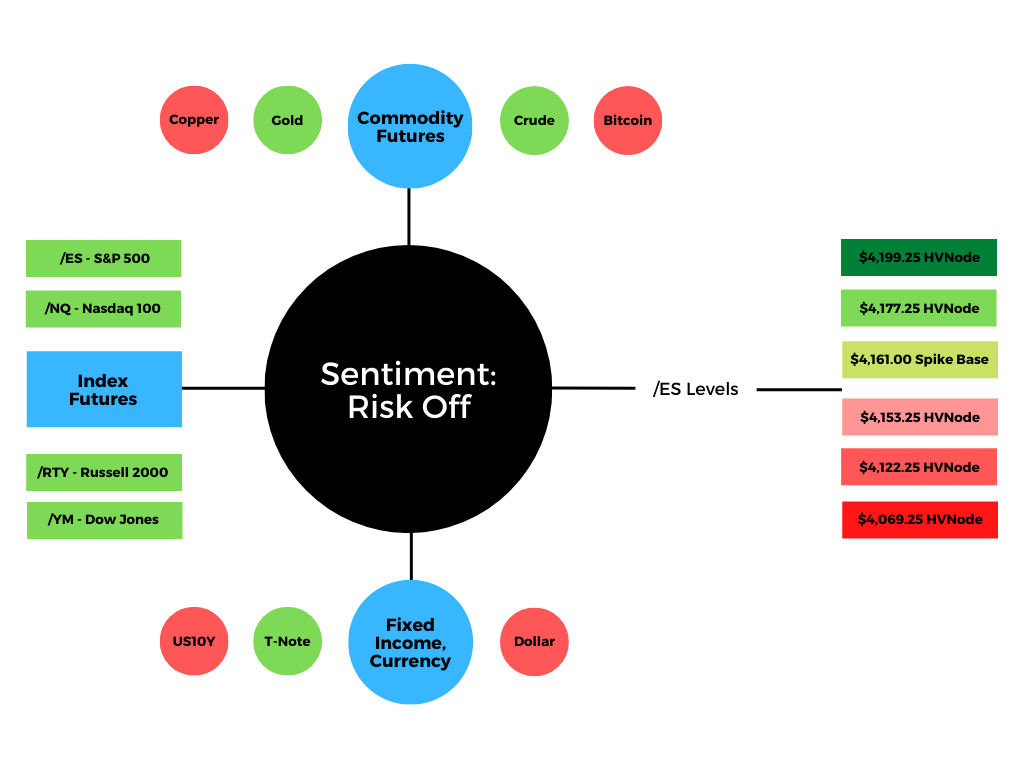
Technical: As of 6:40 AM ET, Thursday’s regular session (9:30 AM – 4:00 PM ET), in the S&P 500, will likely open in the upper part of a balanced overnight inventory, inside of prior-range and -value, suggesting a limited potential for immediate directional opportunity.

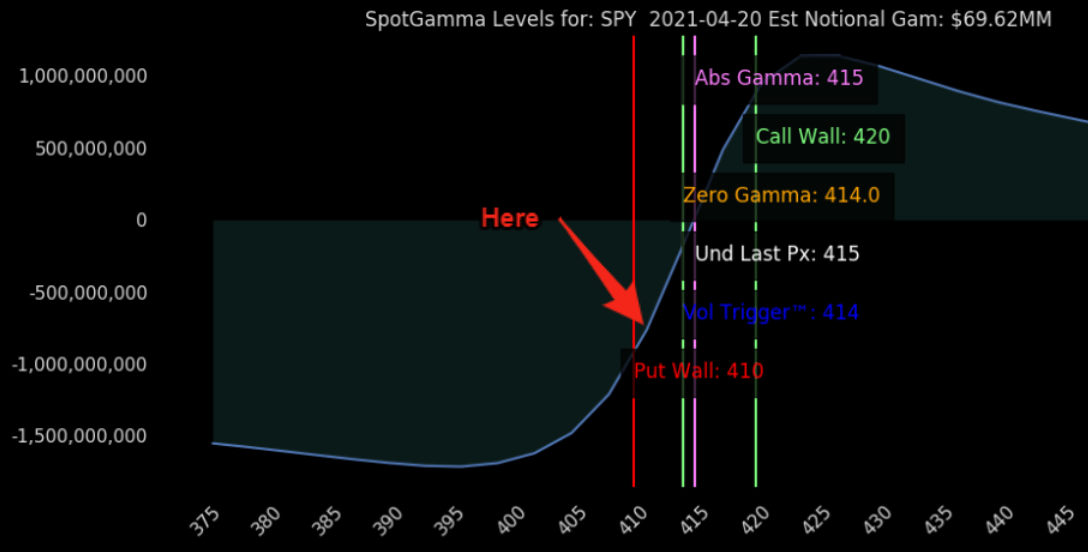
In the best case, the S&P 500 trades higher; activity above the $4,129.25 low volume area (LVNode) puts in play the $4,149.00 untested point of control (VPOC). Initiative trade beyond the VPOC could reach as high as the $4,164.25 regular trade high (RTH High) and $4,189.25 LVNode, or higher.

In the worst case, the S&P 500 trades lower; activity below the $4,129.25 LVNode puts in play the $4,101.25 LVNode. Initiative trade beyond the LVNodes could reach as low as the $4,073.25 weak high/low and $4,055.75 LVNode, or lower.

Click here to load today’s key levels into the web-based TradingView charting platform. Note that all levels are derived using the 65-minute timeframe. New links are produced, daily.
Graphic: 65-minute profile chart of the Micro E-mini S&P 500 Futures.

Definitions

Volume Areas: A structurally sound market will build on areas of high volume (HVNodes). Should the market trend for long periods of time, it will lack sound structure, identified as low volume areas (LVNodes). LVNodes denote directional conviction and ought to offer support on any test. 

If participants were to auction and find acceptance into areas of prior low volume (LVNodes), then future discovery ought to be volatile and quick as participants look to HVNodes for favorable entry or exit.

POCs: POCs are valuable as they denote areas where two-sided trade was most prevalent in a prior day session. Participants will respond to future tests of value as they offer favorable entry and exit.

About

After years of self-education, strategy development, mentorship, and trial-and-error, Renato Leonard Capelj began trading full-time and founded Physik Invest to detail his methods, research, and performance in the markets.

Capelj also develops insights around impactful options market dynamics at SpotGamma and is a Benzinga reporter.

Some of his works include conversations with ARK Invest’s Catherine Wood, investors Kevin O’Leary and John Chambers, FTX’s Sam Bankman-Fried, Kai Volatility’s Cem Karsan, The Ambrus Group’s Kris Sidial, among many others.

Disclaimer

In no way should the materials herein be construed as advice. Derivatives carry a substantial risk of loss. All content is for informational purposes only.

Categories
Commentary

Daily Brief For March 11, 2022

Editor’s Note: The Daily Brief is a free glimpse into the prevailing fundamental and technical drivers of U.S. equity market products. Join the 200+ that read this report daily, below!

What Happened

On reports that there was progress in talks between Russia and Ukraine, stock index futures advanced putting the S&P 500 back inside a large consolidation area.

Thus far, trade has been volatile and responsive to key visual levels suggesting that the larger other time frame (non-technical) participants are waiting for more information to initiate trades.

Ahead is data on the University of Michigan Sentiment (10:00 AM ET) and inflation expectations (10:00 AM ET).

Graphic updated 6:45 AM ET. Sentiment Risk-On if expected /ES open is above the prior day’s range. /ES levels are derived from the profile graphic at the bottom of the following section. Levels may have changed since initially quoted; click here for the latest levels. SqueezeMetrics Dark Pool Index (DIX) and Gamma (GEX) calculations are based on where the prior day’s reading falls with respect to the MAX and MIN of all occurrences available. A higher DIX is bullish. At the same time, the lower the GEX, the more (expected) volatility. Learn the implications of volatility, direction, and moneyness. SHIFT data used for S&P 500 (INDEX: SPX) options activity. Note that options flow is sorted by the call premium spent; if more positive, then more was spent on call options. Breadth reflects a reading of the prior day’s NYSE Advance/Decline indicator. VIX reflects a current reading of the CBOE Volatility Index (INDEX: VIX) from 0-100.

What To Expect

Fundamental: Yesterday’s letter covered a lot of ground. Check it out if you haven’t already.

Volatility is heightened and the narratives we may attribute that to are concerned with the intent to tighten monetary policy, slower economic growth, and geopolitics.

Graphic: Via Goldman Sachs Group Inc (NYSE: GS). Taken from The Market Ear. “We are downgrading our US GDP forecast to reflect higher oil prices and other drags on growth related to the war in Ukraine.”

In comparison, though, U.S. equity product volatility is less than that in Europe and this points to the “risk premium for investing in Europe’s markets that are teeming with cyclical stocks acutely vulnerable to growth and inflation risks,” among other things.

Adding to the turbulence was the European Central Bank’s pivot toward hawkishness; the institution will accelerate the wind-down of its monetary stimulus. Pursuant to this decision, Euro-area equity funds had their largest weekly outflows on record.

Graphic: Via Bloomberg. 

U.S. policymakers are expected to ramp their tightening efforts, next week, also, as inflation expectations are surging.

Graphic: Via Bloomberg. “[T]he central bank is widely expected to announce a 25-basis point increase Wednesday, along with fresh projections for the economy and path of interest rates.”

Per CME Group Inc’s (NASDAQ: CME) FedWatch Tool, participants are pricing a near 100% chance of a hike in the target rate.

Graphic: Via CME Group Inc (NASDAQ: CME). Participants price in an increased probability of a shift in the target rate. Click here to access the FedWatch Tool.

In the face of all the bearish narratives, however, many products – at the single-stock level – have been de-rating now for nearly a year. 

Ahead of bullish seasonality and rebalancing flow (from fixed income into equities), JPMorgan Chase & Co (NYSE: JPM) strategists suggest that “we could be through [the] worst of it.” 

“When either All Strats or Equity L/S net leverage fell by at least 1.5z or more, the SPX generally rallied over the next 1wk and 4wks,” a bulletin published by The Market Ear read. 

Positioning: Based on a comparison of present options positioning and buying metrics, the returns distribution is skewed positive, albeit less so than before. 

Graphic: Via Physik Invest. Data via SqueezeMetrics.

Adding, over the past weeks, we talked about the SPX and VIX down dynamic. This in part has to do with the supply and demand of protection, at the index level. Hyperlinked are our past conversations.

Graphic: Via Bloomberg. S&P 500 (INDEX: SPX) down, CBOE Volatility Index (INDEX: VIX) down.

“We’re back to another point of people being well hedged and well-positioned,” Amy Wu Silverman of Royal Bank of Canada’s (NYSE: RY) capital markets group, said. 

“You’re also seeing people selling that volatility and doing some overwriting. That can probably dampen volatility.”

Graphic: SpotGamma’s Hedging Impact of Real-Time Options (HIRO) indicator for the SPDR S&P 500 ETF Trust (NYSE: SPY). Into the S&P 500’s March 8, 2022 decline, participants sold volatility on both sides of the options chain.

“When implied volatility is high, that same 1% move lower is much more ‘expected’ so there generally won’t be the same upward pressure on volatility and in fact it might decline,” said Christopher Jacobson, a strategist at Susquehanna Financial Group LLP.

“Along the same lines, investors at that point have had more opportunity and time to hedge, so those same market moves may not lead to as much hedging activity.”

Graphic: Via SpotGamma. “Netting call & put delta, you can see we’re near extremes in terms of put:call positions. Often large put positions are removed by expirations, which seems to coincide with market lows. Many of these are quarterly expirations which coincide w/FOMC meetings – such as next week.”

Taking this together, in accordance with metrics referred to earlier, “we could be closer to the end than the beginning of the discretionary de-risking,” as JPMorgan analysts best explain.

Further, the compression of volatility (via passage of FOMC) or removal of counterparty negative exposure (via OPEX) may serve to alleviate some of this pressure

Until then, participants can expect the options landscape to add to market volatility.

Technical: As of 6:30 AM ET, Friday’s regular session (9:30 AM – 4:00 PM ET), in the S&P 500, will likely open in the upper part of a positively skewed overnight inventory, outside of prior-range and -value, suggesting a potential for immediate directional opportunity.

Balance-Break + Gap Scenarios: A change in the market (i.e., the transition from two-time frame trade, or balance, to one-time frame trade, or trend) is occurring.

Monitor for acceptance (i.e., more than 1-hour of trade) outside of the balance area. 

Leaving value behind on a gap-fill or failing to fill a gap (i.e., remaining outside of the prior session’s range) is a go-with indicator. 

Rejection (i.e., return inside of balance) portends a move to the opposite end of the balance.

In the best case, the S&P 500 trades higher; activity above the $4,314.75 high volume area (HVNode) puts in play the $4,346.75 HVNode. Initiative trade beyond the $4,346.75 HVNode could reach as high as the $4,375.00 untested point of control (VPOC) and $4,395.25 HVNode, or higher.

In the worst case, the S&P 500 trades lower; activity below the $4,314.75 HVNode puts in play the $4,285.75 HVNode. Initiative trade beyond the $4,285.75 HVNode could reach as low as the $4,249.25 low volume area (LVNode) and $4,227.75 HVNode, or lower.

Considerations: Push-and-pull, as well as responsiveness near key-technical areas (that are discernable visually on a chart), suggests technically-driven traders with short time horizons are very active. 

Such traders often lack the wherewithal to defend retests and, additionally, the type of trade may be indicative of the other time frame participants waiting for more information to initiate trades.

Click here to load today’s key levels into the web-based TradingView charting platform. Note that all levels are derived using the 65-minute timeframe. New links are produced, daily.
Graphic: 65-minute profile chart of the Micro E-mini S&P 500 Futures.

What People Are Saying

Definitions

Overnight Rally Highs (Lows): Typically, there is a low historical probability associated with overnight rally-highs (lows) ending the upside (downside) discovery process.

Volume Areas: A structurally sound market will build on areas of high volume (HVNodes). Should the market trend for long periods of time, it will lack sound structure, identified as low volume areas (LVNodes). LVNodes denote directional conviction and ought to offer support on any test. 

If participants were to auction and find acceptance into areas of prior low volume (LVNodes), then future discovery ought to be volatile and quick as participants look to HVNodes for favorable entry or exit.

POCs: POCs are valuable as they denote areas where two-sided trade was most prevalent in a prior day session. Participants will respond to future tests of value as they offer favorable entry and exit.

About

After years of self-education, strategy development, mentorship, and trial-and-error, Renato Leonard Capelj began trading full-time and founded Physik Invest to detail his methods, research, and performance in the markets.

Capelj is also a Benzinga finance and technology reporter interviewing the likes of Shark Tank’s Kevin O’Leary, JC2 Ventures’ John Chambers, FTX’s Sam Bankman-Fried, and ARK Invest’s Catherine Wood, as well as a SpotGamma contributor developing insights around impactful options market dynamics.

Disclaimer

Physik Invest does not carry the right to provide advice.

In no way should the materials herein be construed as advice. Derivatives carry a substantial risk of loss. All content is for informational purposes only.

Categories
Commentary

Daily Brief For February 24, 2022

Editor’s Note: The Daily Brief is a free glimpse into the prevailing fundamental and technical drivers of U.S. equity market products. Join the 200+ that read this report daily, below!

What Happened

Overnight, equity index futures added to losses after news that Russia invaded Ukraine

The MOEX Russia Index fell nearly 50% while, at home in the U.S., equity index futures were off about 3%. Bonds rose with commodities which were led by crude oil (up ~9%). 

The CBOE Volatility Index (INDEX: VIX), a measure of implied volatility or participants’ forecast of likely movement in prices, printed 37.79 a ~7.00 jump from Wednesday.

This high-level context suggests to us the need for patience. Ranges will be wide. Positioning will compound headline-driven moves. Technical analyses will fail. Caution.

Ahead is data on jobless claims, gross domestic product, gross domestic income (8:30 AM ET), as well as new home sales (10:00 AM ET).

Graphic updated 6:45 AM ET. Risk-Off if expected /ES open is below the prior day’s range. /ES levels are derived from the profile graphic at the bottom of the following section. Levels may have changed since initially quoted; click here for the latest levels. SqueezeMetrics Dark Pool Index (DIX) and Gamma (GEX) calculations are based on where the prior day’s reading falls with respect to the MAX and MIN of all occurrences available. A higher DIX is bullish. At the same time, the lower the GEX, the more (expected) volatility. Learn the implications of volatility, direction, and moneyness. SHIFT data used for S&P 500 (INDEX: SPX) options activity. Note that options flow is sorted by the call premium spent; if more positive, then more was spent on call options. Breadth reflects a reading of the prior day’s NYSE Advance/Decline indicator. VIX reflects a current reading of the CBOE Volatility Index (INDEX: VIX) from 0-100.

What To Expect

Fundamental: “The ‘bad news = good news’ narrative for markets doesn’t work if the Fed is tightening amidst a slowdown and a military escalation risk. In this case, bad news = bad news.”

Pursuant to this remark by Alfonso Peccatiello, Russian equities fell the most on record (nearly 50%) after President Vladimir Putin ordered the demilitarization of Ukraine. 

Graphic: Via Bloomberg.

According to Bloomberg, this crisis comes “after the U.S. and its allies crossed Russia’s ‘red lines’ by expanding the NATO alliance.”

In terms of the economic implications of Russia sanctions, it is “Cyprus and eastern European countries [that] are the most reliant on Russian imports in the EU.” 

Ukraine’s crisis also throws a wrench at monetary tightening initiatives, abroad; “the European Central Bank will put even greater emphasis on its flexibility and options as it exits stimulus measures and shifts toward raising rates,” Governing Council member Francois Villeroy de Galhau said.

Graphic: Via Bloomberg.

Positioning: Implied volatility expands as heightened demand for protection is priced in.

Graphic: VIX term structure shifts higher, especially at the front-end. This denotes the heightened potential for instability.

This comes after, according to views expressed by The Ambrus Group’s Kris Sidial, “we saw larger inflow[s] into equity funds, outflow[s] out of money markets, larger buying in the ATSs, with no real put buying.”

Graphic: Via EPFR, Barclays, and Bloomberg. Taken from The Market Ear.

In other words, measures of implied volatility were not performing; participants opportunistically buying the dip witnessed an SPX down, VIX down environment in which hedges were not being marked up accordingly.

Graphic: Per Tier1Alpha, “In the past, when the $SPX/ $VIX correlation goes back to negative, there have been some pretty memorable volatility events. Worth keeping in mind.”

The implications of this action are staggering. 

As stated yesterday, as most participants, at least at the index level, own protection, the counterparties to this trade are short protection. 

These counterparties, therefore, have positive exposure to delta (i.e., as index falls [rises], position loses [makes] money) and negative exposure to gamma, or delta (directional) sensitivity to underlying price changes (i.e., as the index moves against short option exposure, losses are multiplied). 

With measures of implied volatility expanding, as is the case when there is heightened demand for downside put protection, protection is bid and the dealer’s exposure to positive delta rises, which solicits more selling in the underlying (addition of short-delta hedges).

Graphic: SqueezeMetrics details the implications of customer activity in the options market, on the underlying’s order book. For instance, in selling a put, customers add liquidity and stabilize the market. How? The market maker long the put will buy (sell) the underlying to neutralize directional risk as price falls (rises).

To monitor for capitulation, we may look for when the volatility expectations of implied volatility metrics rise to extremes. Learn more about VVIX, here.

Graphic: Charting the CBOE Volatility-Of-Volatility Index (INDEX: VVIX). In that reach for highly “convex” options, counterparties react in a manner that exacerbates underlying price movement.

We may also measure for one-sidedness in sentiment by looking to naive metrics like the put/call ratio. Learn more about PCALL, here.

Graphic: Using the put/call ratio to gauge sentiment.

Technical: As of 6:30 AM ET, Thursday’s regular session (9:30 AM – 4:00 PM ET), in the S&P 500, will likely open in the lower part of a negatively skewed overnight inventory, outside of prior-range and -value, suggesting a potential for immediate directional opportunity.

Gap Scenarios: Gaps ought to fill quickly. Should they not, that’s a signal of strength; do not fade. Leaving value behind on a gap-fill or failing to fill a gap (i.e., remaining outside of the prior session’s range) is a go-with indicator.

Auctioning and spending at least 1-hour of trade back in the prior range suggests a lack of conviction; in such a case, do not follow the direction of the most recent initiative activity.

In the best case, the S&P 500 trades higher; activity above the $4,122.25 high volume area (HVNode) puts in play the $4,177.25 HVNode. Initiative trade beyond the HVNodes could reach as high as the $4,212.25 regular trade low (RTH Low) and $4,249.25 low volume area (LVNode), or higher.

In the worst case, the S&P 500 trades lower; activity below the $4,122.25 HVNode puts in play the $4,055.75 LVNode. Initiative trade beyond the latter could reach as low as the $3,978.50 LVNode and $3,943.25 HVNode, or lower.

Considerations: If you are not well-versed in navigating trade at heightened levels of volatility, it is best to sit on your hands (SOH) or trade with a smaller size. Often, on large gaps, indexes may move sideways (and not up or down). This can be frustrating. 

Also, in high volatility, negative-gamma environments, headlines matter, and technical analyses often fail. Do not think “this time is as others” and let this event lead to your demise. Caution.

Click here to load today’s key levels into the web-based TradingView charting platform. Note that all levels are derived using the 65-minute timeframe. New links are produced, daily.
Graphic: 65-minute profile chart of the Micro E-mini S&P 500 Futures.

What People Are Saying

Definitions

Volume Areas: A structurally sound market will build on areas of high volume (HVNodes). Should the market trend for long periods of time, it will lack sound structure, identified as low volume areas (LVNodes). LVNodes denote directional conviction and ought to offer support on any test. 

If participants were to auction and find acceptance into areas of prior low volume (LVNodes), then future discovery ought to be volatile and quick as participants look to HVNodes for favorable entry or exit.

About

After years of self-education, strategy development, mentorship, and trial-and-error, Renato Leonard Capelj began trading full-time and founded Physik Invest to detail his methods, research, and performance in the markets.

Capelj is also a Benzinga finance and technology reporter interviewing the likes of Shark Tank’s Kevin O’Leary, JC2 Ventures’ John Chambers, FTX’s Sam Bankman-Fried, and ARK Invest’s Catherine Wood, as well as a SpotGamma contributor developing insights around impactful options market dynamics.

Disclaimer

Physik Invest does not carry the right to provide advice.

In no way should the materials herein be construed as advice. Derivatives carry a substantial risk of loss. All content is for informational purposes only.

Categories
Commentary

Daily Brief For July 28, 2021

Market Commentary

Equity index futures trade higher ahead of key fundamental events.

  • ECB comments, COVID, geopolitics.
  • Ahead: Trade data, FOMC, earnings.
  • Mixed bag. No follow-through lower.

What Happened: U.S. stock index futures auctioned sideways to higher ahead of some key fundamental developments.

In addition to the 8:30 AM release on advance trade in goods, as well as key earnings from heavily-weighted index constituents like Facebook Inc (NASDAQ: FB), participants will look to also price in the 2:00 PM ET Federal Open Market Committee (FOMC) announcement and Fed Chair Jerome Powell’s press conference.

As stated in the Weekly Brief, the U.S. is in a different place from the rest of the world and is likely to eliminate its output gap this year which would call for a tightening in policy and dollar strengthening, helping douse inflation.

Moody’s strategists note: “The impressive growth in value across many asset classes is projected to taper off within the next couple of years as supportive policy is unwound. The 10-year Treasury yield will rise above 2% by 2022 and the fiscal tailwinds will also have faded by then.”

Graphic updated 7:00 AM ET. Sentiment Neutral if expected /ES open is inside of the prior day’s range. See here for more on the Dark Pool Index and Gamma. A positive Dark Pool Index reading is bullish. At the same time, the higher (lower) the gamma, the less (more) volatility. SHIFT Search data used for options activity. Note that options flow is sorted by the call premium spent; if green and more (less) positive then more (less) was spent on call options. Breadth reflects a reading of the prior day’s Advance/Decline indicator.

What To Expect: As of 7:00 AM ET, Wednesday’s regular session (9:30 AM – 4:00 PM EST) in the S&P 500 will likely open inside of prior-range and -value, suggesting a limited potential for immediate directional opportunity.

Adding, during Tuesday’s volatile trade, the best case outcome occurred, evidenced by the S&P 500’s trade above a developing Volume Weighted Average Price (VWAP) pinch. This suggests the average buyer since the overnight high – $4,416.76 ONH – is in a winning position.

Overnight Rally Highs (Lows): Typically, there is a low historical probability associated with overnight rally-highs (lows) ending the upside (downside) discovery process.

Moving on, it’s important to take note of some topline and internal divergences. 

After establishing the new ONH, weakness in China spilled over; U.S. equity index futures, led by the Russell 2000 and Nasdaq 100 sold fast and heavy up until the Nasdaq 100 found responsive buyers at a key technical level – the 20-day simple moving average – that corresponded with a thick base of resting liquidity. After, the entire market reversed and closed in range.

In terms of internal divergences, breadth was significantly weaker on the Nasdaq side.

Graphic: Equity indexes traded lower as internal metrics – like the ratio of advancers to decliners – weakened.

Given the technical context, for today, participants can trade from the following frameworks. 

In the best case, the S&P 500 trades sideways or higher; activity above the $4,392.25 high volume area (HVNode) pivot likely puts in play the $4,406.25 low volume area (LVNode). Trade beyond the LVNode could reach as high as the $4,416.75 ONH and $4,428.25 Fibonacci extension.

In the worst case, the S&P 500 trades lower; activity below the $4,392.25 HVNode pivot likely puts in play the $4,381.75 LVNode. Trade beyond the $4,381.75 figure could reach as low as the $4,364.50 LVNode and $4,353.00 untested Point of Control (VPOC).

Volume Areas: A structurally sound market will build on past areas of high volume. Should the market trend for long periods of time, it will lack sound structure (identified as a low volume area which denotes directional conviction and ought to offer support on any test). 

If participants were to auction and find acceptance into areas of prior low volume, then future discovery ought to be volatile and quick as participants look to areas of high volume for favorable entry or exit.

POCs: POCs are valuable as they denote areas where two-sided trade was most prevalent. Participants will respond to future tests of value as they offer favorable entry and exit.
Graphic: 65-minute profile chart of the Micro E-mini S&P 500 Futures. Graphic updated 6:55 AM ET.

News And Analysis

The COVID trauma has changed economics forever. 

Credit Suisse probe is showing due diligence failings.

Spiraling debt crisis confronts Evergrande billionaire.

American job market optimism reached 21-year high.

What People Are Saying

About

After years of self-education, strategy development, and trial-and-error, Renato Leonard Capelj began trading full-time and founded Physik Invest to detail his methods, research, and performance in the markets. Additionally, Capelj is a finance and technology reporter. Some of his biggest works include interviews with leaders such as John Chambers, founder and CEO, JC2 Ventures, Kevin O’Leary, businessman and Shark Tank host, Catherine Wood, CEO and CIO, ARK Invest, among others.

Disclaimer

At this time, Physik Invest does not manage outside capital and is not licensed. In no way should the materials herein be construed as advice. Derivatives carry a substantial risk of loss. All content is for informational purposes only.

Categories
Commentary

Daily Brief For June 21, 2021

Market Commentary

Index futures attempt to balance.

  • Yield curve flattens, China eyes BTC.
  • Ahead: CFNAI. ECB and Fed speak.
  • Indices auctioned sideways to higher.

What Happened: U.S. stock index futures auctioned higher and yields dropped.

After a big shift in the Federal Reserve’s so-called dot-plot, bond yields on the short-end of the curve rose while long-dated yields dropped in line with projections future inflation is easing. This flatter yield curve is a negative for cyclical stocks which can’t pass on increased costs, thereby impacting sales and margins.

Given the divergence across major, broad market indices, the implications of a flatter yield curve are apparent. Investors sold, heavily, cyclical stocks, evidenced by relative weakness in sectors like financials and transportation. 

In other areas, bitcoin fell after China cracked down on crypto-related transactions. Oil held its highs on a slowdown in talks between the U.S. and Iran. 

Ahead is data on the Chicago Fed National Activity Index (CFNAI). Also, today, members of the ECB and Fed will speak. 

Graphic updated 7:10 AM ET.

What To Expect: Monday’s regular session (9:30 AM – 4:00 PM EST) in the S&P 500 will likely open inside of prior-range and -value, suggesting a limited potential for immediate directional opportunity.

Adding, during the prior day’s regular trade, the worst-case outcome occurred, evidenced by initiative trade below the $4,177.25 high volume area (HVNode) and end-of-day spike liquidation to and through $4,161.00, a strong support going into Friday’s derivative expiry.

Spikes: Spike’s mark the beginning of a break from value. Spikes higher (lower) are validated by trade at or above (below) the spike base (i.e., the origin of the spike).
Graphic: SpotGamma analysis suggested minimal support below $4,200.00, in the S&P 500.

For today, participants can trade from the following frameworks. 

In the best case, the S&P 500 trades sideways or higher; activity above the $4,161.00 spike base puts in play the $4,177.25 HVNode. Initiative trade beyond the $4,177.25 HVNode could reach as high as the $4,199.25 HVNode.

Volume Areas: A structurally sound market will build on past areas of high volume. Should the market trend for long periods of time, it will lack sound structure (identified as a low volume area which denotes directional conviction and ought to offer support on any test). 

If participants were to auction and find acceptance into areas of prior low volume, then future discovery ought to be volatile and quick as participants look to areas of high volume for favorable entry or exit.

In the worst case, the S&P 500 trades lower; activity below $4,161.00 suggests an acceptance of Friday’s knee-jerk move from value. In such a case, participants are cautioned on further downside. First comes the $4,153.25 HVNode. Thereafter, if lower, participants can target the overnight low (ONL) at $4,126.75 and HVNode at $4,122.25.

Overnight Highs (Lows): Typically, there is a low historical probability associated with overnight rally-highs (lows) ending the upside (downside) discovery process.
Graphic: 65-minute profile chart of the Micro E-mini S&P 500 Futures.
Graphic: Daily candlestick charts of the S&P 500 (top left), Nasdaq 100 (top right), Russell 2000 (bottom left), and Dow Jones Industrial Average (bottom right). Noting, seasonality supports the Nasdaq 100’s relative strength. 
Graphic: SHIFT search suggests participants were most interested in call strikes at and below current prices in the cash-settled S&P 500 Index (INDEX: SPX) and Nasdaq 100 (INDEX: NDX), last week. This activity may denote (1) stock replacement, (2) hedges for underlying short positions, or (3) speculation on the upside.

News And Analysis

Energy | Natural-gas glut has evaporated, driving prices higher. (WSJ)

Economy | Supply chain risks extend into 2022, stoking inflation. (WSJ)

Travel | American Air cuts some flights to avoid potential strains. (WSJ)

Politics | House bills put big tech step closer to antitrust regulation. (Fitch)

Markets | Goldman, JPMorgan pin emerging-market bets on hawks. (BBG)

Politics | Infrastructure bill talks continue; China comes in focus. (Moody’s)

Travel | Europe’s air traffic reaches 50% of 2019 amid recovery. (BBG)

Travel | Canada won’t fully reopen border until 75% vaccinations. (BBG)

What People Are Saying

Innovation And Emerging Trends

Technology | GM plans to expand its fuel-cell business beyond EVs. (CNBC)

Technology | Why the big automakers are pouring money into robotics. (TC)

Education | The pandemic’s effects have depressed college enrollment. (Axios)

About

Renato founded Physik Invest after going through years of self-education, strategy development, and trial-and-error. His work reporting in the finance and technology space, interviewing leaders such as John Chambers, founder, and CEO, JC2 Ventures, Kevin O’Leary, businessman and Shark Tank host, Catherine Wood, CEO and CIO, ARK Invest, among others, afforded him the perspective and know-how very few come by.

Having worked in engineering and majored in economics, Renato is very detailed and analytical. His approach to the markets isn’t built on hope or guessing. Instead, he leverages the unique dynamics of time and volatility to efficiently act on opportunity.

Disclaimer

At this time, Physik Invest does not manage outside capital and is not licensed. In no way should the materials herein be construed as advice. Derivatives carry a substantial risk of loss. All content is for informational purposes only.

Categories
Commentary

Daily Brief For April 21, 2021

Market Commentary

Index futures auction within prior range, position for directional resolve.

  • Virus surges, earnings accelerate.
  • Calendar light. ECB rate decision.
  • Buyers responded to lower prices.

What Happened: U.S. stock index futures auctioned sideways, overnight, after strong downside discovery the day prior.

ING Group Strategists“Markets remain very much caught between the rock of improving macroeconomic conditions and the treacherous waters of geopolitical risks and alarming Covid-19 case growth in some corners of the world.”

What To Expect: Wednesday’s regular session (9:30 AM – 4:00 PM EST) will likely open inside of prior-range and -value, suggesting a limited potential for immediate directional opportunity. 

Adding, during the prior day’s regular trade, the worst-case outcome occurred, evidenced by initiative trade beyond the $4,142.00 regular trade low, down to the $4,122.75 HVNode, which is significant because denotes an area of prior two-sided trade.

Volume Areas: A structurally sound market will build on past areas of high volume. Should the market trend for long periods of time, it will lack sound structure (identified as a low-volume area which denotes directional conviction and ought to offer support on any test).

If participants were to auction and find acceptance into areas of prior low-volume, then future discovery ought to be volatile and quick as participants look to areas of high volume for favorable entry or exit.

Further, in a nutshell, the market explored higher prices and is now probing into pockets of old value to drum up increased participation. The market is doing what it is supposed to — move to the area where participants want to do business. Given the remaining price targets at $4,200.00 and minimal excess (i.e., flat high) left behind last Friday’s price discovery, odds are participants lacked conviction and the market was unable to advertise higher prices.

Excess: A proper end to price discovery; the market travels too far while advertising prices. Responsive, other-timeframe (OTF) participants aggressively enter the market, leaving tails or gaps which denote unfair prices.

Price Discovery (One-Timeframe Or Trend): Elongation and range expansion denotes a market seeking new prices to establish value, or acceptance (i.e., more than 30-minutes of trade at a particular price level). 

This is generally a bullish dynamic. Why? Think of there being unfinished business at the all-time high. As stated earlier, a market moves to where there is business to be conducted.

Moving on, the two-day liquidation has pushed the S&P 500 down into short-gamma territory. This is not good. Why? Short-gamma is opposite to the forces that crush volatility and promote lengthy bursts of momentum.

Liquidation Breaks: The profile shape suggests participants were “too” long and had poor location.

Gamma: Gamma is the sensitivity of an option to changes in the underlying price. Dealers that take the other side of options trades hedge their exposure to risk by buying and selling the underlying. When dealers are short-gamma, they hedge by buying into strength and selling into weakness. When dealers are long-gamma, they hedge by selling into strength and buying into weakness. The former exacerbates volatility. The latter calms volatility.
Graphic: SPDR S&P 500 ETF Trust (NYSE: SPY) in short-gamma territory, via SpotGamma.

Due to occurrences discussed in the weekend commentary, such as increased put selling during market strength, volatility expansion and a rise in delta (i.e., exposure to the underlying asset) will force put-side option sellers to sell into weakness, to hedge off their risk, thereby exacerbating volatility.

Graphic: SqueezeMetrics highlights implications of volatility, direction, and moneyness.

In the event that some exogenous event (e.g., COVID-19 resurgence, tax-hike) was to surface, odds favor increased volatility and potential for downside.

Moreover, for today, participants can trade from the following frameworks. 

In the best case, the S&P 500 trades higher; activity higher than the $4,142.00 regular trade low targets the $4,155 high volume area (HVNode). Initiative trade beyond the HVNode could reach as high as the $4,171 VPOC. In the worst case, the S&P 500 trades lower; activity below $4,122.75 targets the $4,104.00 low volume area (LVNode). Initiative trade beyond that figure puts in play the $4,082.75 and $4,069.25 HVNodes.

POCs: POCs (like HVNodes described above) are valuable as they denote areas where two-sided trade was most prevalent. Participants will respond to future tests of value as they offer favorable entry and exit.
Graphic: 65-minute profile chart of the Micro E-mini S&P 500 Futures.
Graphic: Physik Invest maps out the purchase of call and put options in the SPDR S&P 500 ETF Trust (NYSE: SPY), for April 20. Activity in the options market was primarily concentrated in short-dated tenors, in strikes as low as $381, which corresponds with $3,810 in the cash-settled S&P 500 Index (INDEX: SPX).
Graphic: SHIFT search suggests participants lack directional conviction in the SPDR S&P 500 ETF Trust (NYSE: SPY).

News And Analysis

Science | Man-made lakes in U.S. West and Mexico to shrink to historical lows. (AP)

Markets | Mortgage rates come down as the bond market regains strength. (MND)

Markets | Federal Reserve will limit any overshoot of inflation target, Powell says. (REU)

Travel | Washington says travel warnings will cover 80% of the world’s nations. (BBG)

Policy | On the verge of a realignment of politics, economic policy, and living. (Ritholtz)

Markets | MIAX expanding futures division with new hires from Cboe and Citi. (TT)

Markets | U.K. scaps MiFID II requirements in ambitious capital markets reform. (TT)

Economy | While lumber prices are soaring, actual logs remain very dirt cheap. (BBG)

What People Are Saying

Innovation And Emerging Trends

Innovation | Lessons from Jeff Bezos’ annual letters to Amazon shareholders. (CB)

Markets | How Robinhood made trading easy and maybe even too hard to resist. (BBG)

Space | International crew, recycled capsule: SpaceX is preparing to launch. (AMN)

Venture | A look at Stripe, the most highly valued venture-backed private company. (CN)

FinTech | Fintech IPOs: Four foundational keys to success, preparing for IPO. (FM)

FinTech | U.K. creates a new fintech sandbox for distributed ledger technology. (S&P

FinTech | Venture capital interest in Latin America swells as fintech takes flight. (PB)

FinTech | Insurtech startups are leveraging rapid growth to raise big money. (TC)

FinTech | China’s central bank plans to build out a fintech cloud infrastructure. (SCMP)

 About

Renato founded Physik Invest after going through years of self-education, strategy development, and trial-and-error. His work reporting in the finance and technology space, interviewing leaders such as John Chambers, founder, and CEO, JC2 Ventures, Kevin O’Leary, Canadian businessman and Shark Tank host, Catherine Wood, CEO and CIO, ARK Invest, among others, afforded him the perspective and know-how very few come by.

Having worked in engineering and majored in economics, Renato is very detailed and analytical. His approach to the markets isn’t built on hope or guessing. Instead, he leverages the unique dynamics of time and volatility to efficiently act on opportunity.

 Disclaimer

At this time, Physik Invest does not manage outside capital and is not licensed. In no way should the materials herein be construed as advice. Derivatives carry a substantial risk of loss. All content is for informational purposes only.