
What Happened
Overnight, equity index futures auctioned sideways after the large move higher.
This comes alongside top news items including Evergrande’s default, omicron transmission, U.K. COVID-19 restrictions, among other things.
Ahead is data on jobless claims (8:30 AM ET), wholesale inventories (10:00 AM ET), as well as real household wealth and nonfinancial debt (12:00 PM ET).
What To Expect
On lackluster intraday breadth and supportive market liquidity metrics, the best case outcome occurred evidenced by sideways trade and overlapping value (i.e., the prices levels at which 70% of the day’s volume was transacted).
Notwithstanding, as stated in the past, though this activity marks participants’ willingness to discover and validate higher prices, the prior structure is poor; there is technical instability.
Specifically, both Monday and Tuesday’s sessions left gaps and p-shaped emotional, multiple-distribution profile structures (i.e., old-money shorts covering).
As said before, participants will look to revisit, repair, and strengthen – build out areas of high volume (HVNodes) via the cave-fill process – these areas of low volume (LVNodes).
Context: Next week the Federal Reserve is likely to announce an acceleration in its taper.
“[T]he implicit expectation is that by moving more quickly and aggressively, the Fed will save itself from having to hike too far and make rates so expensive that they slow down the economy,” Bloomberg’s John Authers explained.
Adding, William Dudley, a former New York Fed governor, believes there will be three 0.25-percentage-point rate increases next year.
In 2023, Dudley sees four rate hikes that bring the median target rate to 1.8%, and then, the target rate will reach 2.5% in 2024.
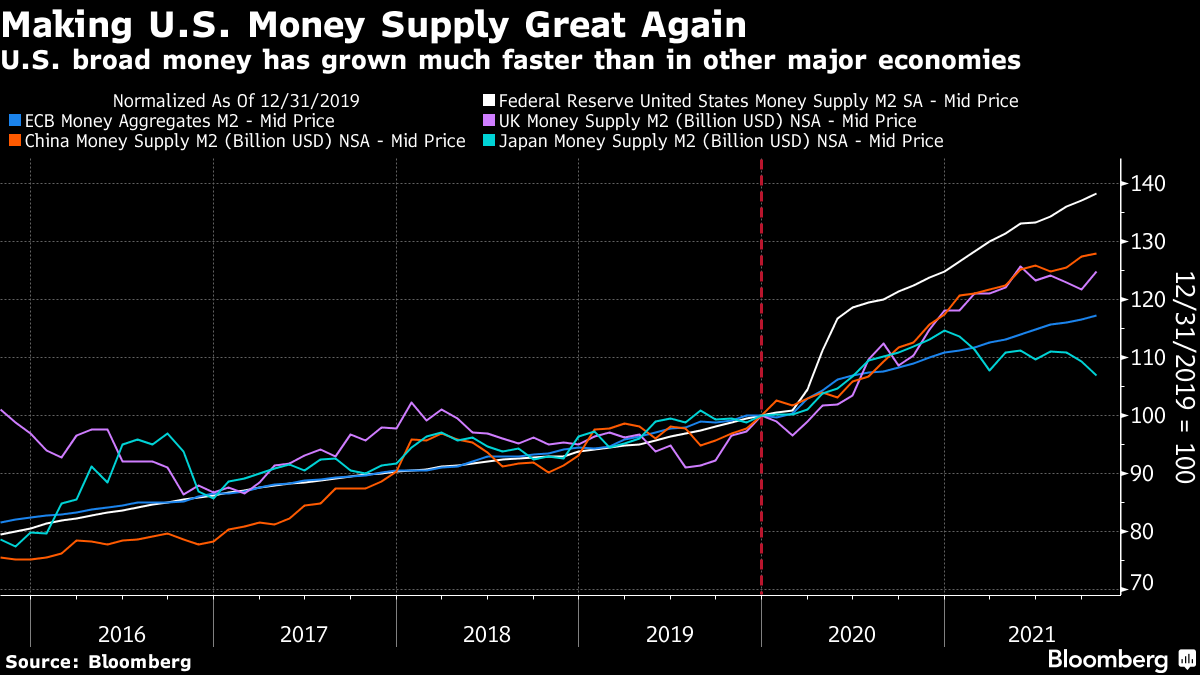
Authers adds: “If we take broad ‘M2’ money as a yardstick for the amount of liquidity in the economy, it’s clear that the Fed has trodden on the accelerator for much longer than other central banks.”
Moreover, rising rates, among other factors, have the potential to decrease the present value of future earnings, thereby making stocks, especially those that are high growth, less attractive.
As the market is a forward-looking mechanism, the implications of this are staggering.
Prevailing monetary frameworks and max liquidity promoted a large divergence in price from fundamentals.
The growth of passive investing – the effect of increased moneyness among nonmonetary assets – and derivatives trading imply a lot of left-tail risks.
As Kai Volatility’s Cem Karsan once told me: “There’s this constant structural positioning that naturally drives markets higher as long as volatility is compressed,” or there is supply.
“At the end of the day, though, the higher you go, the further off the ground you are and the more tail risk.”
To put it simply, participants are more exposed to leveraged products, among other things, which increases the speed with which volatility is realized.
“It’s not a coincidence that the mid-February to mid-March 2020 downturn literally started the day after February expiration and ended the day of March quarterly expiration” Karsan adds.
“These derivatives are incredibly embedded in how the tail reacts and there’s not enough liquidity, given the leverage, if the Fed were to taper.”
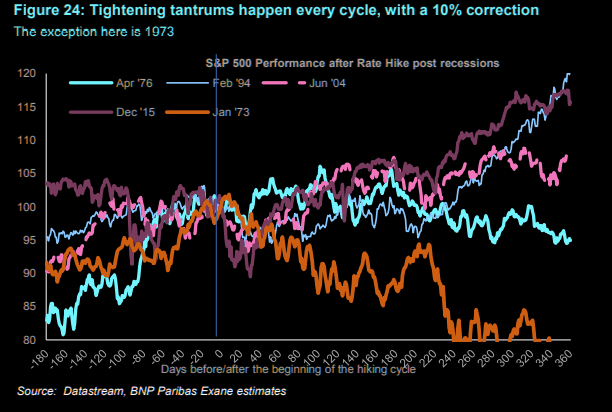
Despite today’s rates and earnings supporting validations better than in the ‘90s, an intent to moderate stimulus serves as a headwind.
That said, the S&P 500 typically rallies into the first hike. After, expect noise.
At present, the return distribution is skewed positive, but a lot of the punchy opportunity (based on how participants were positioned just a week ago) has disappeared.
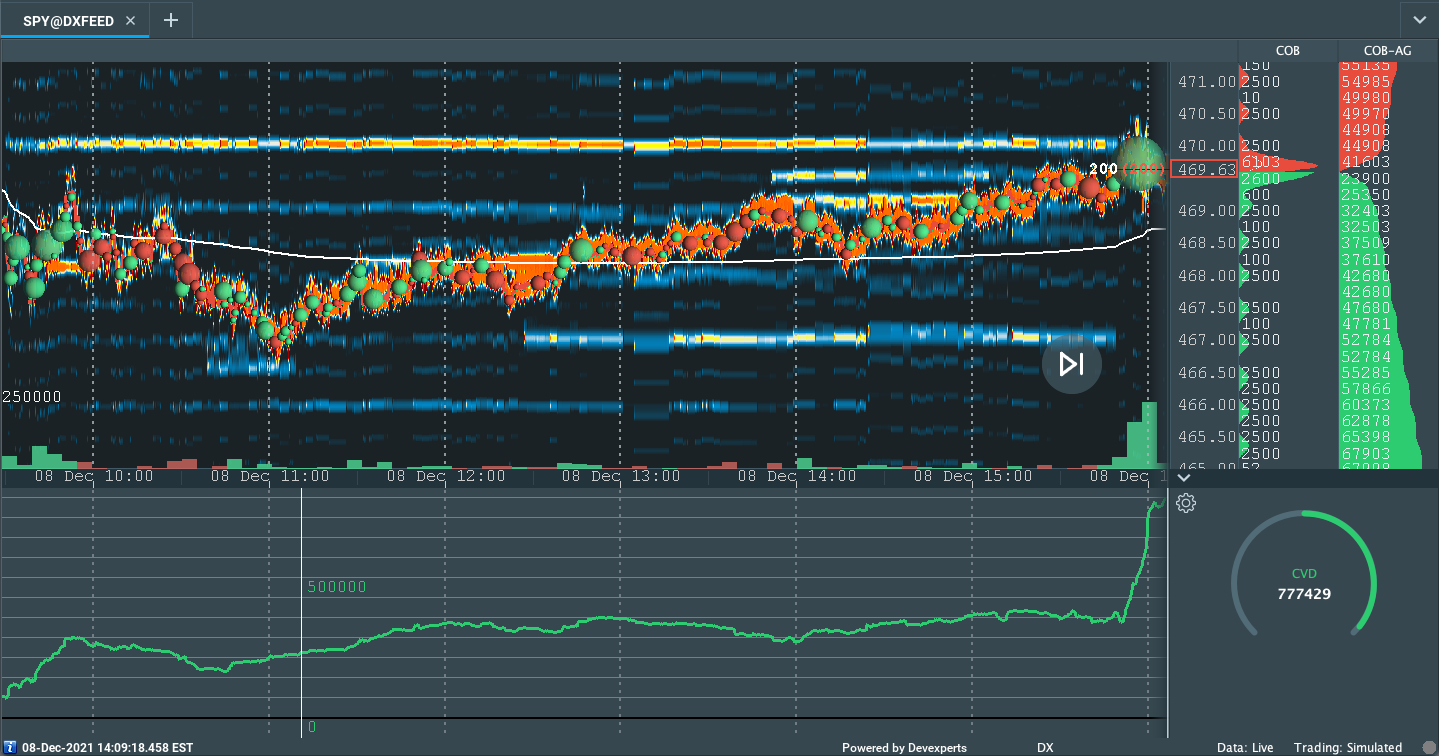
The dynamics surrounding the collapse in volatility and expiry of extremely short-dated downside protection have played out; the market entered into positive-gamma wherein the counterparties to customer options trades add market liquidity and temper realized volatility.
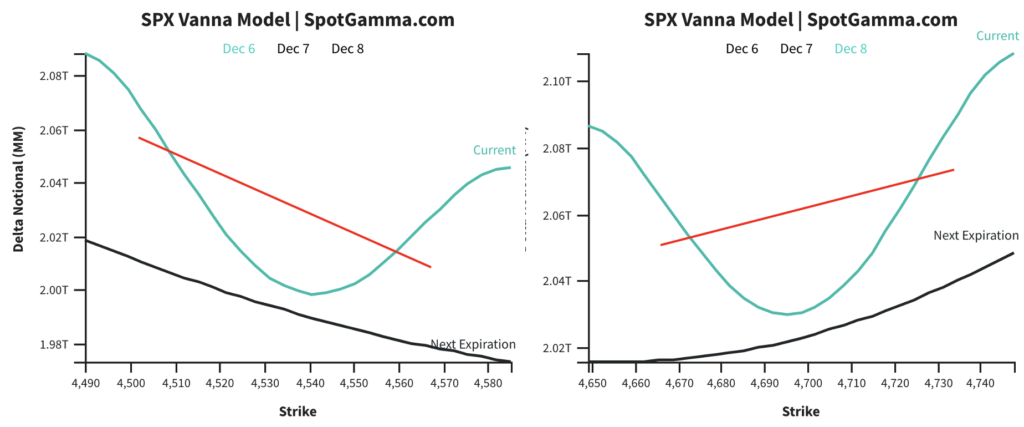
If participants are assuaged of their fears at next week’s Federal Open Market Committee (FOMC) meeting, a collapse in event-related implied volatility ought to bring in positive flows as the long delta (from dealers’ exposure to short puts) decreases; the decrease in dealer supply (short delta), via covering of short stock/futures hedges, would bolster any attempt higher. See below.
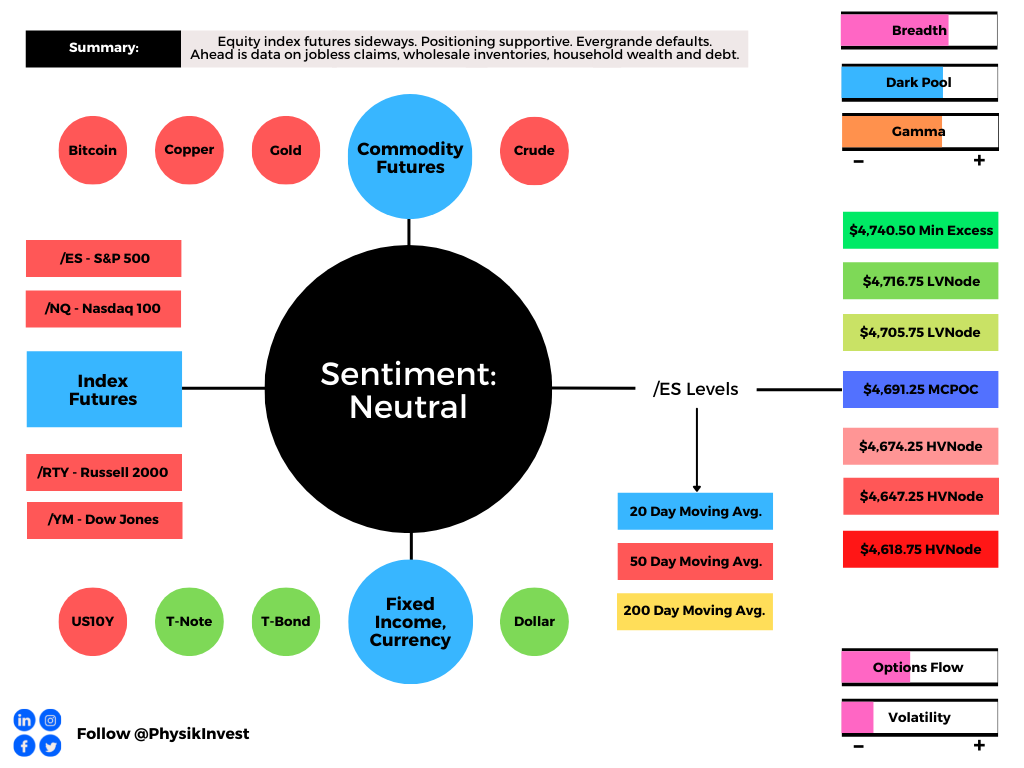
Expectations: As of 6:15 AM ET, Thursday’s regular session (9:30 AM – 4:00 PM ET), in the S&P 500, will likely open in the bottom part of a negatively skewed overnight inventory, inside of prior-range and -value, suggesting a limited potential for immediate directional opportunity.
In the best case, the S&P 500 trades sideways or higher; activity above the $4,691.25 micro composite point of control (MCPOC) puts in play the $4,705.75 LVNode. Initiative trade beyond the LVNode could reach as high as the $4,716.75 LVNode and $4,740.50 minimal excess high, or higher.
In the worst case, the S&P 500 trades lower; activity below the $4,691.25 MCPOC puts in play the $4,674.25 HVNode. Initiative trade beyond the HVNode could reach as low as the $4,647.25 and $4,618.75 HVNode, or lower.
Click here to load today’s key levels into the web-based TradingView charting platform. Note that all levels are derived using the 65-minute timeframe. New links are produced, daily.

What People Are Saying
Definitions
Cave-Fill Process: Widened the area deemed favorable to transact at by an increased share of participants. This is a good development.
Volume Areas: A structurally sound market will build on areas of high volume (HVNodes). Should the market trend for long periods of time, it will lack sound structure, identified as low volume areas (LVNodes). LVNodes denote directional conviction and ought to offer support on any test.
If participants were to auction and find acceptance into areas of prior low volume (LVNodes), then future discovery ought to be volatile and quick as participants look to HVNodes for favorable entry or exit.
MCPOCs: POCs are valuable as they denote areas where two-sided trade was most prevalent over numerous day sessions. Participants will respond to future tests of value as they offer favorable entry and exit.
Excess: A proper end to price discovery; the market travels too far while advertising prices. Responsive, other-timeframe (OTF) participants aggressively enter the market, leaving tails or gaps which denote unfair prices.
Value-Area Placement: Perception of value unchanged if value overlapping (i.e., inside day). Perception of value has changed if value not overlapping (i.e., outside day). Delay trade in the former case.
About
After years of self-education, strategy development, and trial-and-error, Renato Leonard Capelj began trading full-time and founded Physik Invest to detail his methods, research, and performance in the markets.
Additionally, Capelj is a Benzinga finance and technology reporter interviewing the likes of Shark Tank’s Kevin O’Leary, JC2 Ventures’ John Chambers, and ARK Invest’s Catherine Wood, as well as a SpotGamma contributor, helping develop insights around impactful options market dynamics.
Disclaimer
At this time, Physik Invest does not carry the right to provide advice. In no way should the materials herein be construed as advice. Derivatives carry a substantial risk of loss. All content is for informational purposes only.