
Physik Invest’s Daily Brief is a free newsletter sent to thousands of subscribers daily. Intrigued about what moves markets and how that can impact your financial wellness? Subscribe below.

Administrative
The newsletter format needs to evolve a bit. Feedback is welcomed! If you are looking for the link to the daily chart, see the caption below the graphic above. Take care!
Positioning
Fear of contagion prompted demands for protection. Measures of implied volatility or IVOL rose, and consequently, these demands for protection pressured markets.
Since then, fear has ebbed.
Read: Black Swan Funds Have A Moment As Investors Hedge Market Doom
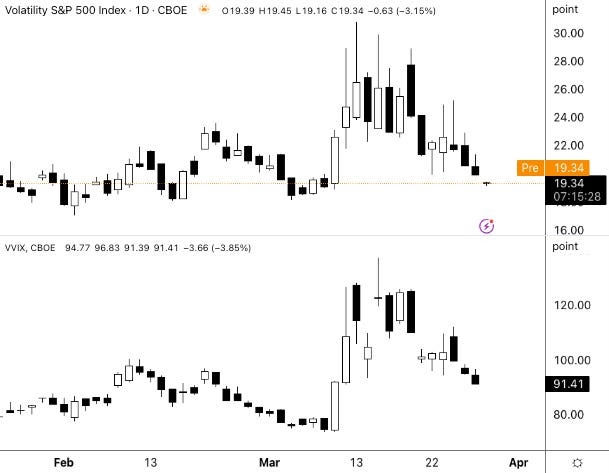
Previously, this letter explained for protection to keep its value, there would have to be a shift higher in realized volatility or RVOL. Well, RVOL did not come back in a big way at the index level, as many expected.
Thus, the positive effects of the bank-related stimulation and traders’ pulling forward their timeline for easing were compounded by the unwinding of hedging strategies.
Read: MBA Data Shows Rate Decline Helped Boost Home-Purchase Applications

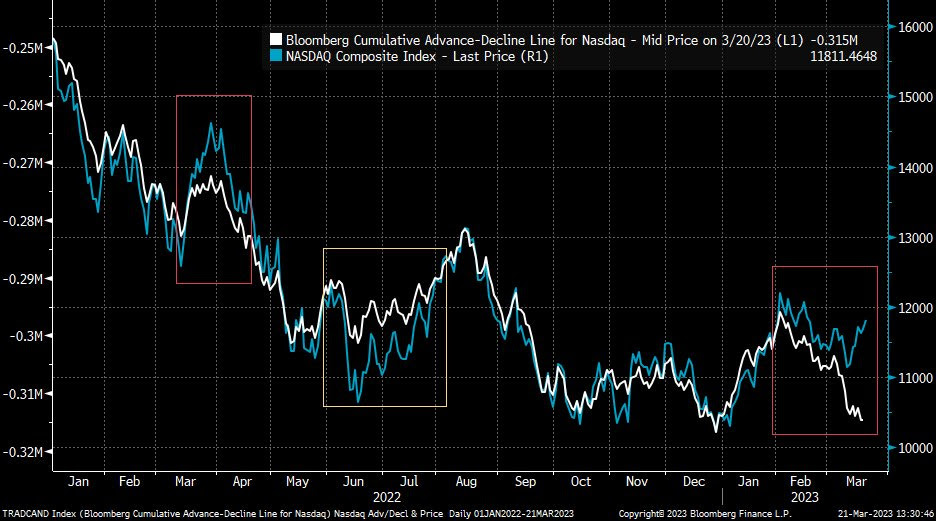
Previously depressed products like the Nasdaq 100 or NDX, which are generally very sensitive to monetary tightening, have performed well.

As we near month-end, there is a quarterly derivatives expiry. Above current S&P 500 or SPX levels is a significant concentration of soon-to-roll-off open interest held short by investors. This means the counterparties are dynamically hedging a call they own; they’re selling strength and buying weakness, albeit in a less and less meaningful way, as those options near this expiration and their probability of paying out (i.e., delta or exposure to direction) falls.
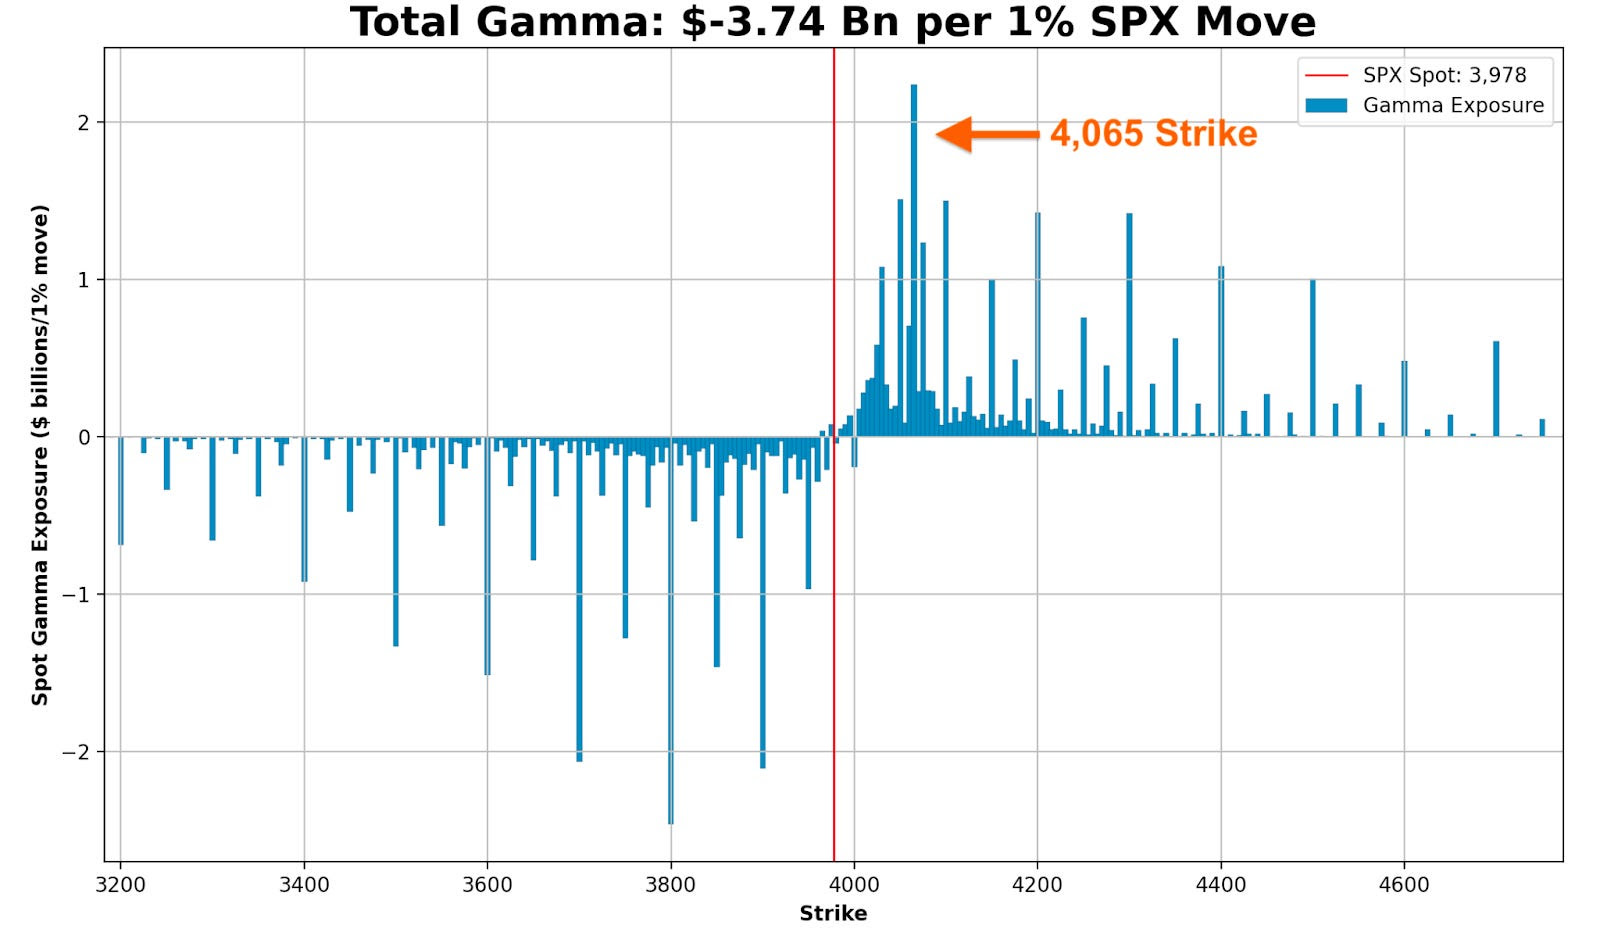
Some would allege that volatility compression and time decay would have solicited a more meaningful response from options counterparties at those strike prices above; the absence of downside follow-through had traders supplying previously demanded downside put protection and catalyzing a rally. However, there are not many things for the market to rally on, and so much time has passed that the charm effects (i.e., the impact of time passing on an options delta) have lessened dramatically, some explain.
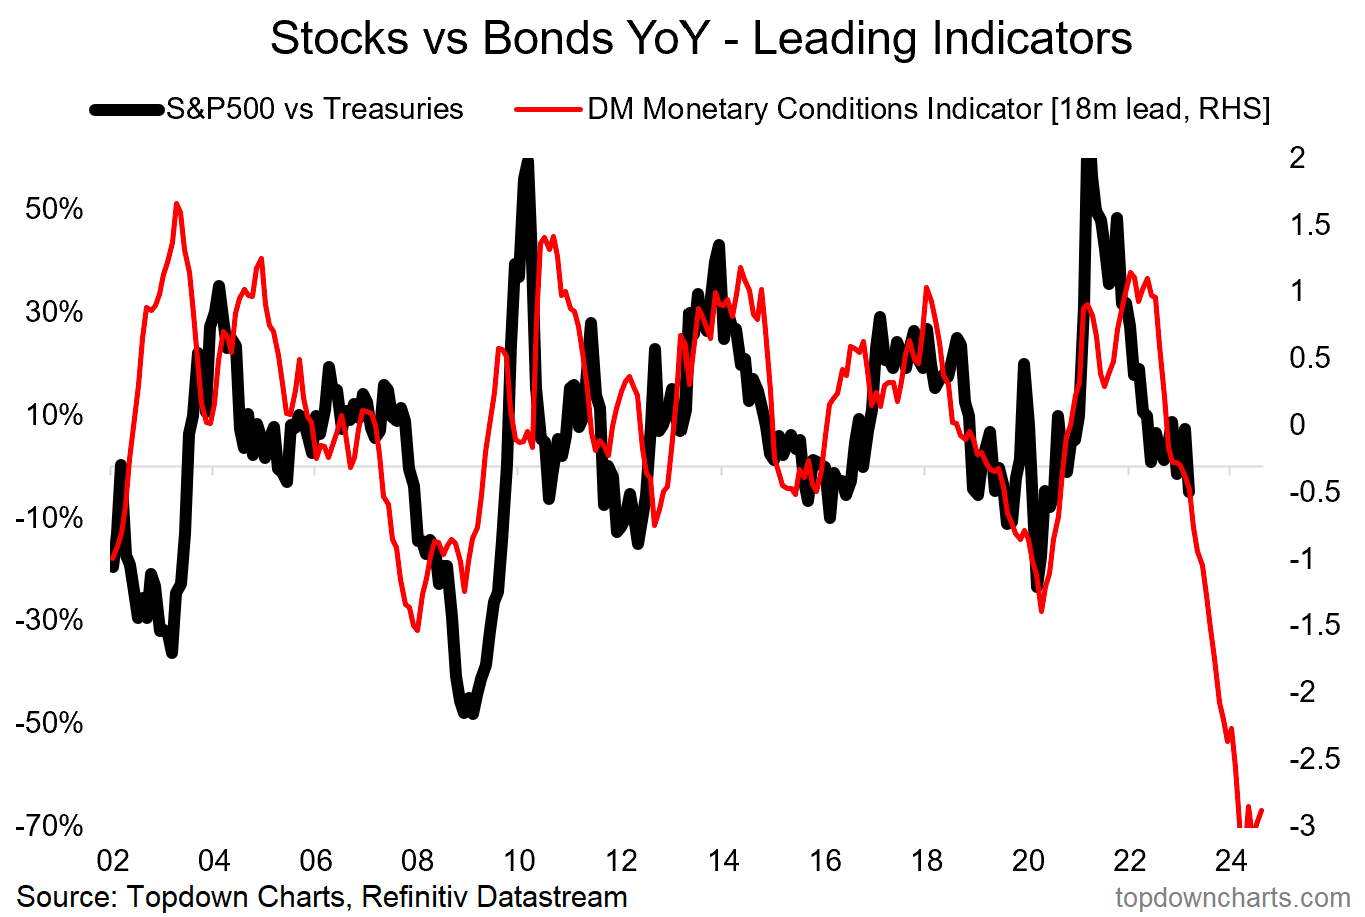
Therefore, it’s probably likely that the market remains contained through month-end. After, movement may increase. This letter acknowledged RVOL might come back in a big way, particularly with the bank intervention doing more to thwart credit creation.
The caveat is that markets can trade spiritedly for far longer. There is a potential for the markets to move into a far “more combustible” position. With call skews far up meaningfully steep, still-present low- and zero-cost call structures this letter has talked about in the past remain attractive.

If the market falls apart, your costs are low, and losses are minimal. If markets move higher into that “more combustible” position, wherein “volatility is sticky into a rally,” you may monetize your call structures and roll some of those profits into bear put spreads (i.e., buy put and sell another at a lower strike).
Daily Brief | February 17, 2023
The signs of a “more combustible situation” would likely show when “volatility is sticky into a rally,” explains Kai Volatility’s Cem Karsan. To gauge combustibility, look to the options market.
Remember, calls trade at a lower IVOL than puts. As the market trades higher, it slides to a lower IVOL, reflected by broad IVOL measures. If broad IVOL measures are sticky/bid, “that’s an easy way to say that fixed-strike volatility is coming up and, if that can happen for days, that can unpin volatility and create a situation where dealers themselves are no longer [own] a ton of volatility; they start thinning out on volatility themselves, and that creates a more combustible situation.”
To explain the “thinning out” part of the last paragraph, recall participants often opt to own equity and downside (put) protection financed, in part, with sales of upside (call) protection. More demand for calls will result in counterparties taking on more exposure against movement (i.e., negative gamma) hedged via purchases of the underlying. Once that exposure expires and/or decays, that dealer-based support will be withdrawn. If the assumption is that equity markets are expensive now, then, after another rally, there may be more room to fall, all else equal (a simplistic way to look at this), hence the increased precariousness and combustibility.
Read: Buy-Or-Rent Premium Is Highest Since 2006 Housing Bubble
About
The author, Renato Leonard Capelj, spends the bulk of his time at Physik Invest, an entity through which he invests and publishes free daily analyses to thousands of subscribers. The analyses offer him and his subscribers a way to stay on the right side of the market.
Separately, Capelj is an accredited journalist with past works, including interviews with investor Kevin O’Leary, ARK Invest’s Catherine Wood, FTX’s Sam Bankman-Fried, North Dakota Governor Doug Burgum, Lithuania’s Minister of Economy and Innovation Aušrinė Armonaitė, former Cisco chairman and CEO John Chambers, and persons at the Clinton Global Initiative.
Connect
Direct queries to renato@physikinvest.com. Find Physik Invest on Twitter, LinkedIn, Facebook, and Instagram. Find Capelj on Twitter, LinkedIn, and Instagram. Only follow the verified profiles.
Calendar
You may view this letter’s content calendar at this link.
Disclaimer
Do not construe this newsletter as advice; all content is for informational purposes. Capelj and Physik Invest are non-professional advisors managing their own capital. They will never openly solicit others for capital or manage others’ capital to collect fees and disbursements.


