The Daily Brief is a free glimpse into the prevailing fundamental and technical drivers of U.S. equity market products. Join the 200+ that read this report daily, below!
What Happened
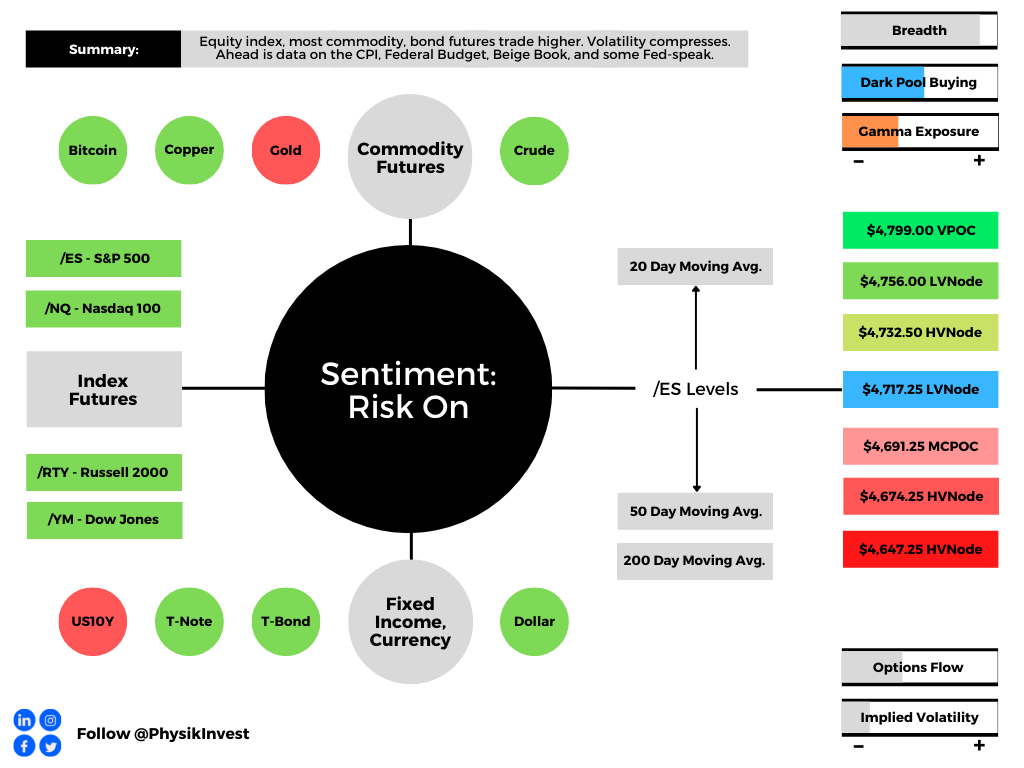
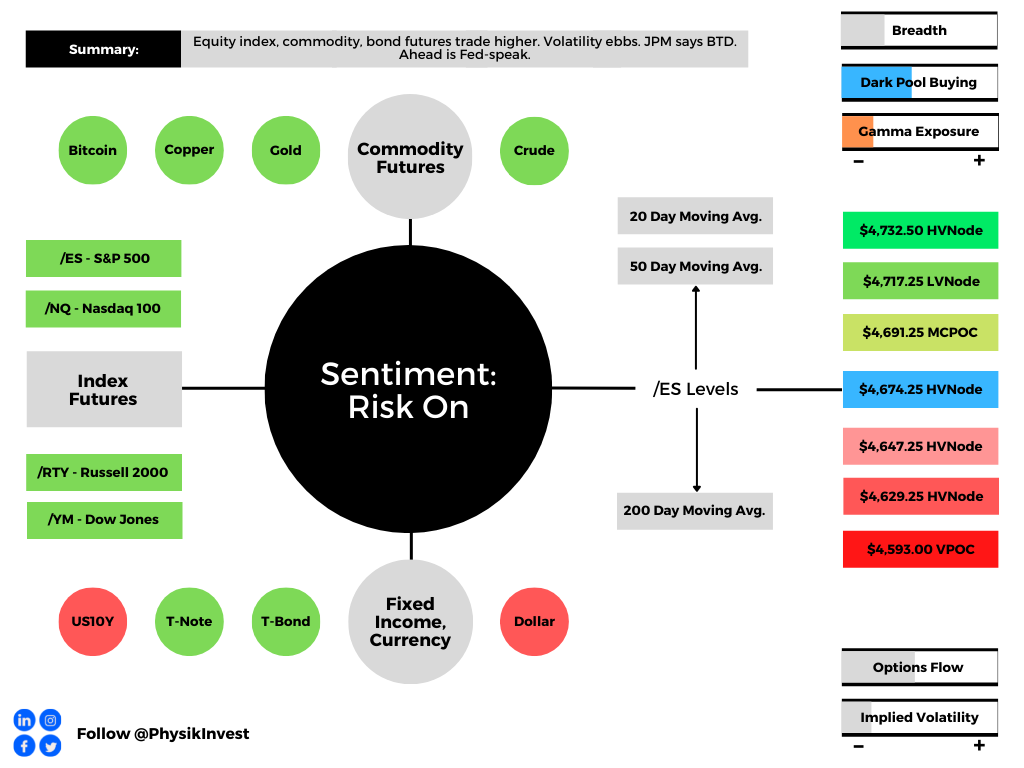
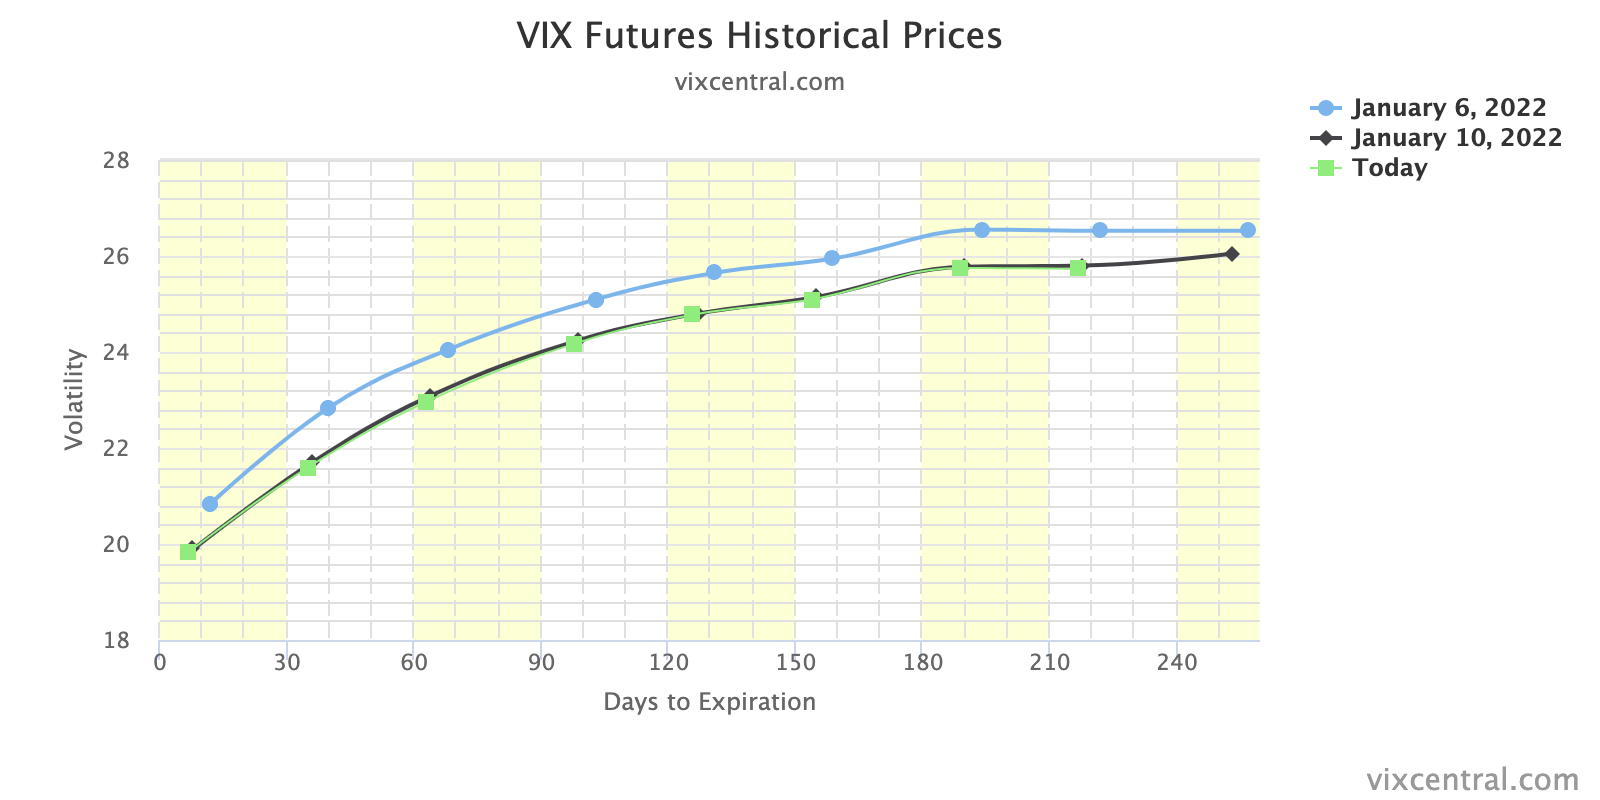
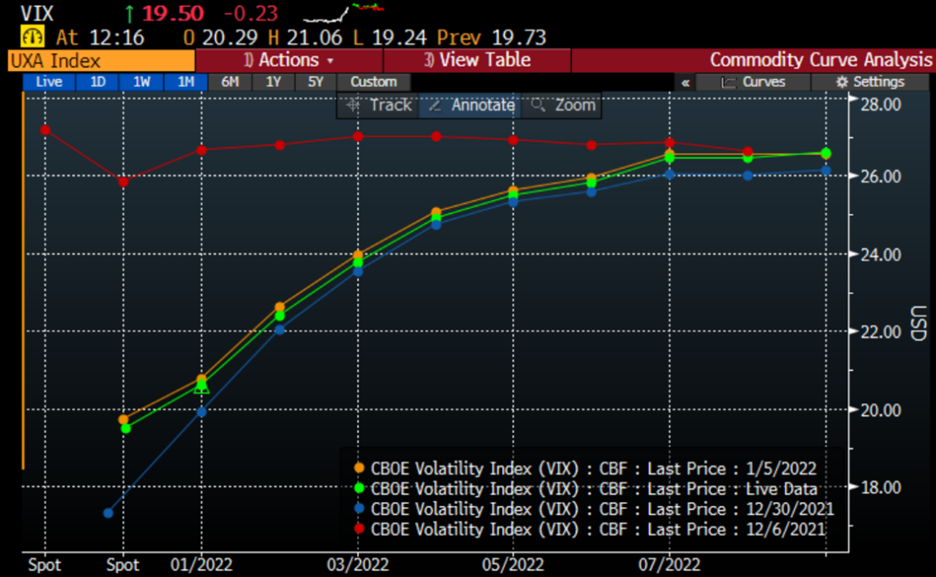
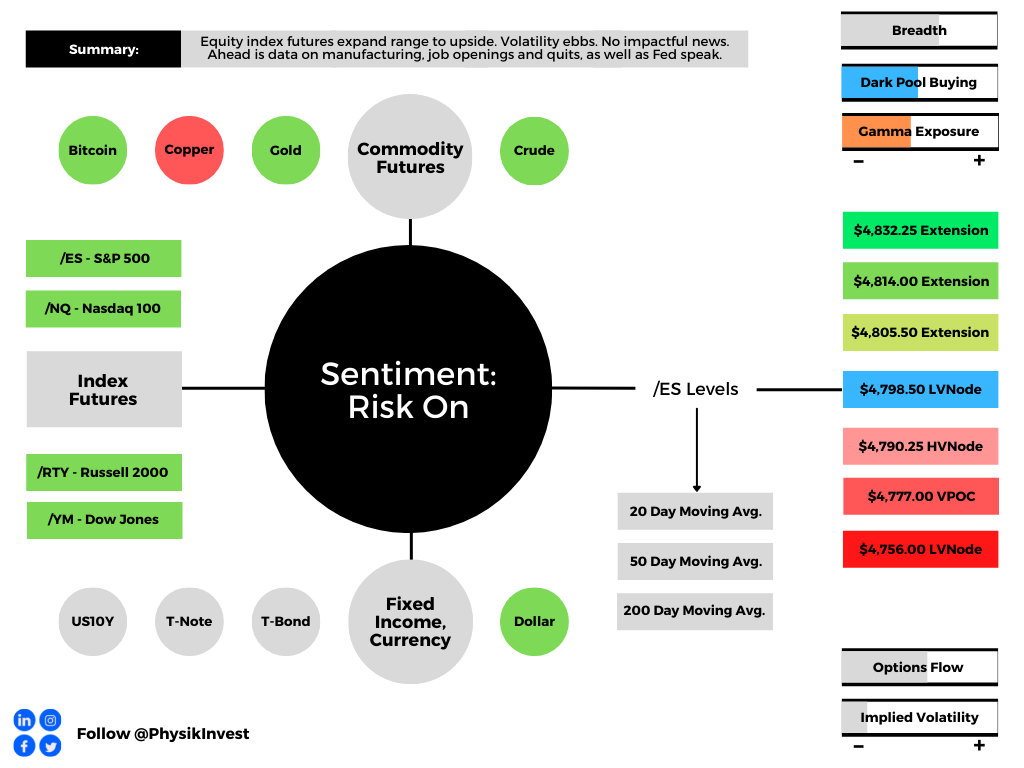
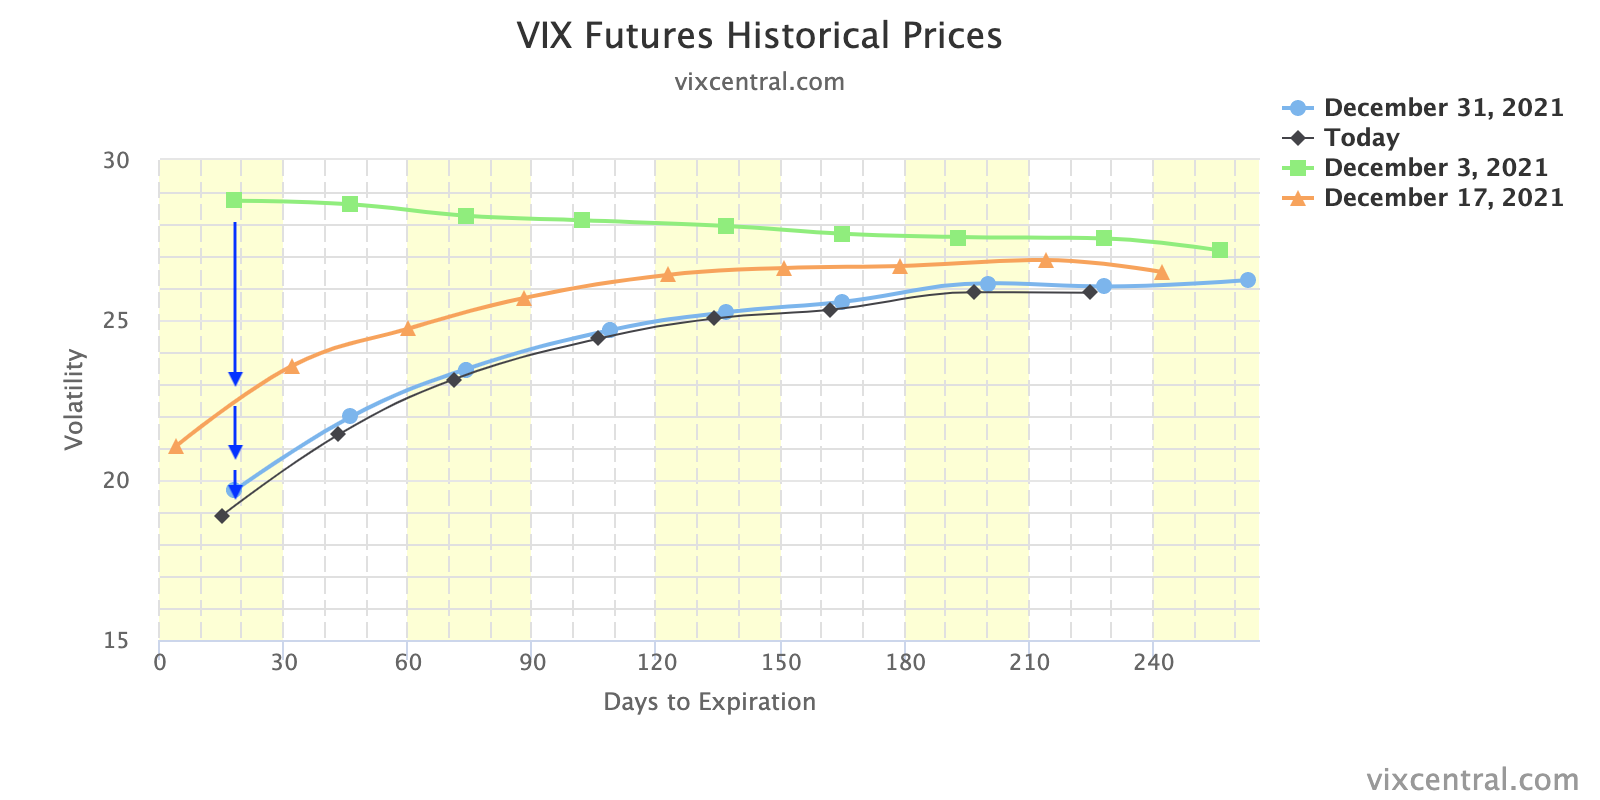
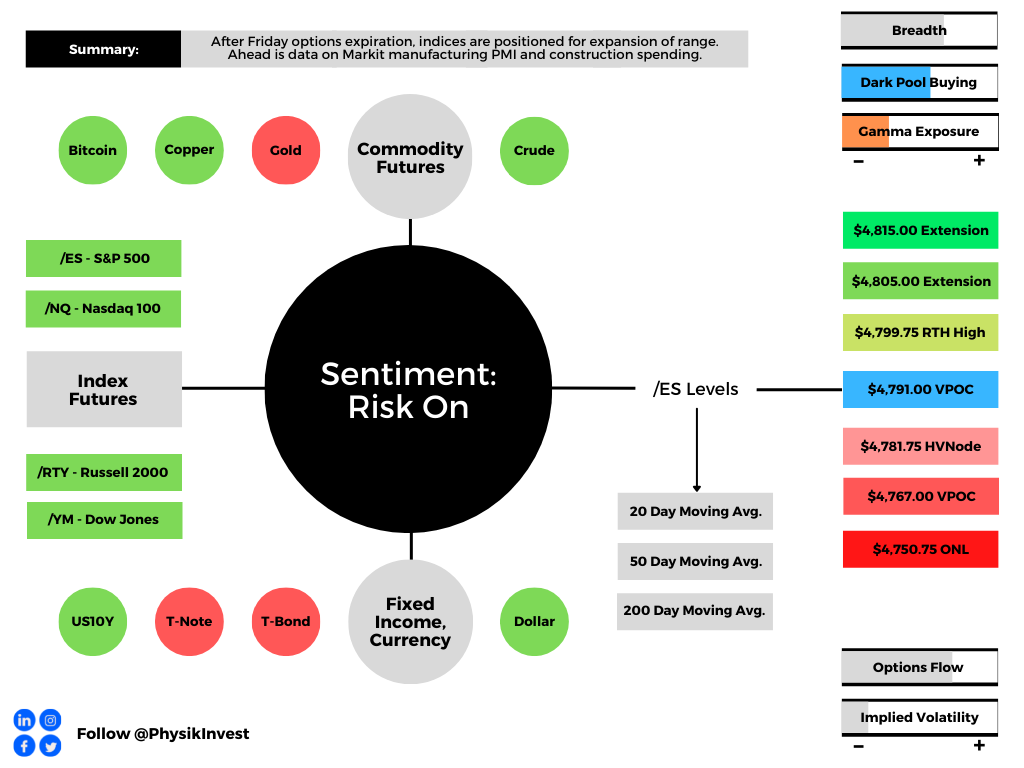
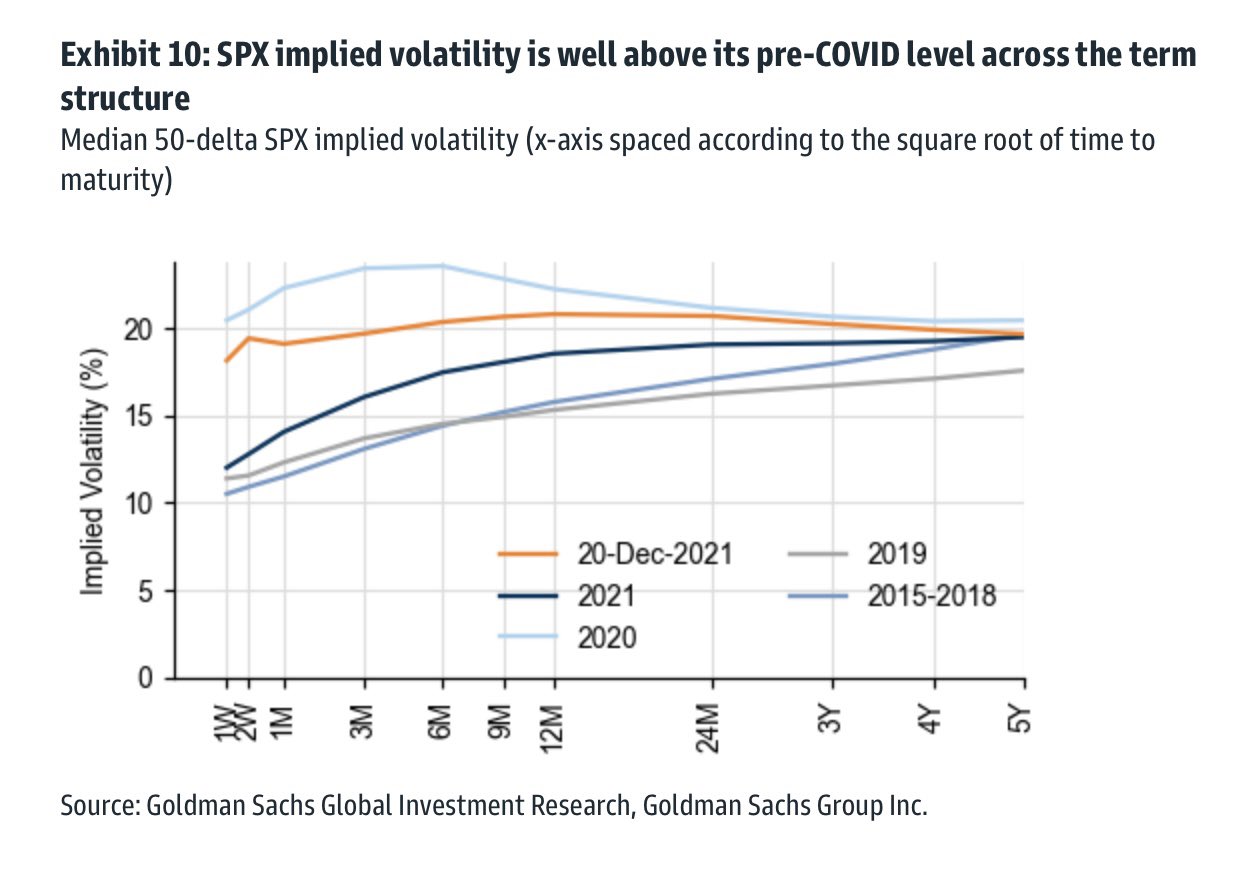
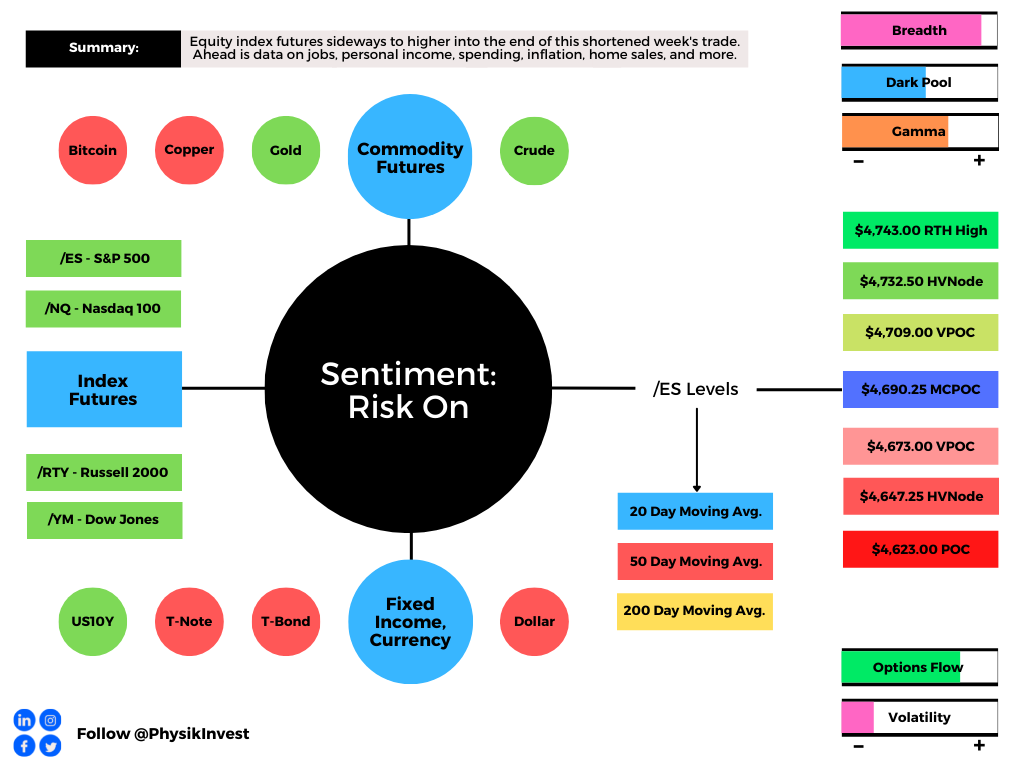
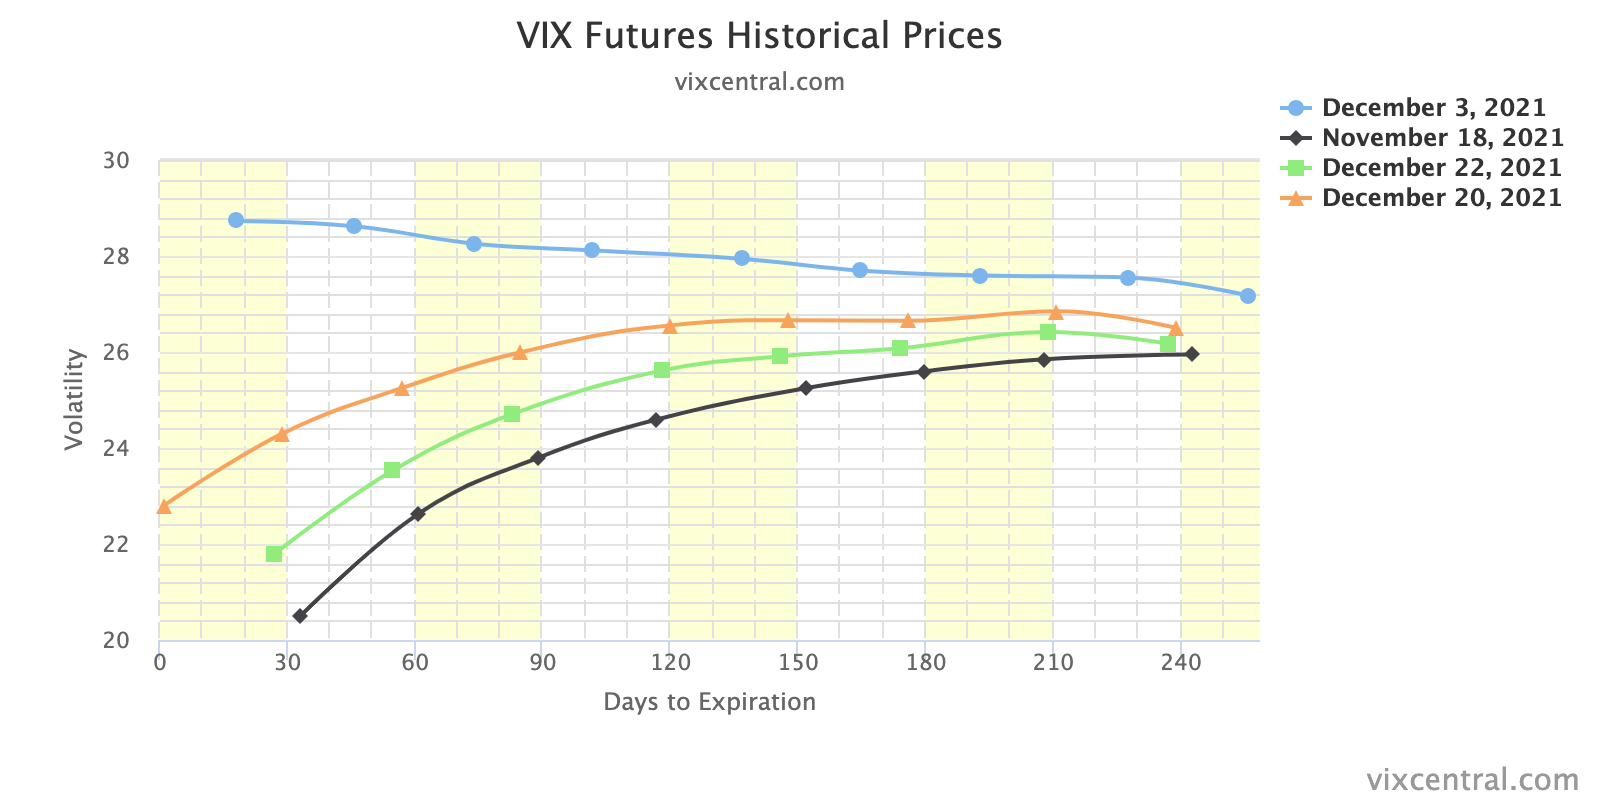
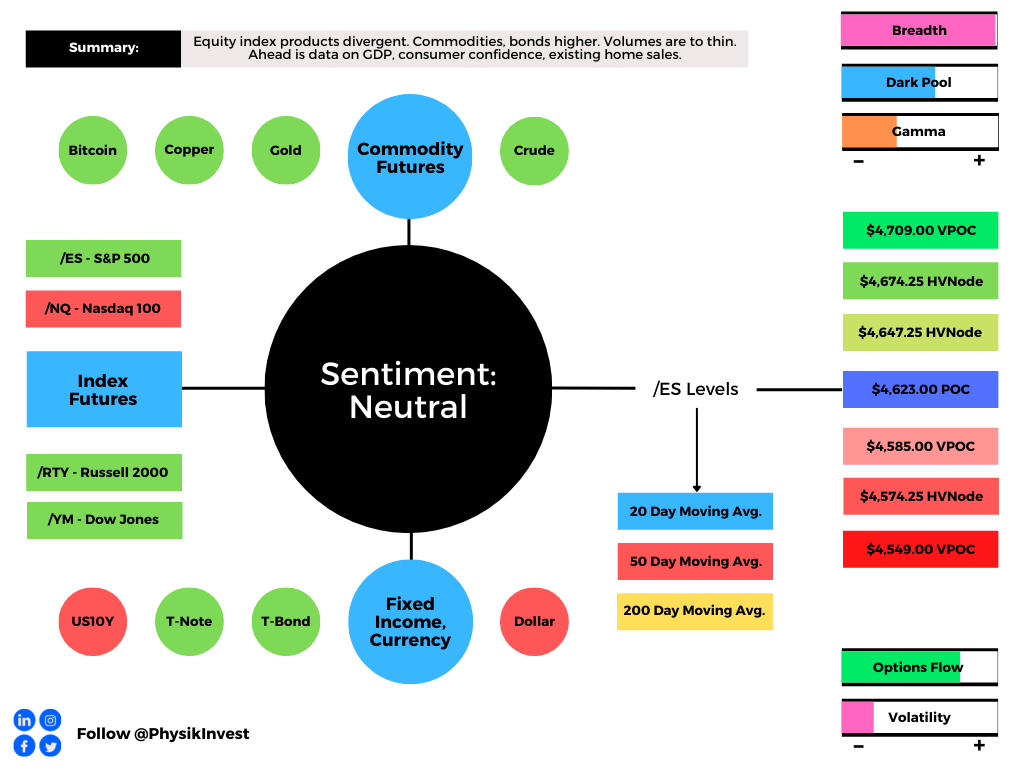
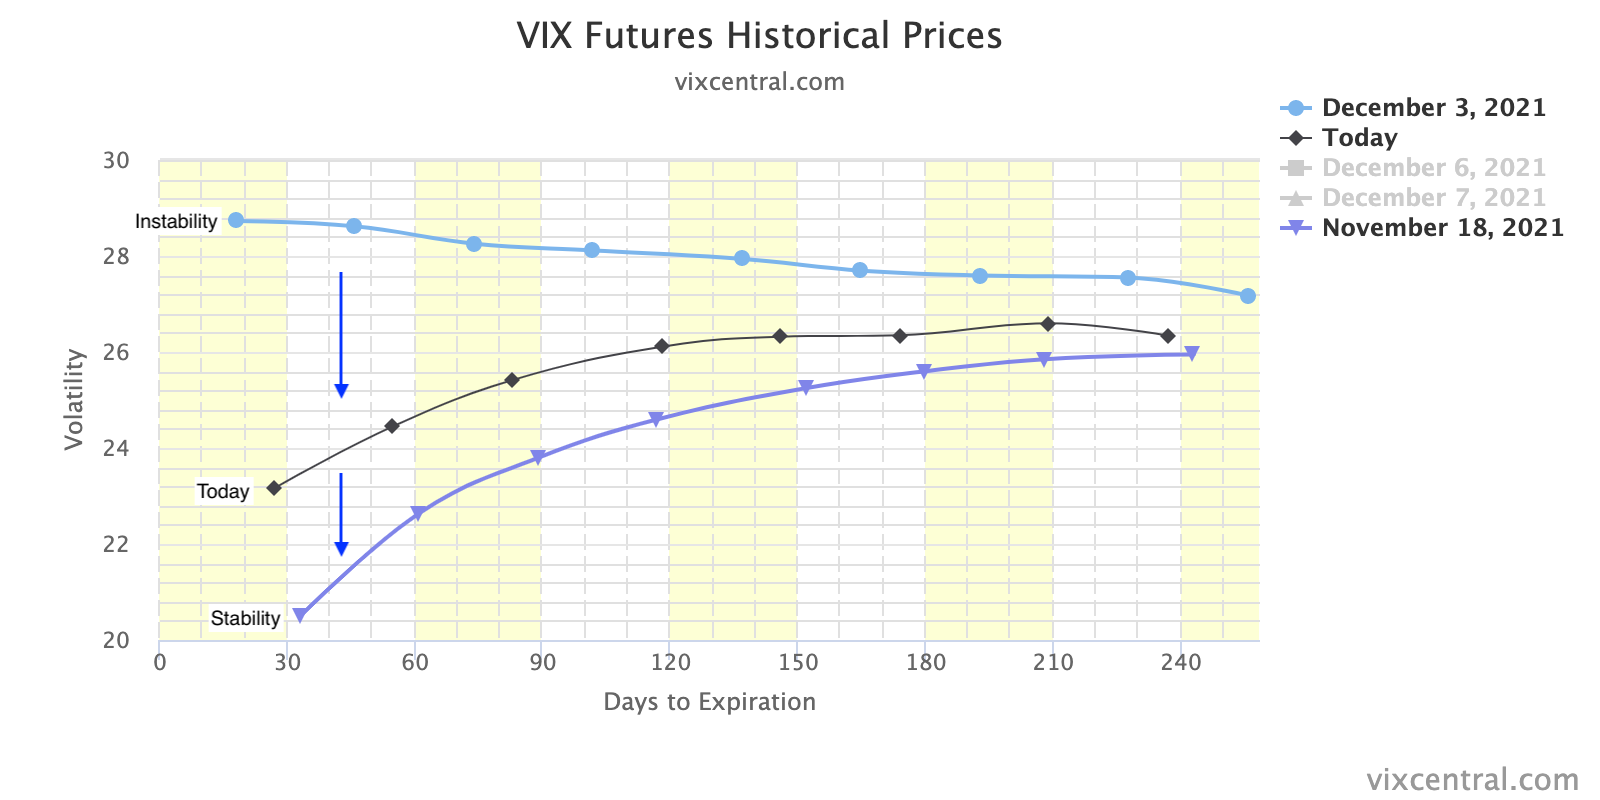
Overnight, equity index futures diverged from commodity and bond products. Measures of implied volatility showed signs of bottoming. The dollar continued a plunge.
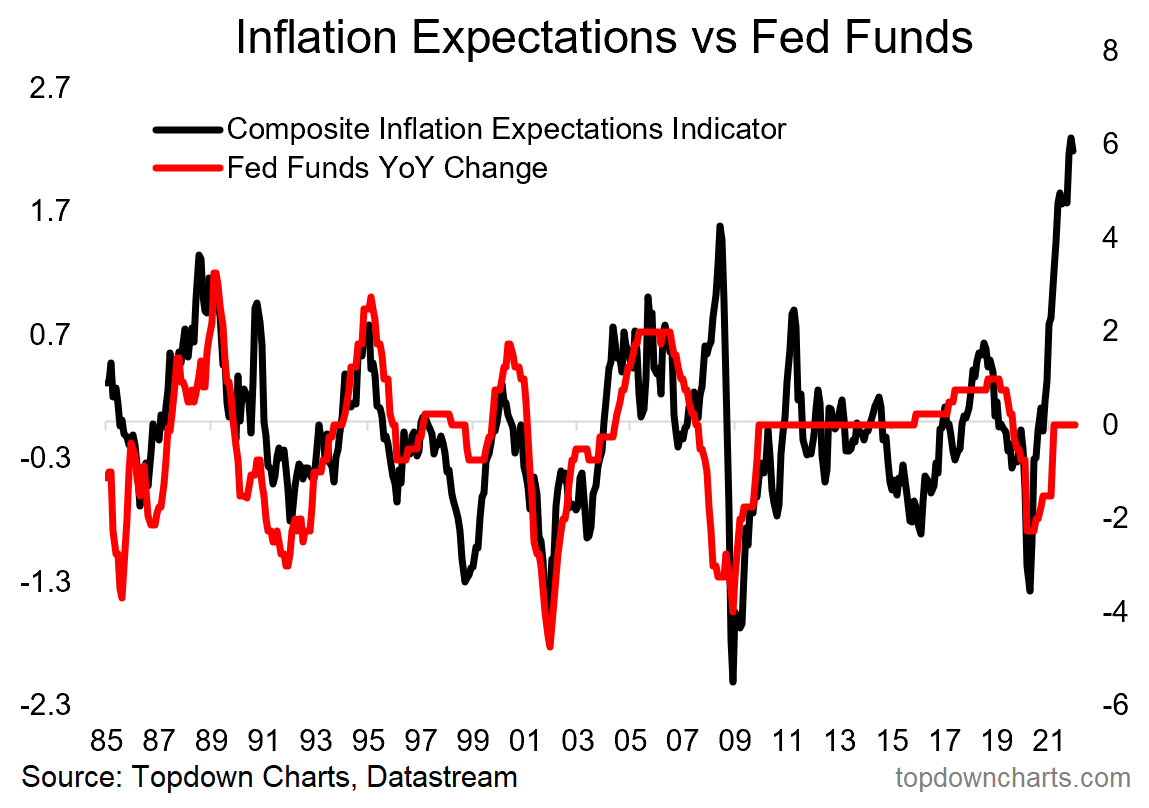
Overall, the stance is neutral as the “hottest U.S. inflation in 39 years sets up March rate liftoff.”
Ahead is data on jobless claims and producer prices (8:30 AM ET). The Federal Reserve’s Lael Brainard will have a confirmation hearing (10:00 AM ET), Tom Barkin will speak later (12:00 PM ET), with Charles Evans speaking last (1:00 PM ET).

What To Expect
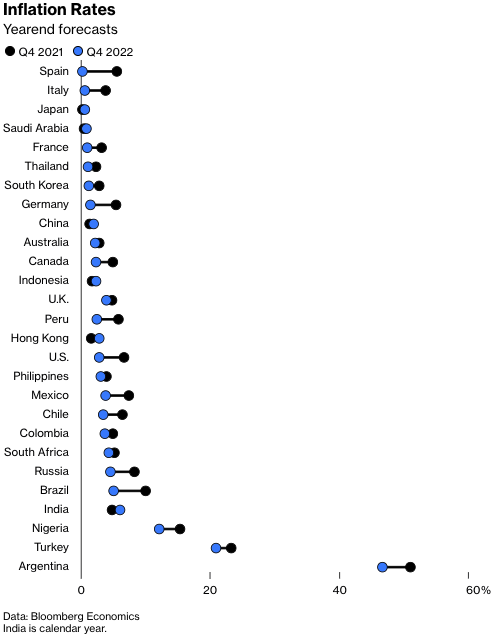
Fundamental: The consumer price index printed 7%, rising 0.5% from November.
Much of the increases were attributed to shelter, used vehicles, and food.
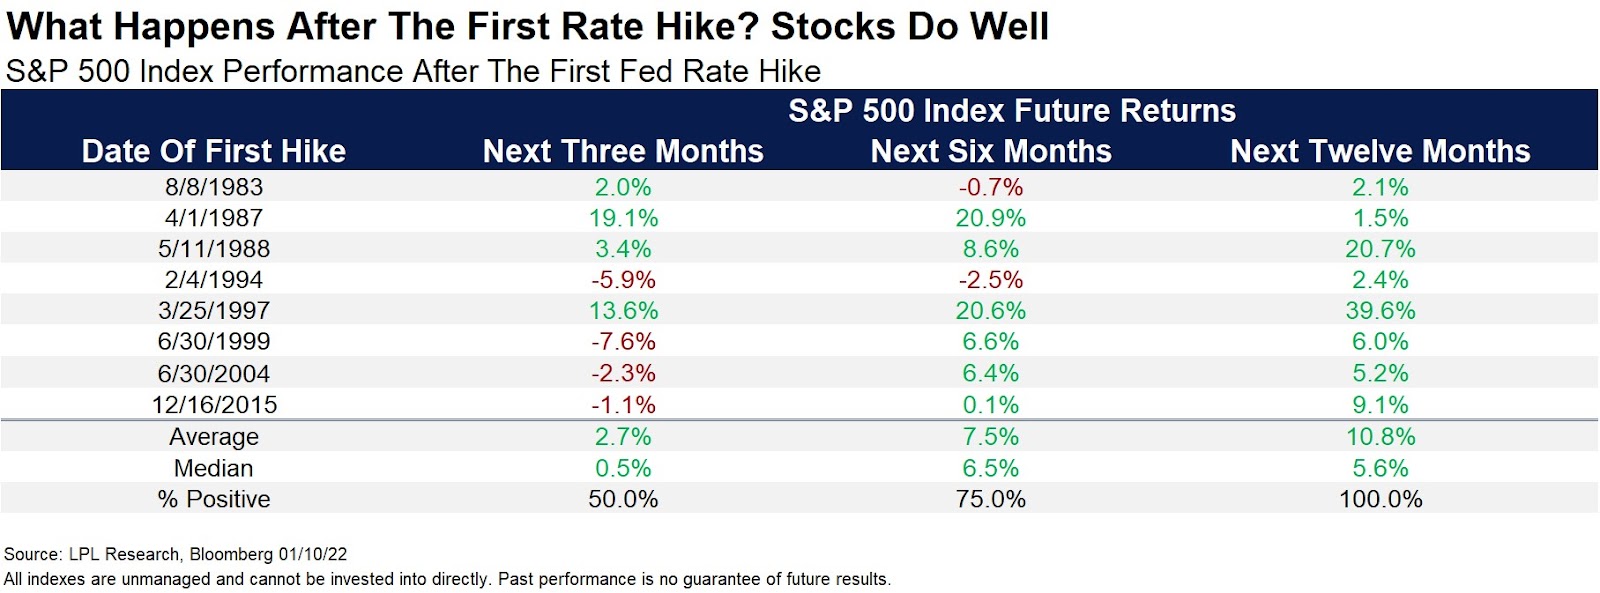
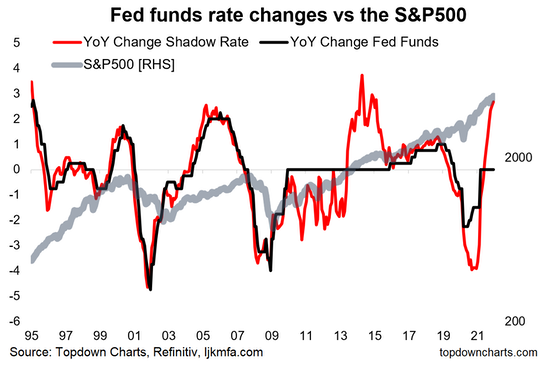
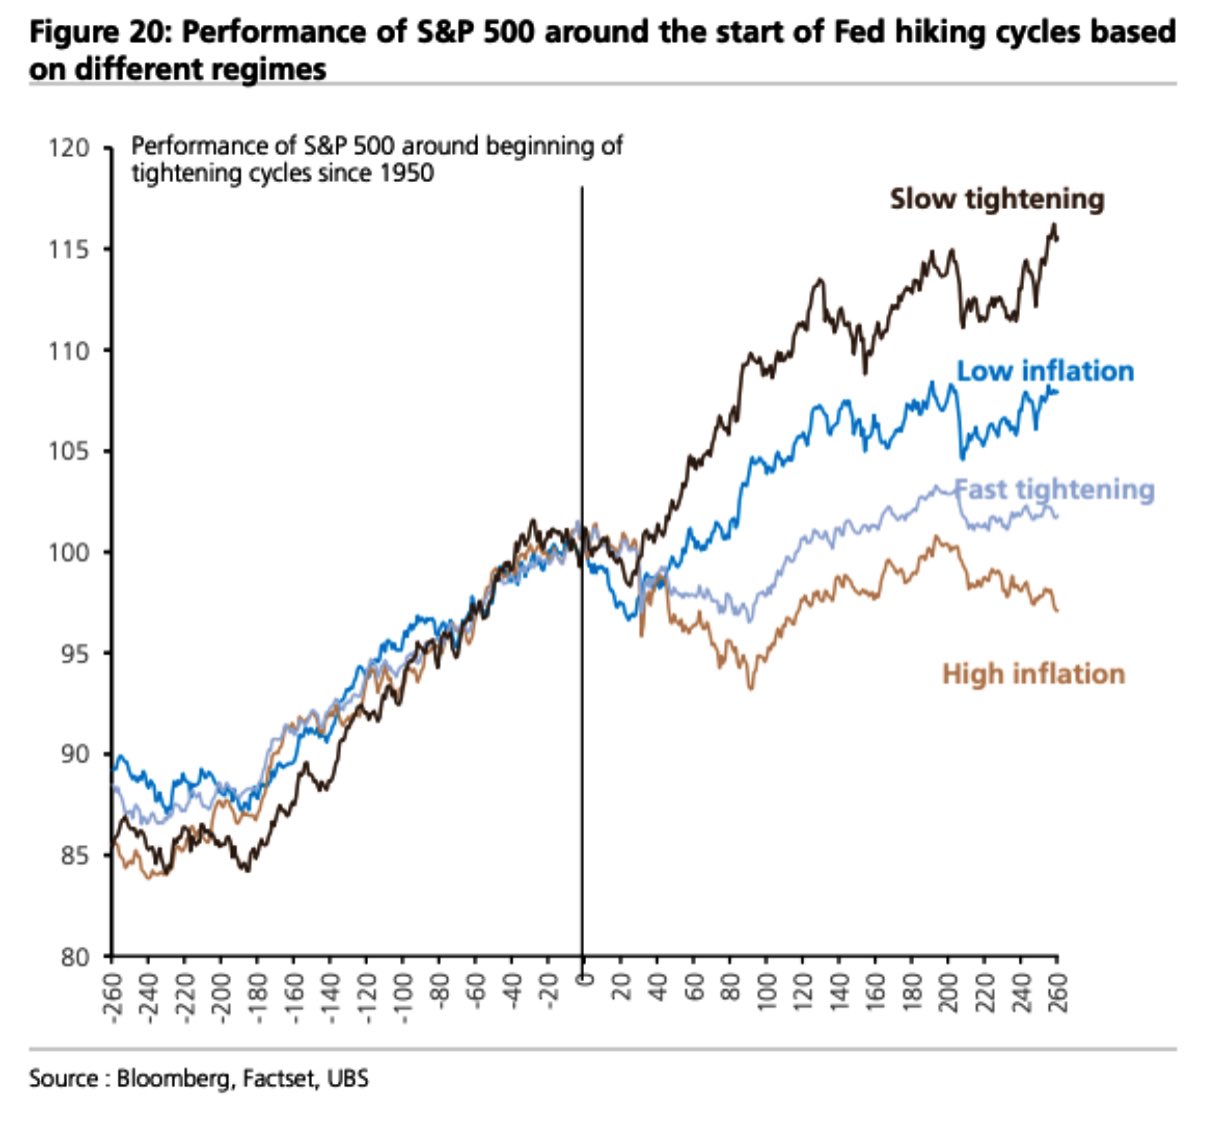
With unemployment falling and inflation proving stubborn, monetary policymakers have been emboldened to tighten, raising rates in March and (later) shrinking the balance sheet.
“In terms of where the Fed is on their dual mandate — inflation and the labor market — they’re basically there,” Michael Gapen, chief U.S. economist at Barclays Plc (NYSE: BCS), said on Bloomberg Television. “I don’t really think anything stops them going in March except one of these kind of outlier events. I think they’re ready.”
Market reaction was muted, mostly, with commodities bearing the brunt of the bullishness.
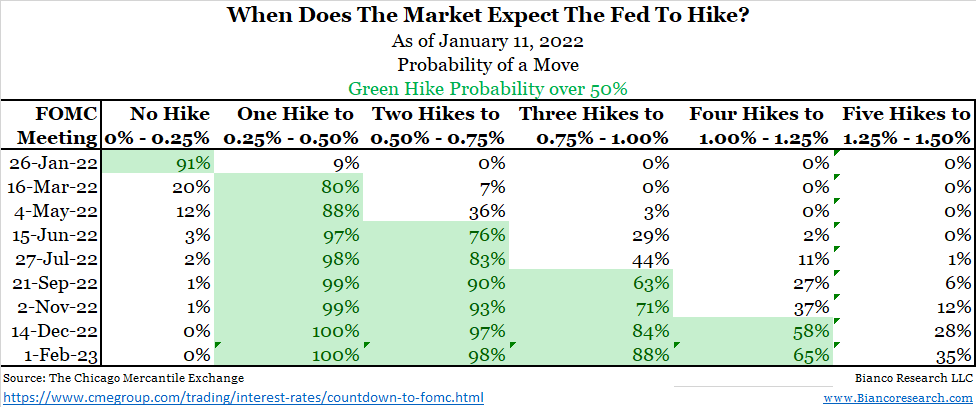
The calm reaction in equities, ahead of the earnings season, and bonds “showed that there was nothing particularly surprising in the [CPI] report, and that traders were confident that prices already covered the risks,” Bloomberg’s John Authers explained.
“Fed funds futures barely budged, leaving a first rate hike in March almost fully priced. As they did before these numbers came out, dealers feel certain that the Fed will hike at least three times this year, while a fourth in December is seen as a 50-50 call.”
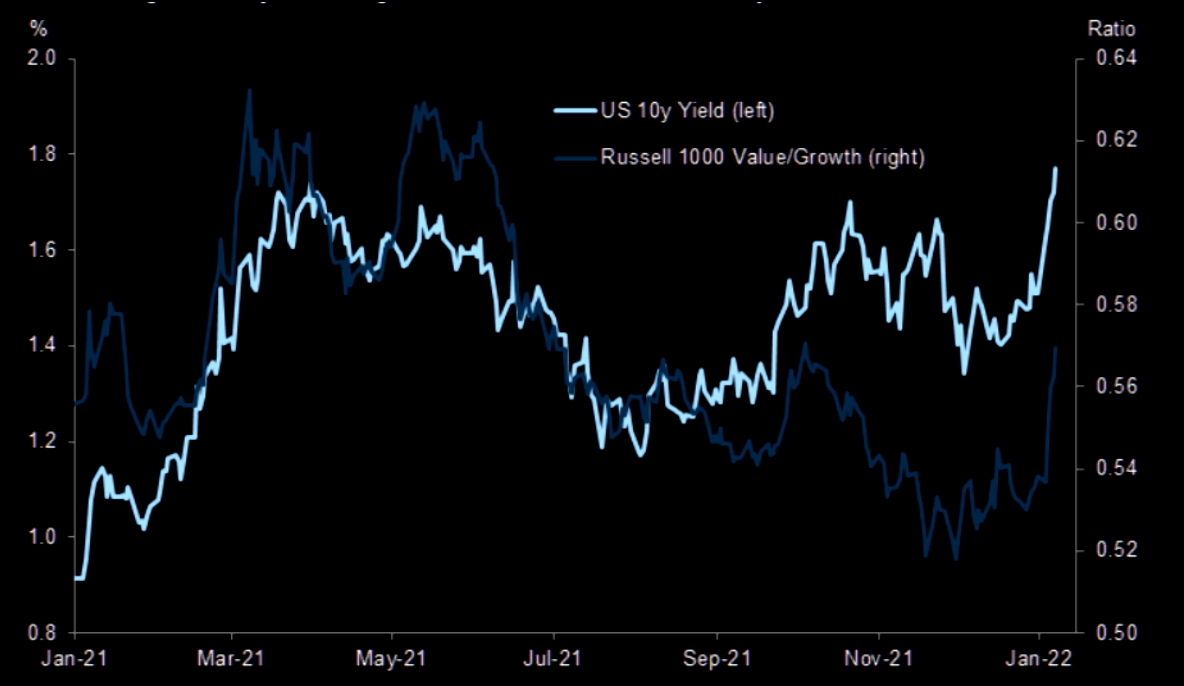
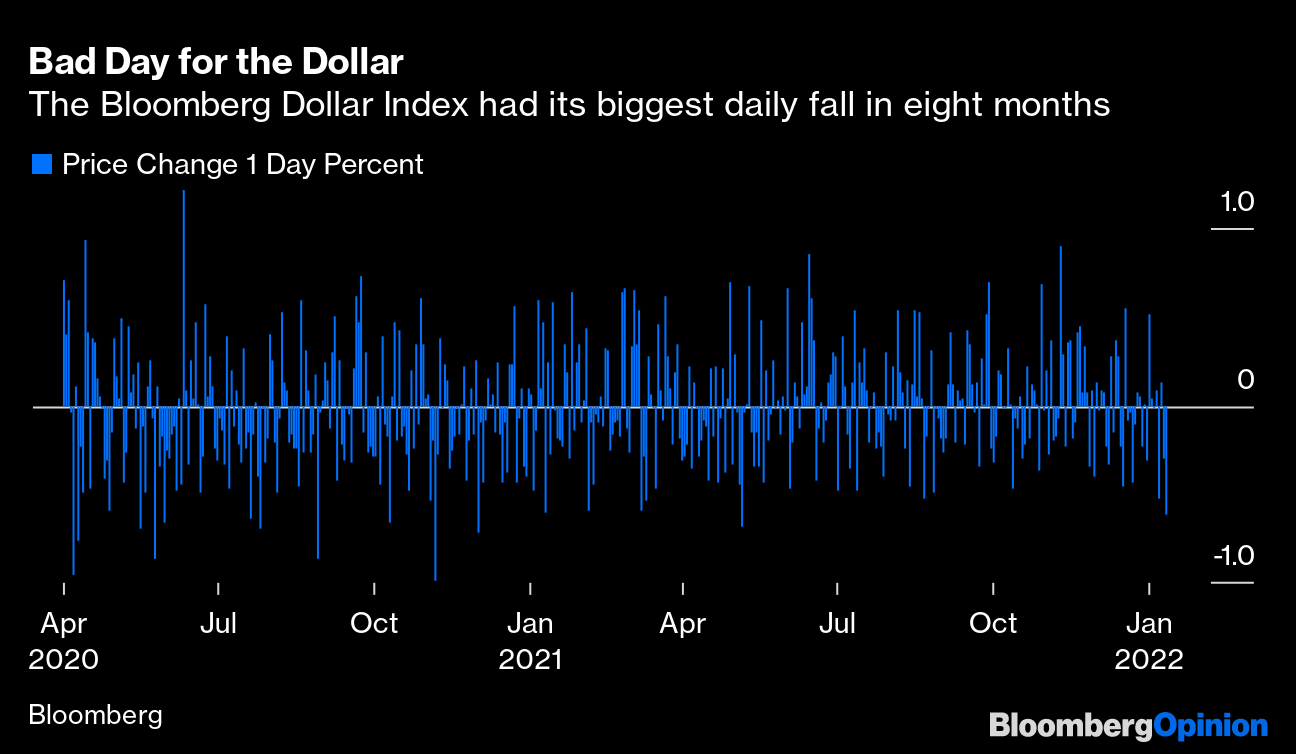
As an aside, there was a big drop in the dollar. In raising rates, currencies ought to attract money. Right?
“[T]he combination of another really bad inflation number and an insouciant bond market response has been enough to knock the dollar off course. Many factors drive currencies, but this is consistent with a view that the rate hikes already priced in, and supporting the dollar until now, won’t be enough to head off inflation.”
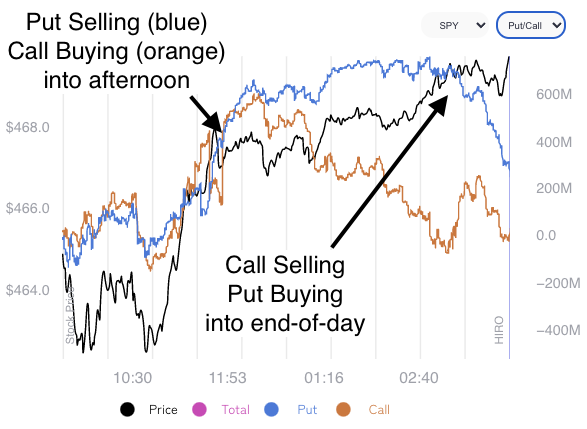
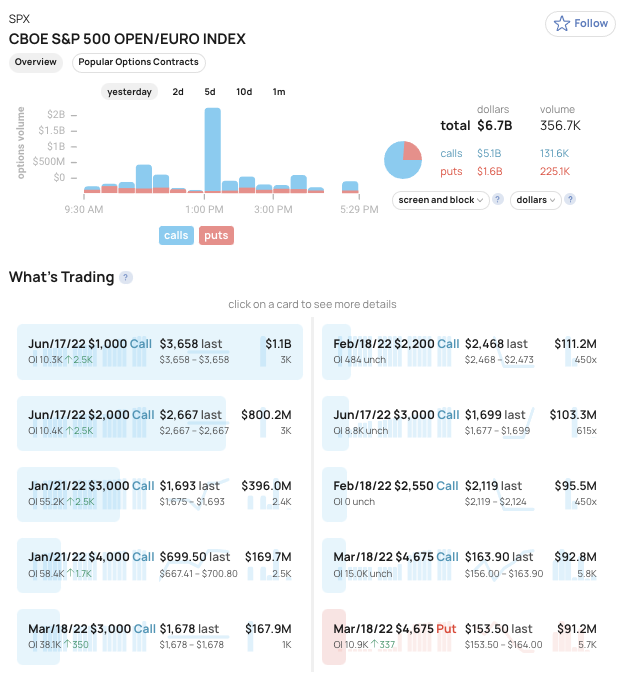
Positioning: On January 7, this commentary suggested metrics of options positioning, versus buying pressure (measured via short sales or liquidity provision on the market-making side) were positively skewed, even more so than before.
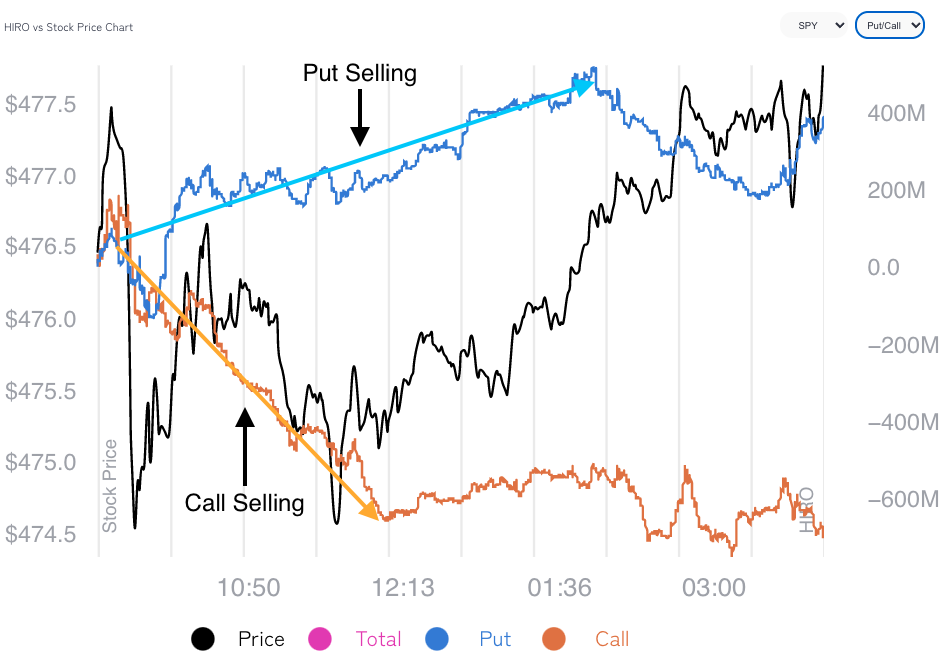
What followed was upside resolve, exacerbated in part by the compression in volatility and unwind of hedges to destabilizing customer options activity (i.e., put buying and call selling).
What now?
Scott Rubner of Goldman Sachs Group Inc (NYSE: GS) had the following to say.
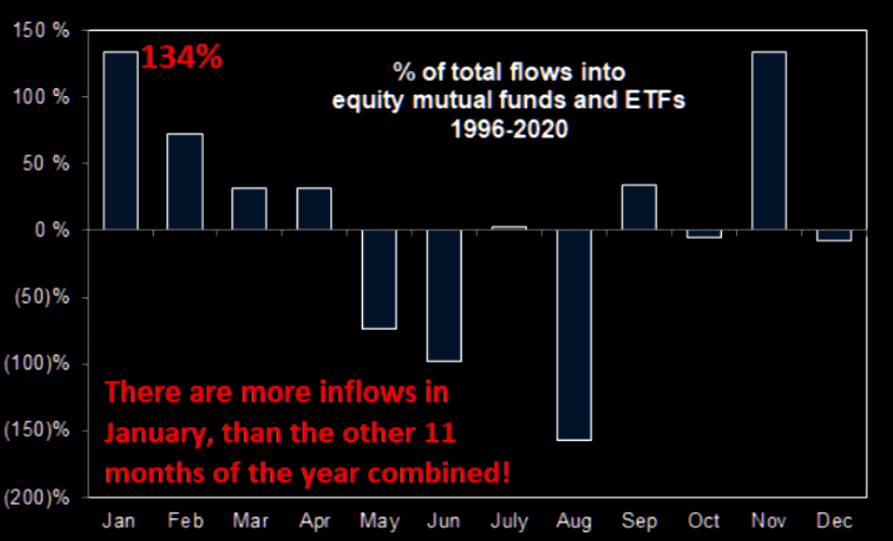
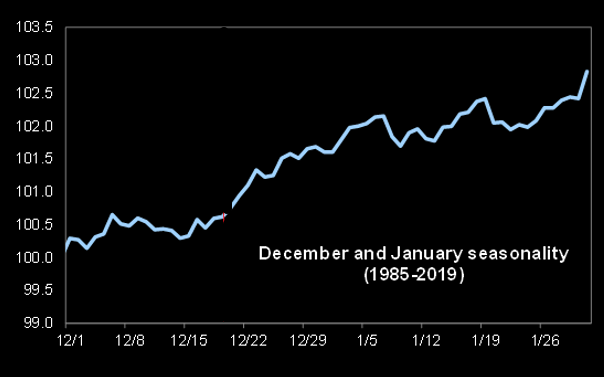
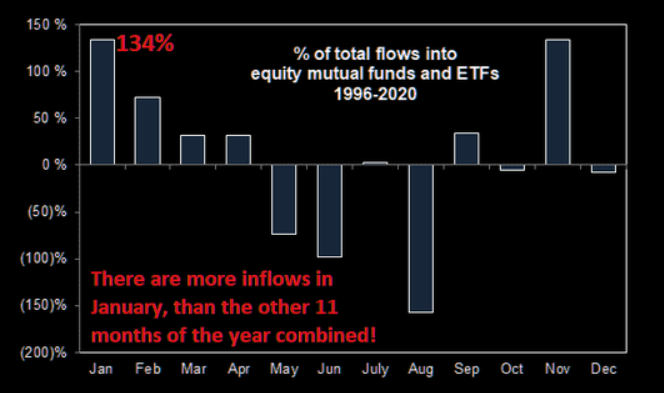
“I am in the process of writing flow-of-funds note for February. My gut tells me to be bearish in February for when the ‘January Inflows’ run out. However, I just re-ran the CURRENT SET-UP for January and the conditions are not in place for a larger correction (>5%). Said another way, I want to be bearish, but this is the consensus. Investors are short, hedges are too big, everyone has on the puts, sentiment is negative (lowest in 86 weeks), I think everyone is already looking for the correction, and this may shift into buying dip alpha.”
So, what does all that mean?
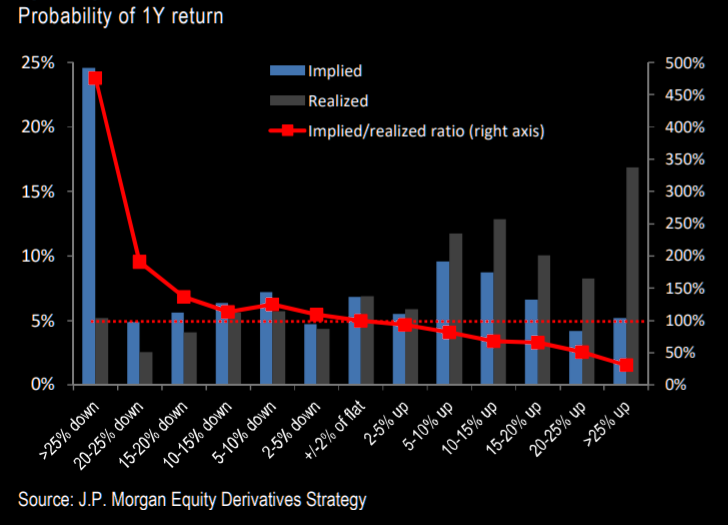
Demand for downside protection, as already touched on, coincided with customers indirectly taking liquidity and destabilizing the market as the participant short the put sold underlying to neutralize risk.
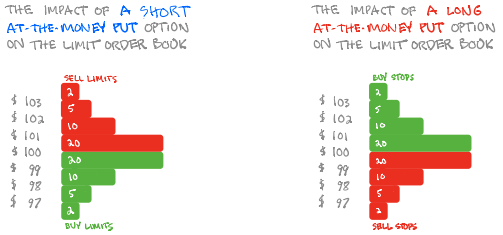
Expansion in implied volatility increases the directional exposure of that protection.
This is good for put buyers and bad for put sellers, simply put. As a result, in weakness, hedging of these contracts pressures markets further, making for violent up and down trade.
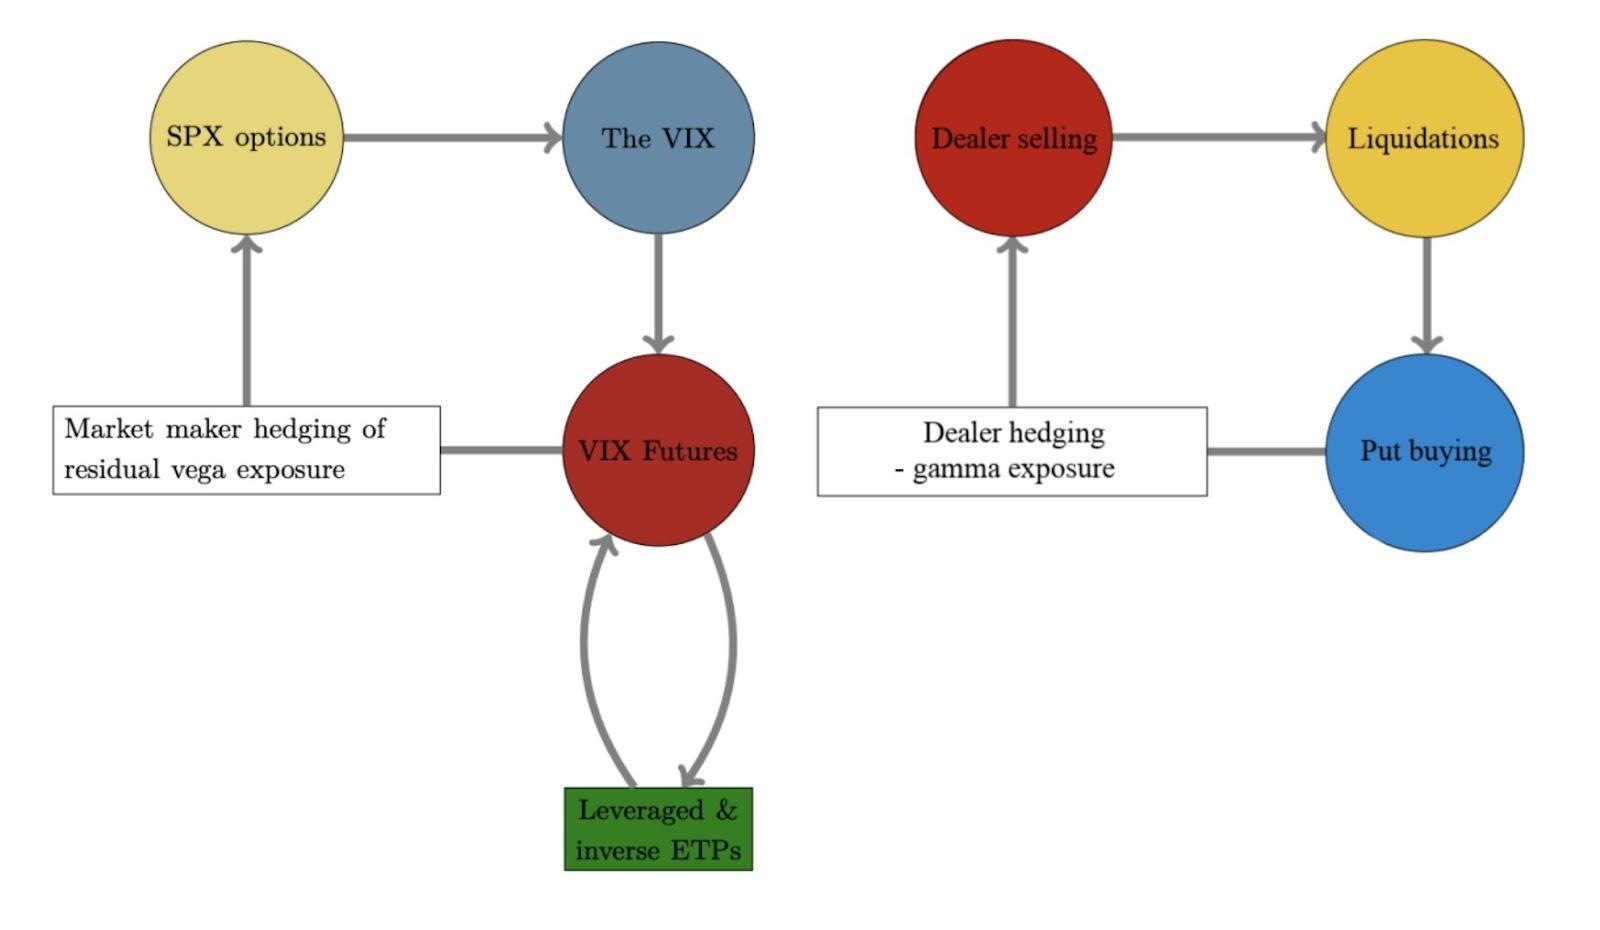
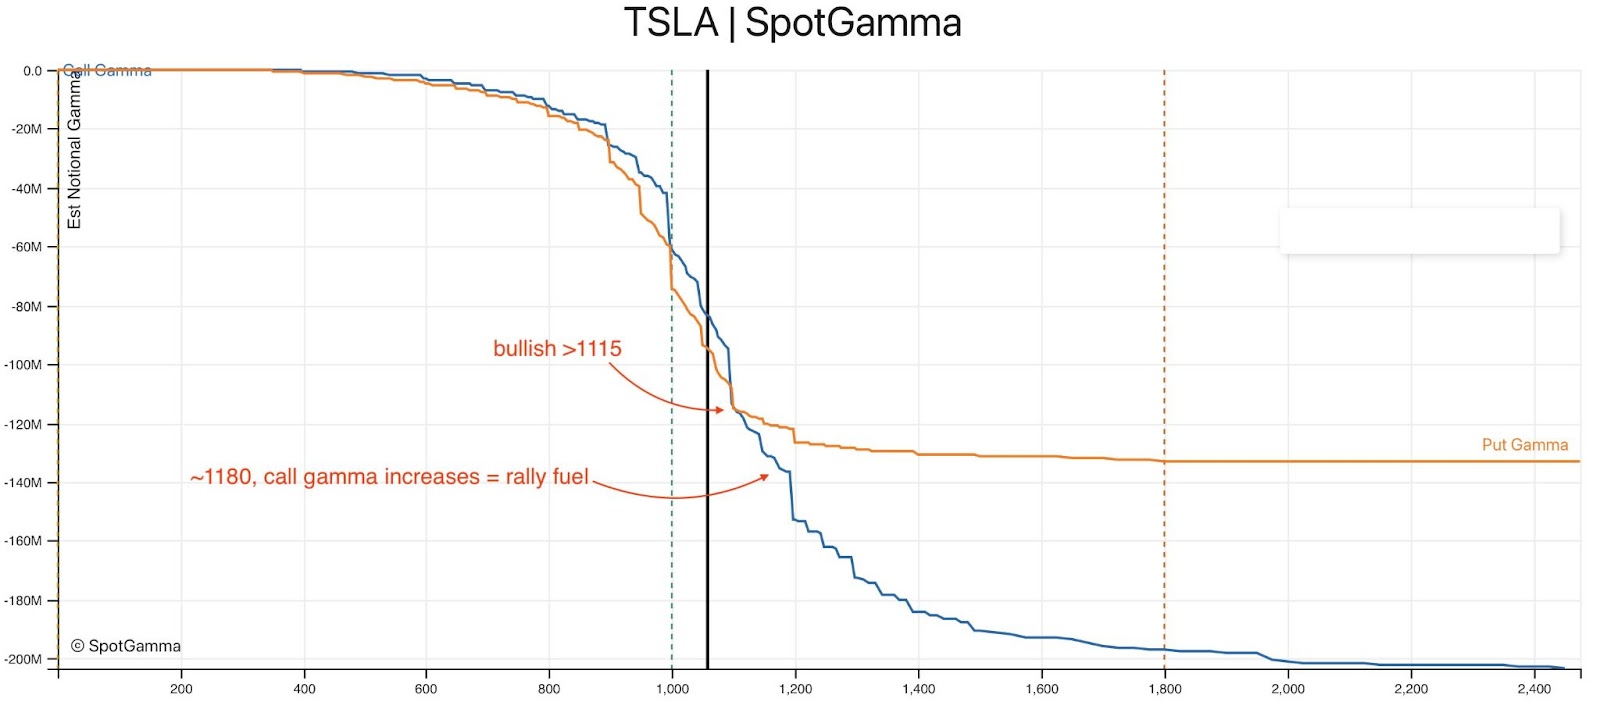
As volatility contracts, however, and underlying prices rise, the directional exposure of protection declines. This is bad for put buyers and good for put sellers. In offsetting this decline in directional risk, counterparties will unwind earlier hedges to bearish customer options activity.
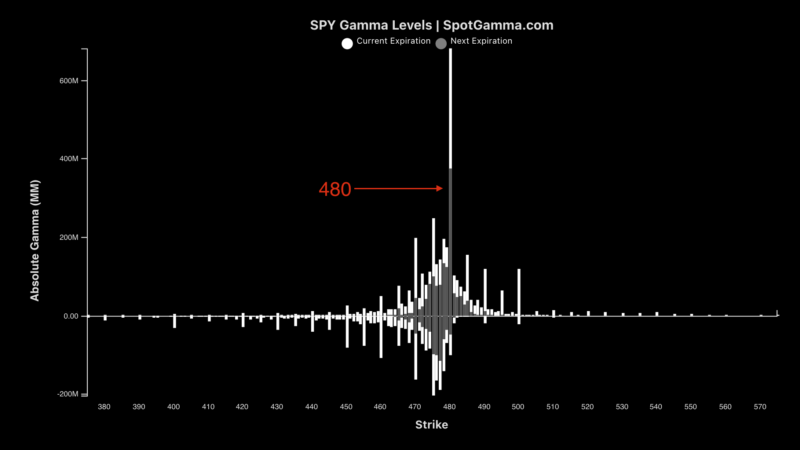
The unwind of these hedges, as SpotGamma explains, “likely invokes supportive dealer hedging flows with respect to time (‘charm’) and volatility (‘vanna’).”
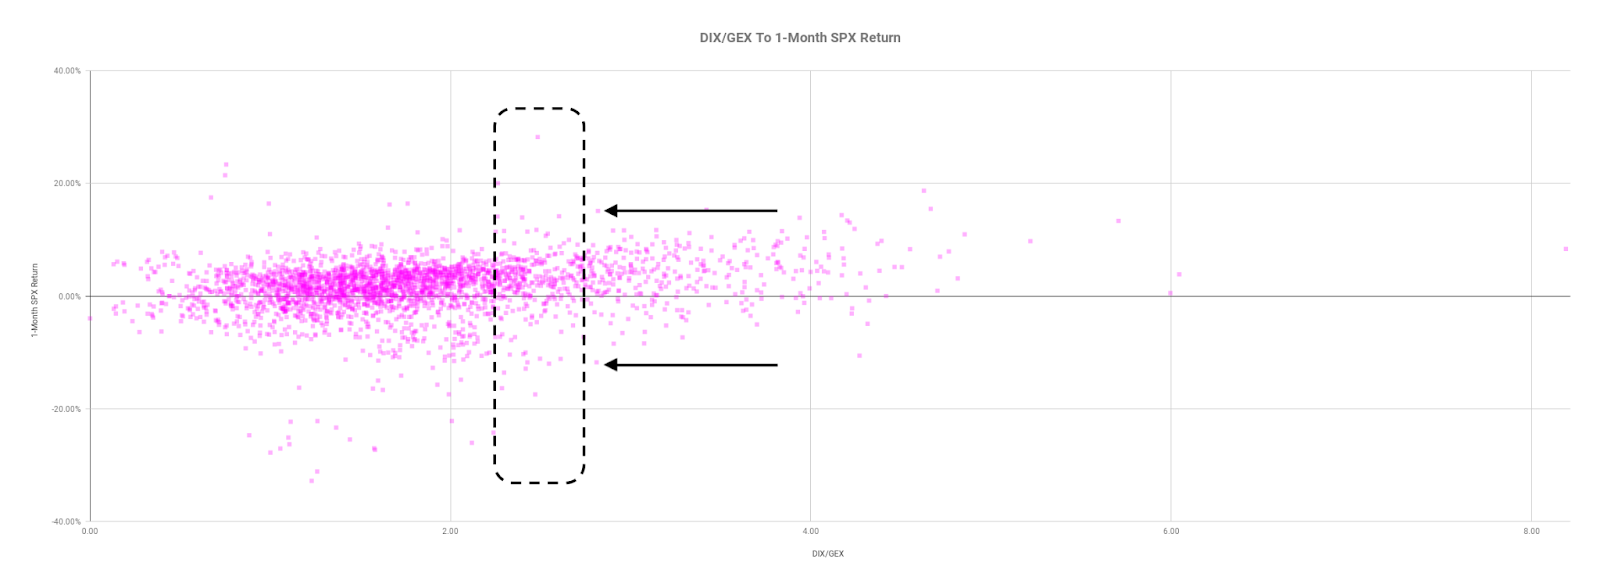
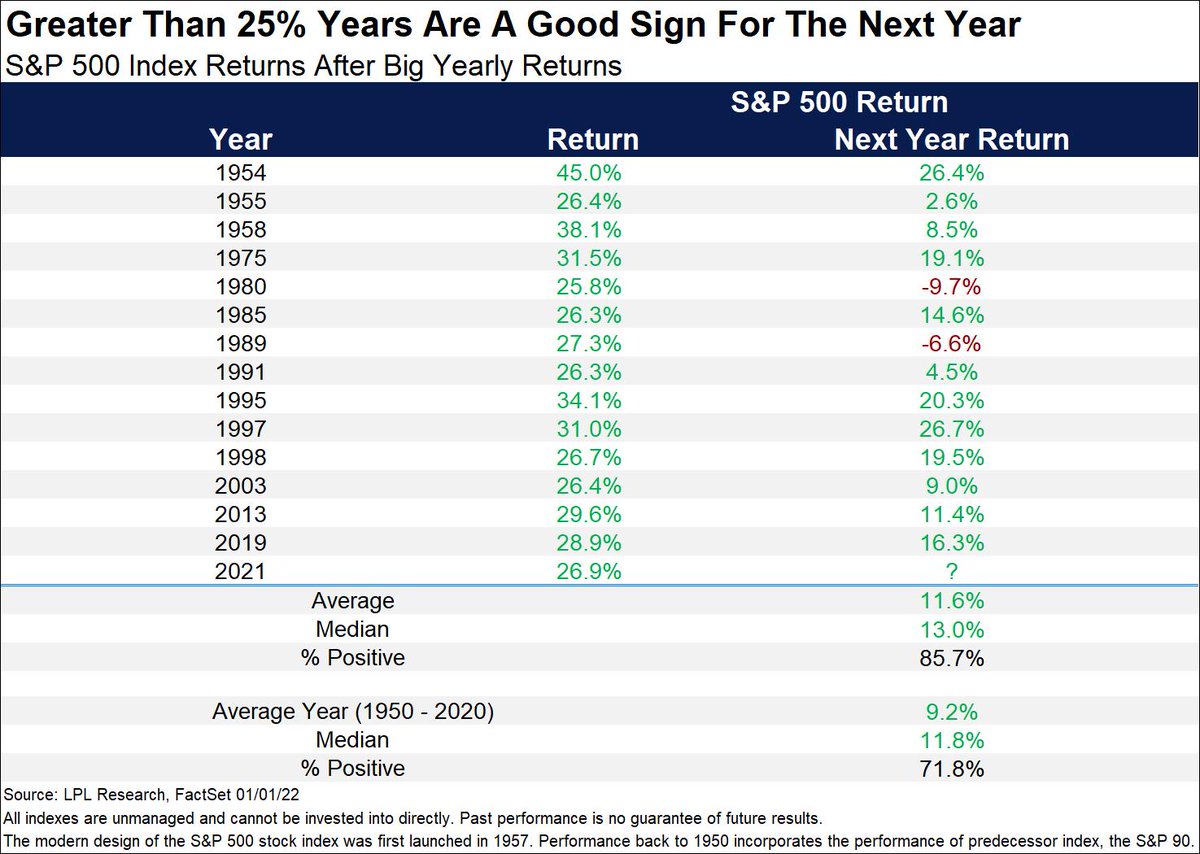
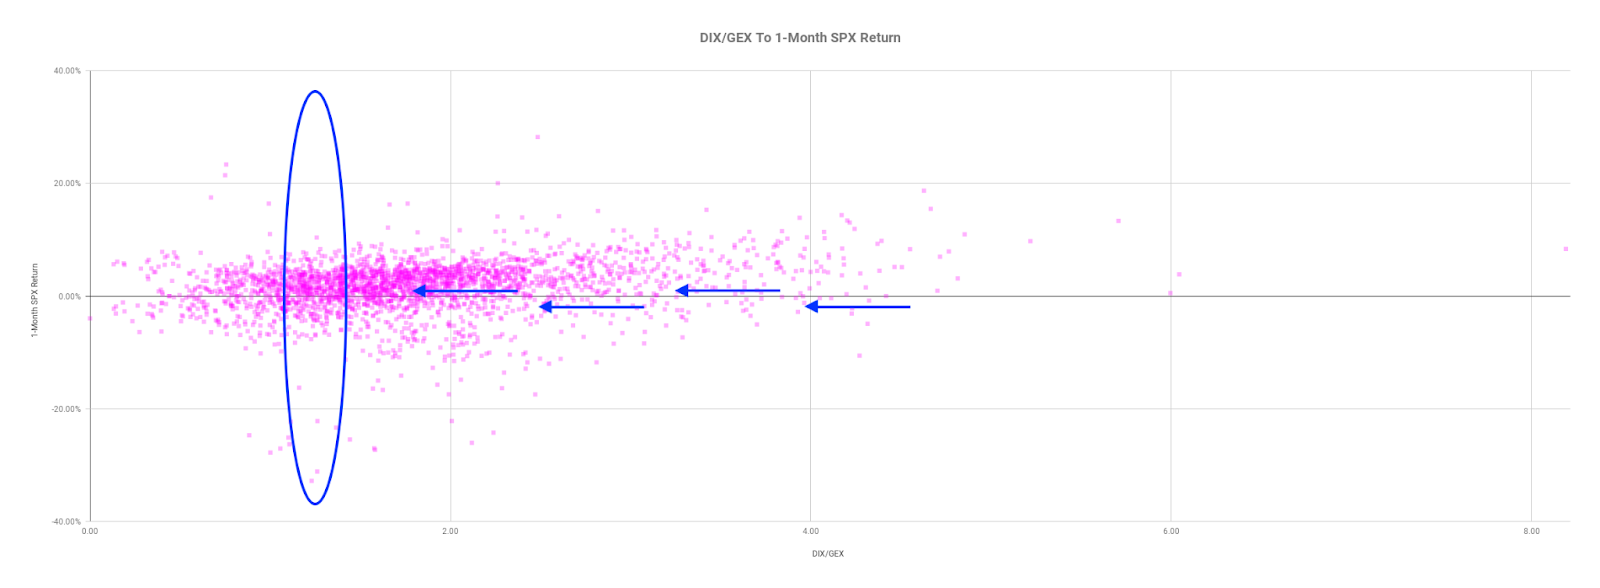
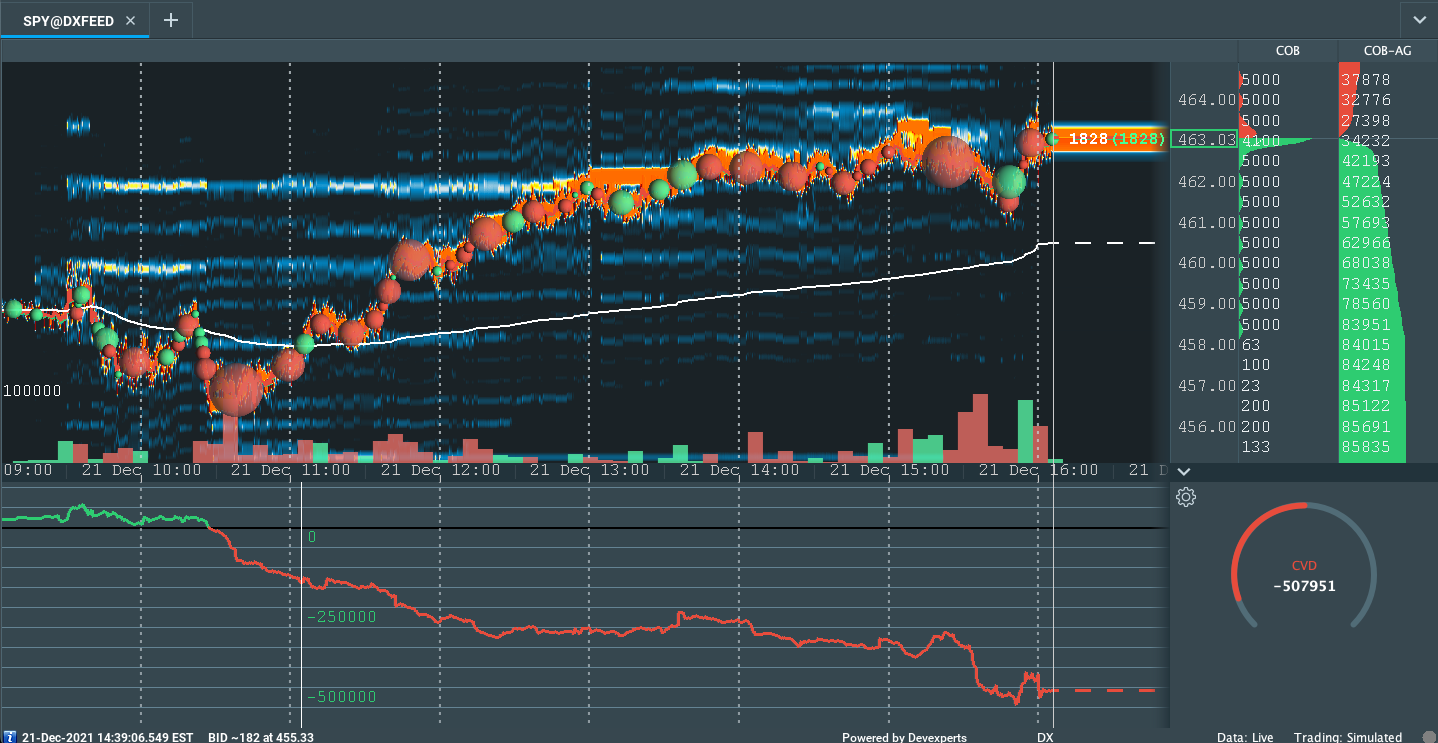
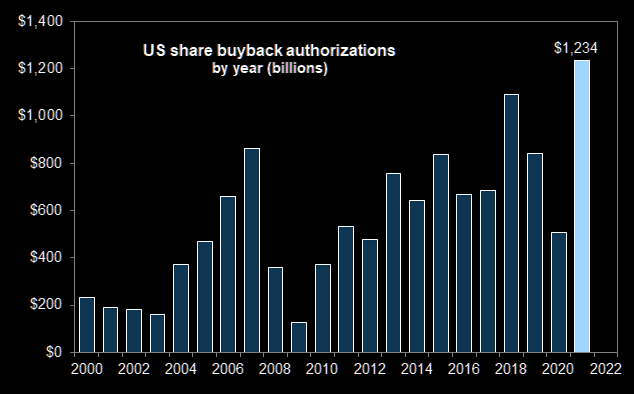
Couple this flow with strong passive buying support, as evidenced by metrics quoted elsewhere in this newsletter (e.g., DIX), the odds that markets continue to rally (or trade sideways, at least, short-term), in the face of “above-trend growth” and a record year of buybacks, as well as other things, seem good.
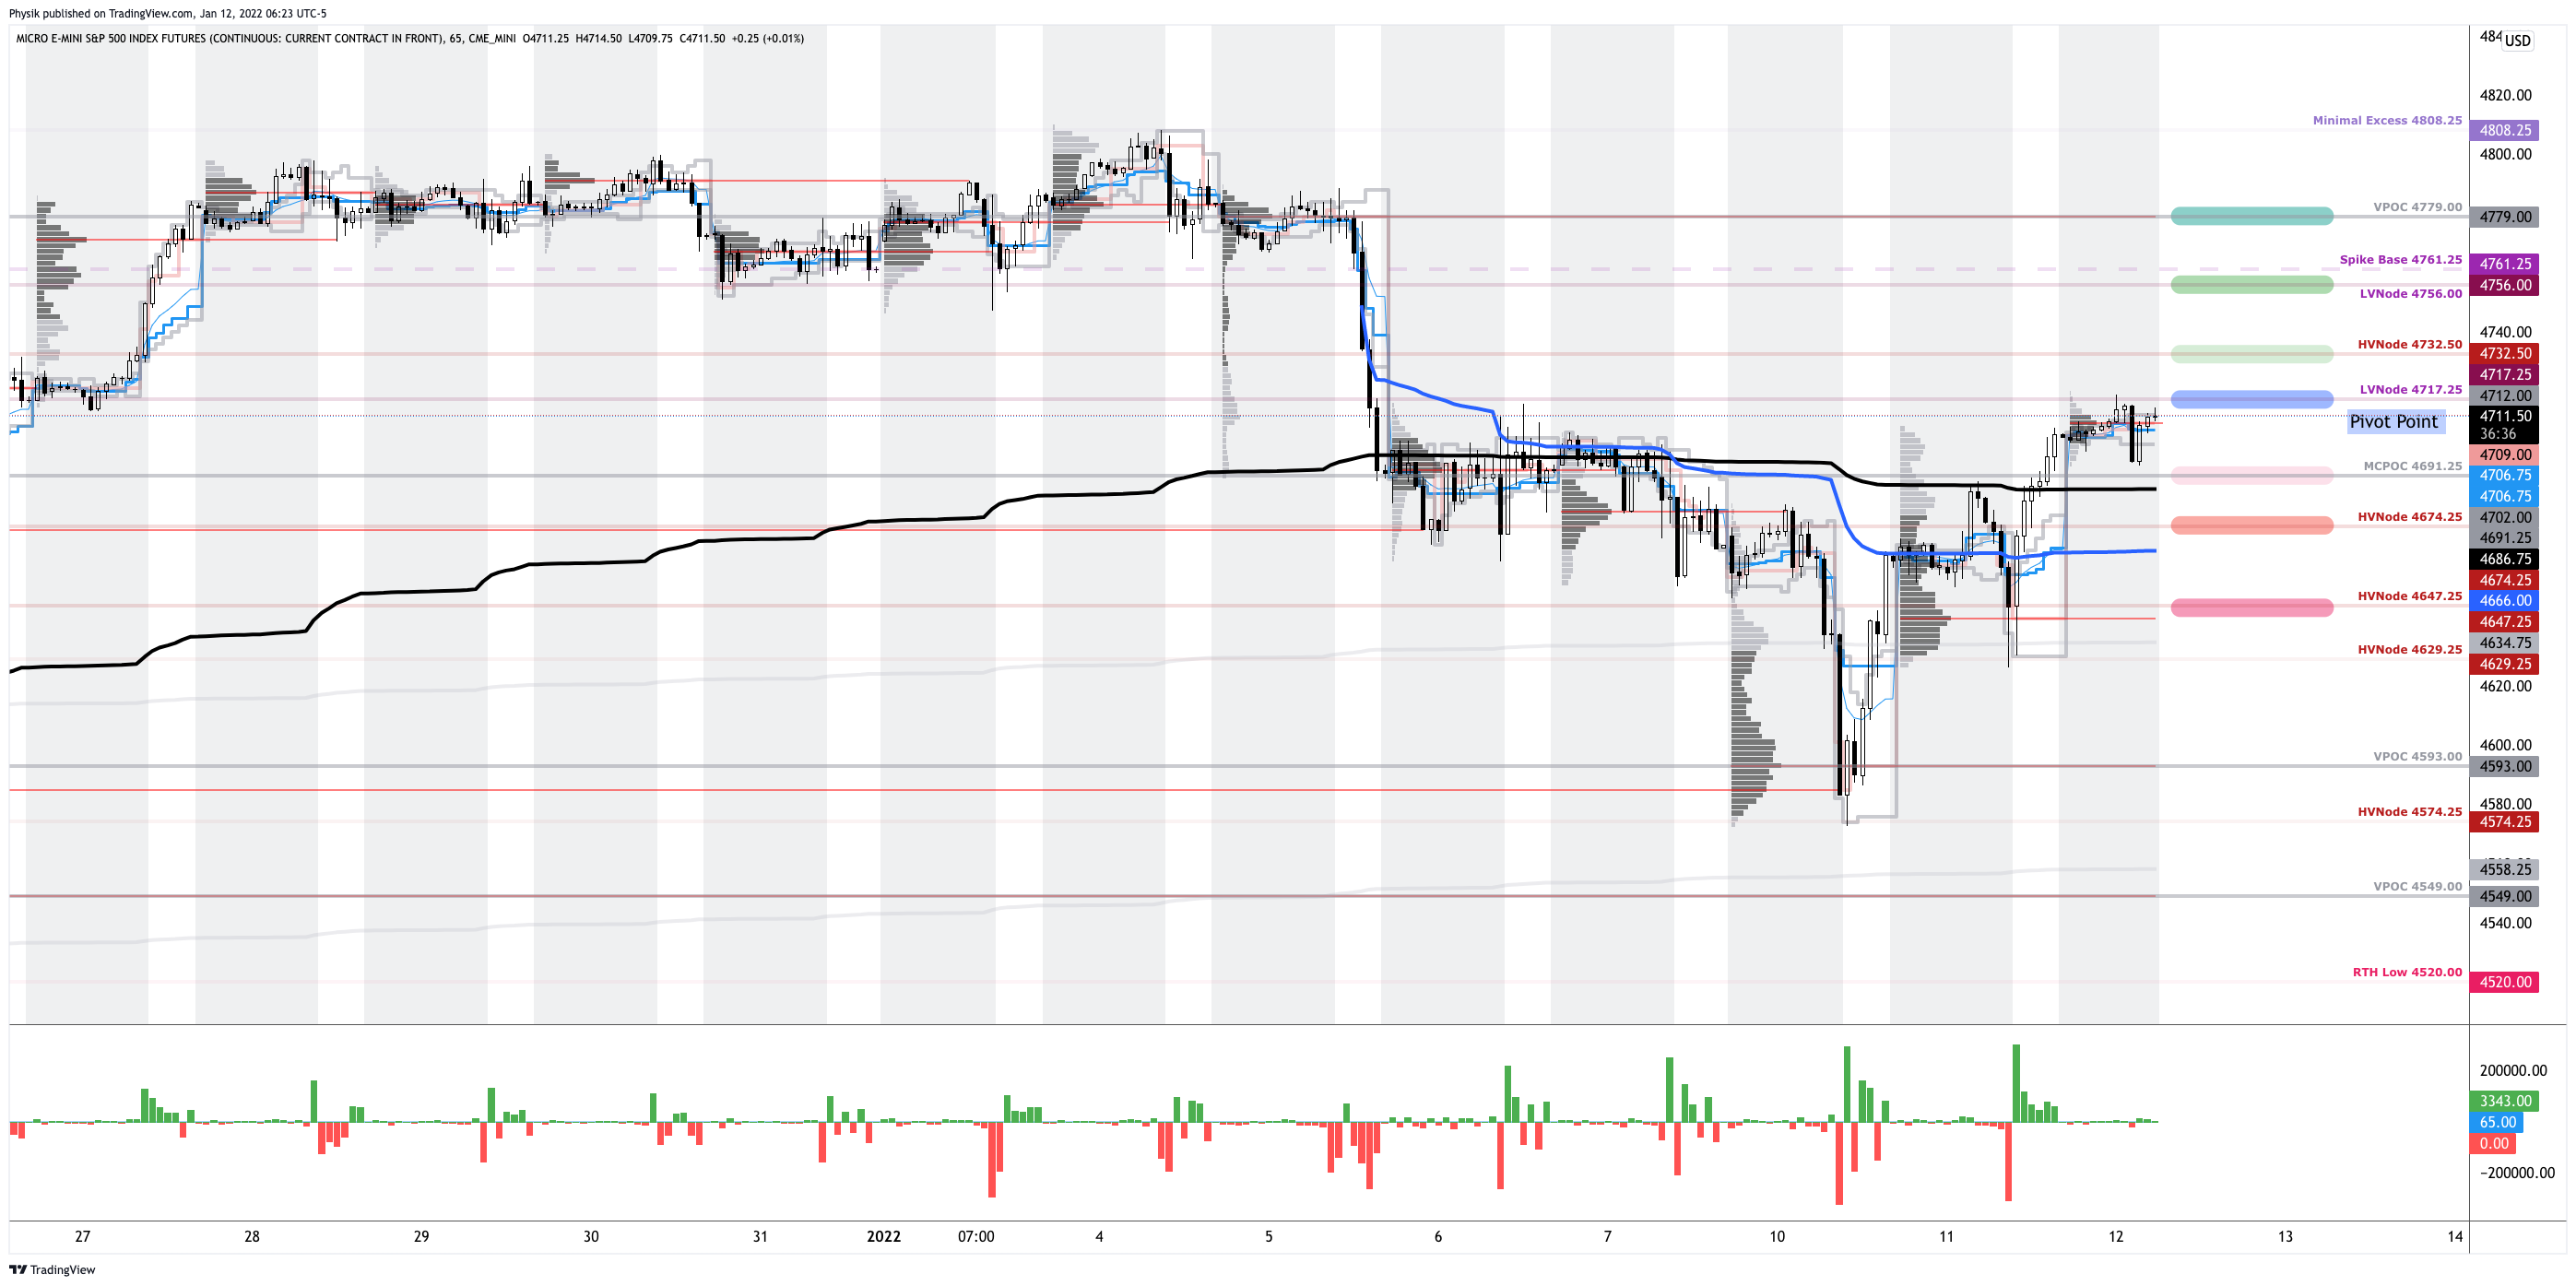
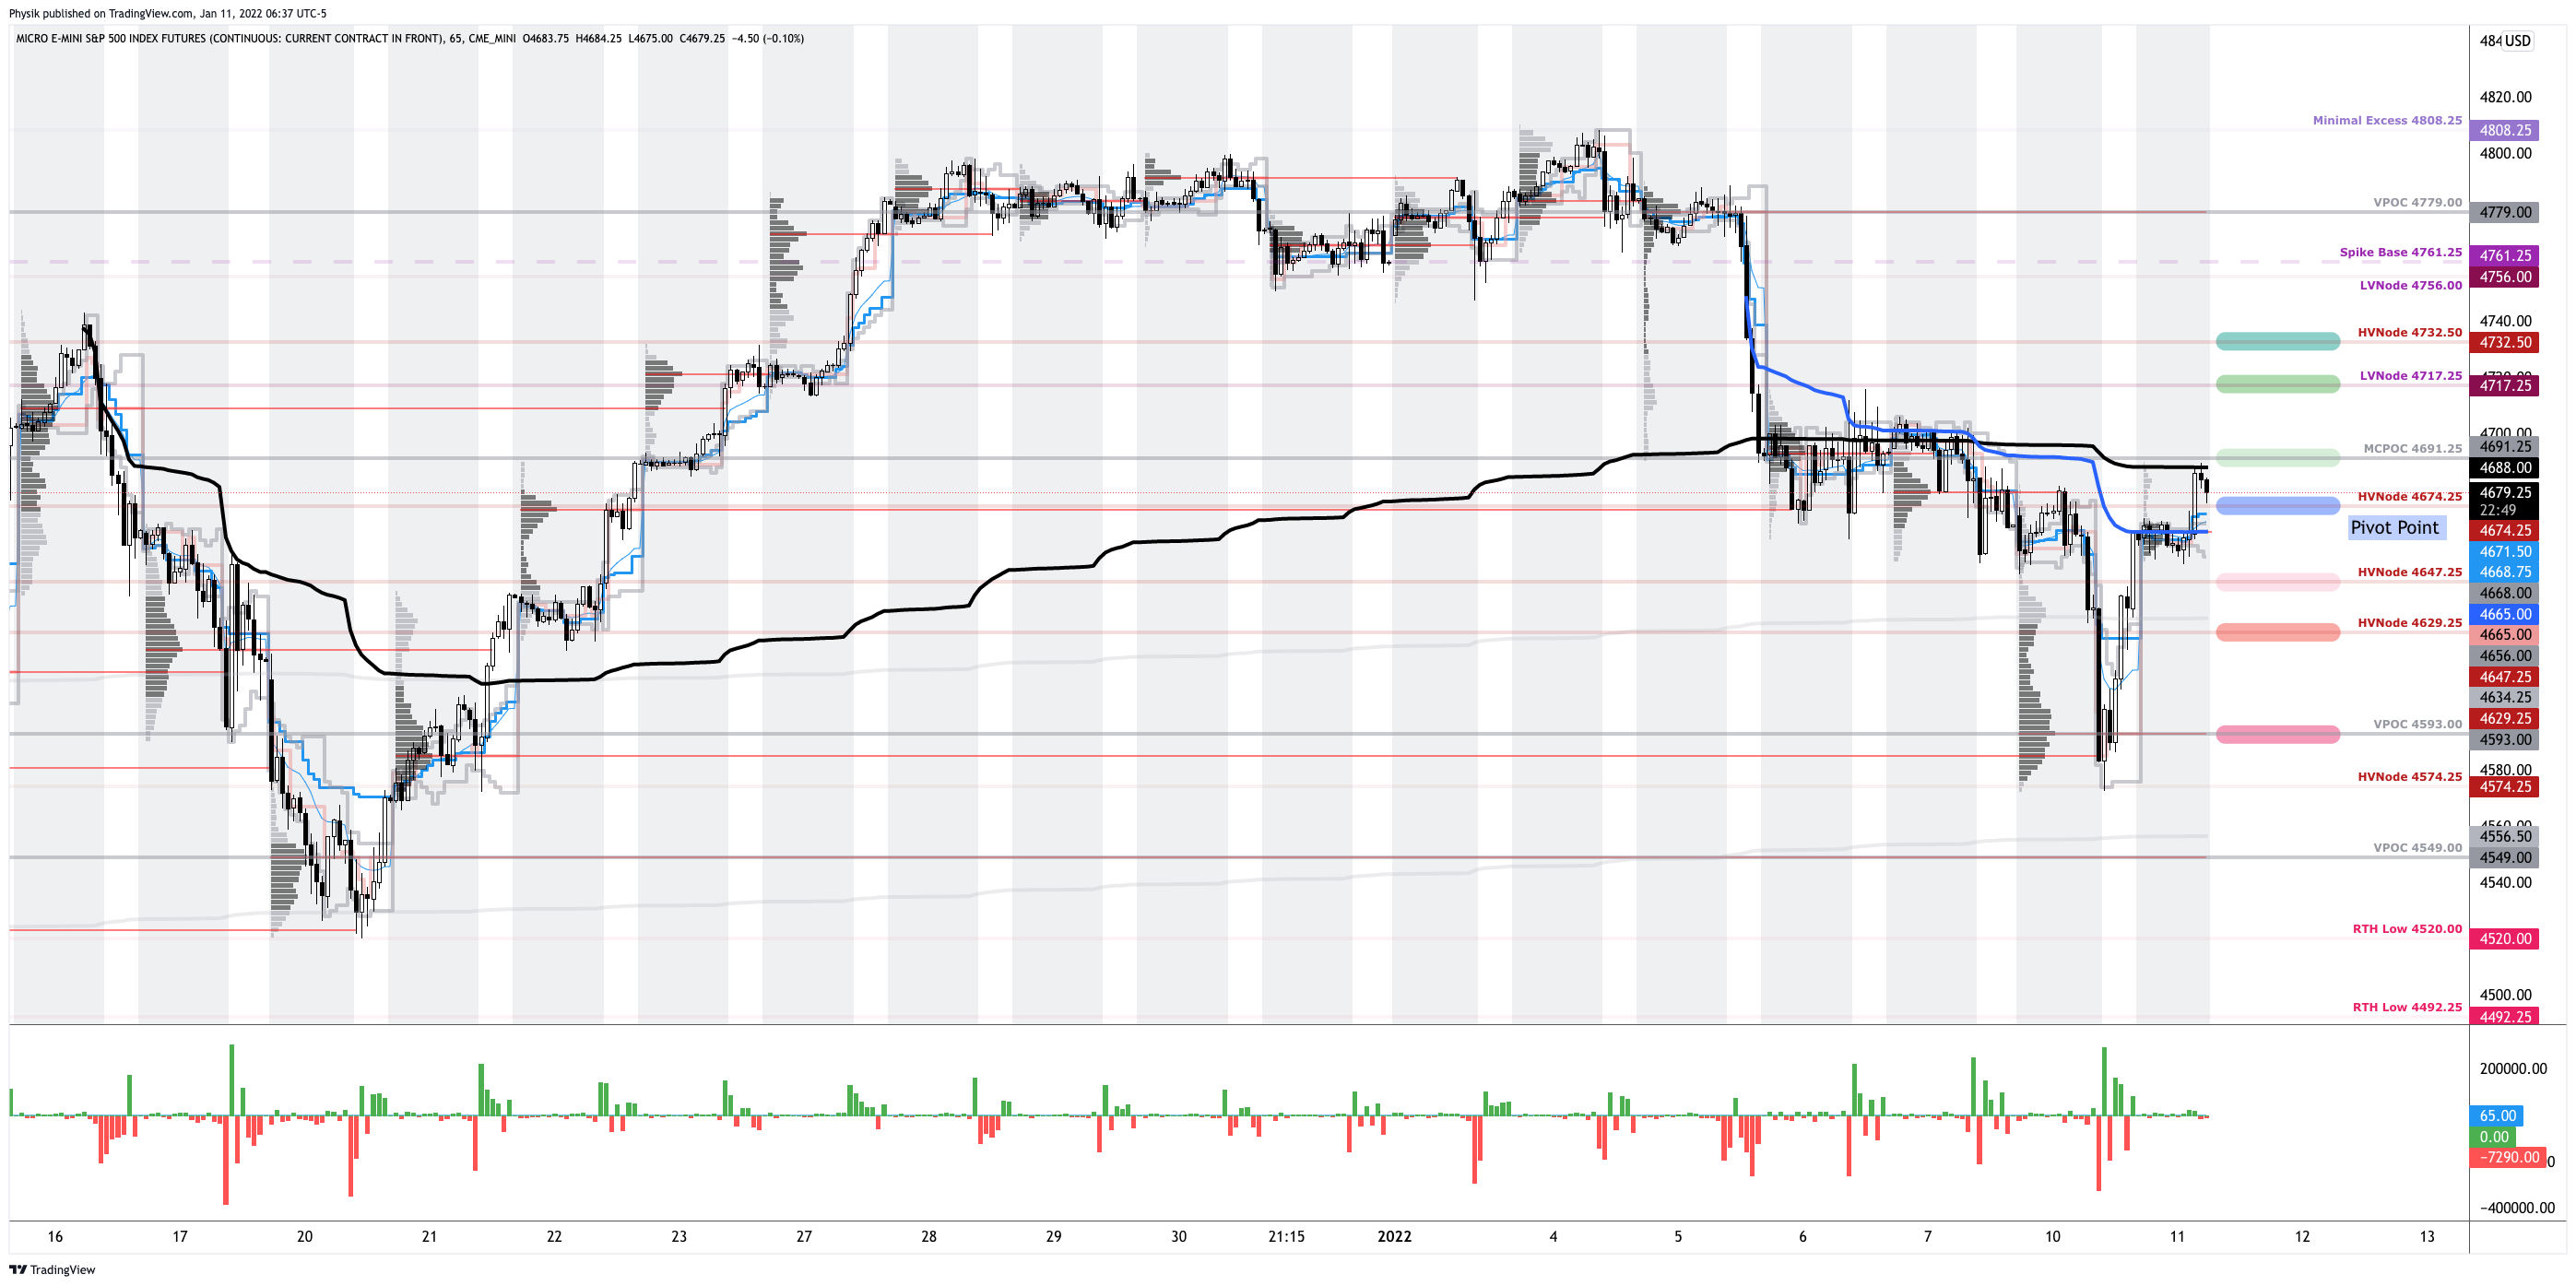
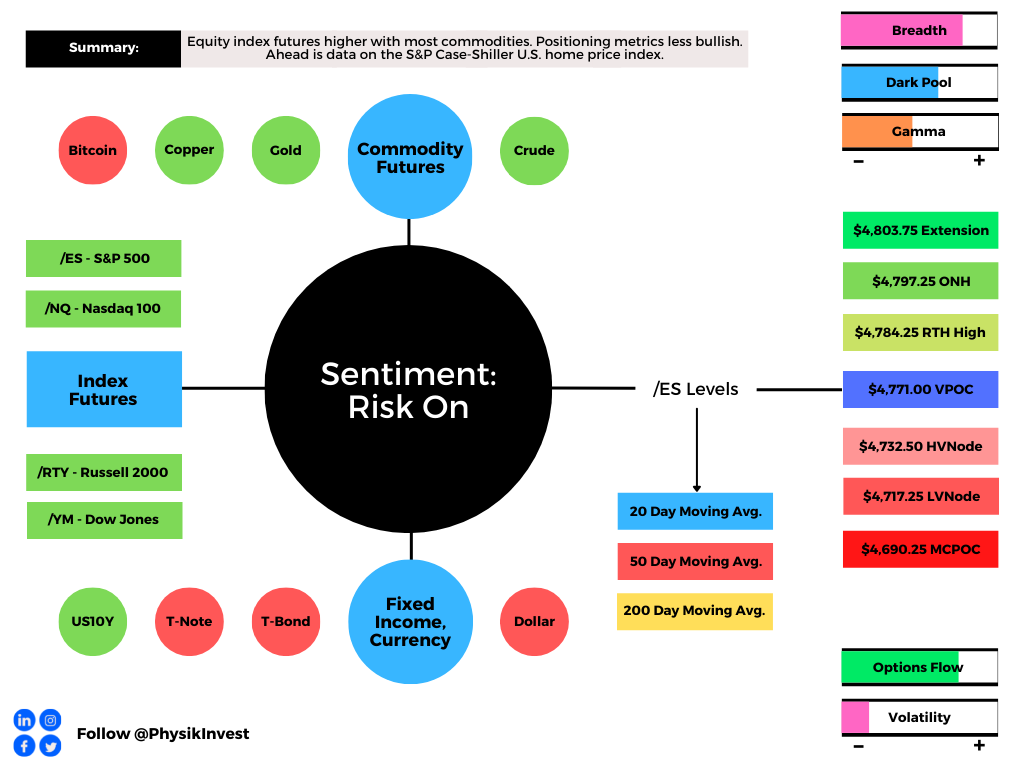
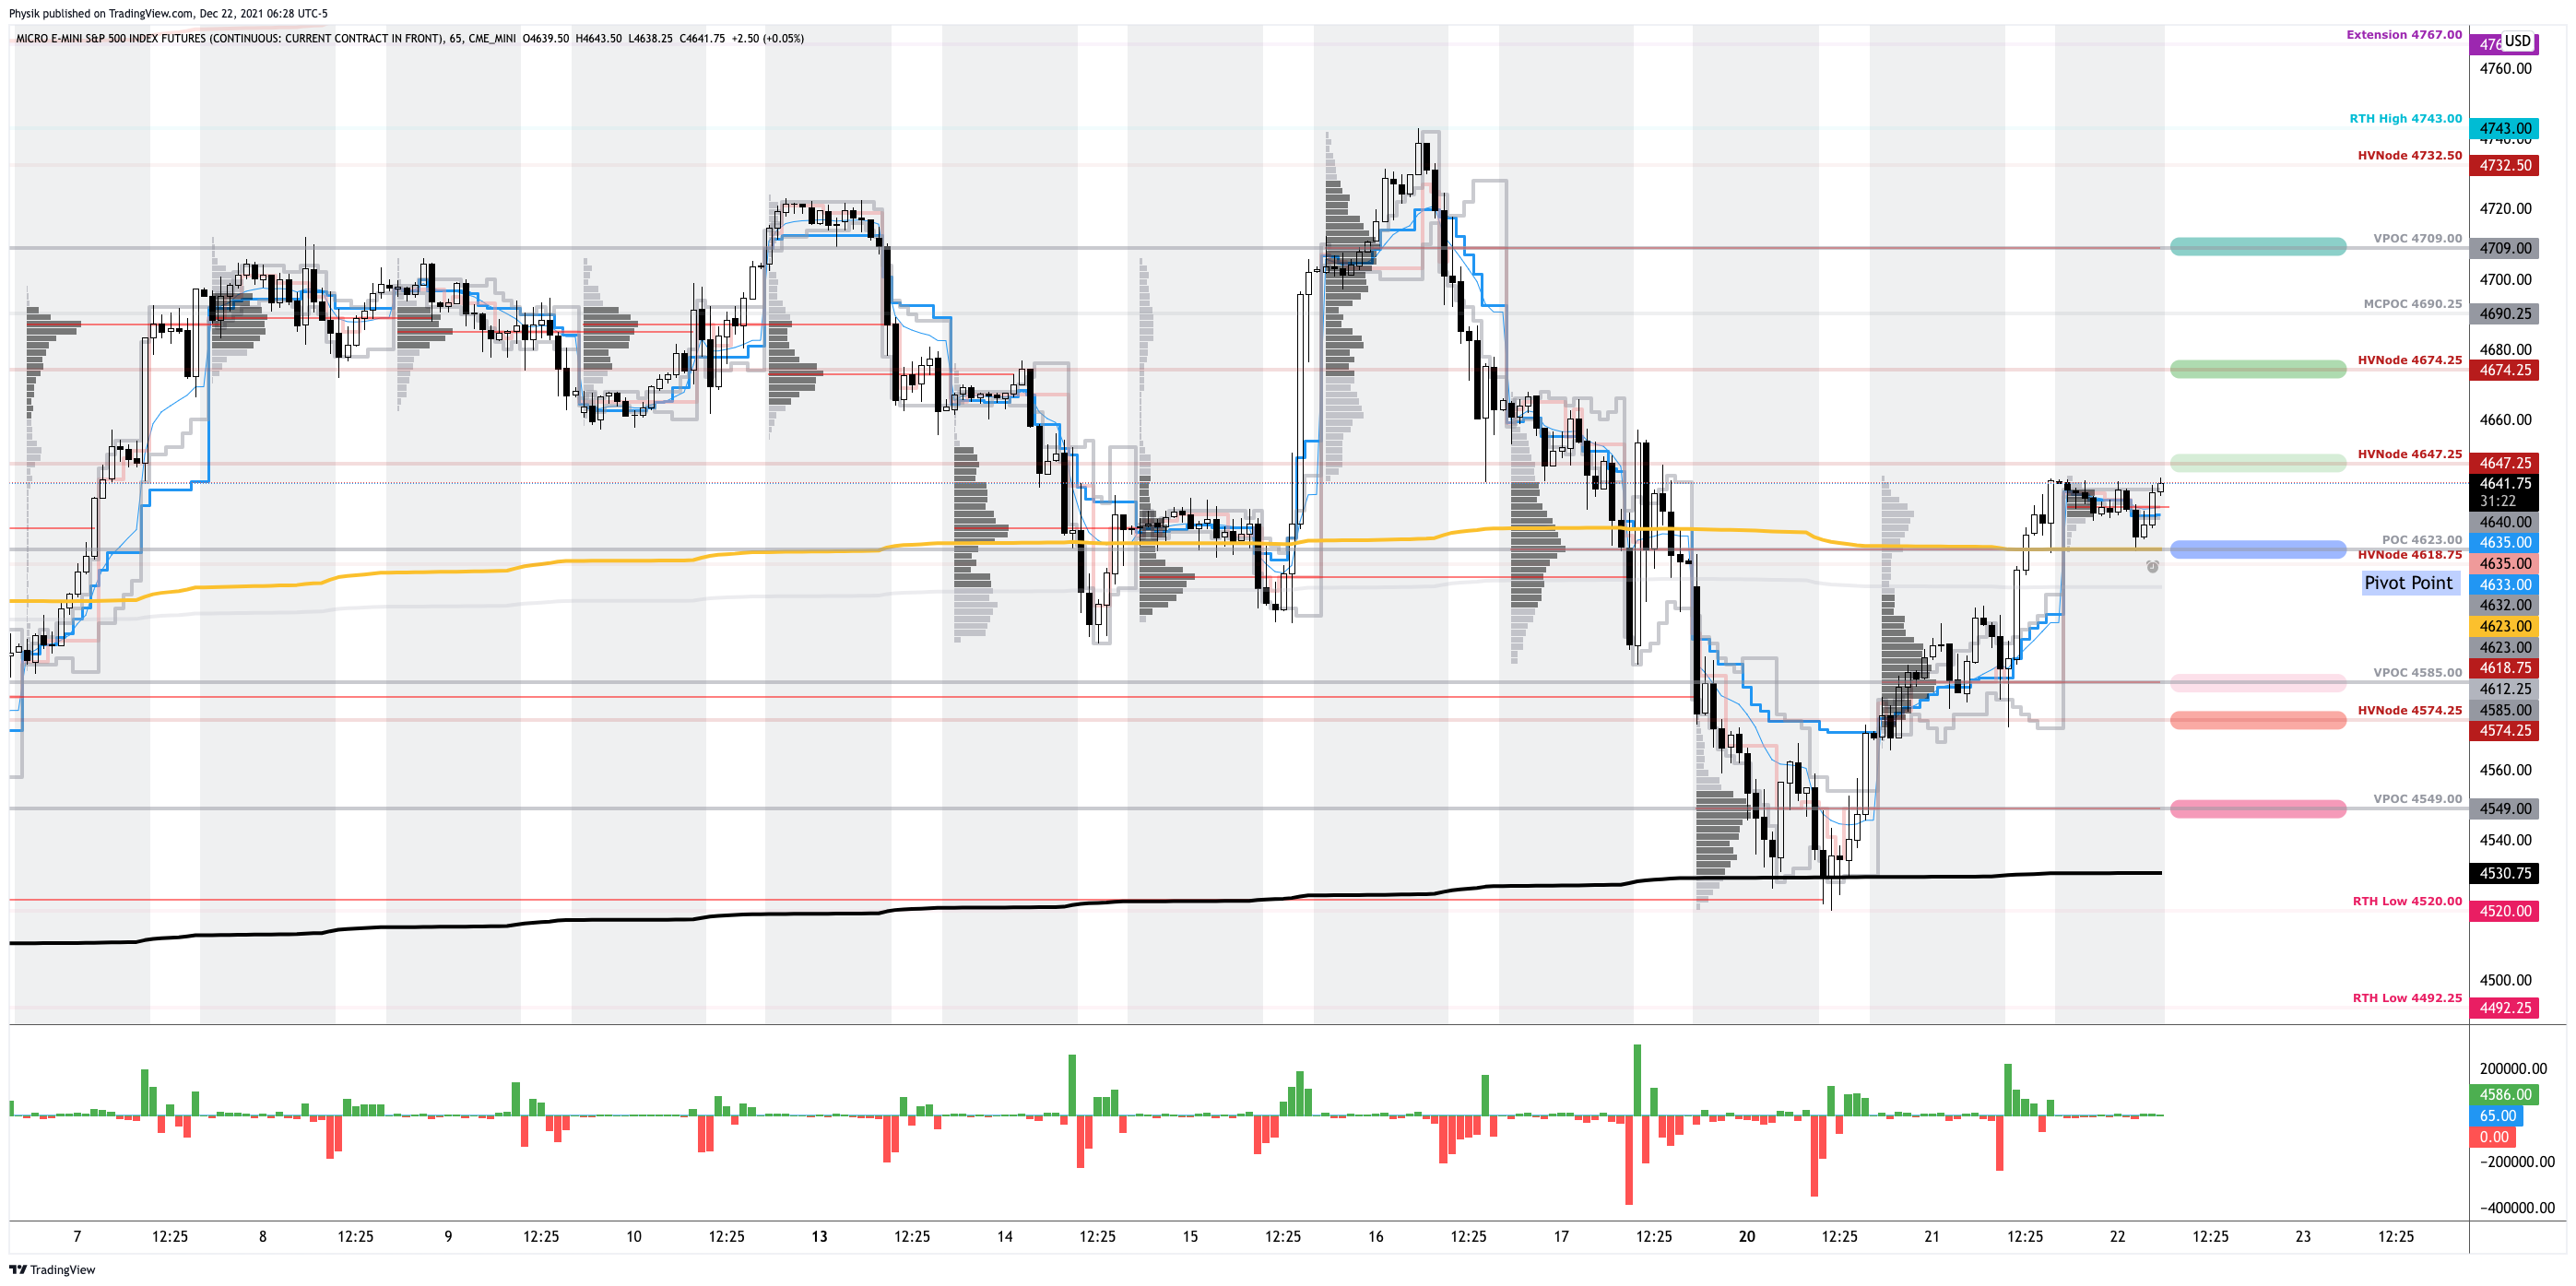
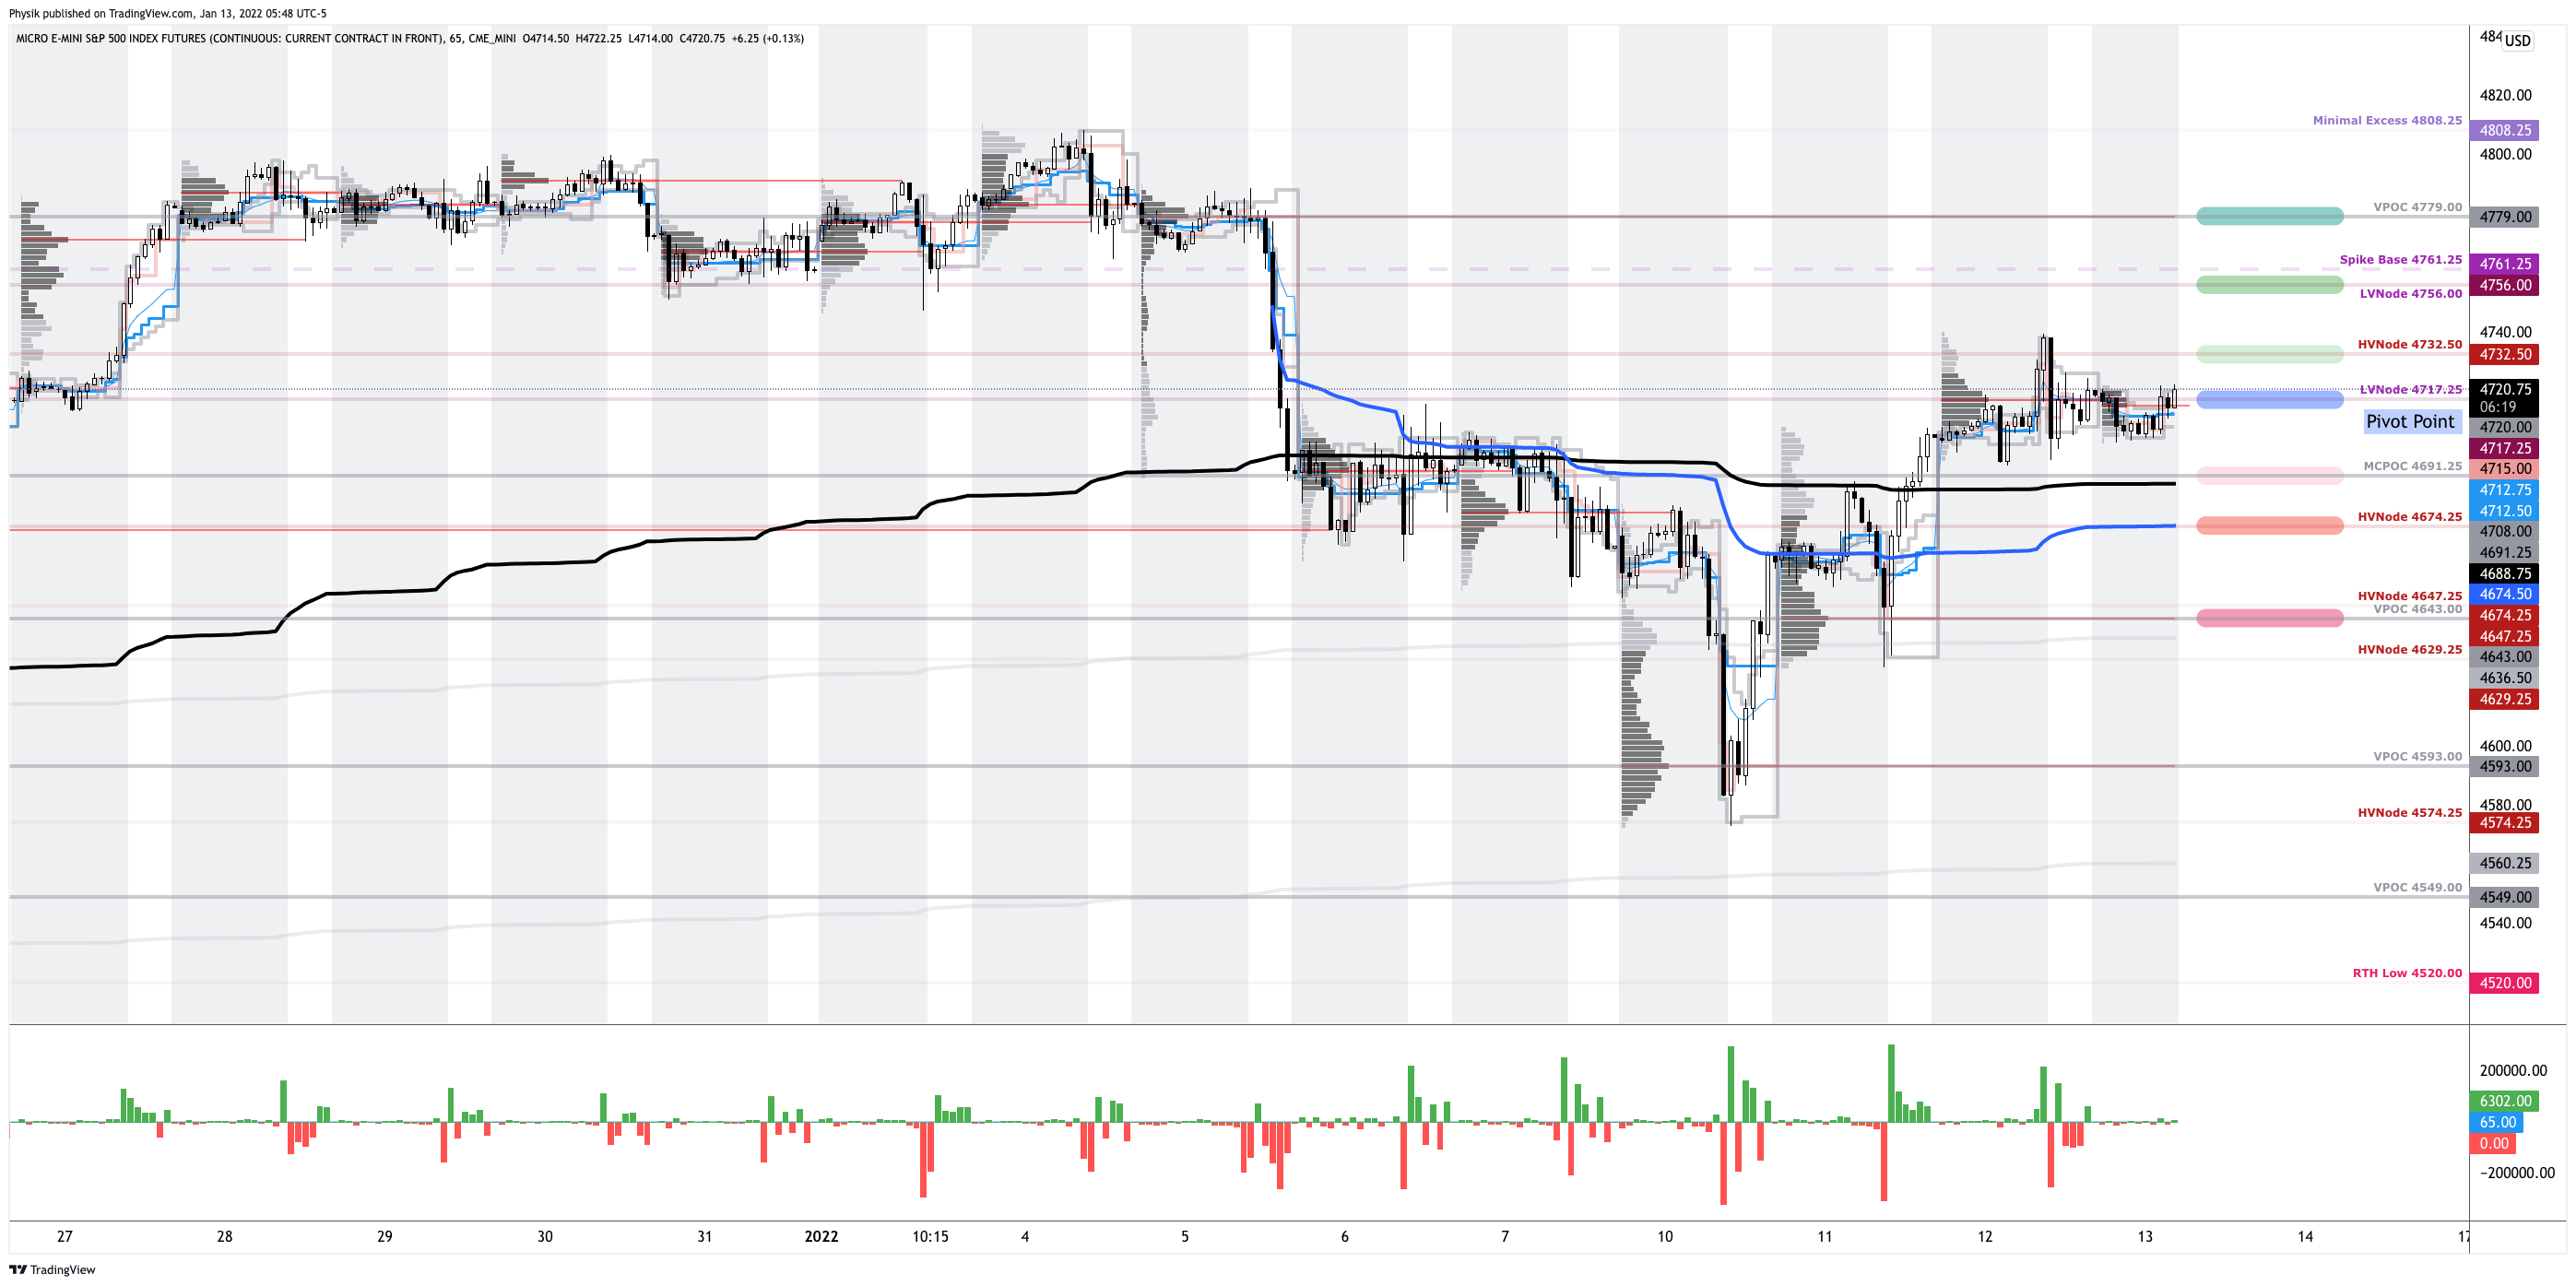
Technical: As of 5:55 AM ET, Thursday’s regular session (9:30 AM – 4:00 PM ET), in the S&P 500, will likely open in the middle part of a negatively skewed overnight inventory, inside of prior-range and -value, suggesting a limited potential for immediate directional opportunity.
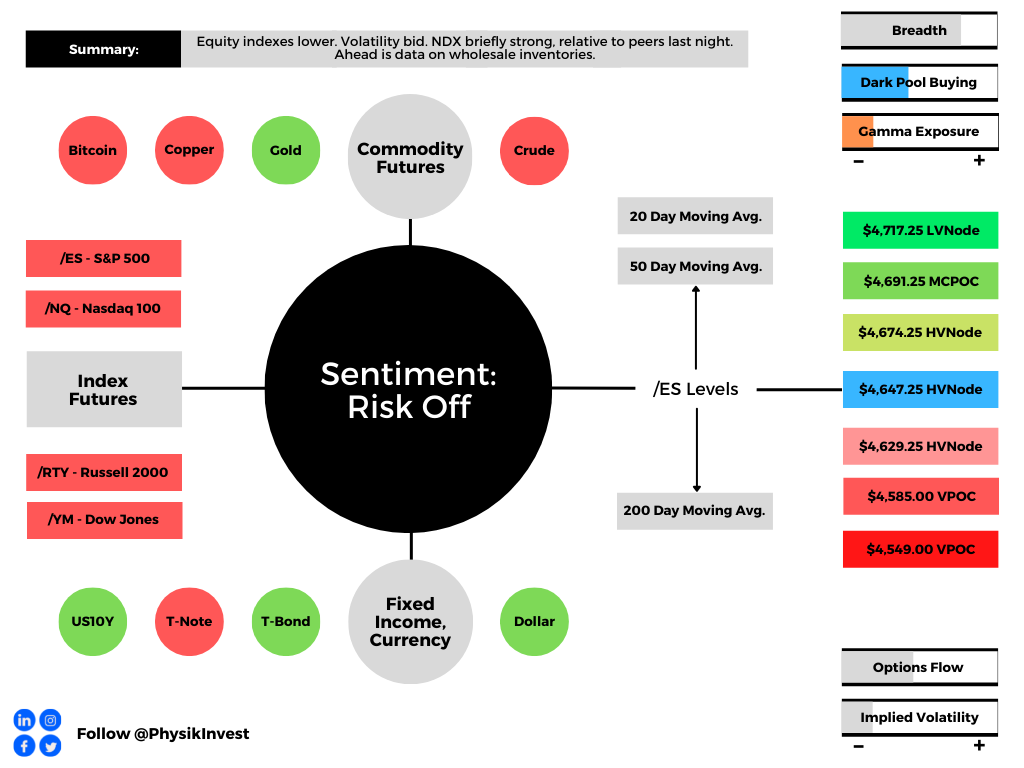
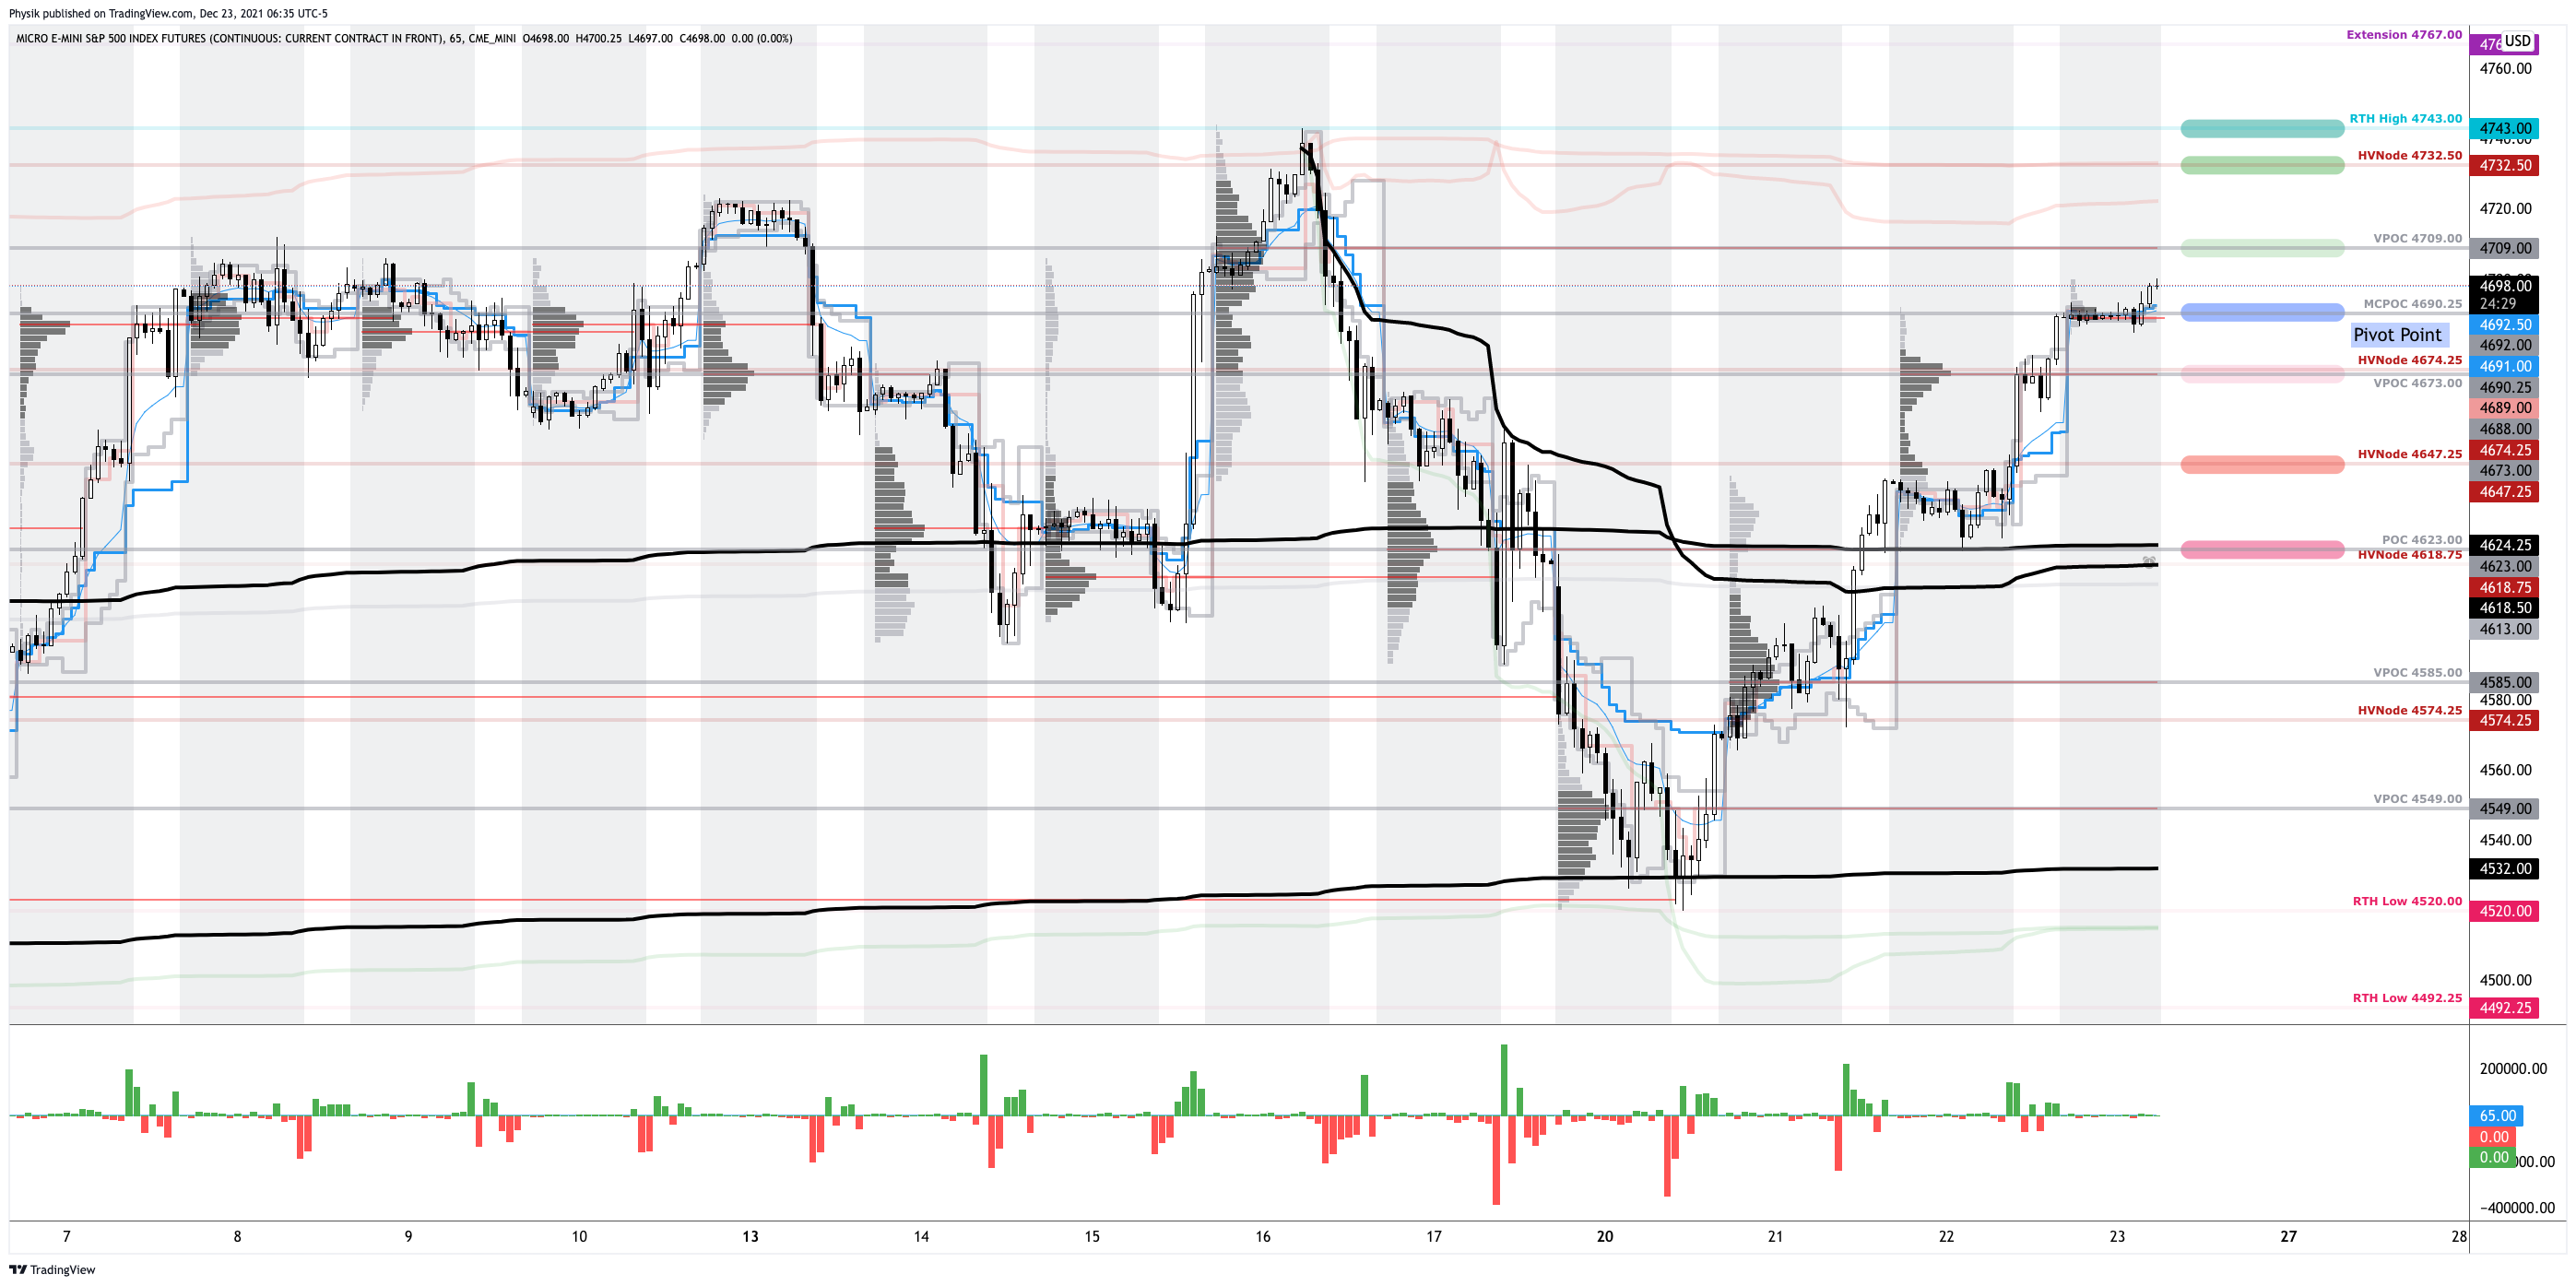
In the best case, the S&P 500 trades higher; activity above the $4,717.25 low volume area (LVNode) puts in play the $4,732.50 high volume area (HVNode). Initiative trade beyond the HVNode could reach as high as the $4,756.00 LVNode and $4,779.00 untested point of control (VPOC), or higher.
In the worst case, the S&P 500 trades lower; activity below the $4,717.25 LVNode puts in play the $4,691.25 micro composite point of control (MCPOC). Initiative trade beyond the MCPOC could reach as low as the $4,674.25 HVNode and $4,643.00 VPOC, or lower.
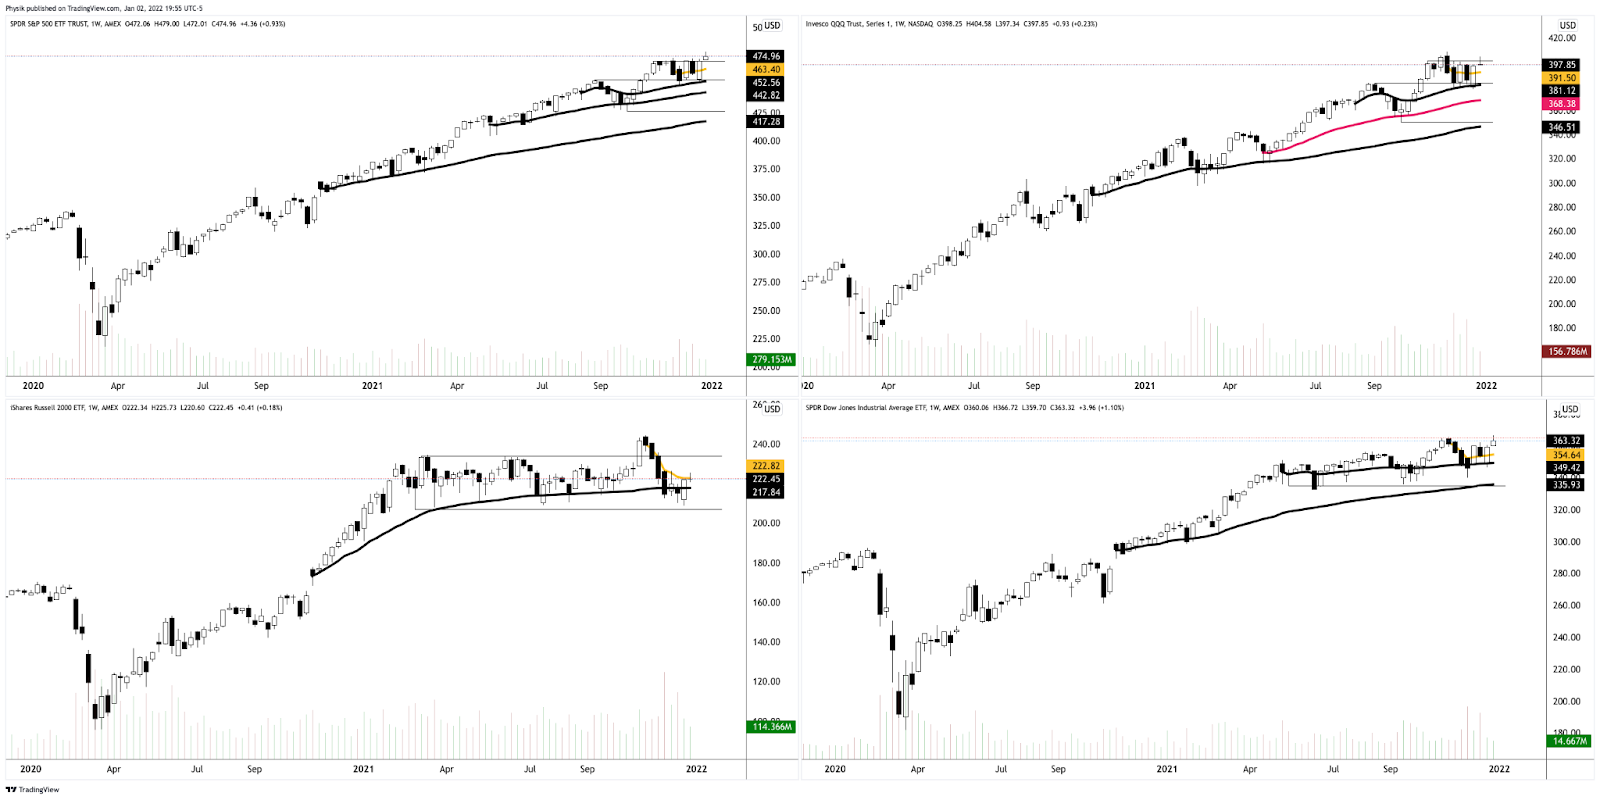
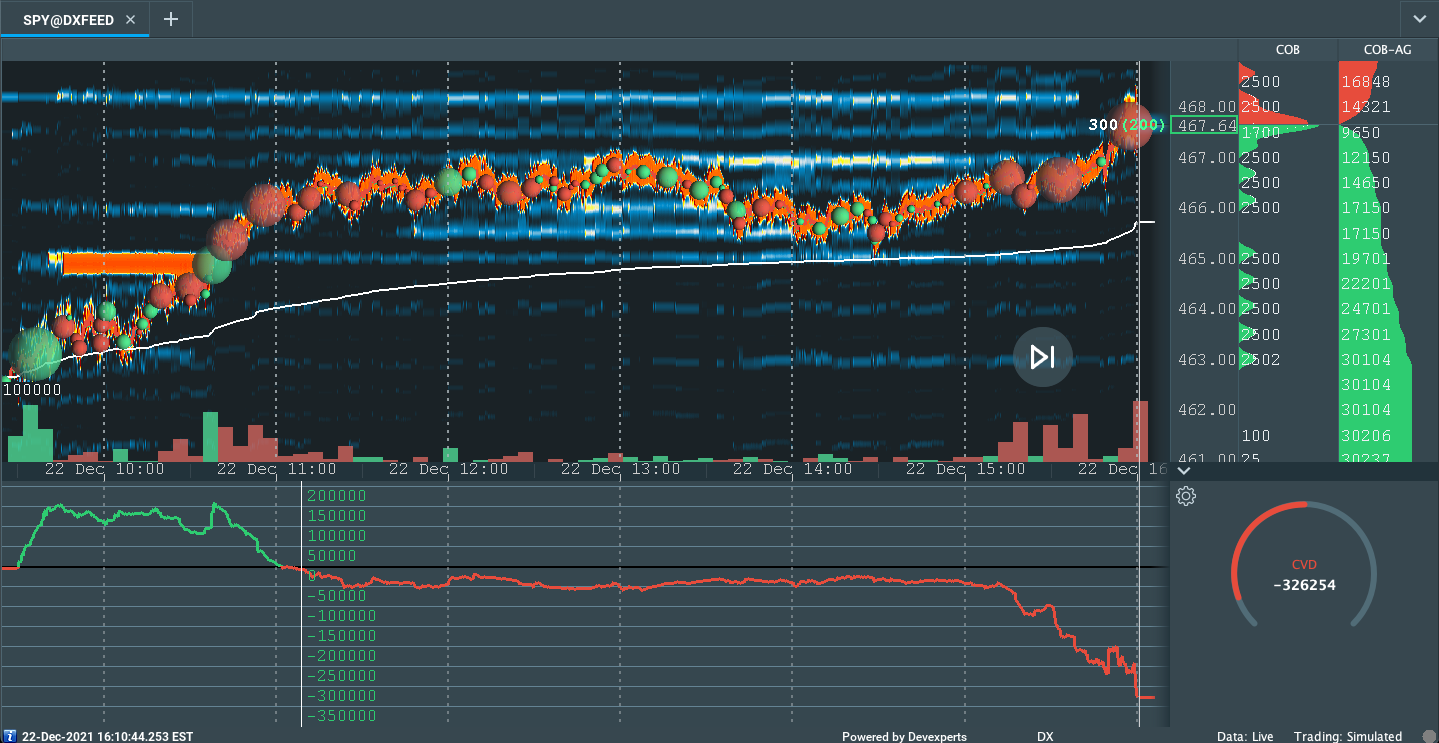
Considerations: As evidenced by the volume-weighted average price anchored from the release of FOMC minutes (blue color, below), the average buyer, since that, is winning.
Click here to load today’s key levels into the web-based TradingView charting platform. Note that all levels are derived using the 65-minute timeframe. New links are produced, daily.
What People Are Saying
Definitions
Volume Areas: A structurally sound market will build on areas of high volume (HVNodes). Should the market trend for long periods of time, it will lack sound structure, identified as low volume areas (LVNodes). LVNodes denote directional conviction and ought to offer support on any test.
If participants were to auction and find acceptance into areas of prior low volume (LVNodes), then future discovery ought to be volatile and quick as participants look to HVNodes for favorable entry or exit.
DIX: For every buyer is a seller (usually a market maker). Using DIX — which is derived from short sales (i.e., liquidity provision on the market-making side) — we can measure buying pressure.
Gamma: Gamma is the sensitivity of an option to changes in the underlying price. Dealers that take the other side of options trades hedge their exposure to risk by buying and selling the underlying. When dealers are short-gamma, they hedge by buying into strength and selling into weakness. When dealers are long-gamma, they hedge by selling into strength and buying into weakness. The former exacerbates volatility. The latter calms volatility.
Vanna: The rate at which the delta of an option changes with respect to volatility.
Charm: The rate at which the delta of an option changes with respect to time.
Options: If an option buyer was short (long) stock, he or she would buy a call (put) to hedge upside (downside) exposure. Option buyers can also use options as an efficient way to gain directional exposure.
POCs: POCs are valuable as they denote areas where two-sided trade was most prevalent in a prior day session. Participants will respond to future tests of value as they offer favorable entry and exit.
MCPOCs: POCs are valuable as they denote areas where two-sided trade was most prevalent over numerous day sessions. Participants will respond to future tests of value as they offer favorable entry and exit.
Options Expiration (OPEX): Traditionally, option expiries mark an end to pinning (i.e, the theory that market makers and institutions short options move stocks to the point where the greatest dollar value of contracts will expire) and the reduction dealer gamma exposure.
Volume-Weighted Average Prices (VWAPs): A metric highly regarded by chief investment officers, among other participants, for quality of trade. Additionally, liquidity algorithms are benchmarked and programmed to buy and sell around VWAPs.
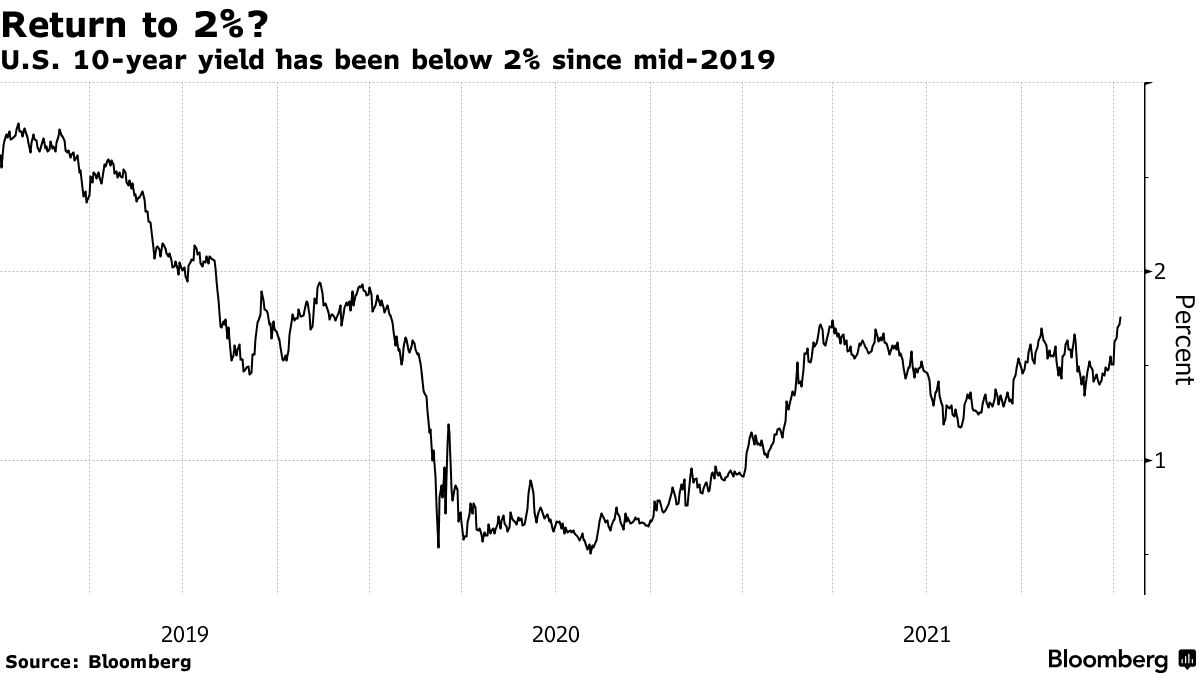
Rates: Low rates have to potential to increase the present value of future earnings making stocks, especially those that are high growth, more attractive. To note, inflation and rates move inversely to each other. Low rates stimulate demand for loans (i.e., borrowing money is more attractive).
About
After years of self-education, strategy development, mentorship, and trial-and-error, Renato Leonard Capelj began trading full-time and founded Physik Invest to detail his methods, research, and performance in the markets.
Capelj is also a Benzinga finance and technology reporter interviewing the likes of Shark Tank’s Kevin O’Leary, JC2 Ventures’ John Chambers, FTX’s Sam Bankman-Fried, and ARK Invest’s Catherine Wood, as well as a SpotGamma contributor developing insights around impactful options market dynamics.
Disclaimer
Physik Invest does not carry the right to provide advice.
In no way should the materials herein be construed as advice. Derivatives carry a substantial risk of loss. All content is for informational purposes only.