Editor’s Note: The Daily Brief is a free glimpse into the prevailing fundamental and technical drivers of U.S. equity market products. Join the 200+ that read this report daily, below!
What Happened
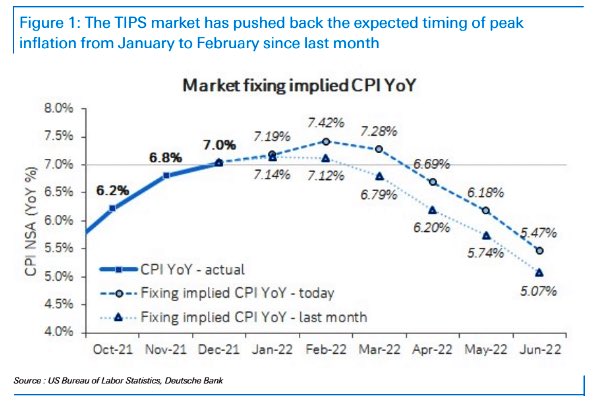
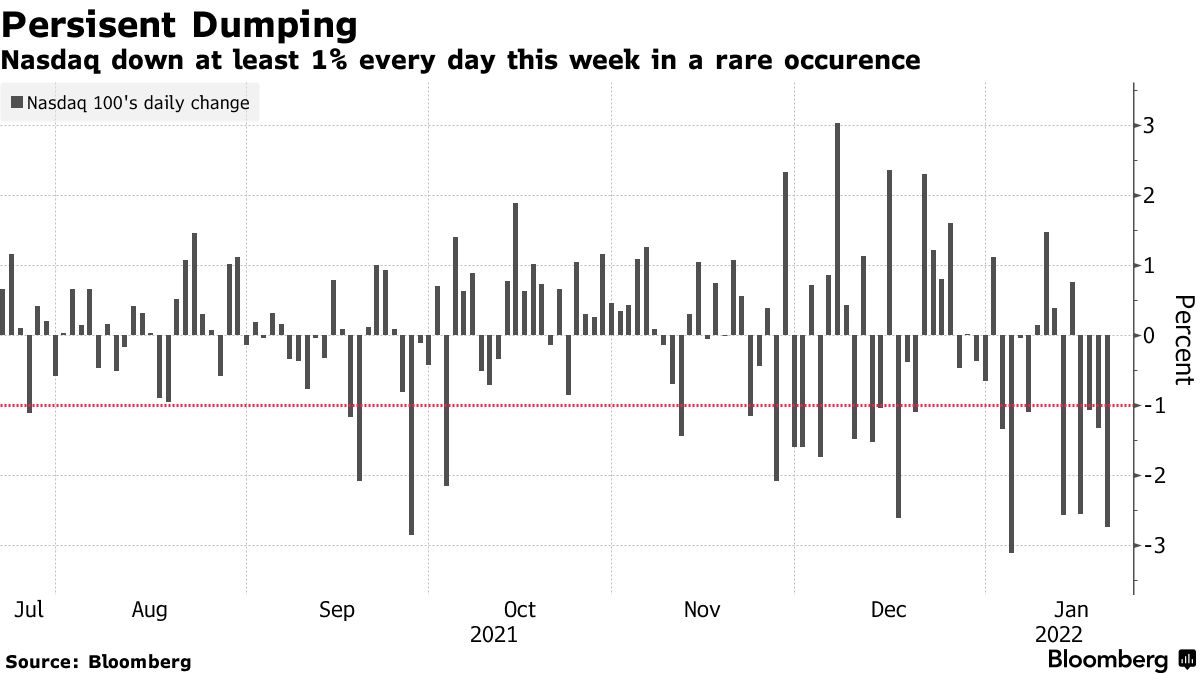
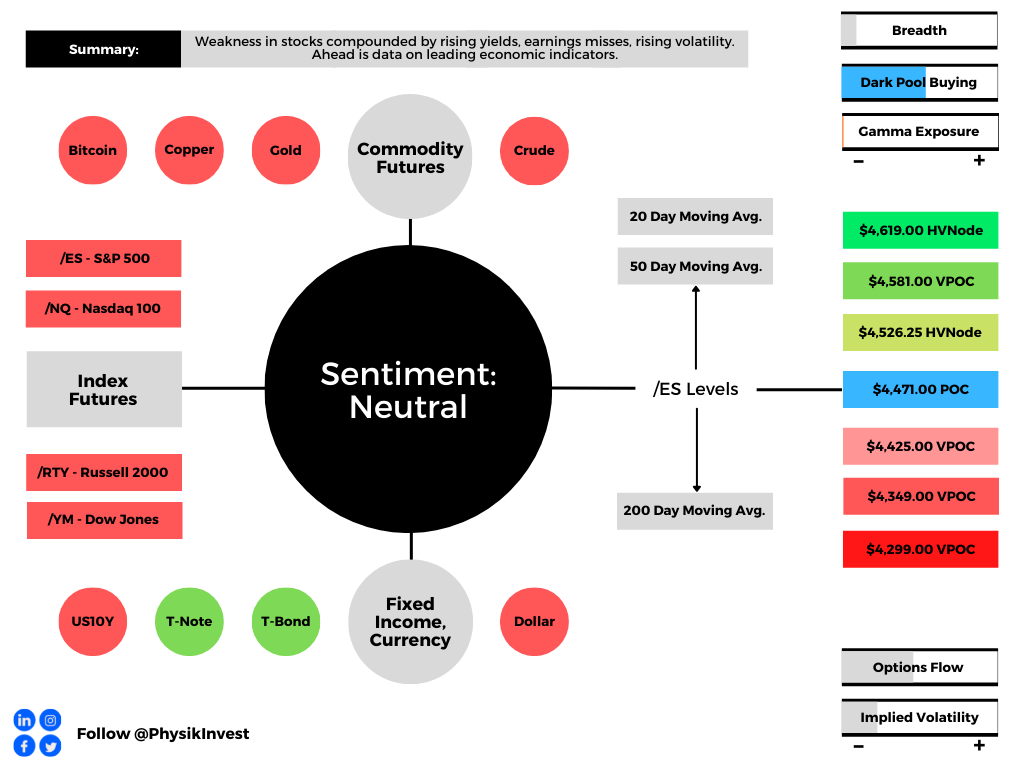
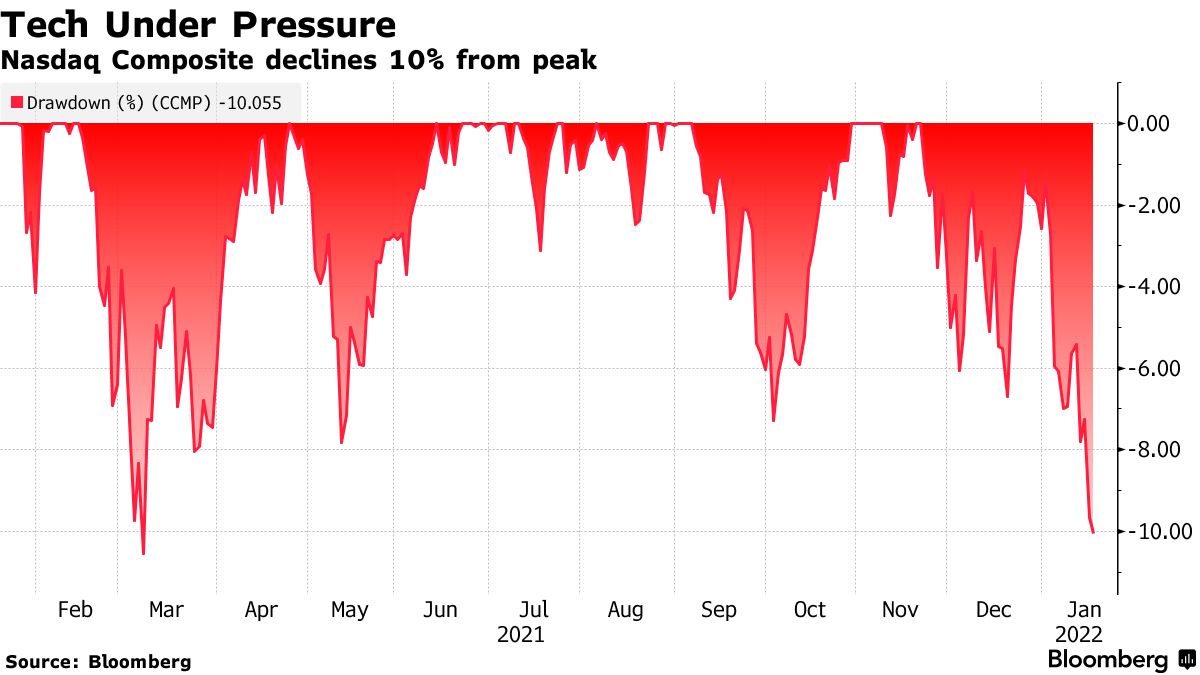
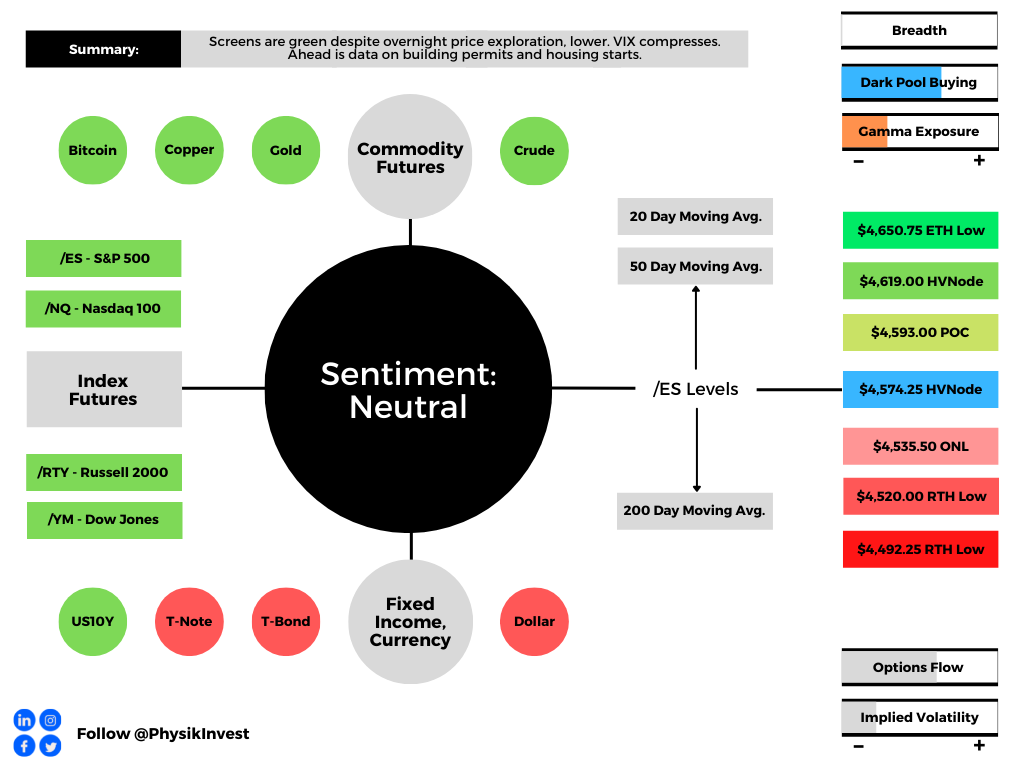
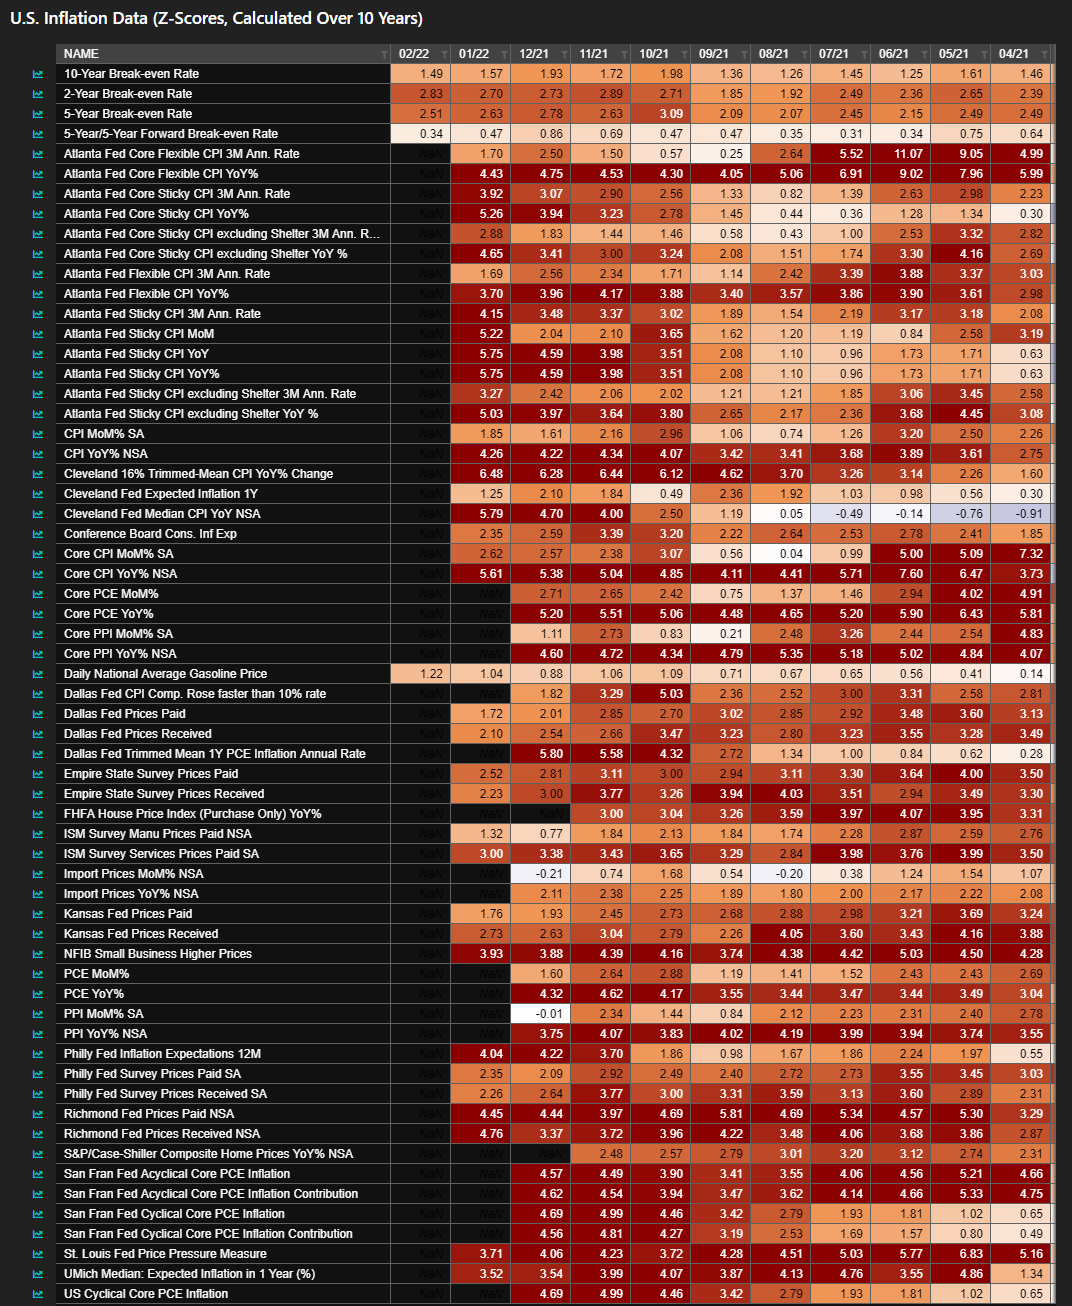
Overnight, equity index futures continued lower after the hottest inflation reading in decades and hawkish (i.e., favoring contractionary policy) Fed-speak by St. Louis Fed Chair James Bullard.
Ahead is data on University of Michigan sentiment and inflation expectations (10:00 AM ET).
What To Expect
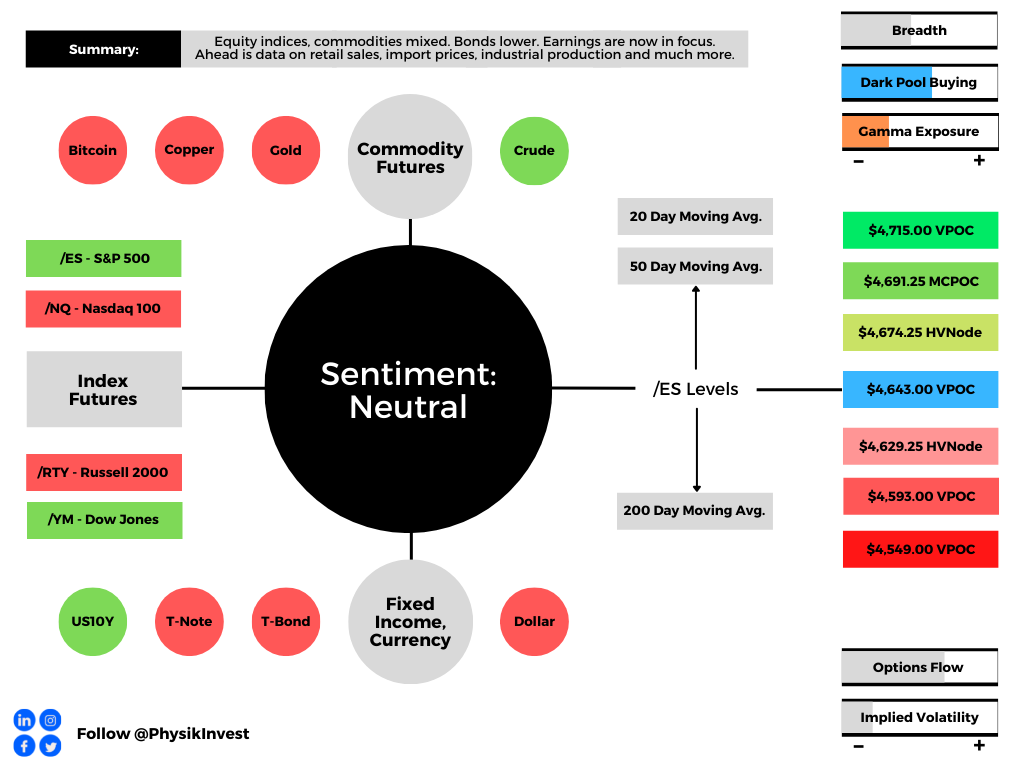
Fundamental: Bonds and equities were sold, yesterday.
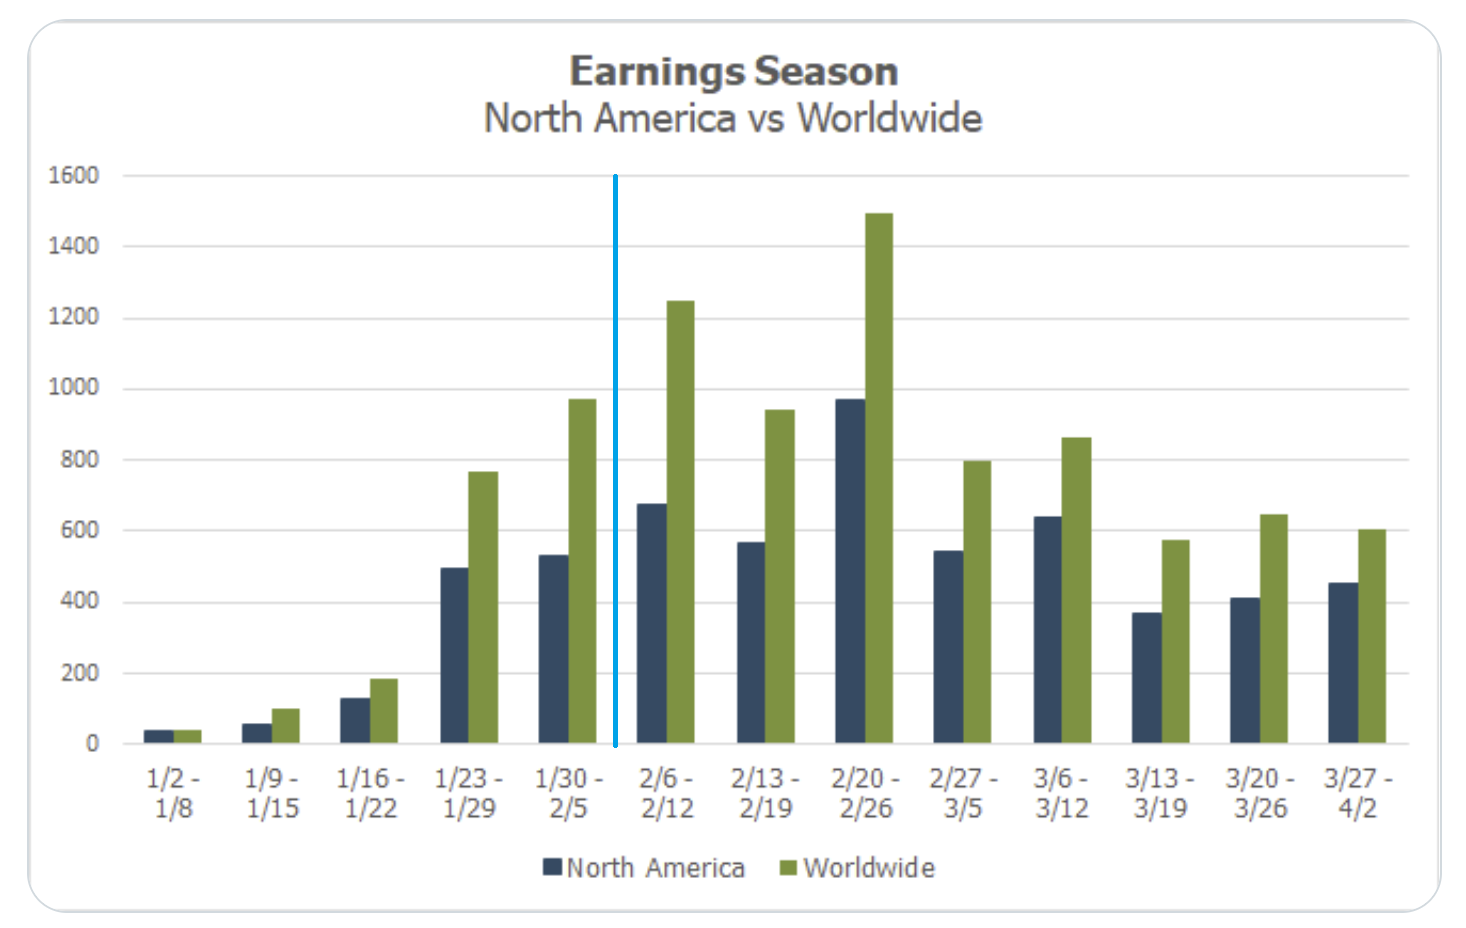
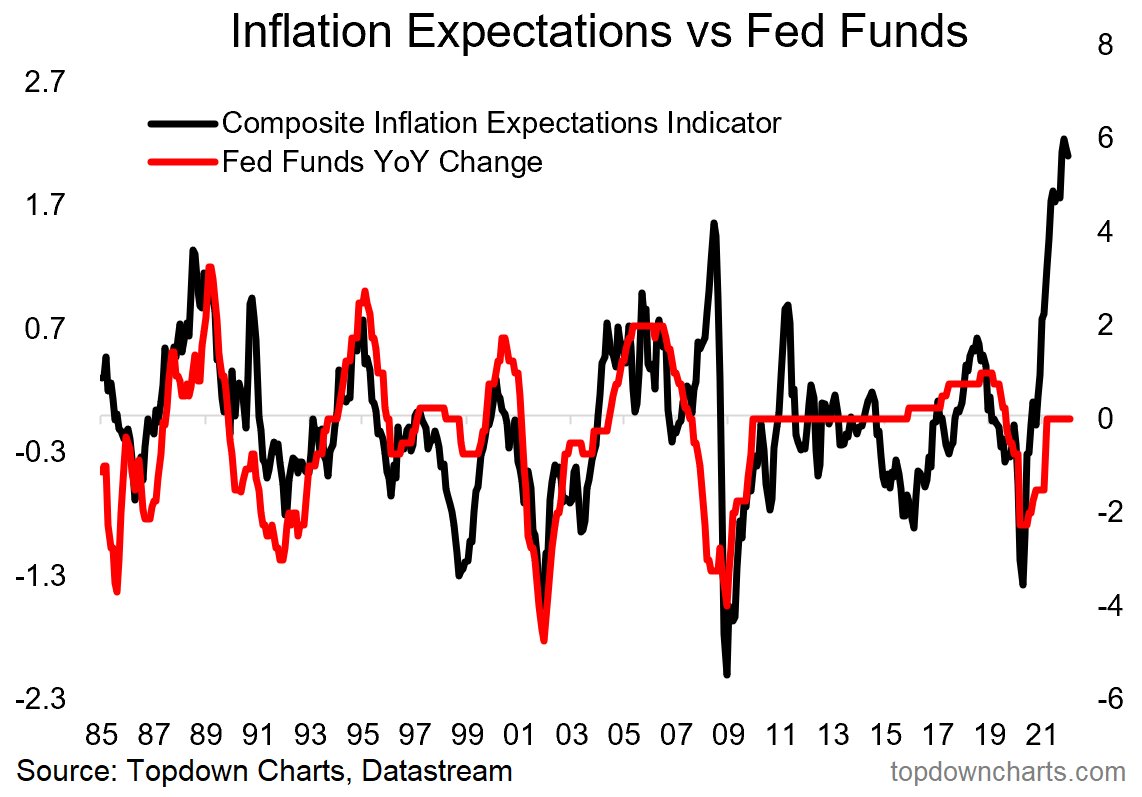
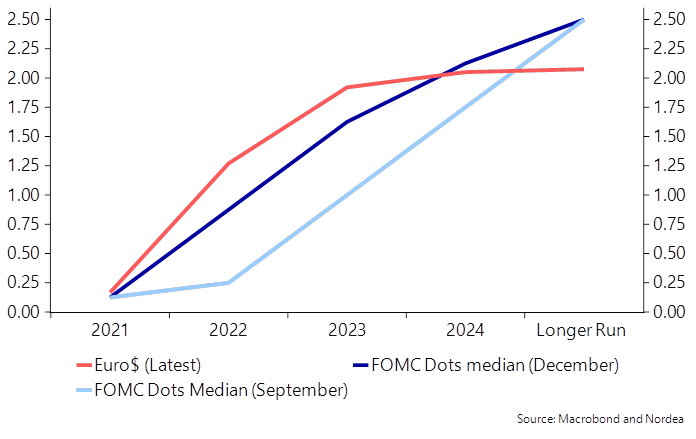
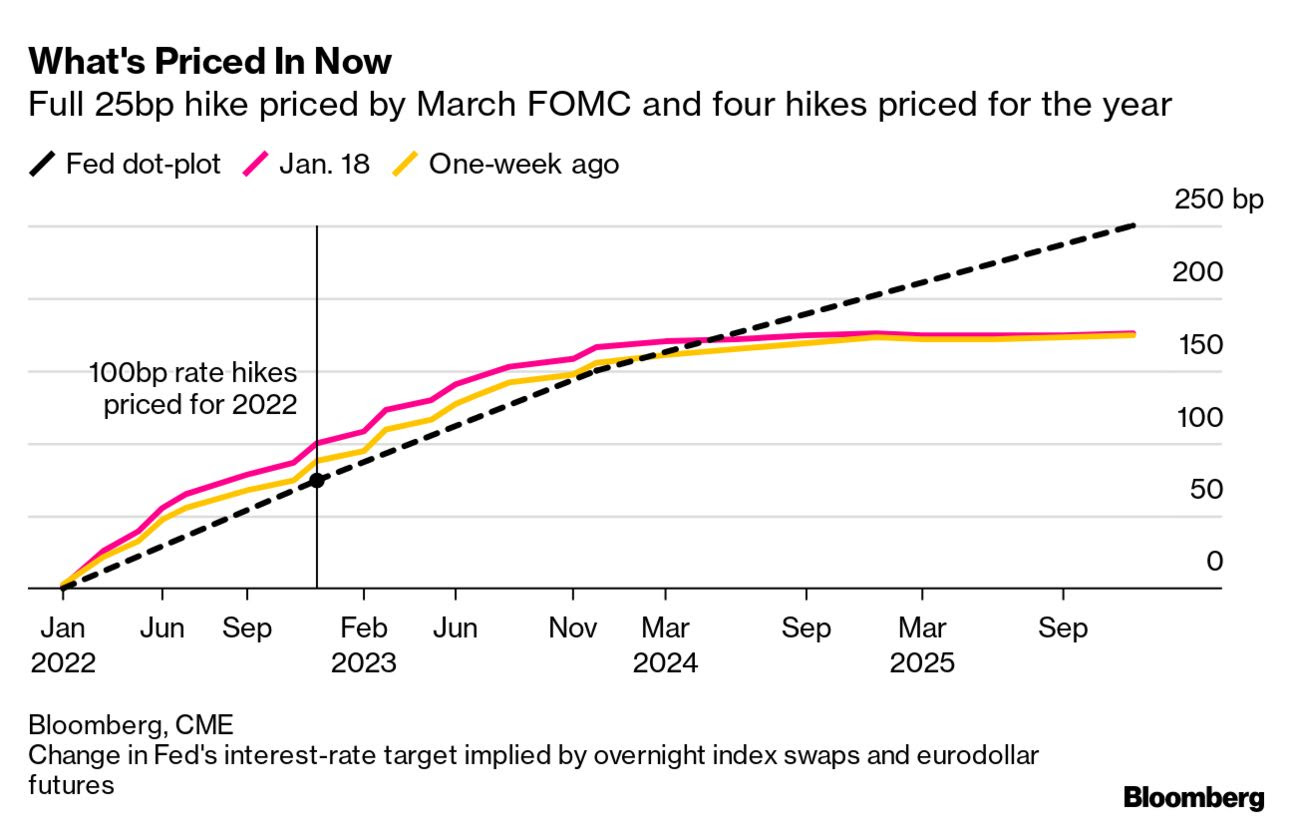
This is after the hottest inflation reading in four decades and comments by the Fed’s Bullard that the central bank should hike rates by 100 basis points over the next three meetings.
“Bullard’s plan involves spreading the increases over three meetings, shrinking the Fed’s balance sheet starting in the second quarter and then deciding on the path of rates in the second half based on updated data,” Bloomberg explained.
“Markets boosted bets on rate hikes, pricing a full percentage-point increase over three meetings, which would require the first 50 basis-point increase since 2000 unless a move was made between Fed meetings.”
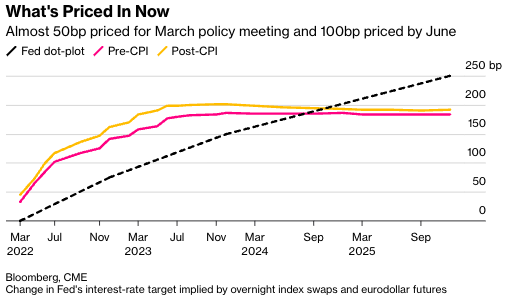
Further, though this FOMC participant’s more hawkish tilt differs from what the entire committee has committed to, so long as “the market expects it, … the odds of a 50bp hike in March or May are higher.”
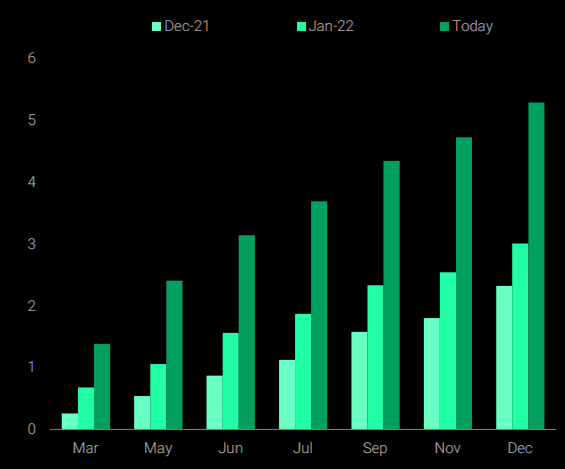
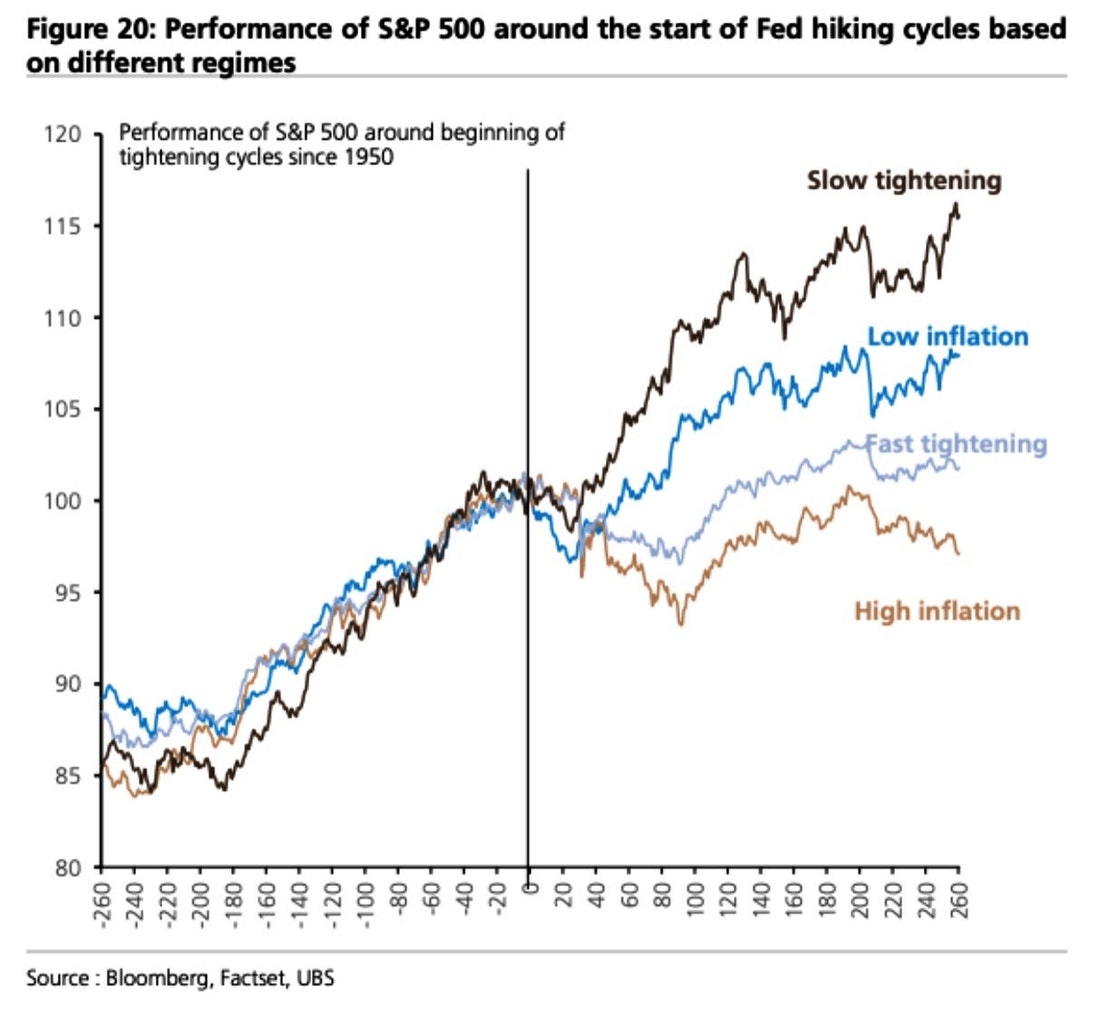
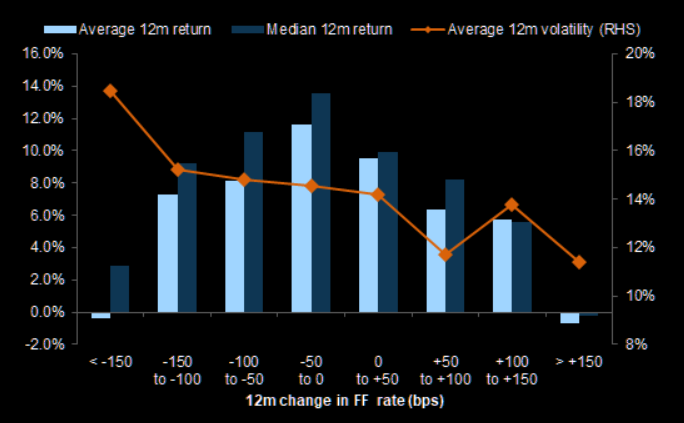
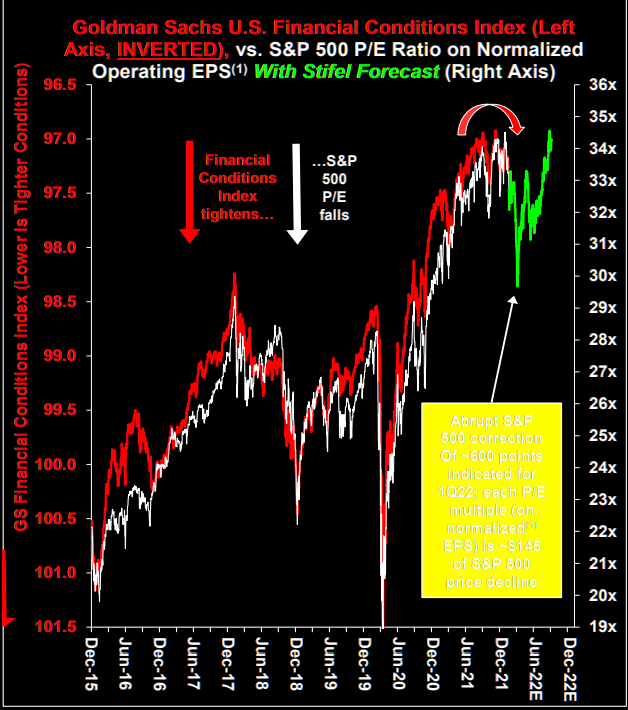
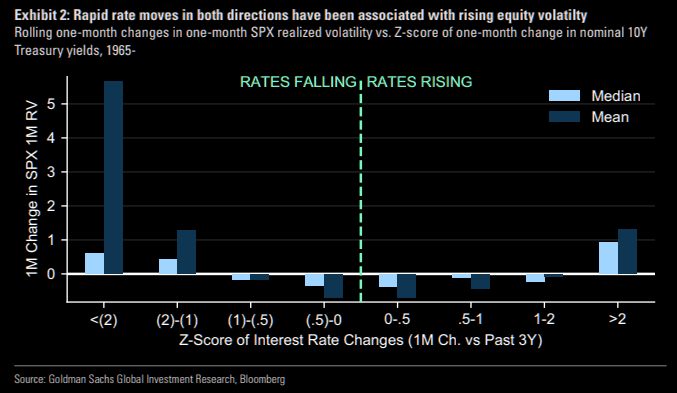
This trend in expectations has been worsening with each major macroeconomic event in 2022. The Fed’s Minutes, FOMC meeting, Nonfarm Payrolls, and CPI have all played a part in the disruption of long-term trends in yields which has a negative impact on valuations, to put simply.
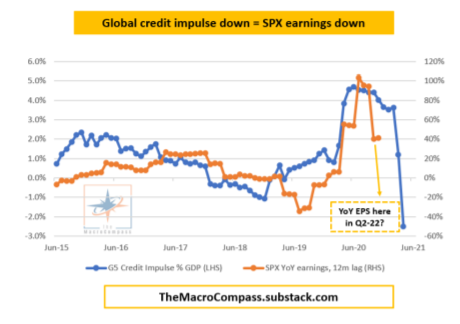
Though earnings growth may offset the negative valuation impact of higher rates, as discussed in detail days ago, the yield curve – e.g., spread between 10- and 2-year – is on its way toward an inversion, as is the yield curve measure involving overnight index swaps (OIS).
For context, per Reuters, an “OIS transaction involves exchanging an overnight rate such as the federal funds rate for a fixed one. For instance, in a U.S. 2-year OIS swap, one party to the transaction receives a fixed two-year rate in exchange for paying the fed funds rate daily over the next two years.”
The OIS market is also a reflection of traders’ expectations for rates. An inversion (which may signal the expectation of aggressive action against inflation that could also stifle economic growth) previously occurred in July 2018. Months later, markets sold and the Fed cut rates.
Per Alfonso Peccatiello, the former head of a $20 billion investment portfolio and author of The Macro Compass: The inversion of the OIS curve may worsen a downturn in the economy as short-term refinancing credit becomes more expensive and markets price weaker long-term growth.
The OIS curve is “a cleaner indication of yield curve inversions,” Peccatiello added.
Positioning: Bonds down. Equities down. What the heck?
This newsletter has talked about this dynamic in the past and will borrow from that, below.
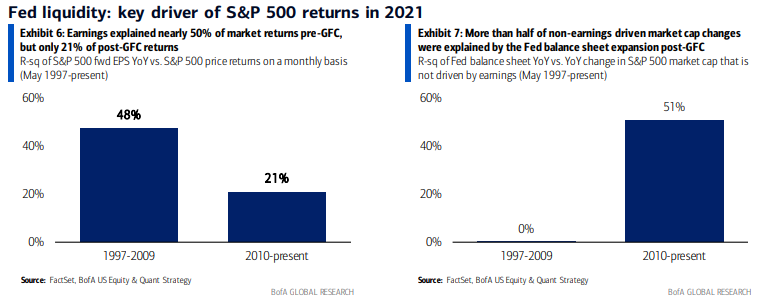
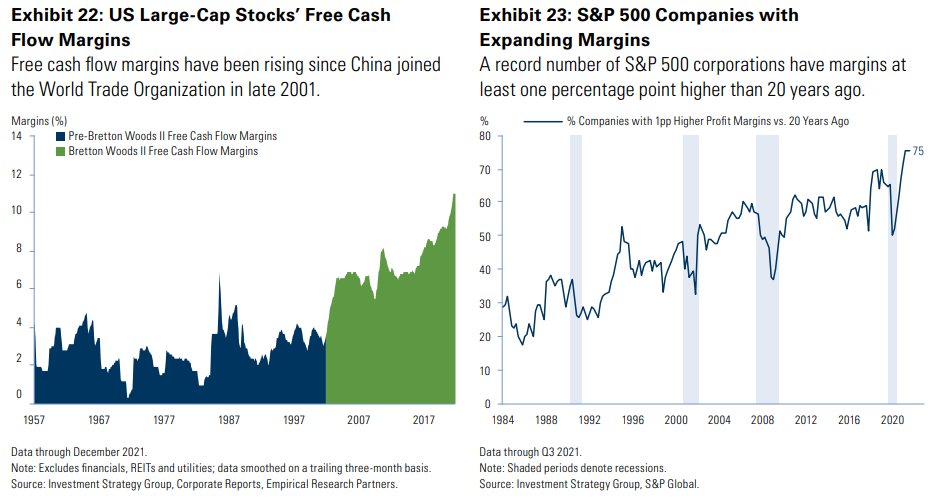
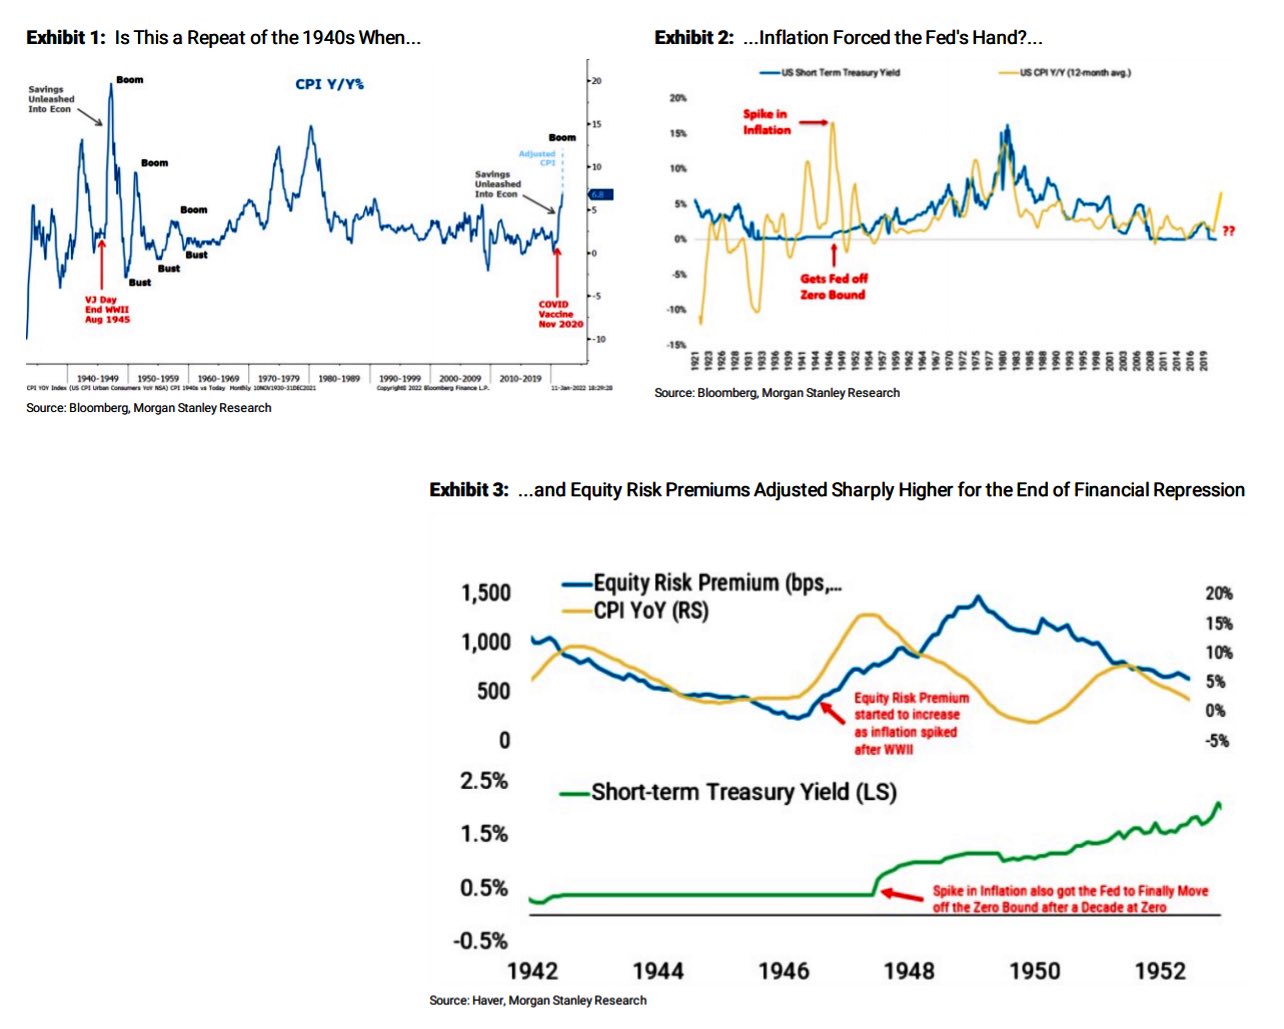
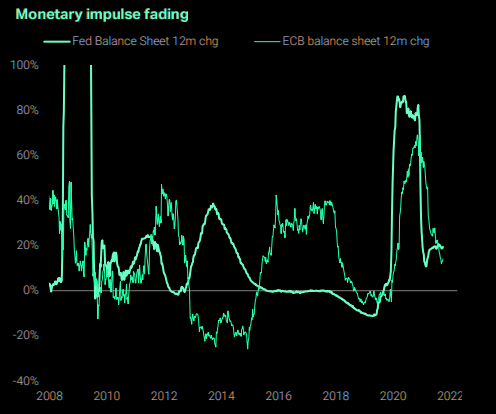
In short, over the past 40 or so years, monetary policy was used as a crutch to support the economy. This promoted deflation, innovation, and the subsequent rise in valuations.
With rates near zero and lifting, that’s a headwind; coupled with participants’ increased exposure to rate and equity market risk, which can play into cross-market hedging and de-leveraging cascades, 60/40 turns into somewhat of a poor hedge.
Why? Higher rates have the potential to decrease the present value of future earnings, making stocks, especially those that are high growth, less attractive.
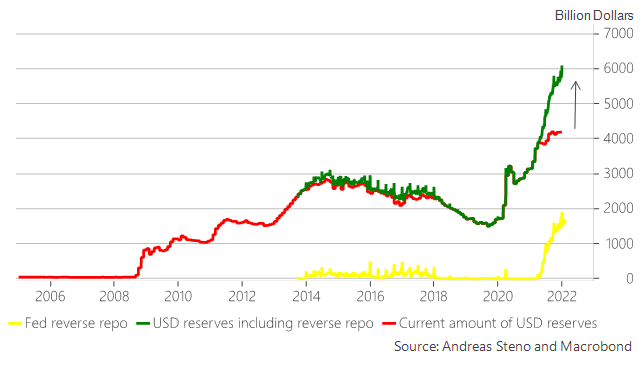
According to a note published by Andy Constan of Damped Spring Advisors, “The lack of additional liquidity provided by Fed purchase will also remove a damper for the market and the economy keeping asset volatility well bid, while also causing asset diversification benefit to fall, generating rising portfolio volatility and the risk demanded to hold assets.”
“Now, with the Fed poised to hike interest rates to combat raging inflation, the bond-stock relationship could be upended,” Bloomberg explains.
“At stake are trillions of dollars that are managed at risk parity funds, balanced mutual funds, and pension funds that follow the framework of 60/40 asset allocation.”
Why mention any of this? Well, it forces us to look elsewhere for protection.
In this case, the growing asset class of volatility, so to speak, is that protection. Investors are aware of both the protective and speculative efficiency afforded to them by options and that is the primary reason option volumes are so comparable to stock volumes, now.
Notwithstanding, with option volumes higher, related hedging flows can represent an increased share of volume in underlying stocks. Therefore, the correlation of stock moves, versus options activity, is more pronounced.
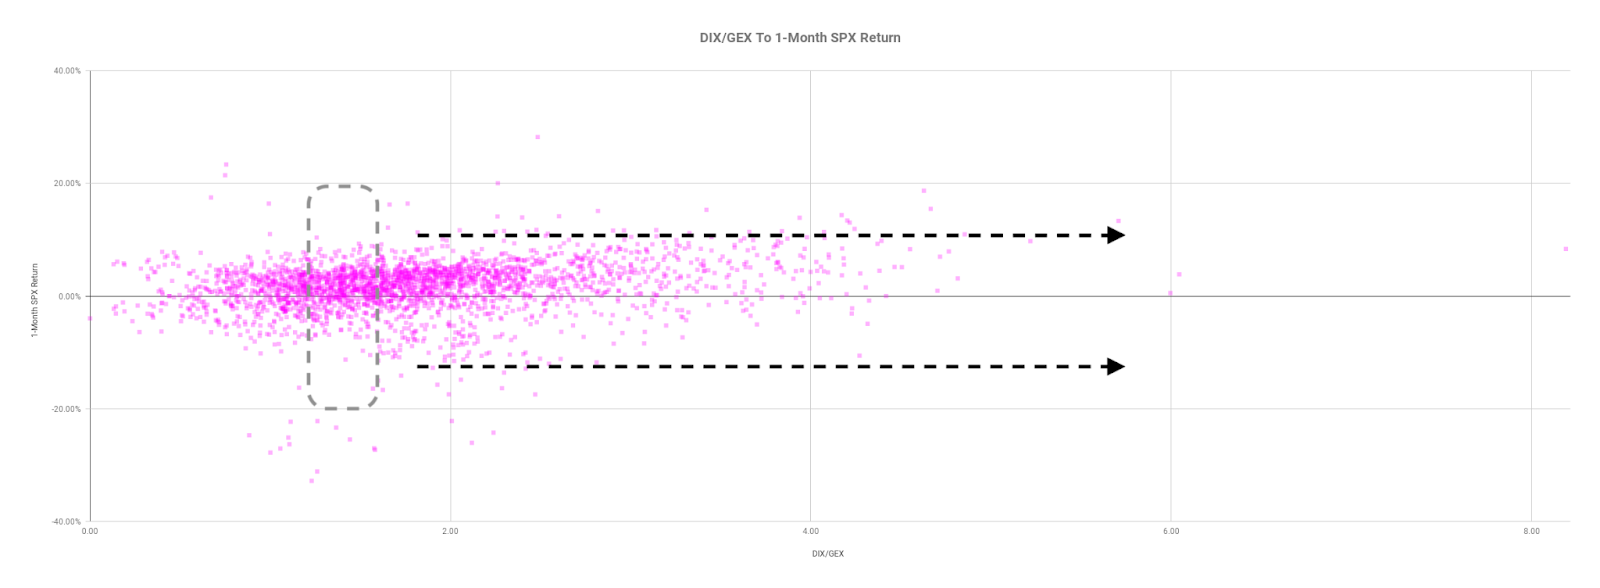
To put it simply, we can look to the options market for clues on where to next, for lack of better phrasing. So, let’s do that!
Heading into Thursday’s session, participants were committing capital to bets on lower volatility.
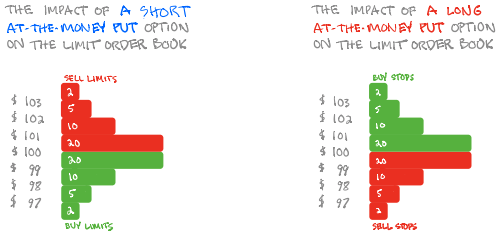
The counterparties to this short volatility trade were long; if the market were to trade higher (lower), they would sell (buy) futures against increased (decreased) positive delta exposure.
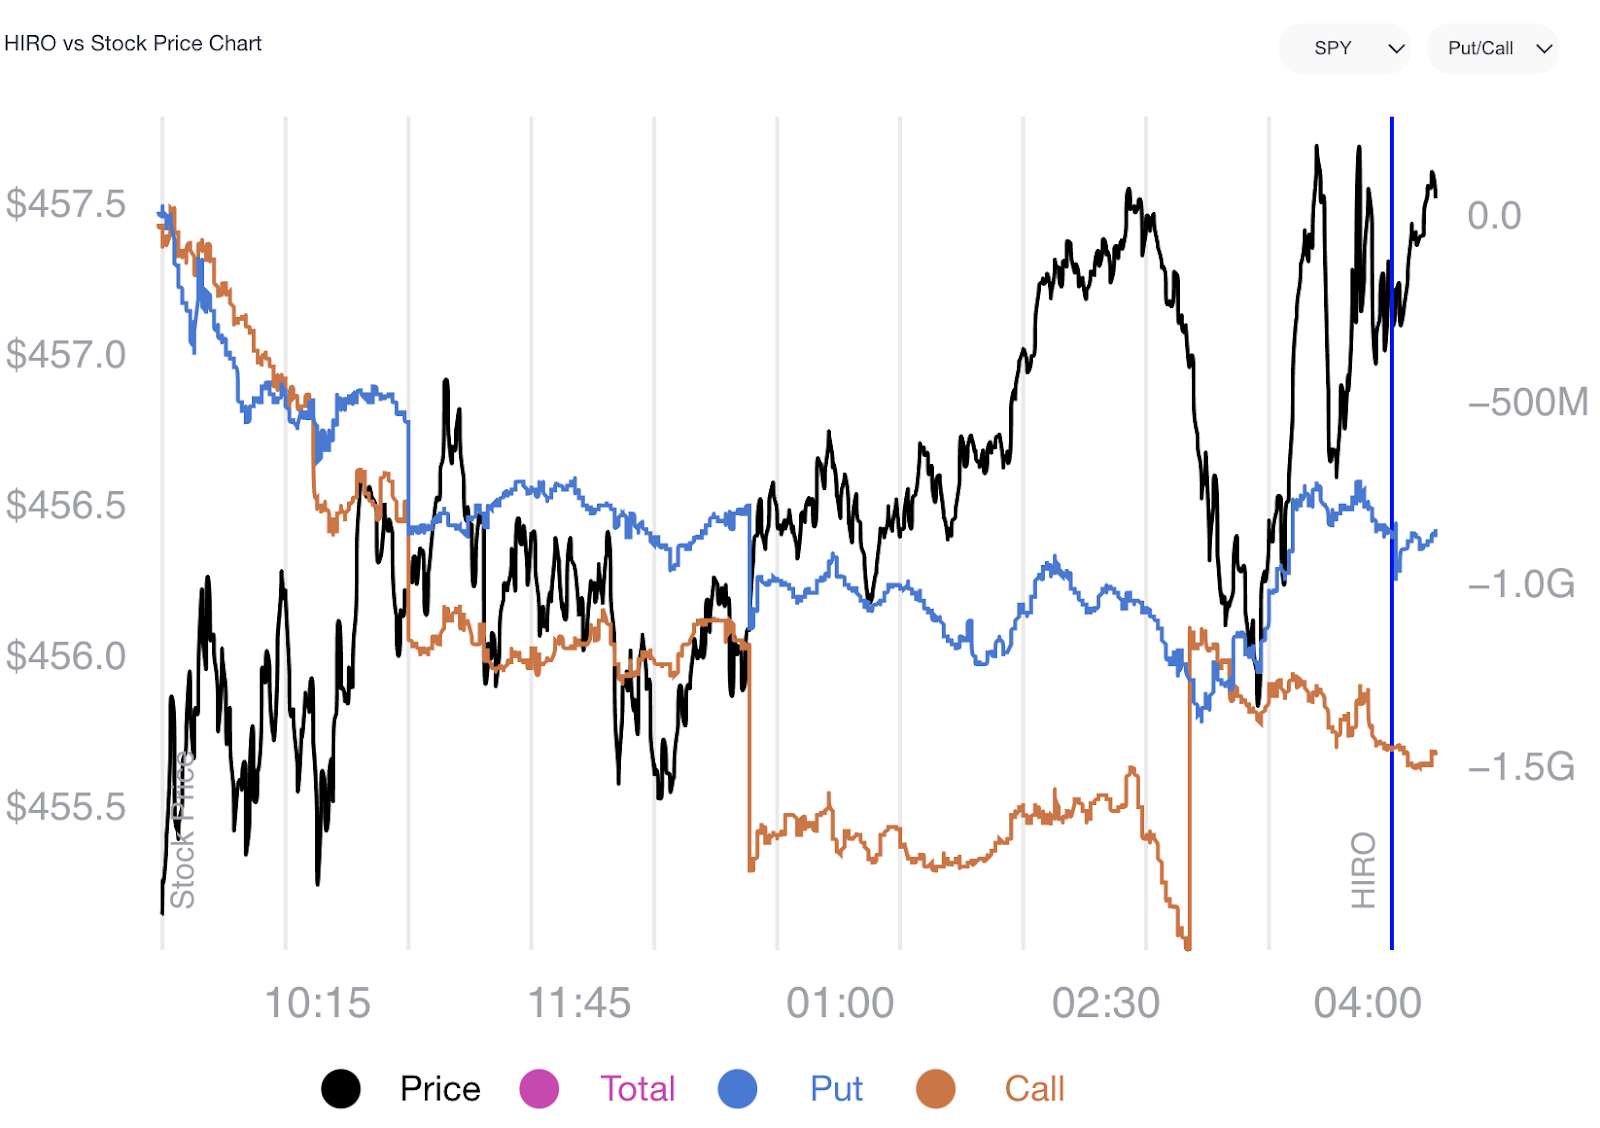
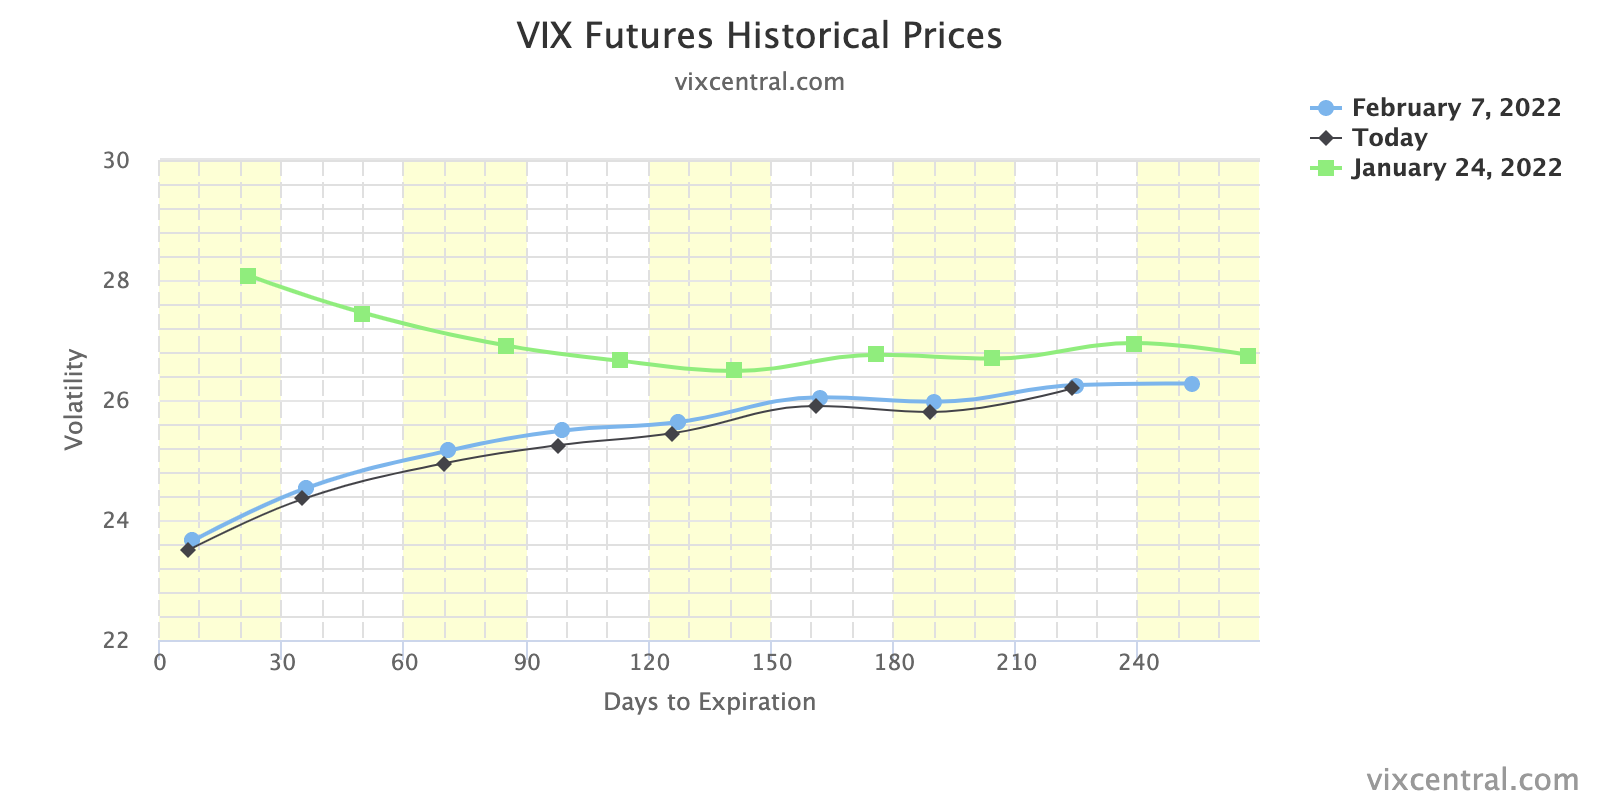
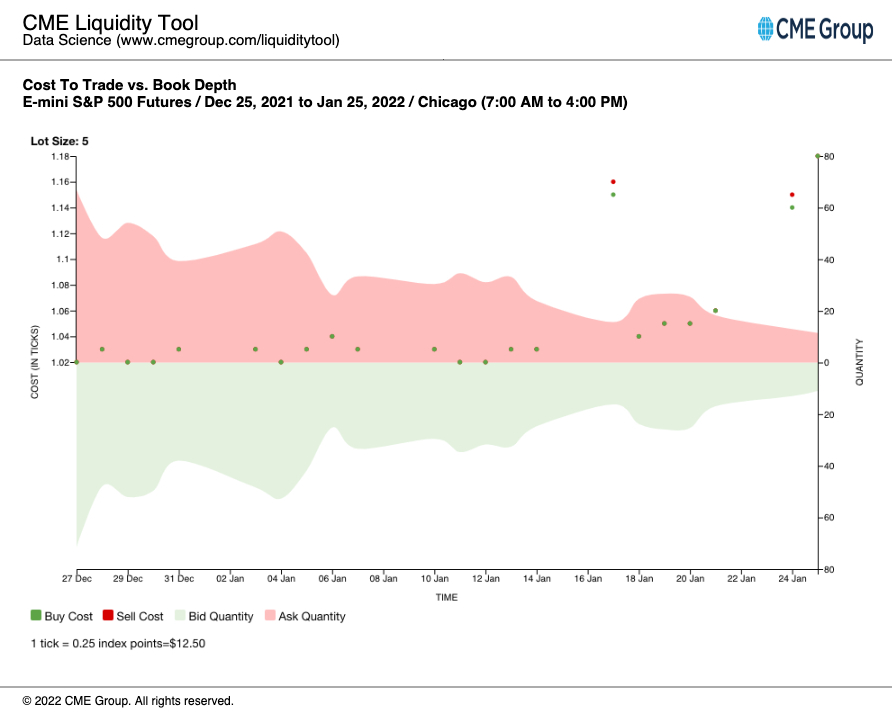
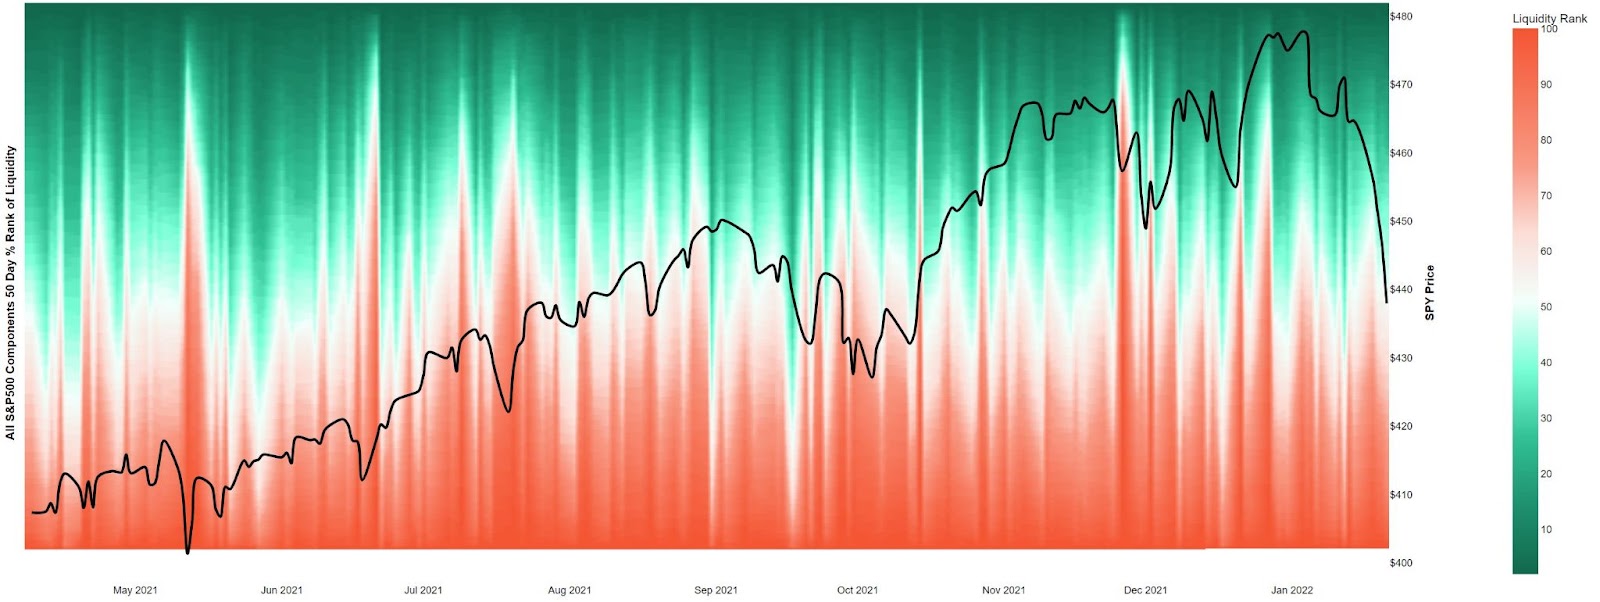
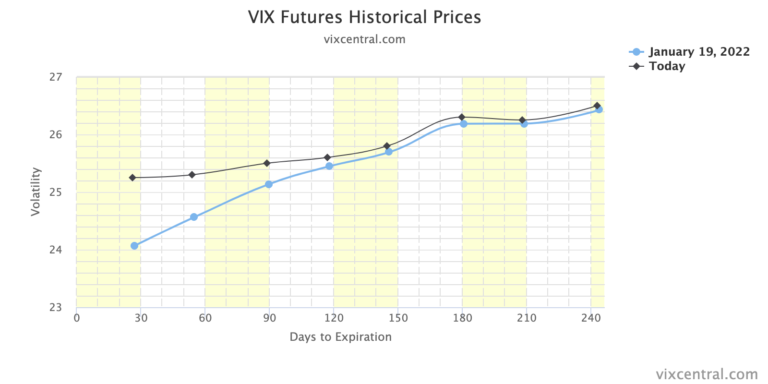
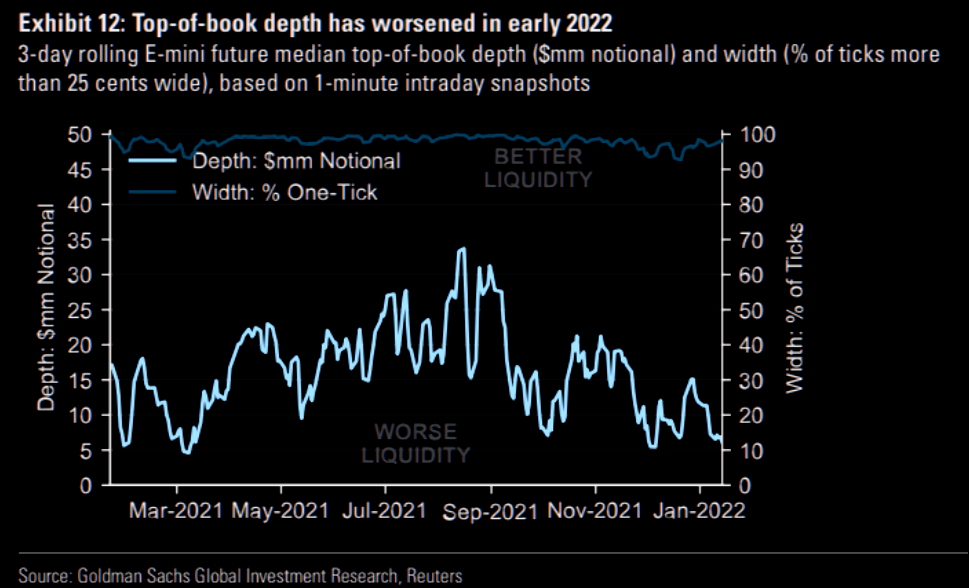
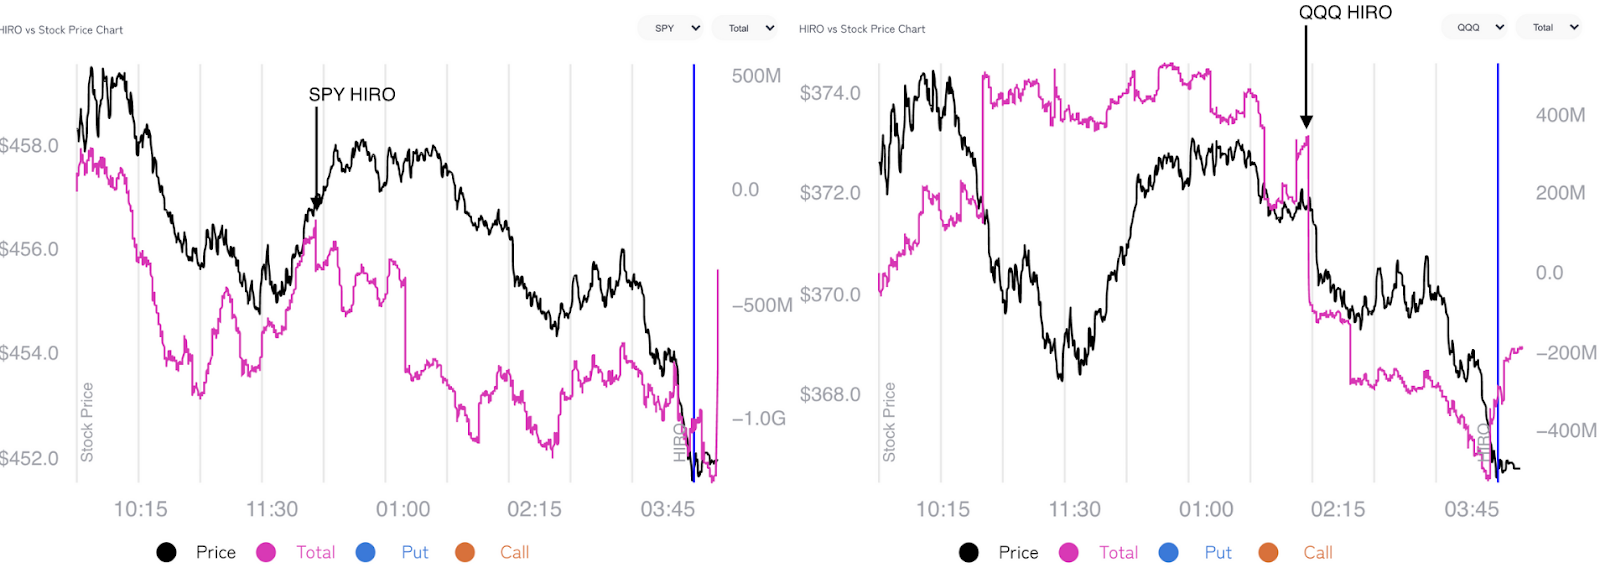
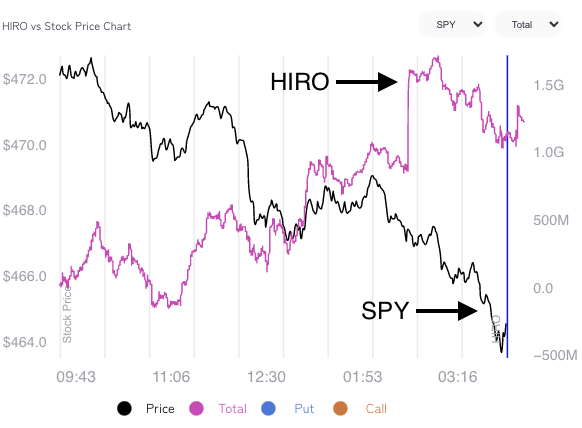
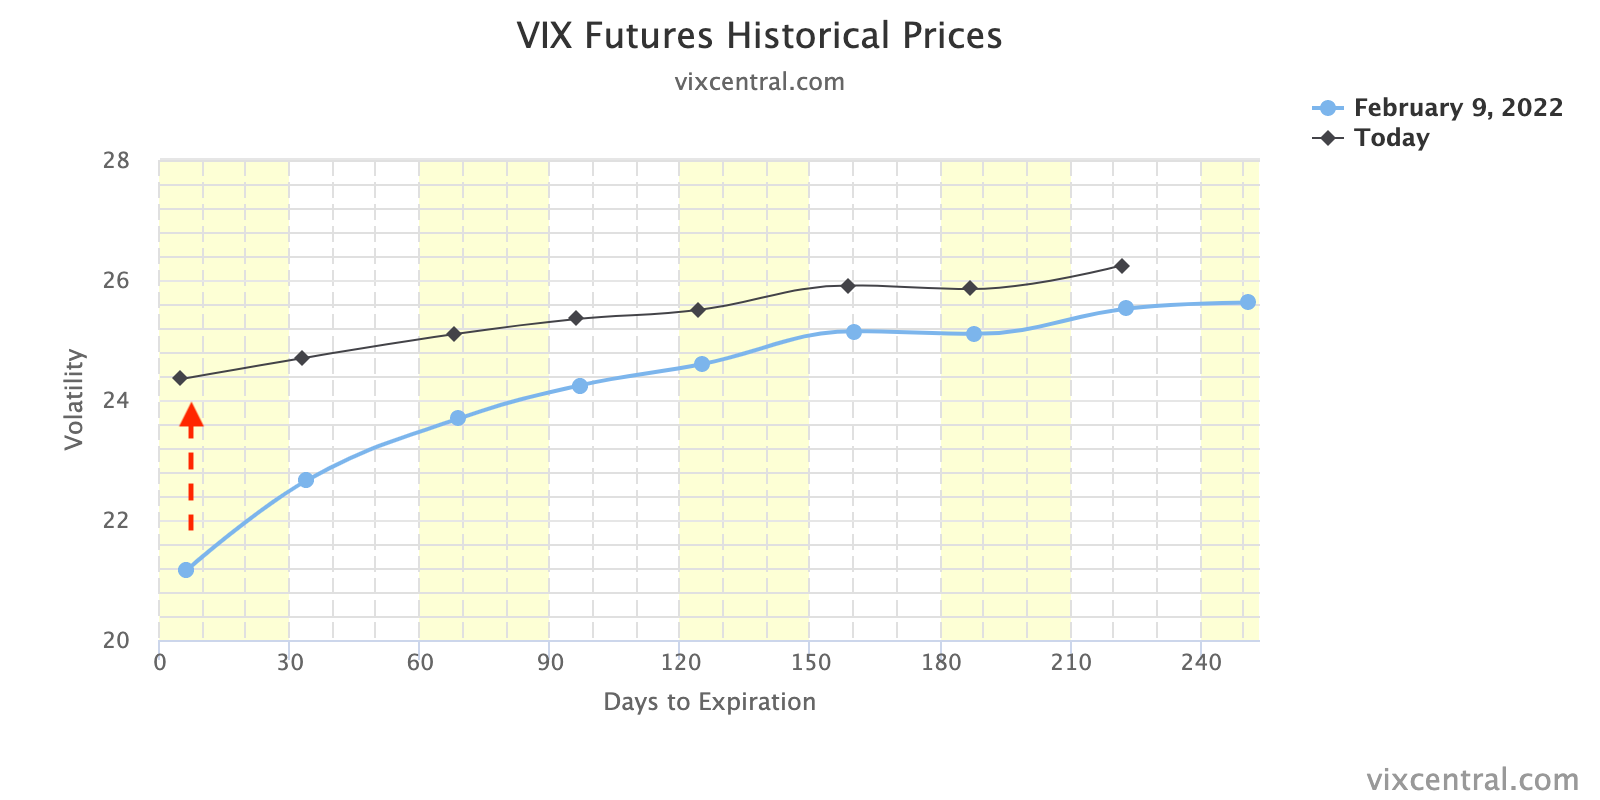
However, Thursday’s post-CPI trade disrupted the balance of trade; lower prices and demand for protection, in the face of lower levels of “on-screen liquidity,” solicited dealer selling to hedge increased exposure to the positive delta from demanded short-dated, highly convex options.
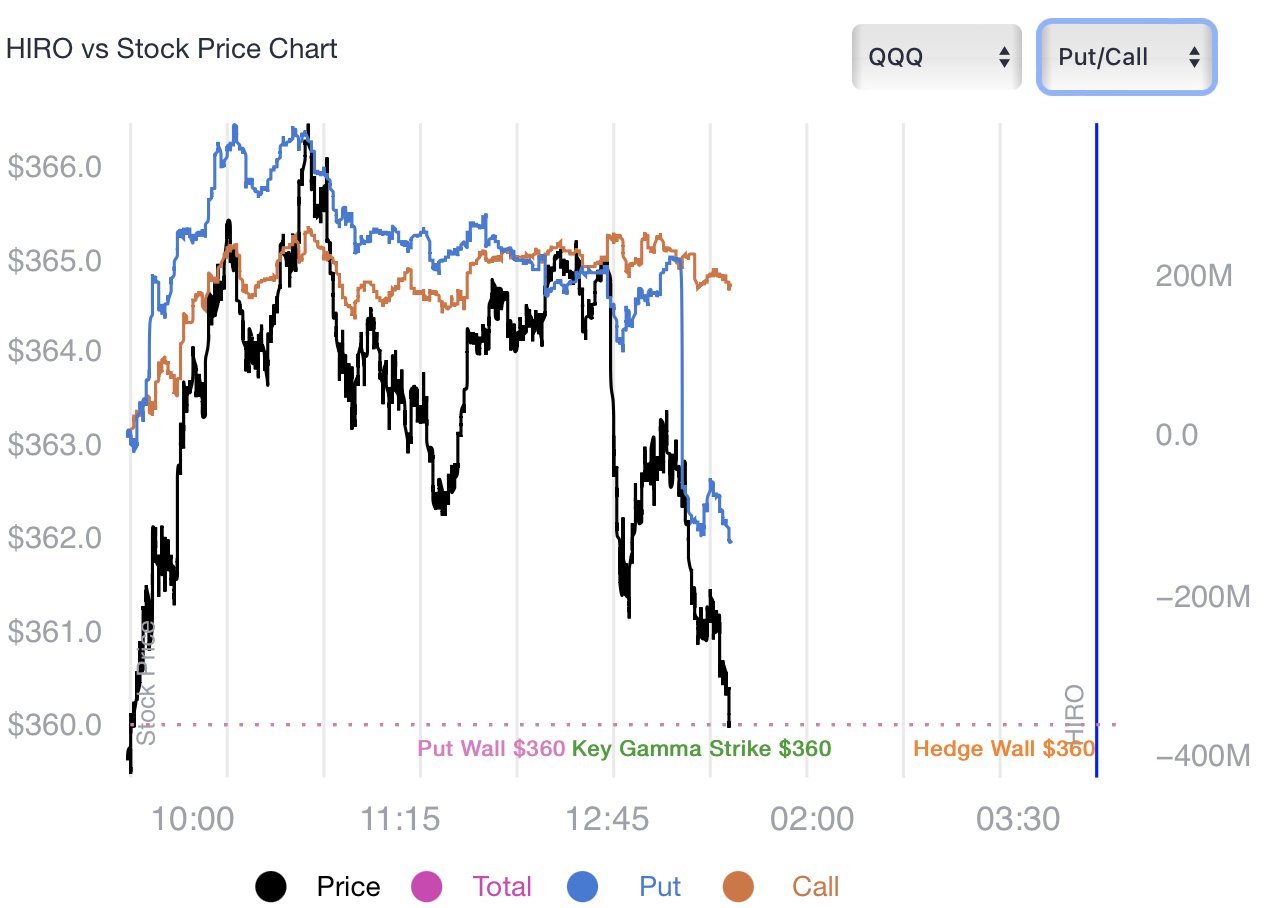
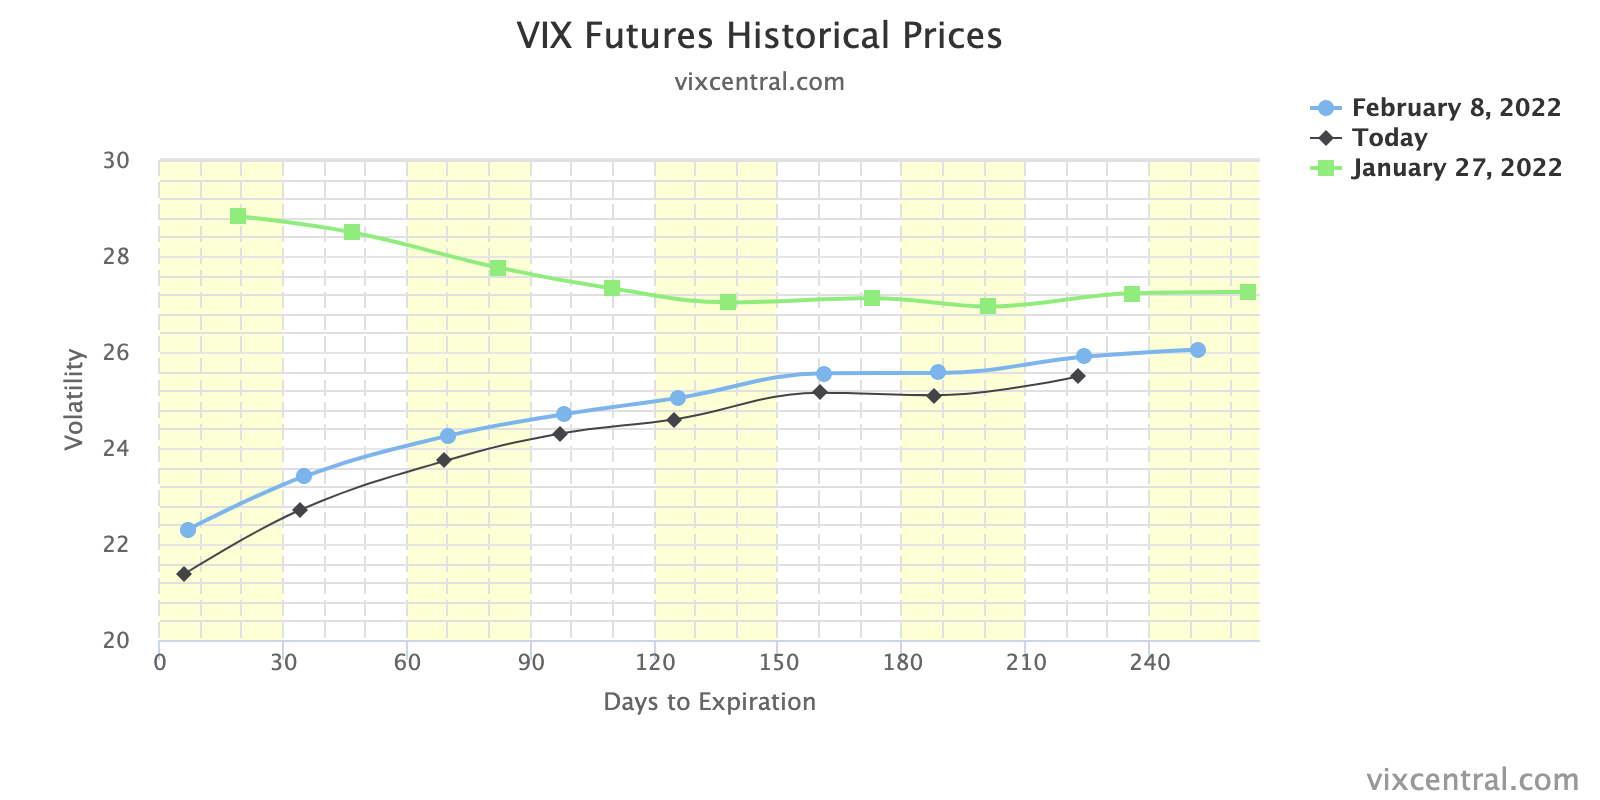
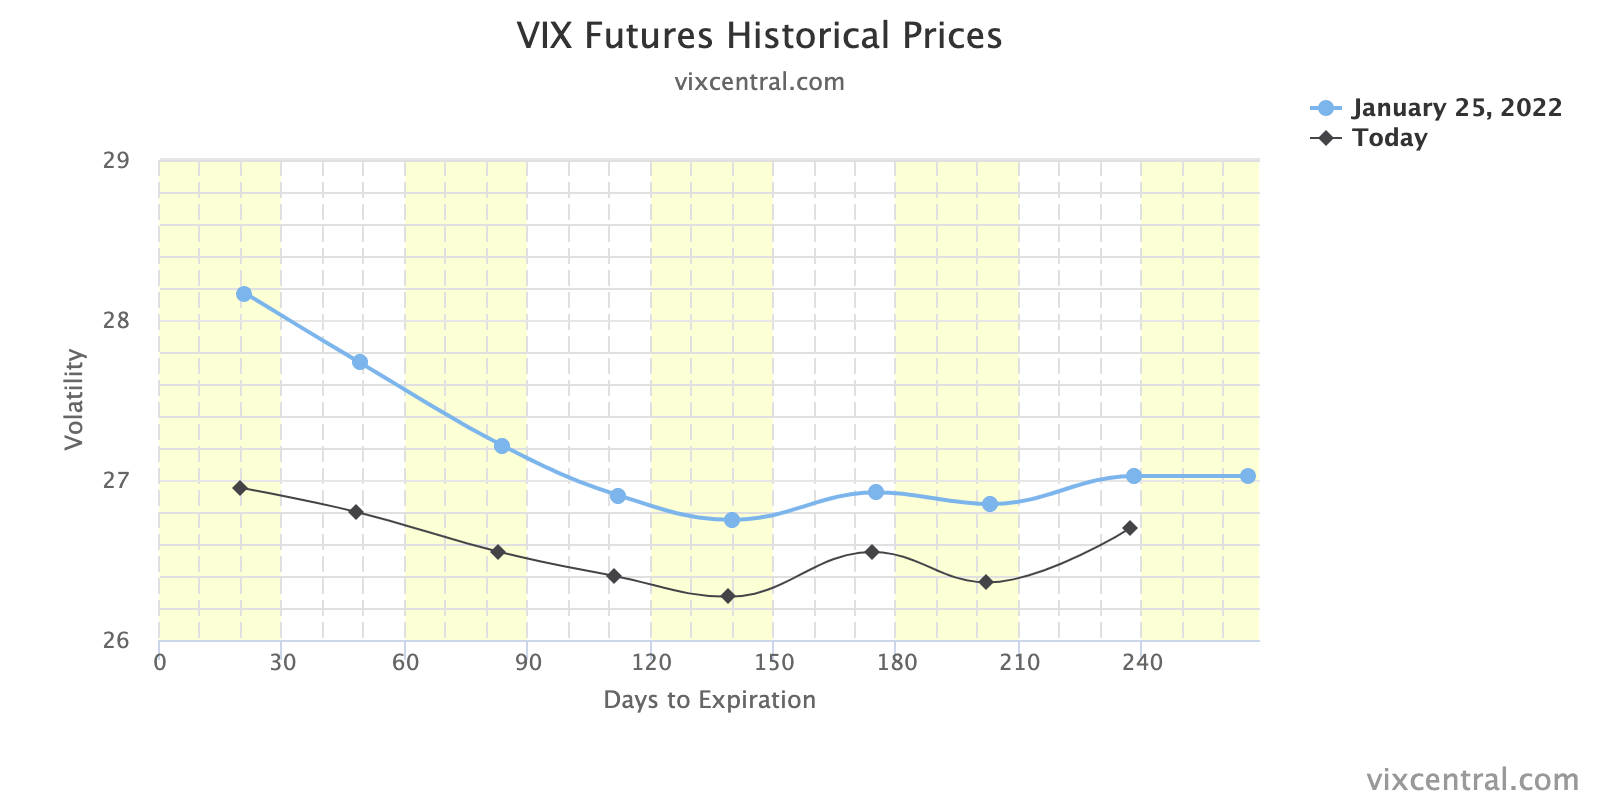
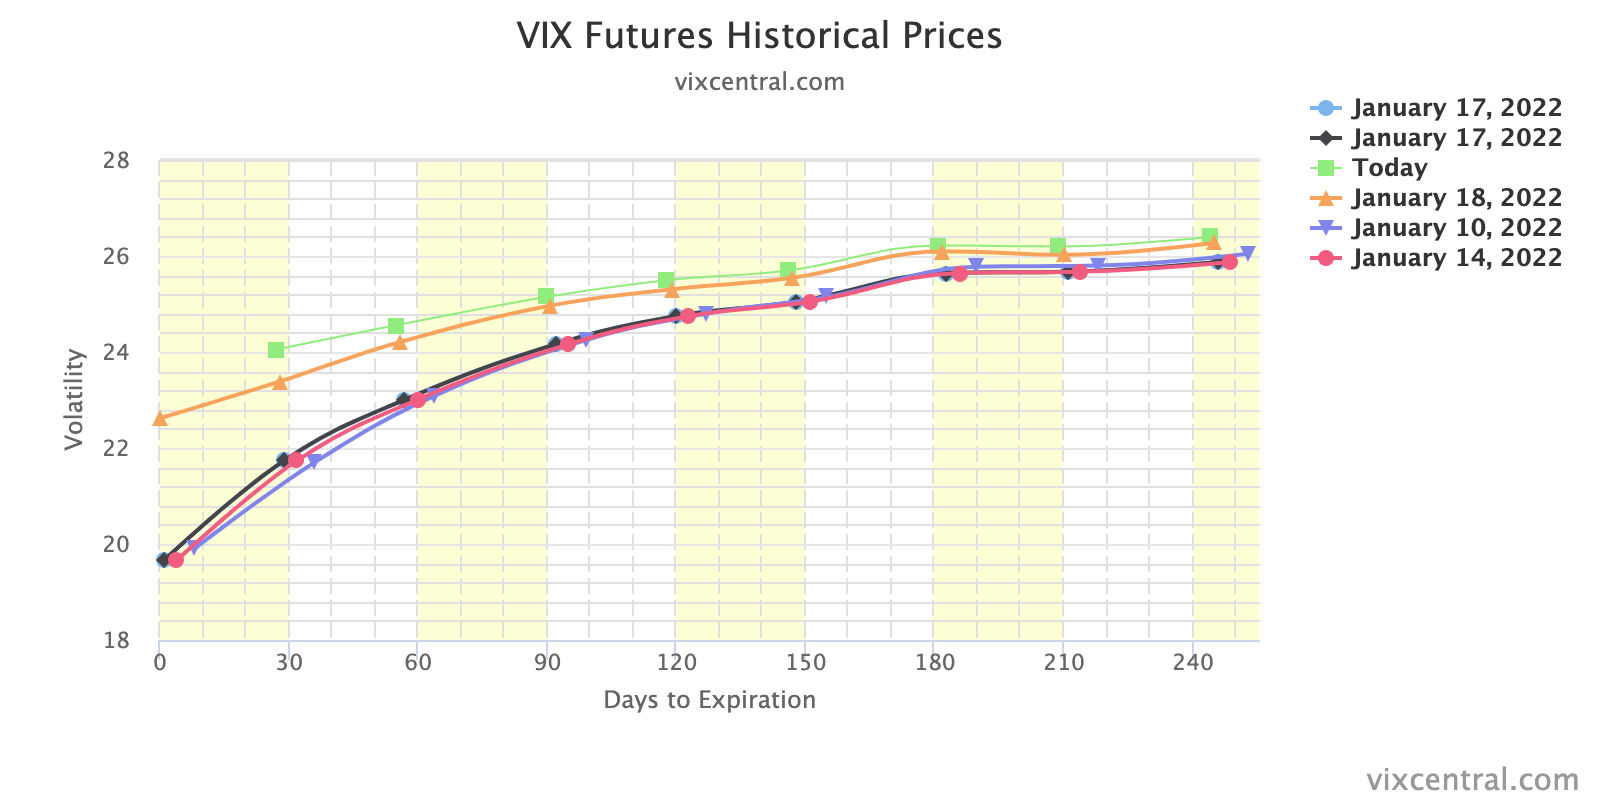
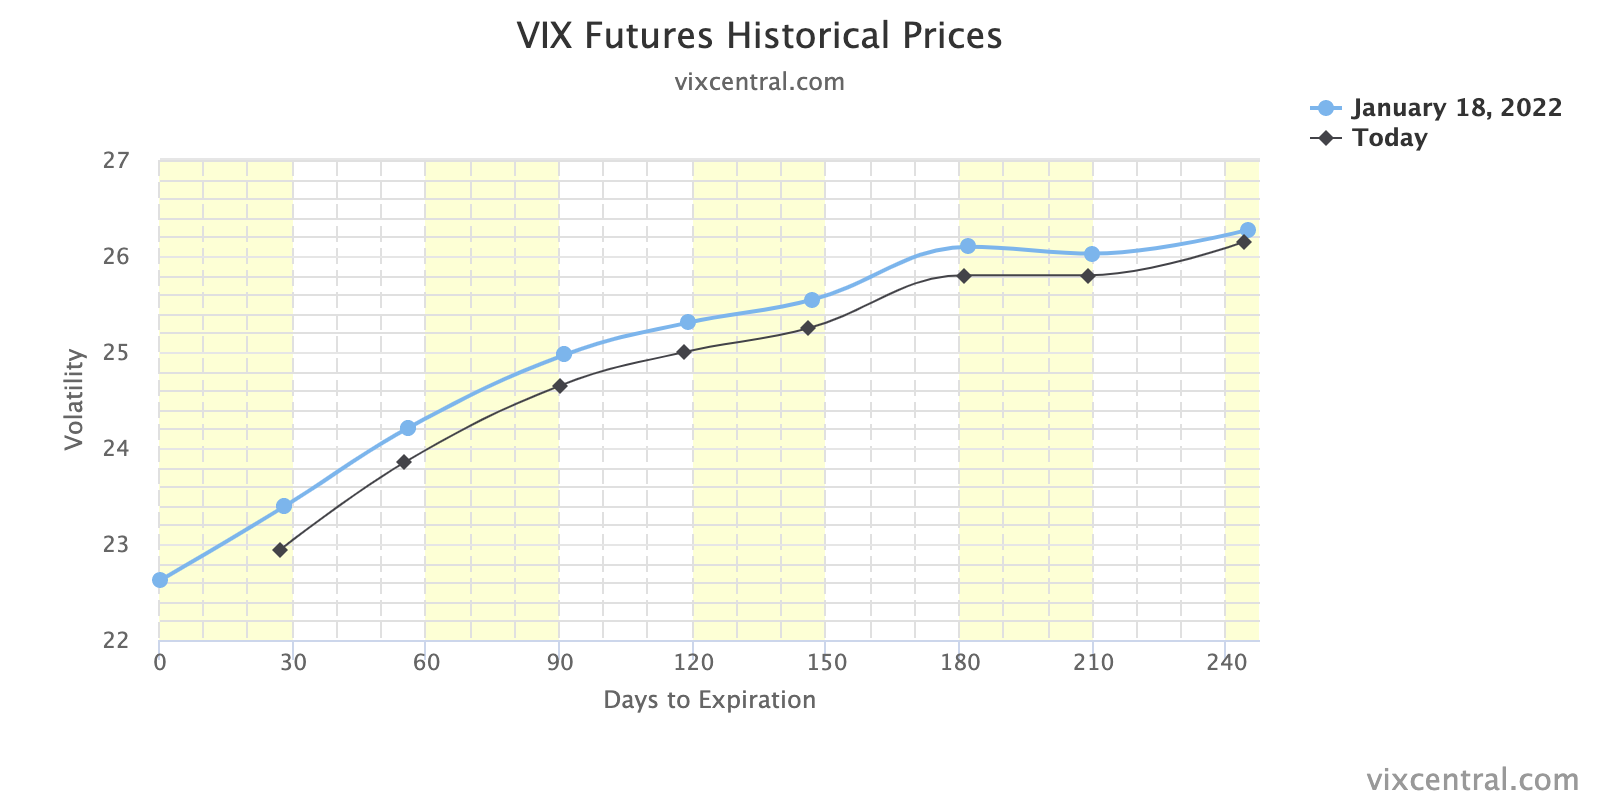
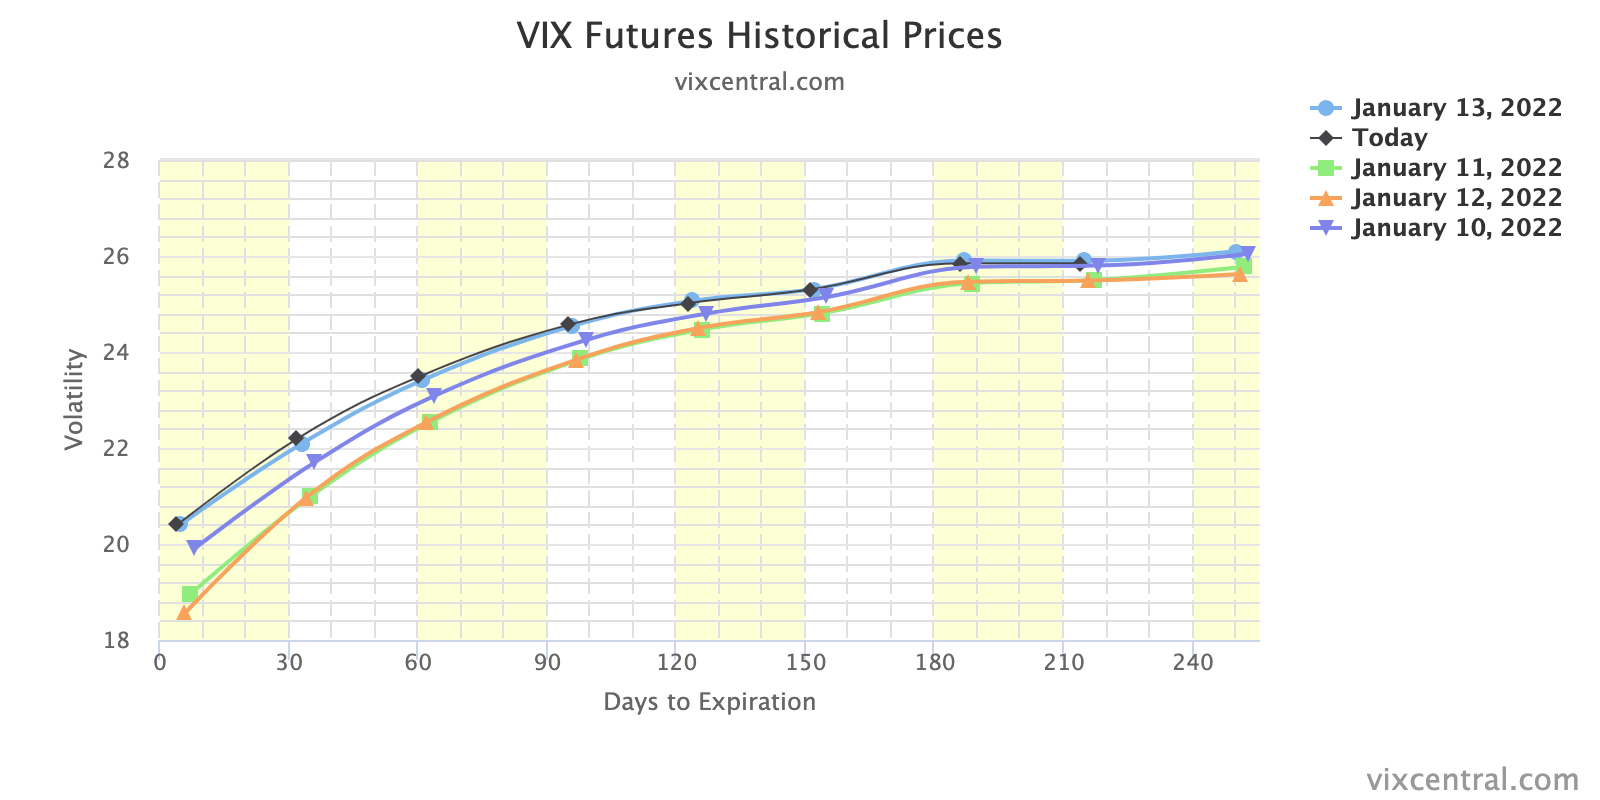
The demand for shorter-dated protection is better visualized by the VIX term structure which shifted markedly at the front-end, yesterday.
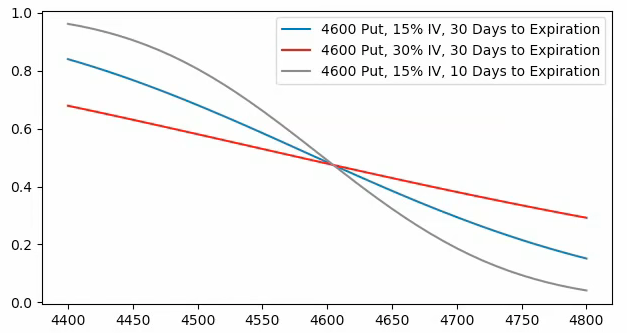
As direction (delta) and volatility (vega) are inputs to the pricing of options, lower prices and higher volatility (a reflection of fear and demand for protection) will mark options higher. Hedging pressures will exacerbate weakness, as a result of real selling (as talked about above), at the index and single-stock level.

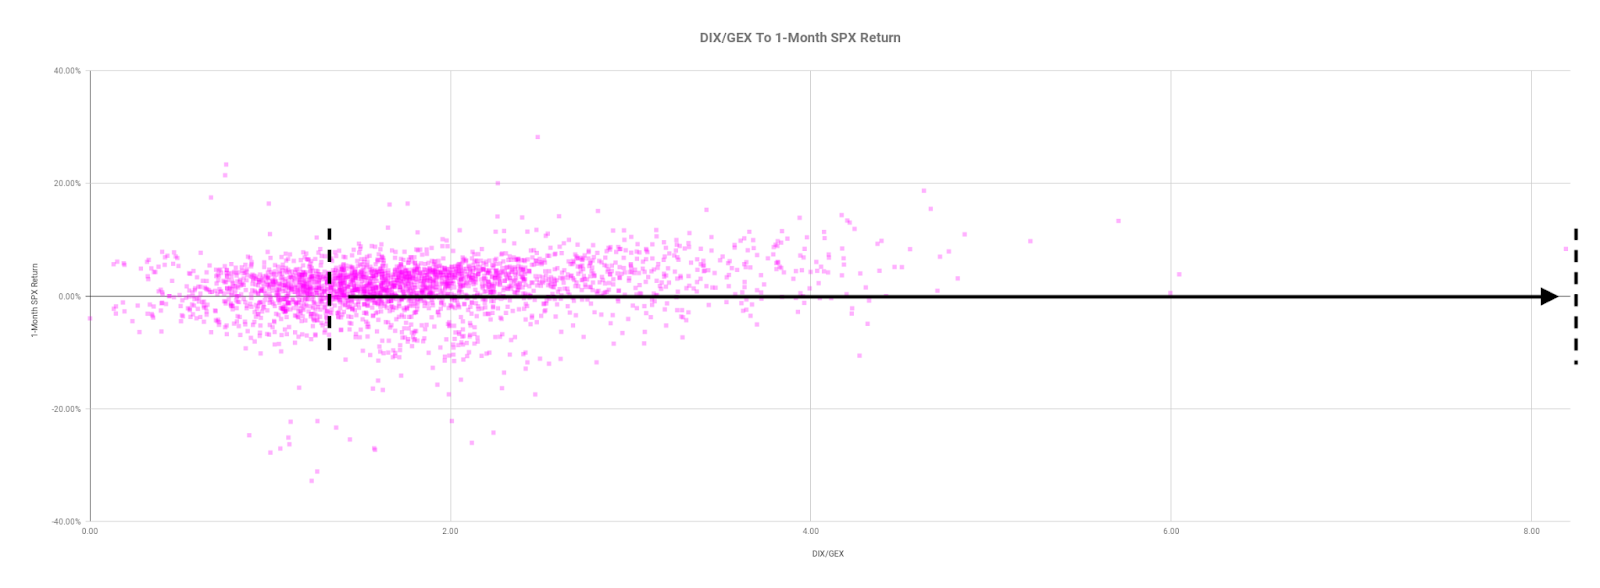
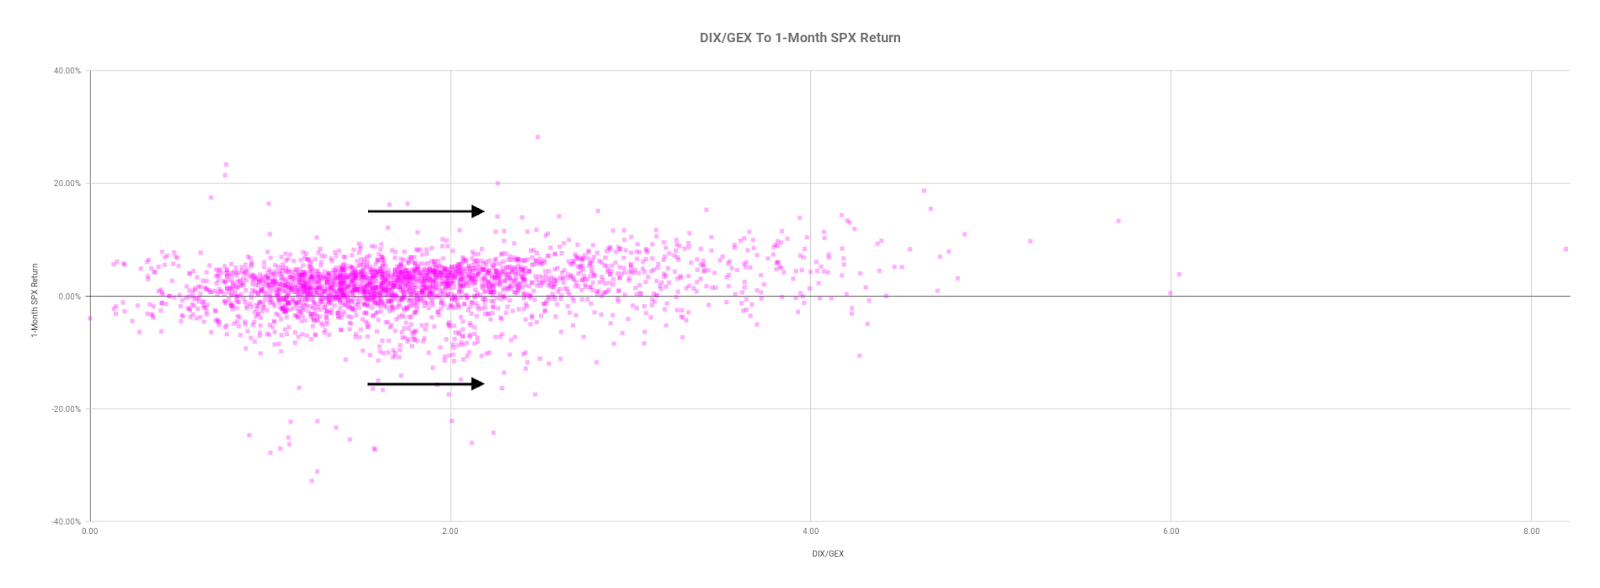
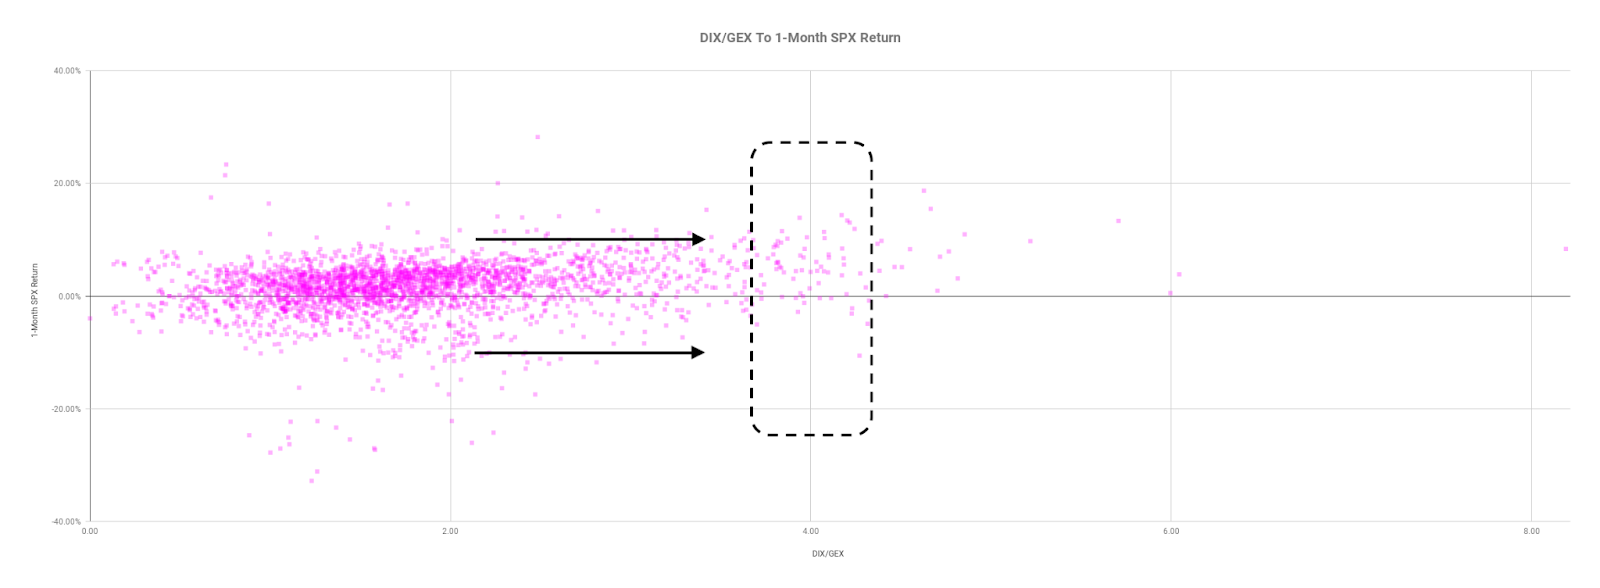
Taking into account options positioning, versus buying pressure (measured via short sales or liquidity provision on the market-making side), positioning metrics remain positively skewed.
To conclude, the dip lower and demand for protection could serve to prime the market for upside (when volatility starts to compress again and counterparties unwind hedges thus supporting any attempt higher). All eyes are on next week’s monthly options expiration (OPEX). We will discuss the implications of this, later.
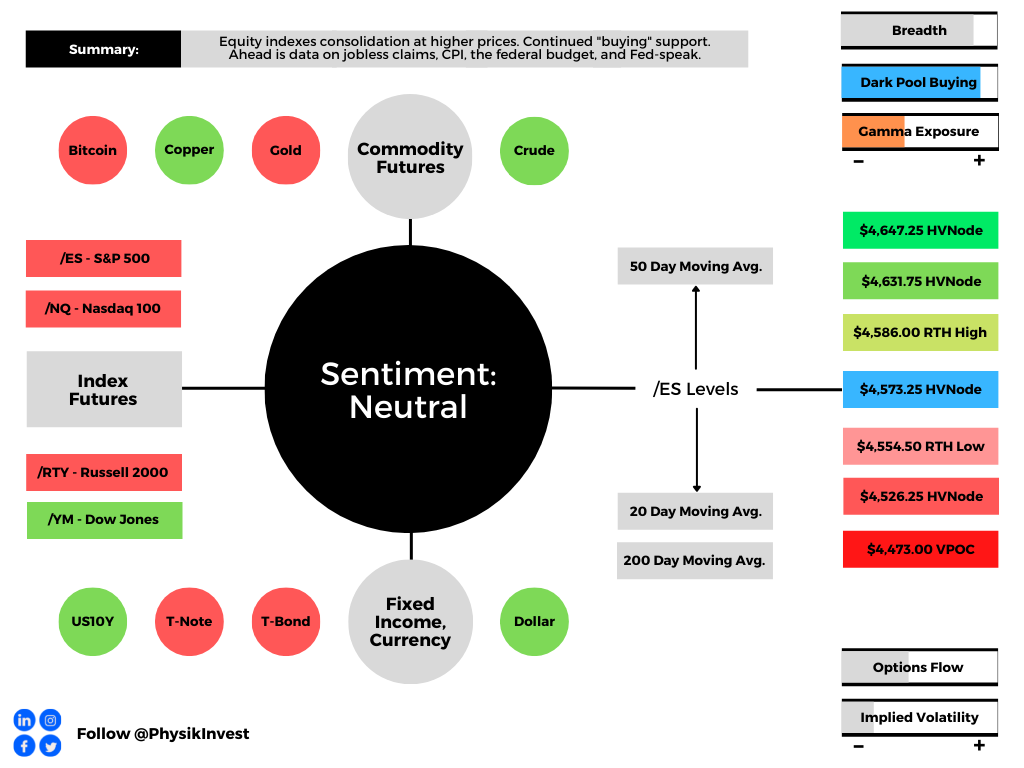
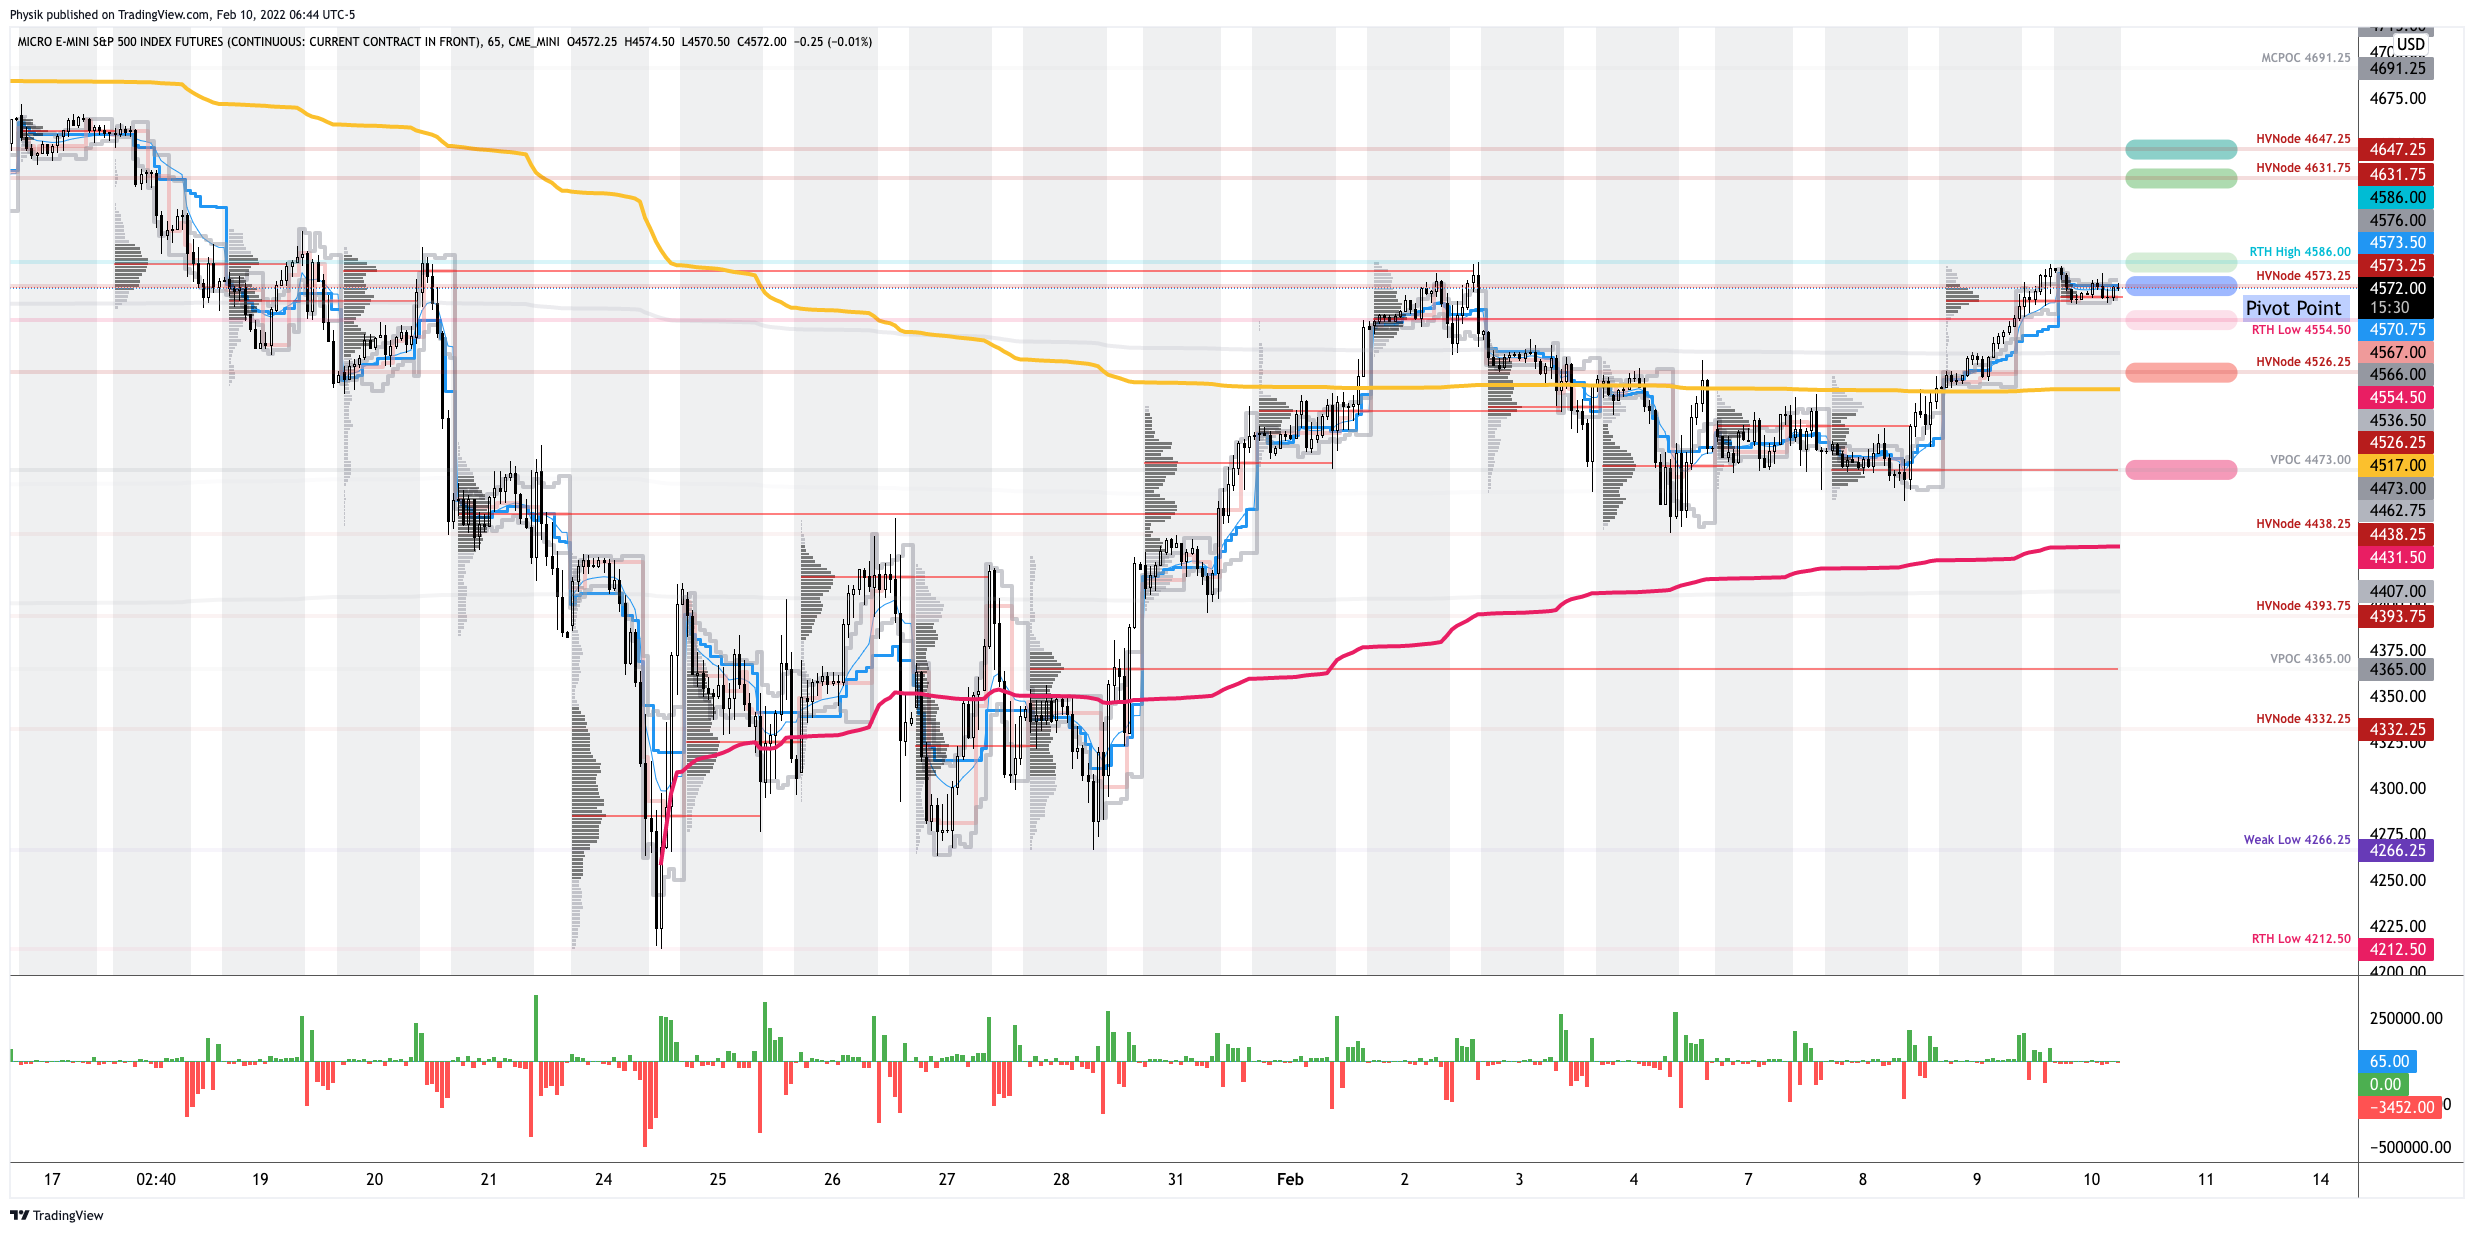
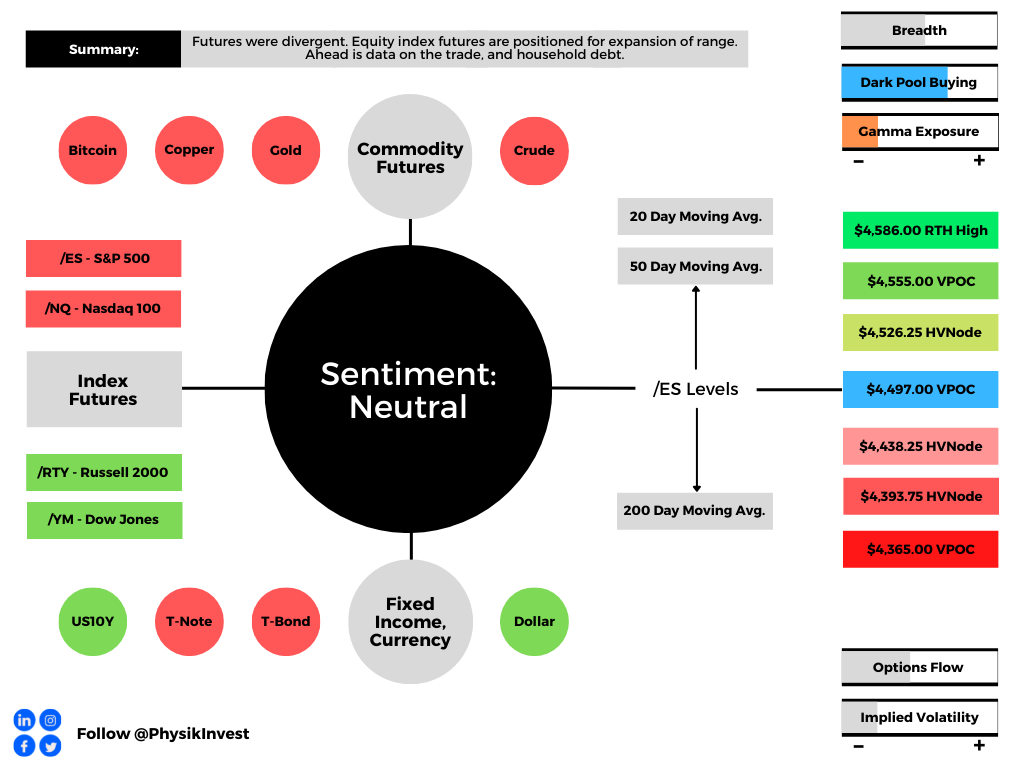
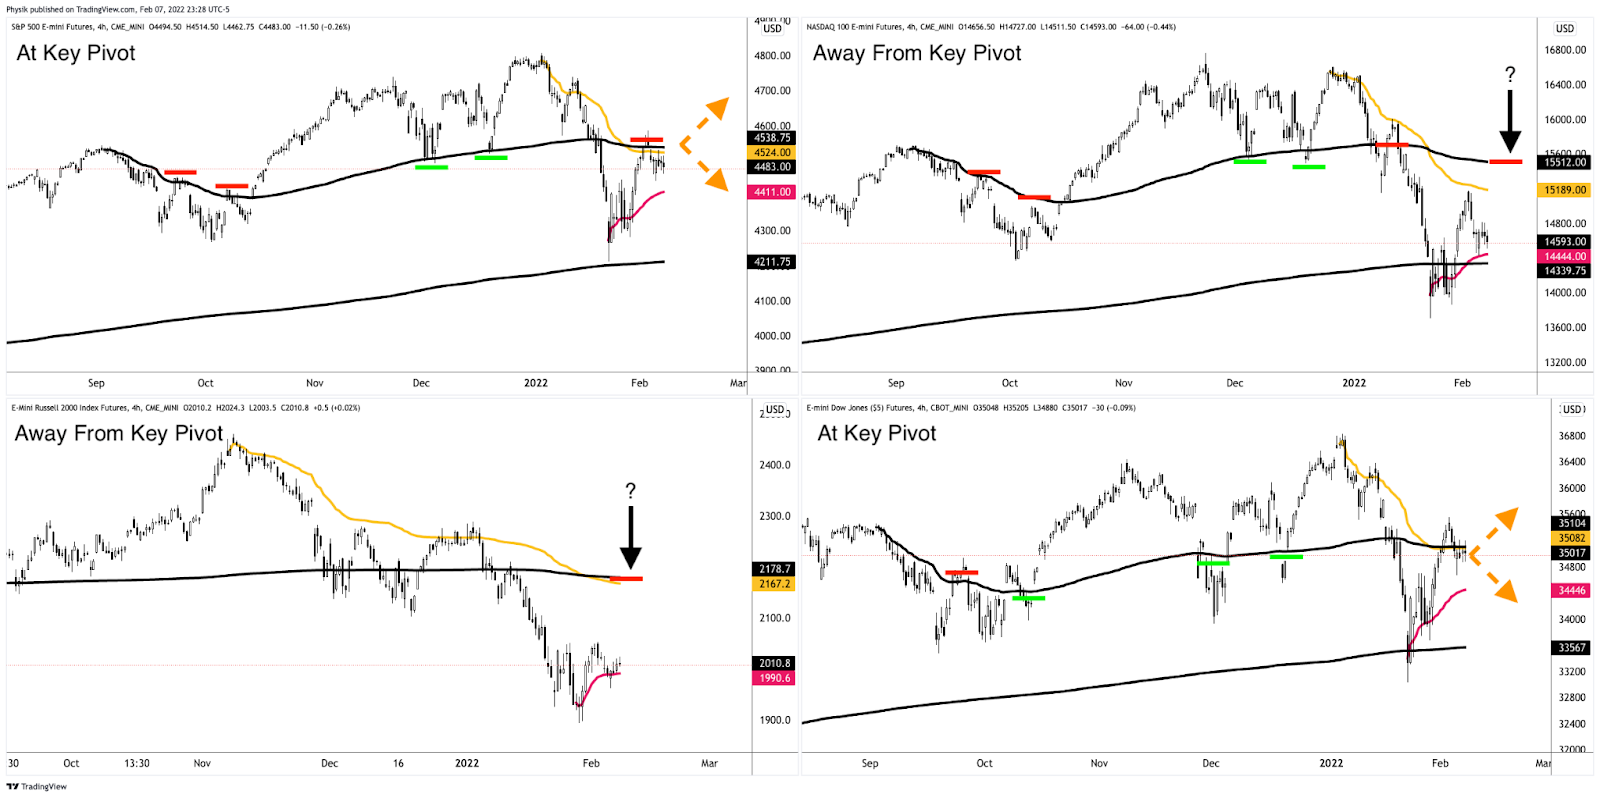
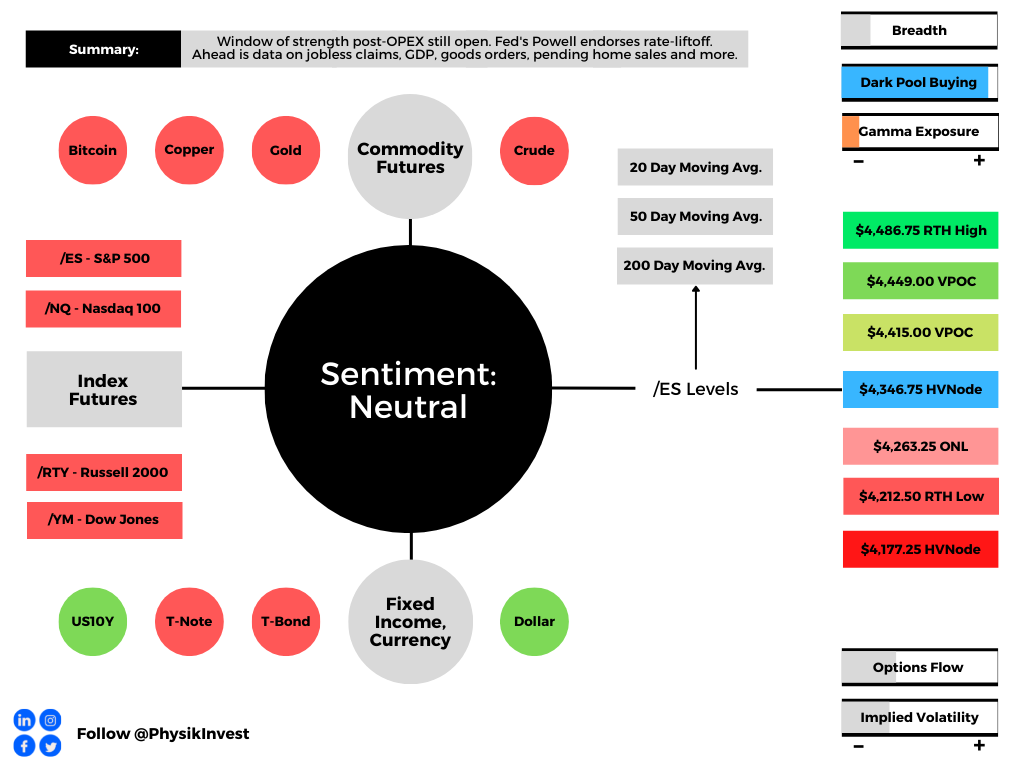
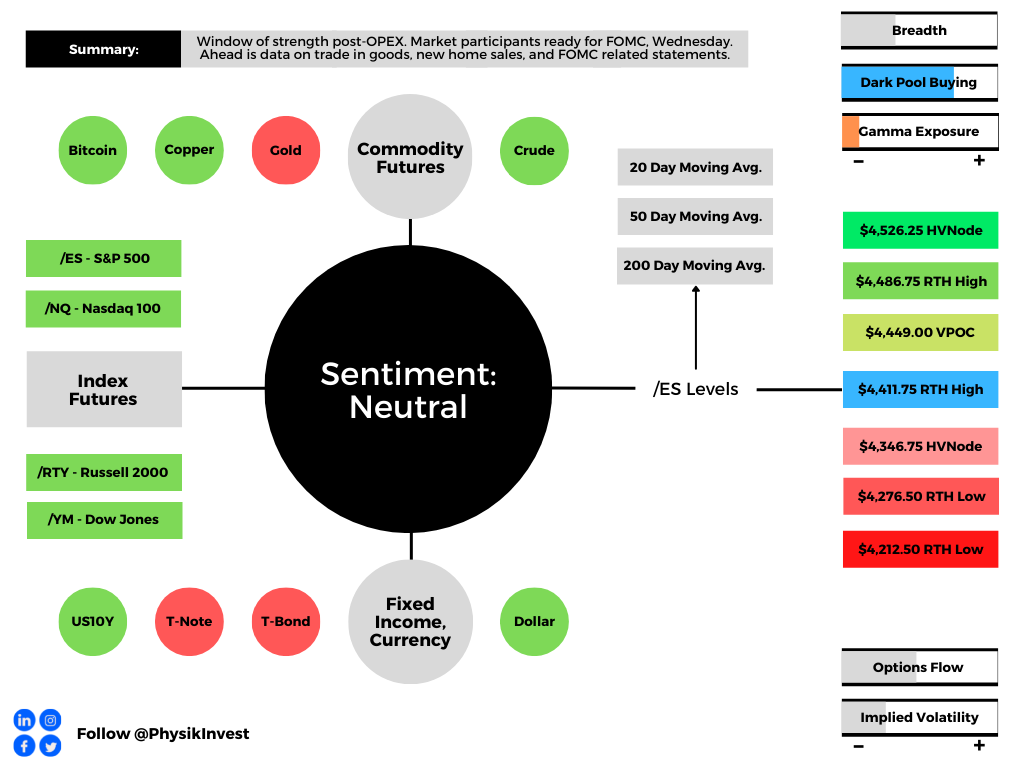
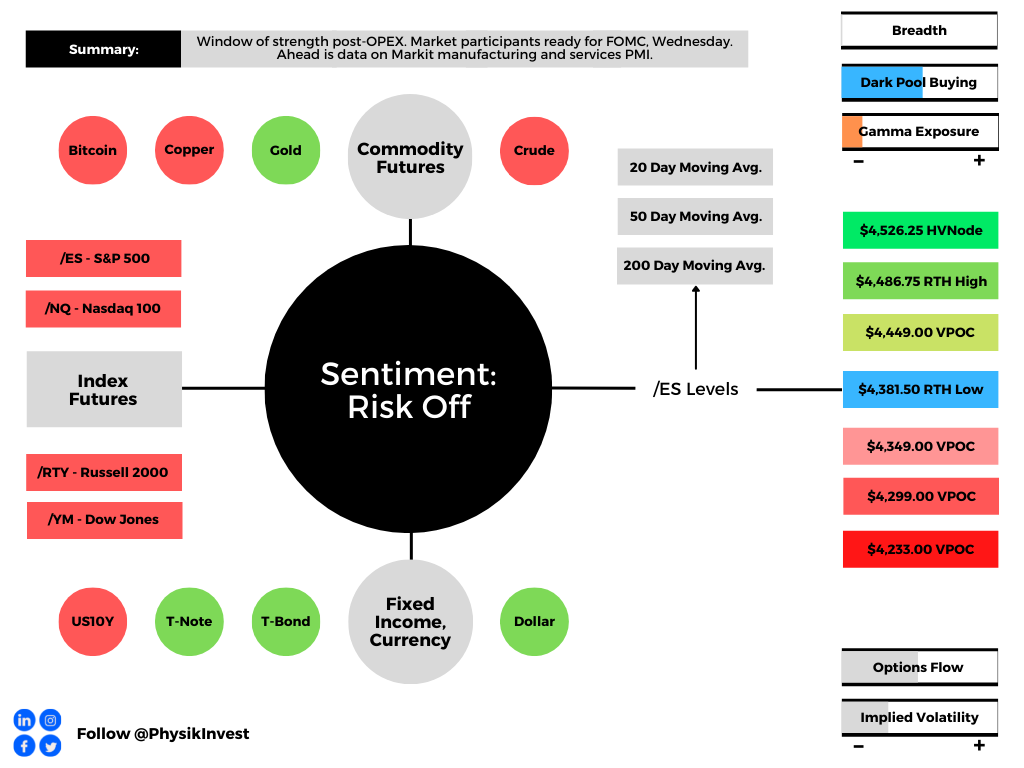
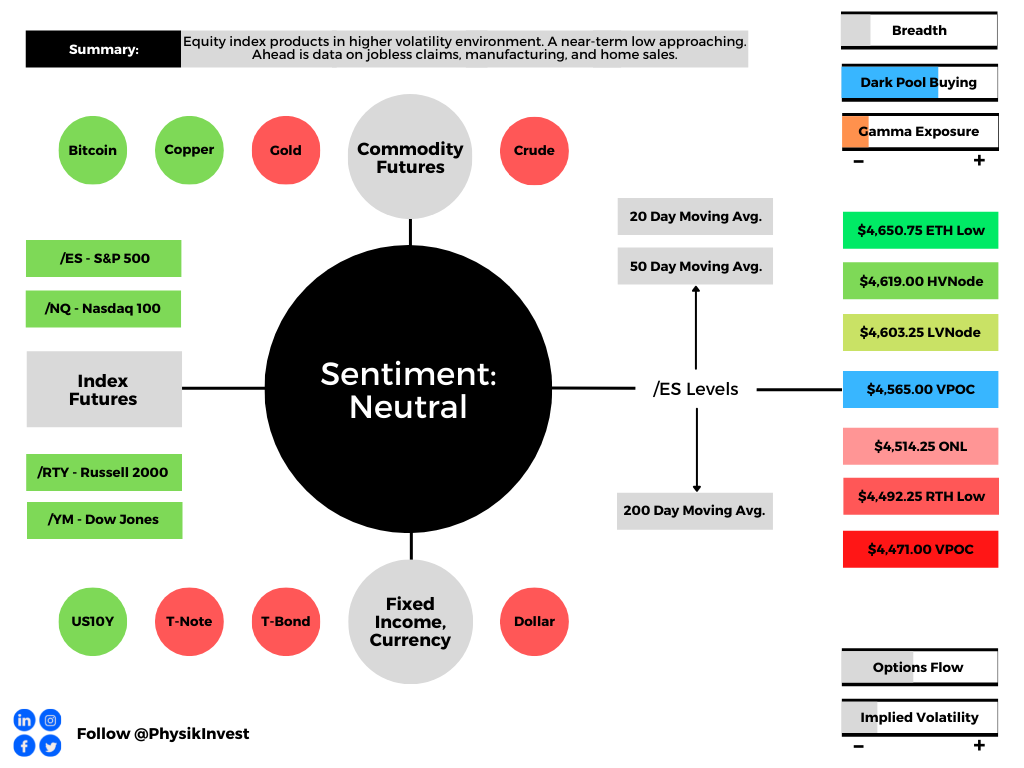
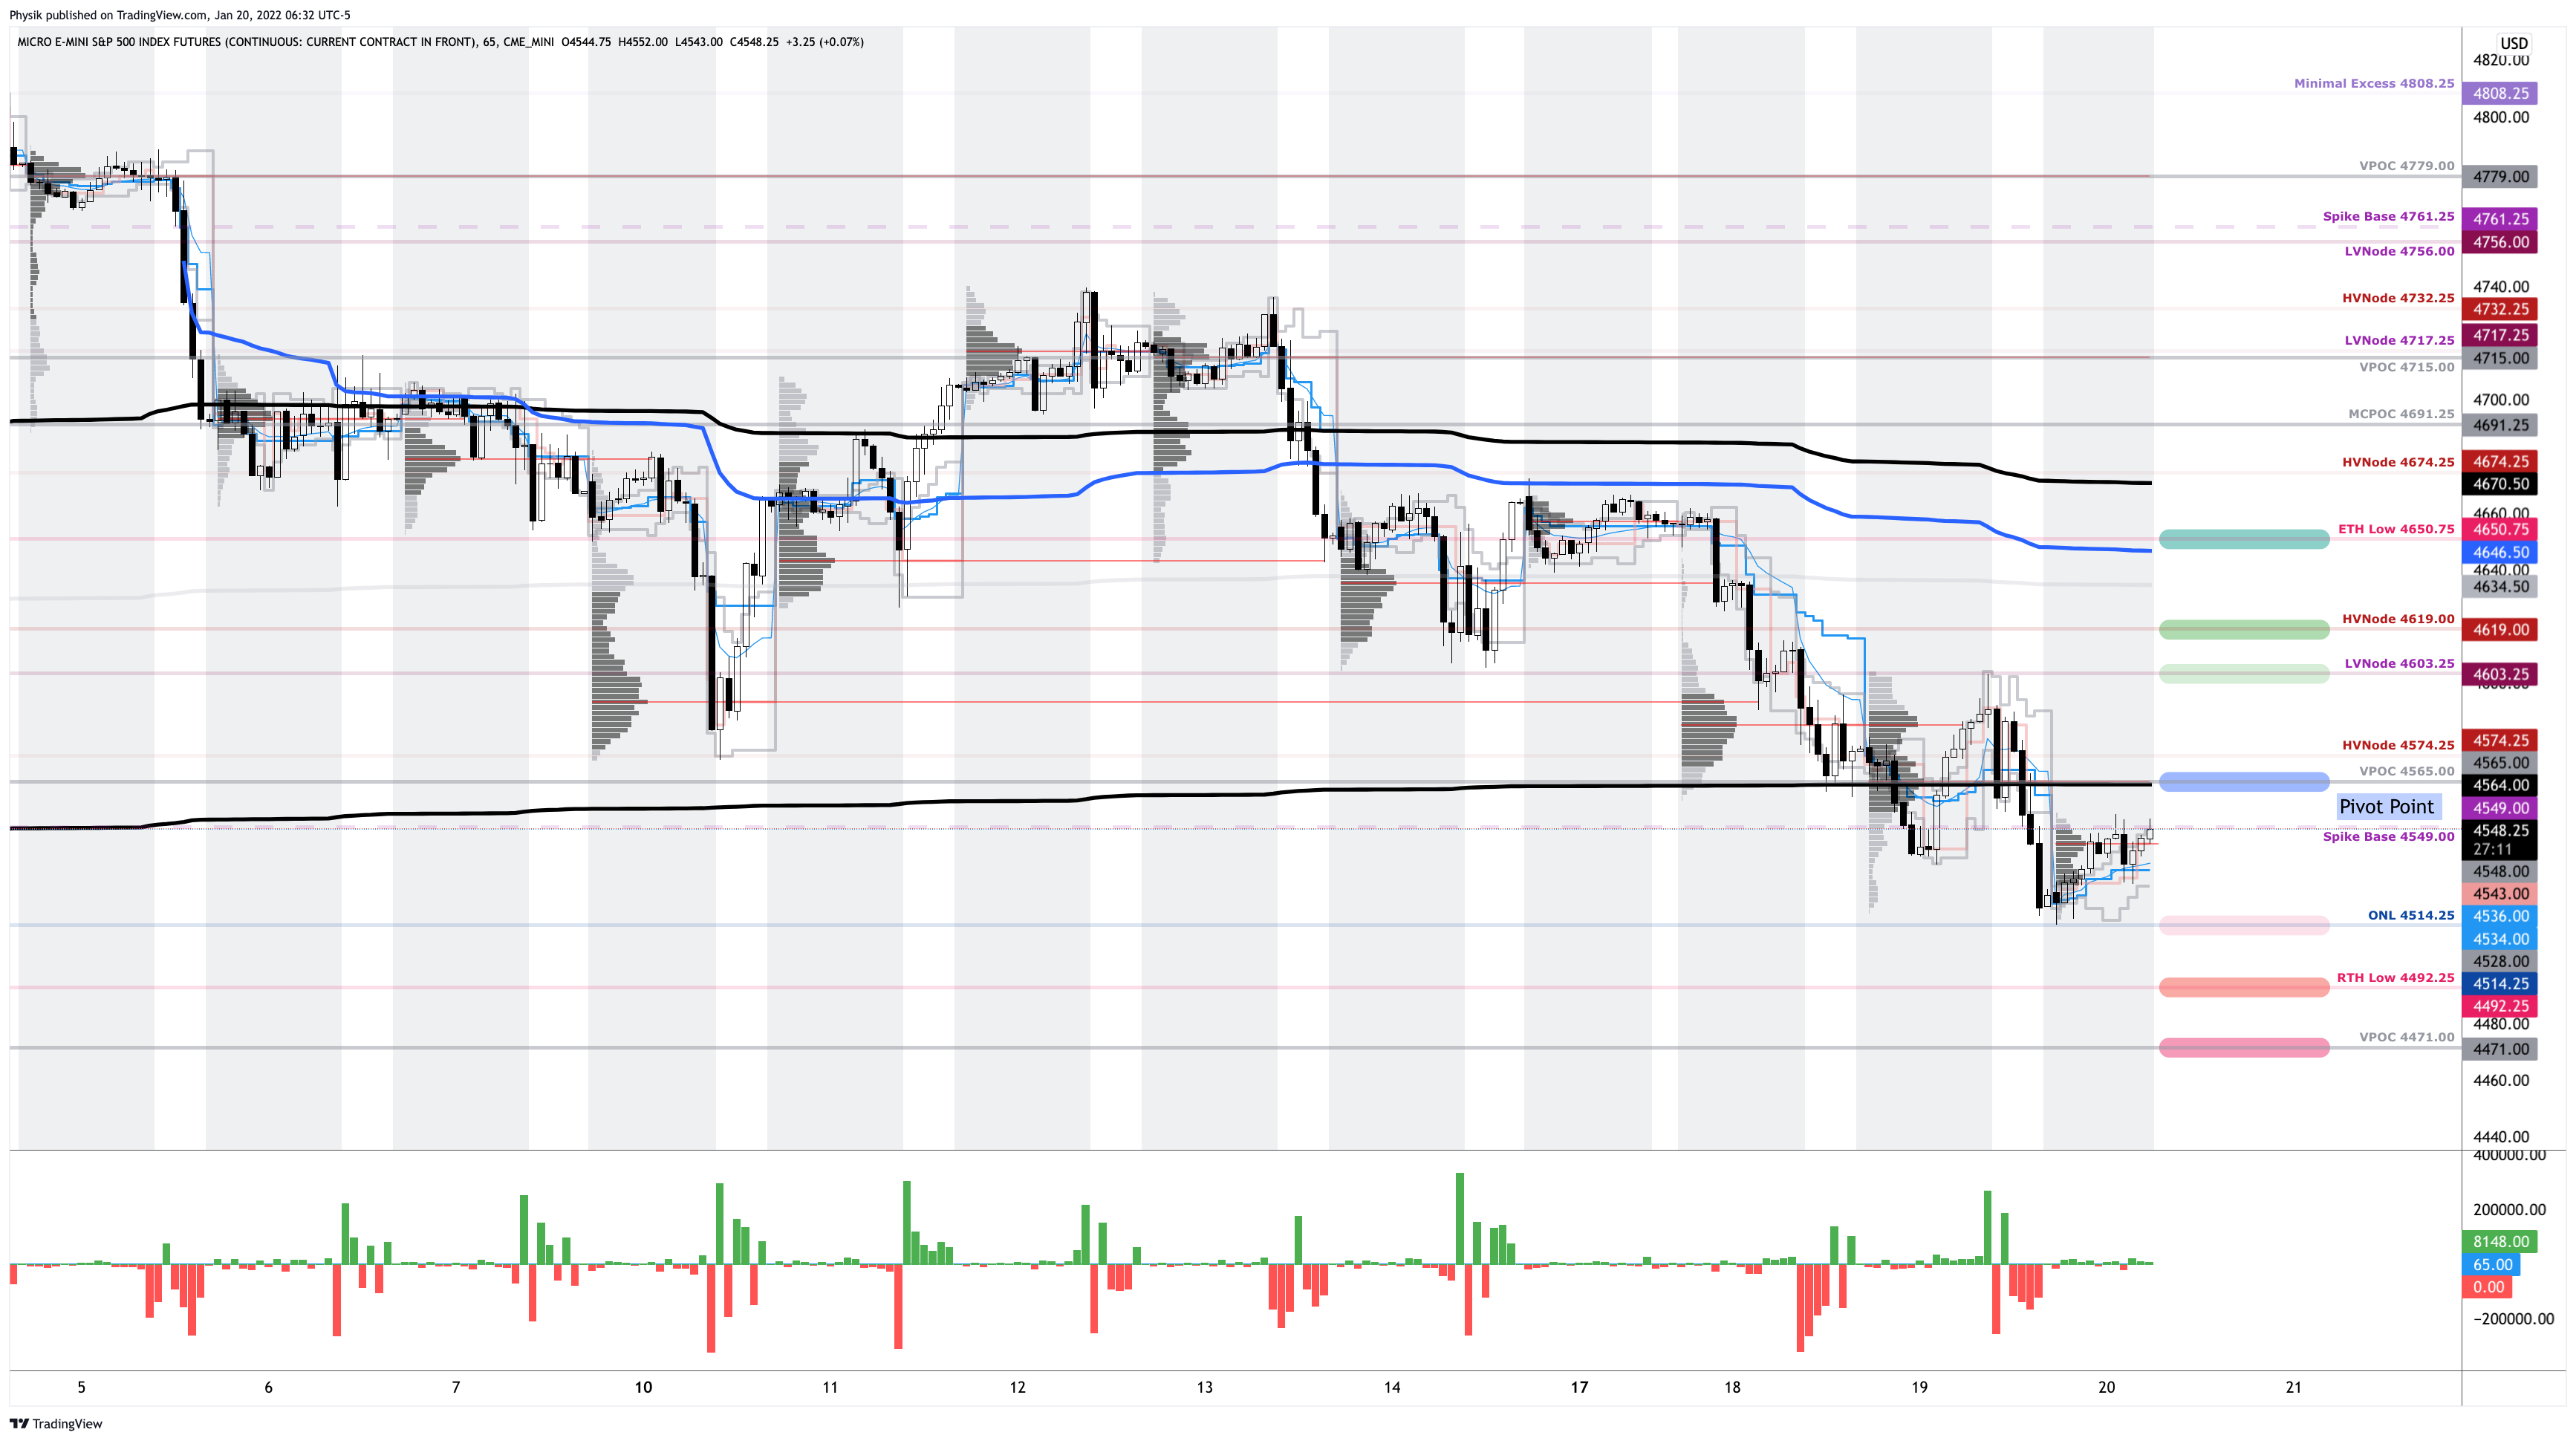
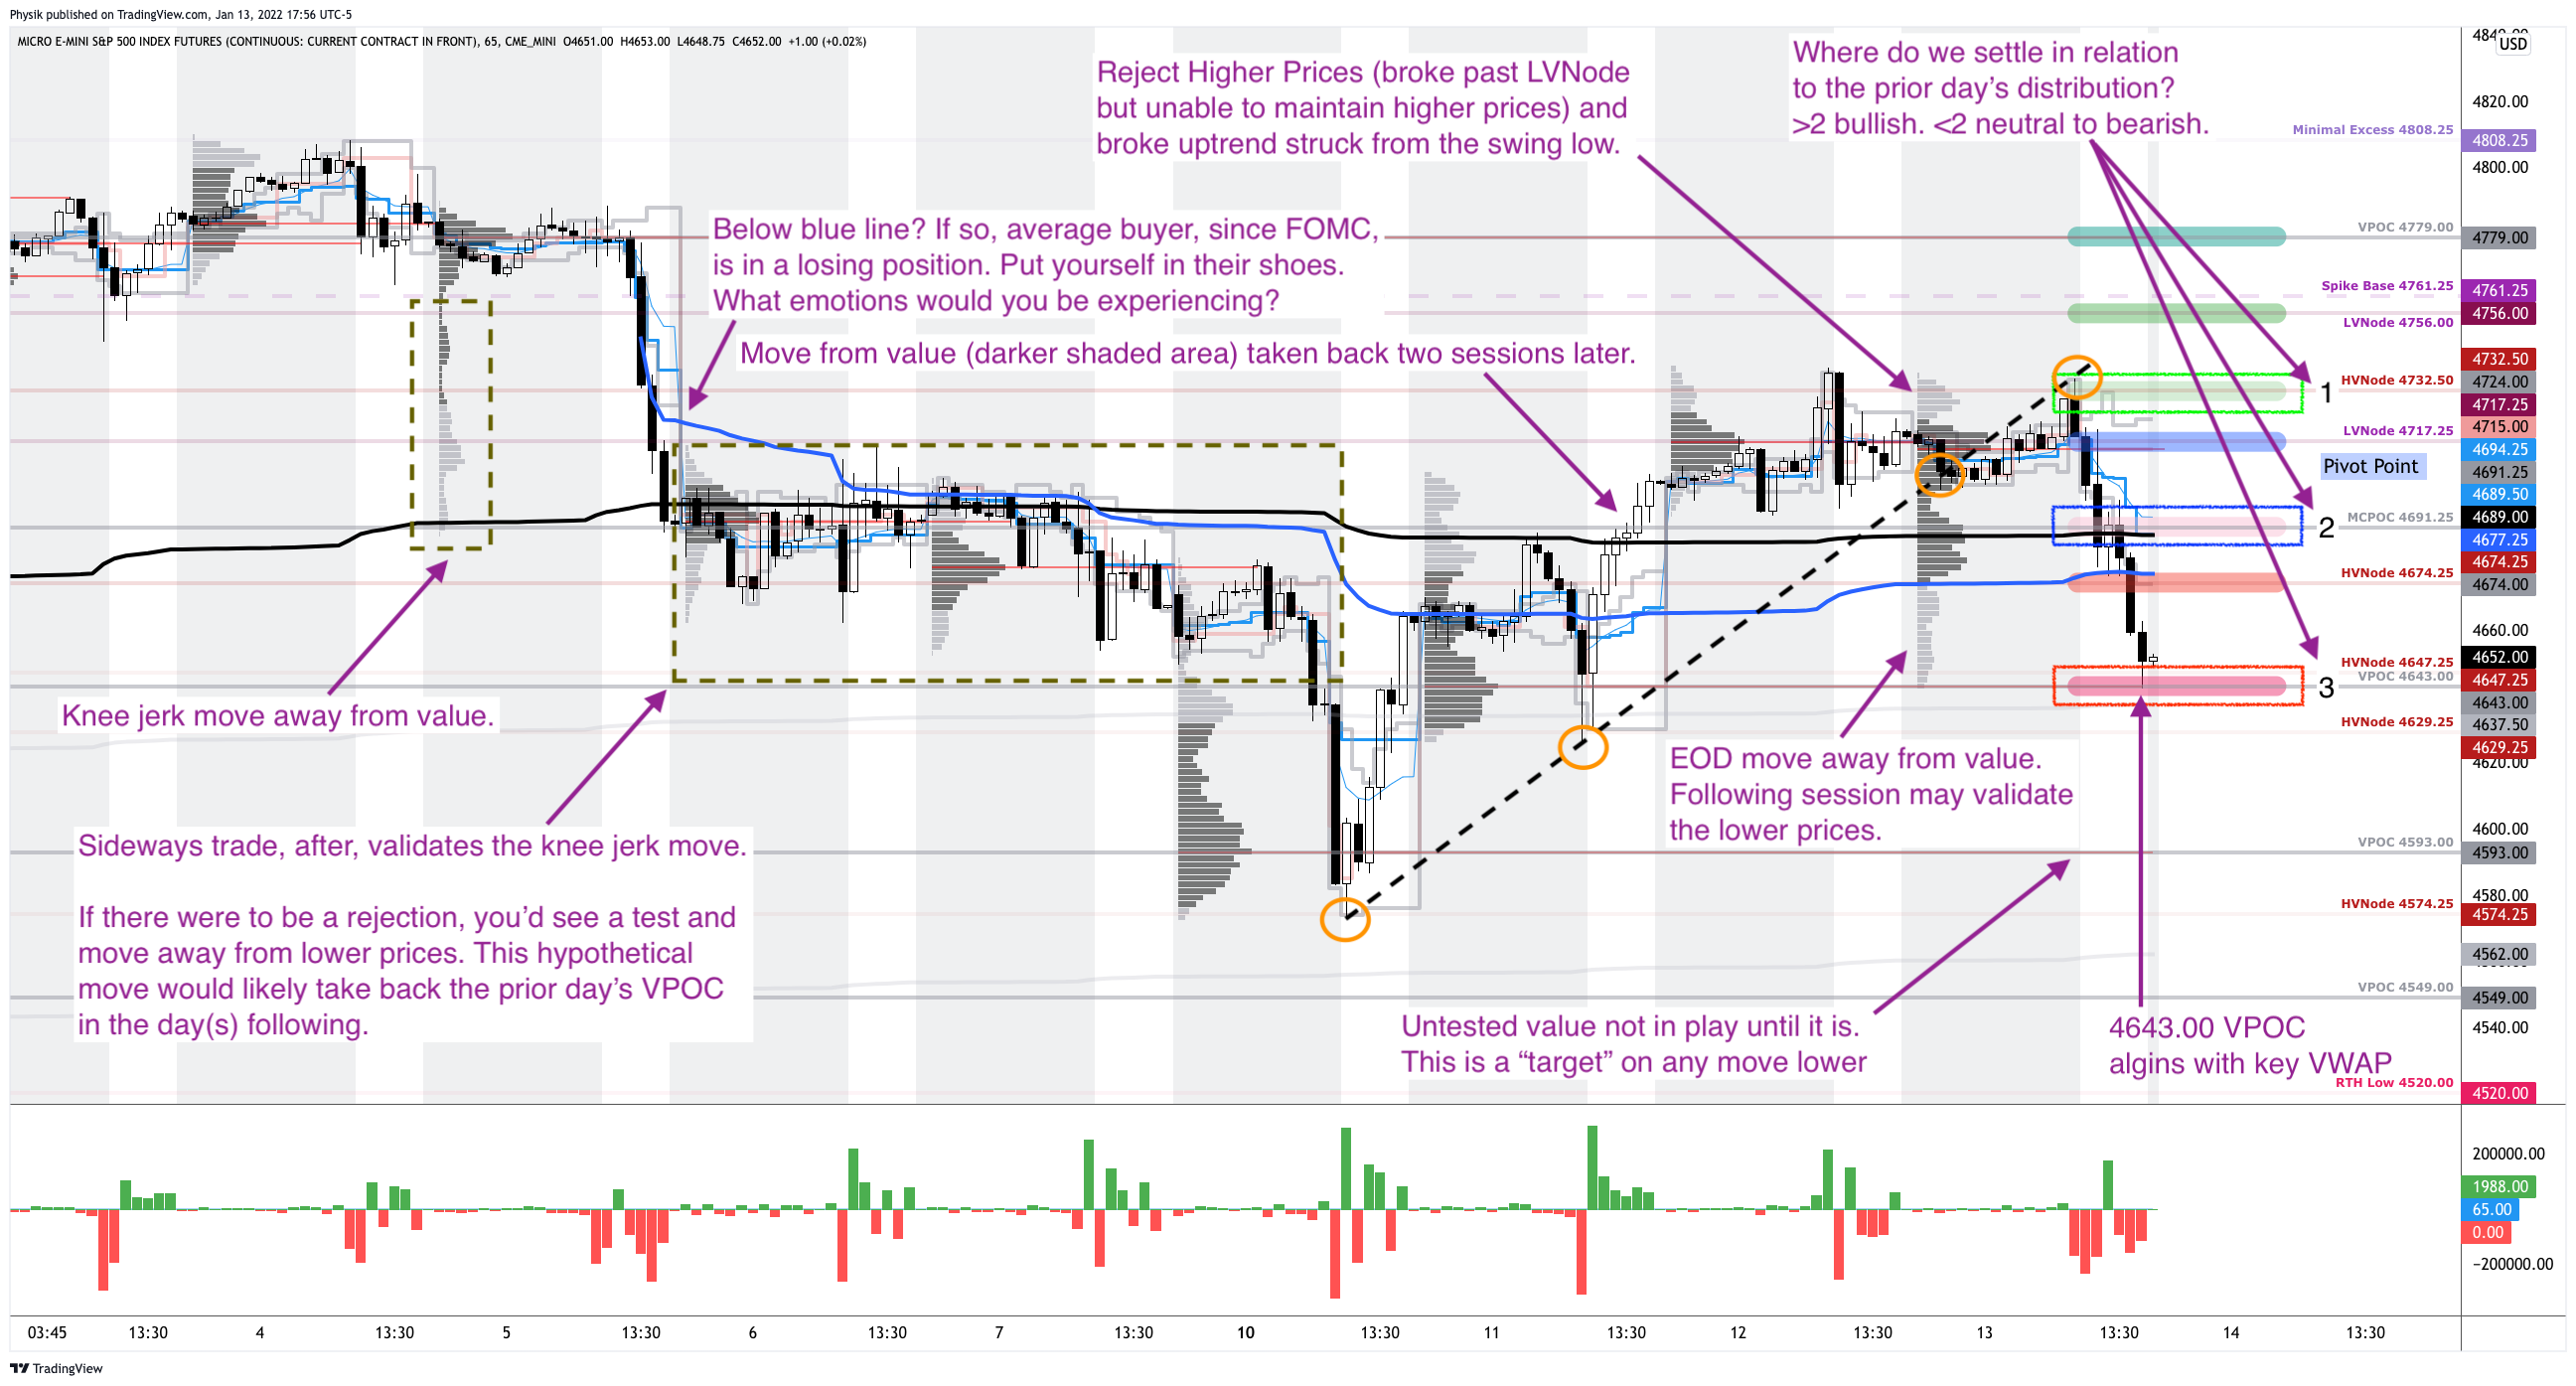
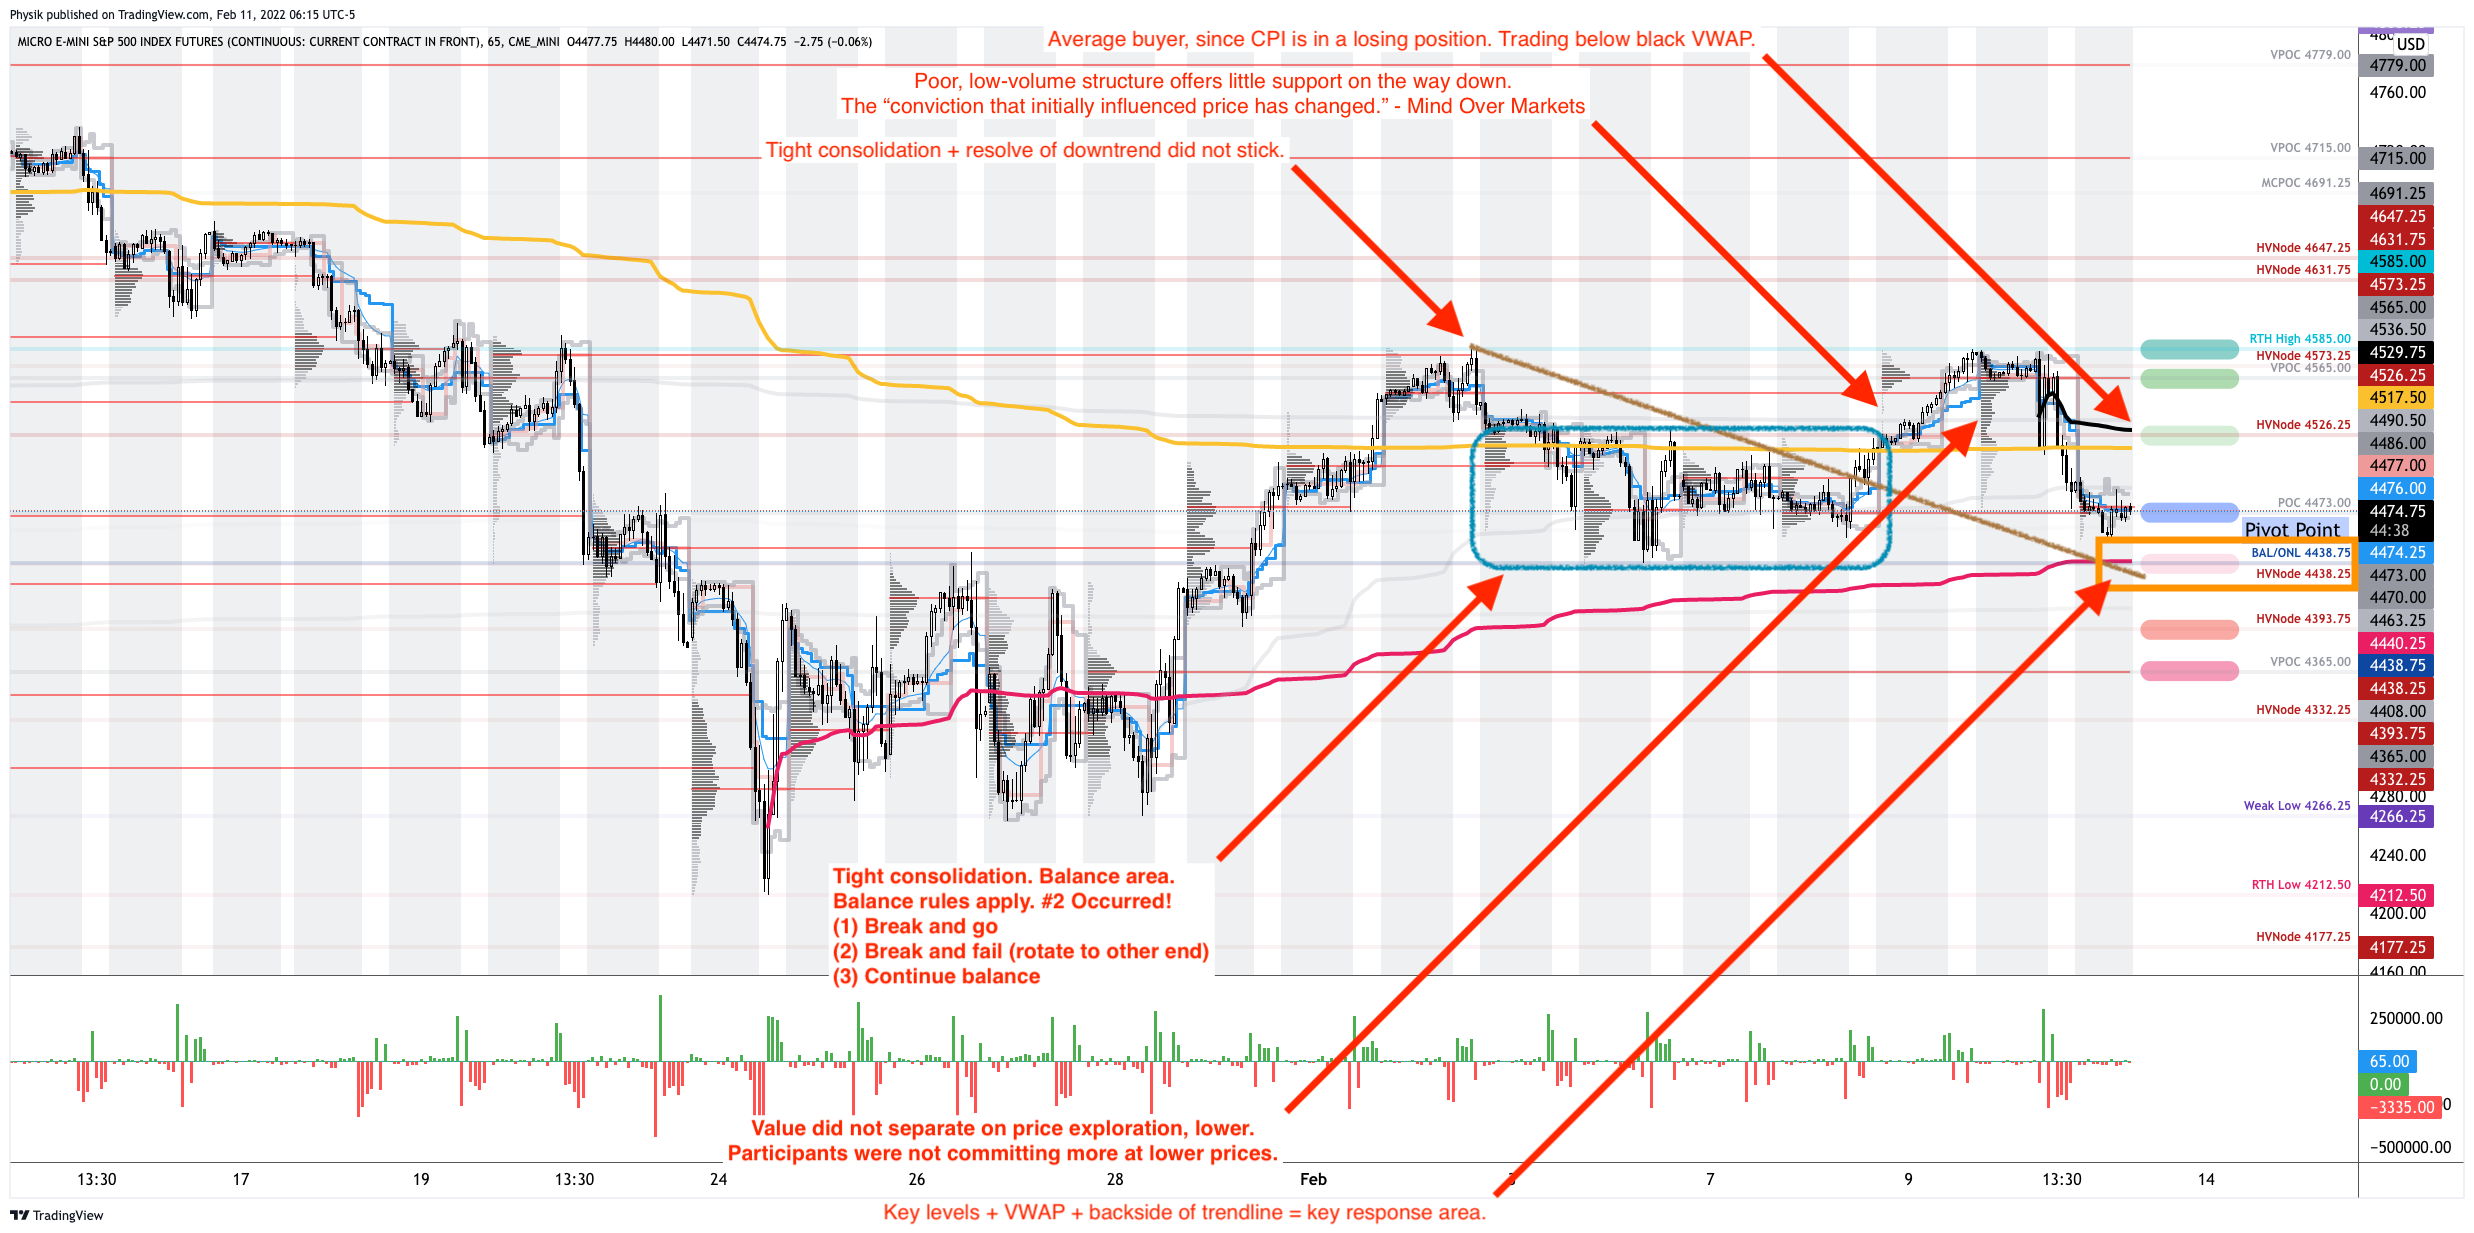
Technical: As of 6:30 AM ET, Friday’s regular session (9:30 AM – 4:00 PM ET), in the S&P 500, will likely open in the middle-to-lower part of a negatively skewed overnight inventory, inside of prior-range and -value, suggesting a limited potential for immediate directional opportunity.
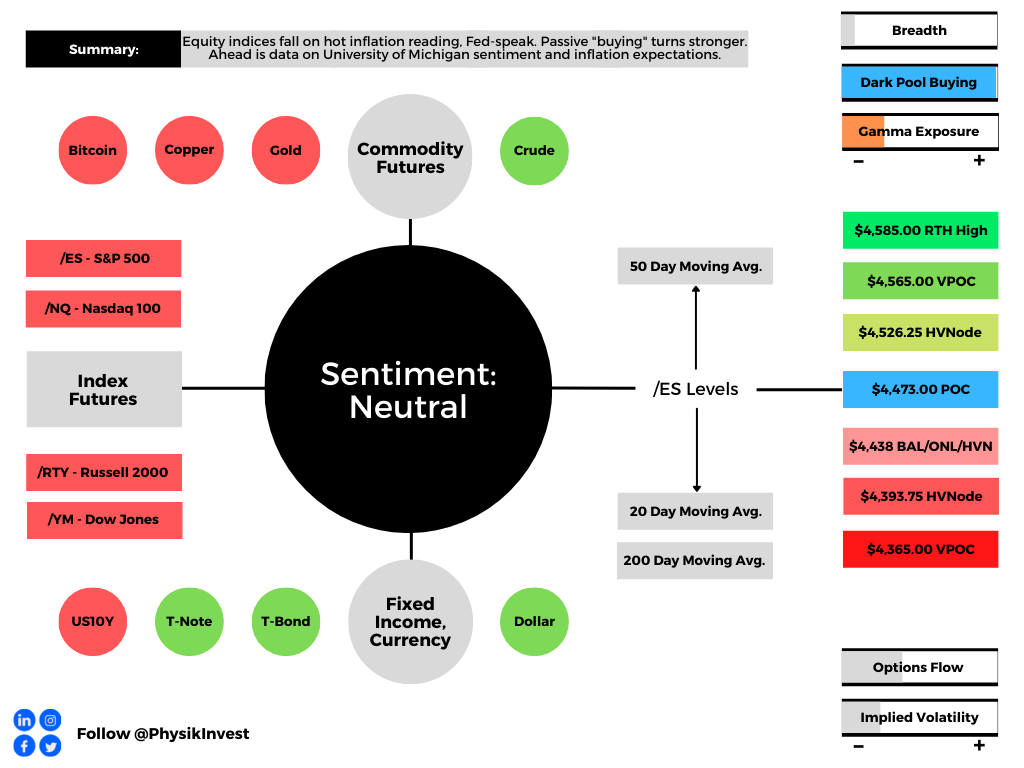
In the best case, the S&P 500 trades higher; activity above the $4,473.00 point of control (POC) puts in play the $4,526.25 high volume area (HVNode). Initiative trade beyond the HVNode could reach as high as the $4,565.00 untested POC (VPOC) and $4,585.00 regular trade high (RTH High), or higher.
In the worst case, the S&P 500 trades lower; activity below the $4,473.00 POC puts in play the key response area at $4,438.75 (BAL/ONL/HVNode). Initiative trade beyond the key response area could reach as low as the $4,393.75 HVNode and $4,365.00 VPOC, or lower.
Click here to load today’s key levels into the web-based TradingView charting platform. Note that all levels are derived using the 65-minute timeframe. New links are produced, daily.
Definitions
Overnight Rally Highs (Lows): Typically, there is a low historical probability associated with overnight rally-highs (lows) ending the upside (downside) discovery process.
Volume Areas: A structurally sound market will build on areas of high volume (HVNodes). Should the market trend for long periods of time, it will lack sound structure, identified as low volume areas (LVNodes). LVNodes denote directional conviction and ought to offer support on any test.
If participants were to auction and find acceptance into areas of prior low volume (LVNodes), then future discovery ought to be volatile and quick as participants look to HVNodes for favorable entry or exit.
POCs: POCs are valuable as they denote areas where two-sided trade was most prevalent in a prior day session. Participants will respond to future tests of value as they offer favorable entry and exit.
Options Expiration (OPEX): Traditionally, option expiries mark an end to trend or pinning (i.e, the theory that market makers and institutions short options move stocks to the point where the greatest dollar value of contracts will expire) and the reset in dealer gamma exposure.
Volume-Weighted Average Prices (VWAPs): A metric highly regarded by chief investment officers, among other participants, for quality of trade. Additionally, liquidity algorithms are benchmarked and programmed to buy and sell around VWAPs.
About
After years of self-education, strategy development, mentorship, and trial-and-error, Renato Leonard Capelj began trading full-time and founded Physik Invest to detail his methods, research, and performance in the markets.
Capelj is also a Benzinga finance and technology reporter interviewing the likes of Shark Tank’s Kevin O’Leary, JC2 Ventures’ John Chambers, FTX’s Sam Bankman-Fried, and ARK Invest’s Catherine Wood, as well as a SpotGamma contributor developing insights around impactful options market dynamics.
Disclaimer
Physik Invest does not carry the right to provide advice.
In no way should the materials herein be construed as advice. Derivatives carry a substantial risk of loss. All content is for informational purposes only.