
The Daily Brief is a free glimpse into the prevailing fundamental and technical drivers of U.S. equity market products. Join the 200+ that read this report daily, below!
What Happened
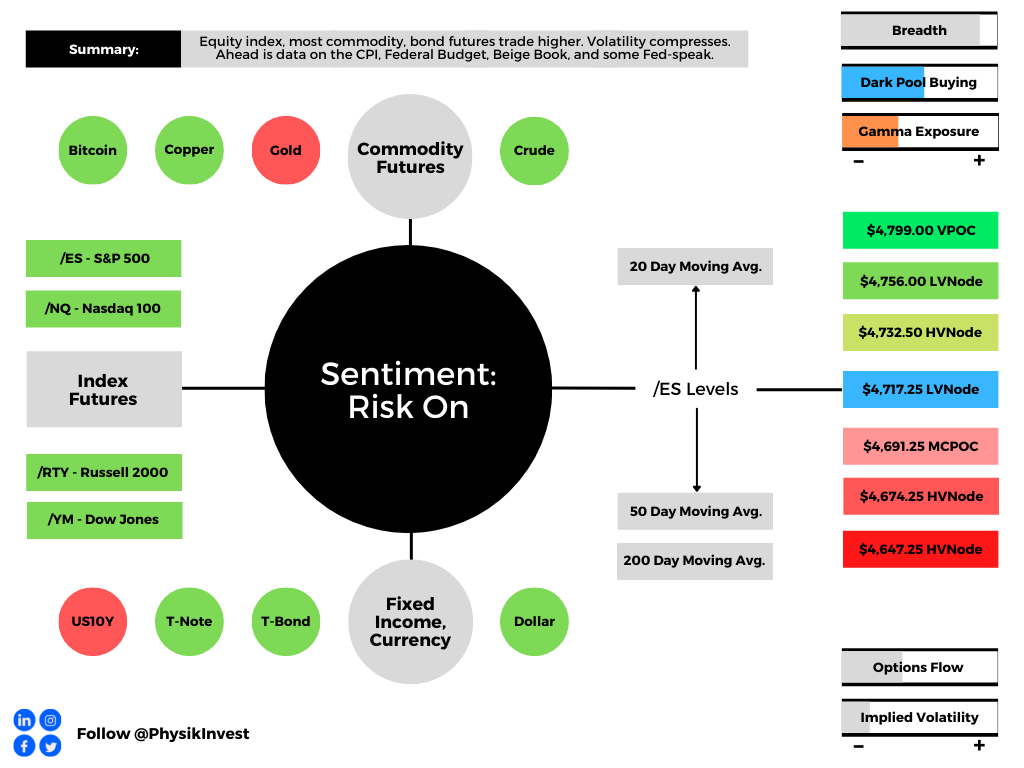
Overnight, equity index, as well as most commodity, and bond futures were higher ahead of data releases on the Consumer Price Index (8:30 AM ET), Federal Budget, and Beige Book (2:00 PM ET), as well as Fed-speak by Neel Kashkari (1:00 PM ET).
What To Expect
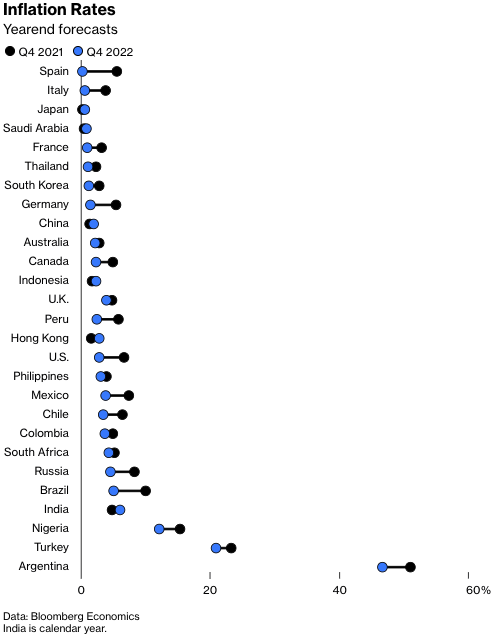
Fundamental: The focus, today, is whether or not the headline inflation rate tops 7%.
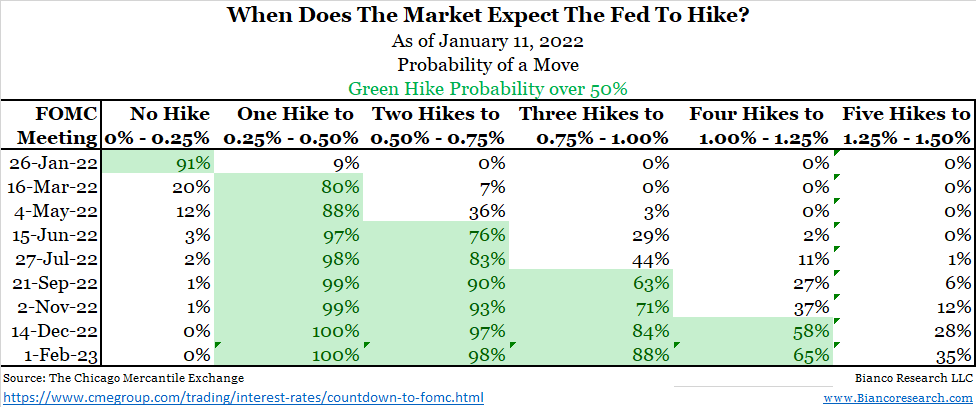
This is as improvements in the U.S. labor market and increased hawkishness from the Federal Reserve (Fed) are playing into a recent rotation (into value) and broad market slump.
As stocks recover from their multi-day slump; Jerome Powell reassured investors, Tuesday, that the Fed would stem increasing inflation and shrink its balance sheet.
“Hawkish Fed repricing is likely largely done for now,” and “resilient earnings should help equities rebound,” Barclays Plc (NYSE: BCS) strategists explained in a recent note.
JPMorgan Chase & Co (NYSE: JPM) agrees. Equities should be able to withstand hikes and balance sheet runoff amidst above-trend growth and a rebound in some international markets.
“As long as yields are rising for the right reasons, including better growth, we believe that equities should be able to tolerate the move,” a JPMorgan note said.
“The rise in real rates should not be hurting equity markets, or economic activity, at least until they move into positive territory, or even as long as real rates are below the real potential growth.”
In support of JPMorgan’s comments on real rates and growth, Sanford Bernstein outlines a bull case stating: “[H]istorically, when real yields normalized back to zero from negative levels, equities have had positive returns.”
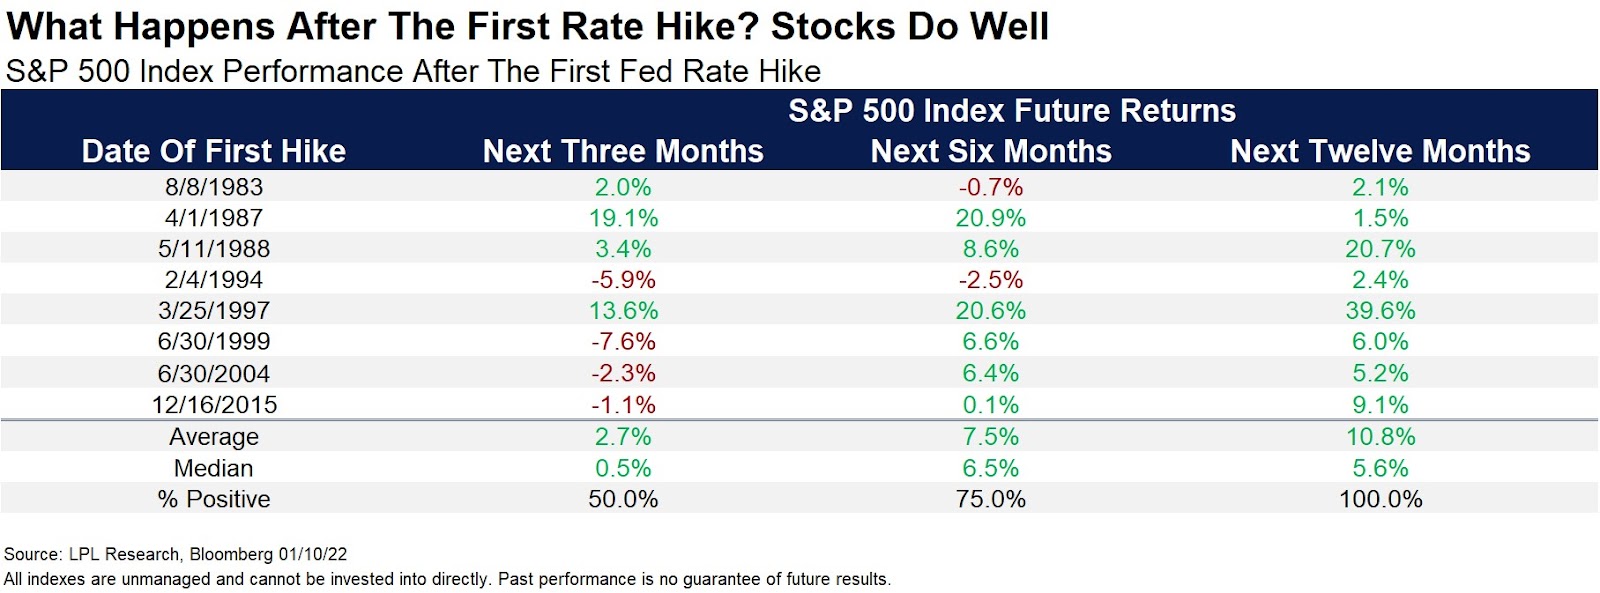
As a bonus, per Ryan Detrick of LPL Financial, “Yes, the Fed will probably hike rates for the first time in a new cycle some time during the first half of 2022. Remember though, looking at the past 8 first hikes, stocks were higher a year later every single time.”
In opposition to the bull-narrative, Jim Bianco of Bianco Research puts it well: “So, if the bond market is having epic convulsions in the wake Fed printer getting turned off, do not take solace that the stock market ‘doesn’t get it.’
“This is how financial markets turn, the stock market often stays too long and turns last.”
Positioning: To keep things fresh, recall that in buying a put, for instance, customers indirectly take liquidity as the counterparties hedge short put exposure by selling underlying.
Higher implied volatility marks up options delta (exposure to direction) and this leads to more selling, as hedging pressures exacerbate weakness. Higher volatility, higher delta, more selling.
As implied volatility compresses, options delta (exposure to direction) is marked down. This leads to buying by the counterparty.
Per SpotGamma’s (unreleased) Hedging Impact of Real-Time Options indicator, over the past sessions, positive delta trade on the part of counterparties, as a result of customer put selling and call buying, has supported the near-vertical price rise from Monday’s lows.
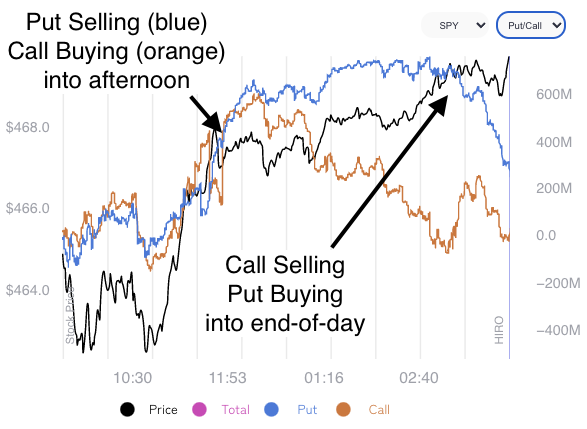
As visualized, above, positive delta trade tapered off into the close, Tuesday, while S&P 500 prices continued higher. Interesting, right? Part of that rally has to do with volatility compression.
The VIX term structure remains upward sloping and volatility (via the INDEX: VIX) has fallen. As stated, above, compression marks options delta down and leads to buying by the counterparty.
Technical: As of 6:30 AM ET, Wednesday’s regular session (9:30 AM – 4:00 PM ET), in the S&P 500, will likely open in the middle part of a positively skewed overnight inventory, just outside of prior-range and -value, suggesting a potential for immediate directional opportunity.
Gap Scenarios: Gaps ought to fill quickly. Should they not, that’s a signal of strength; do not fade. Leaving value behind on a gap-fill or failing to fill a gap (i.e., remaining outside of the prior session’s range) is a go-with indicator.

Auctioning and spending at least 1-hour of trade back in the prior range suggests a lack of conviction; in such a case, do not follow the direction of the most recent initiative activity.
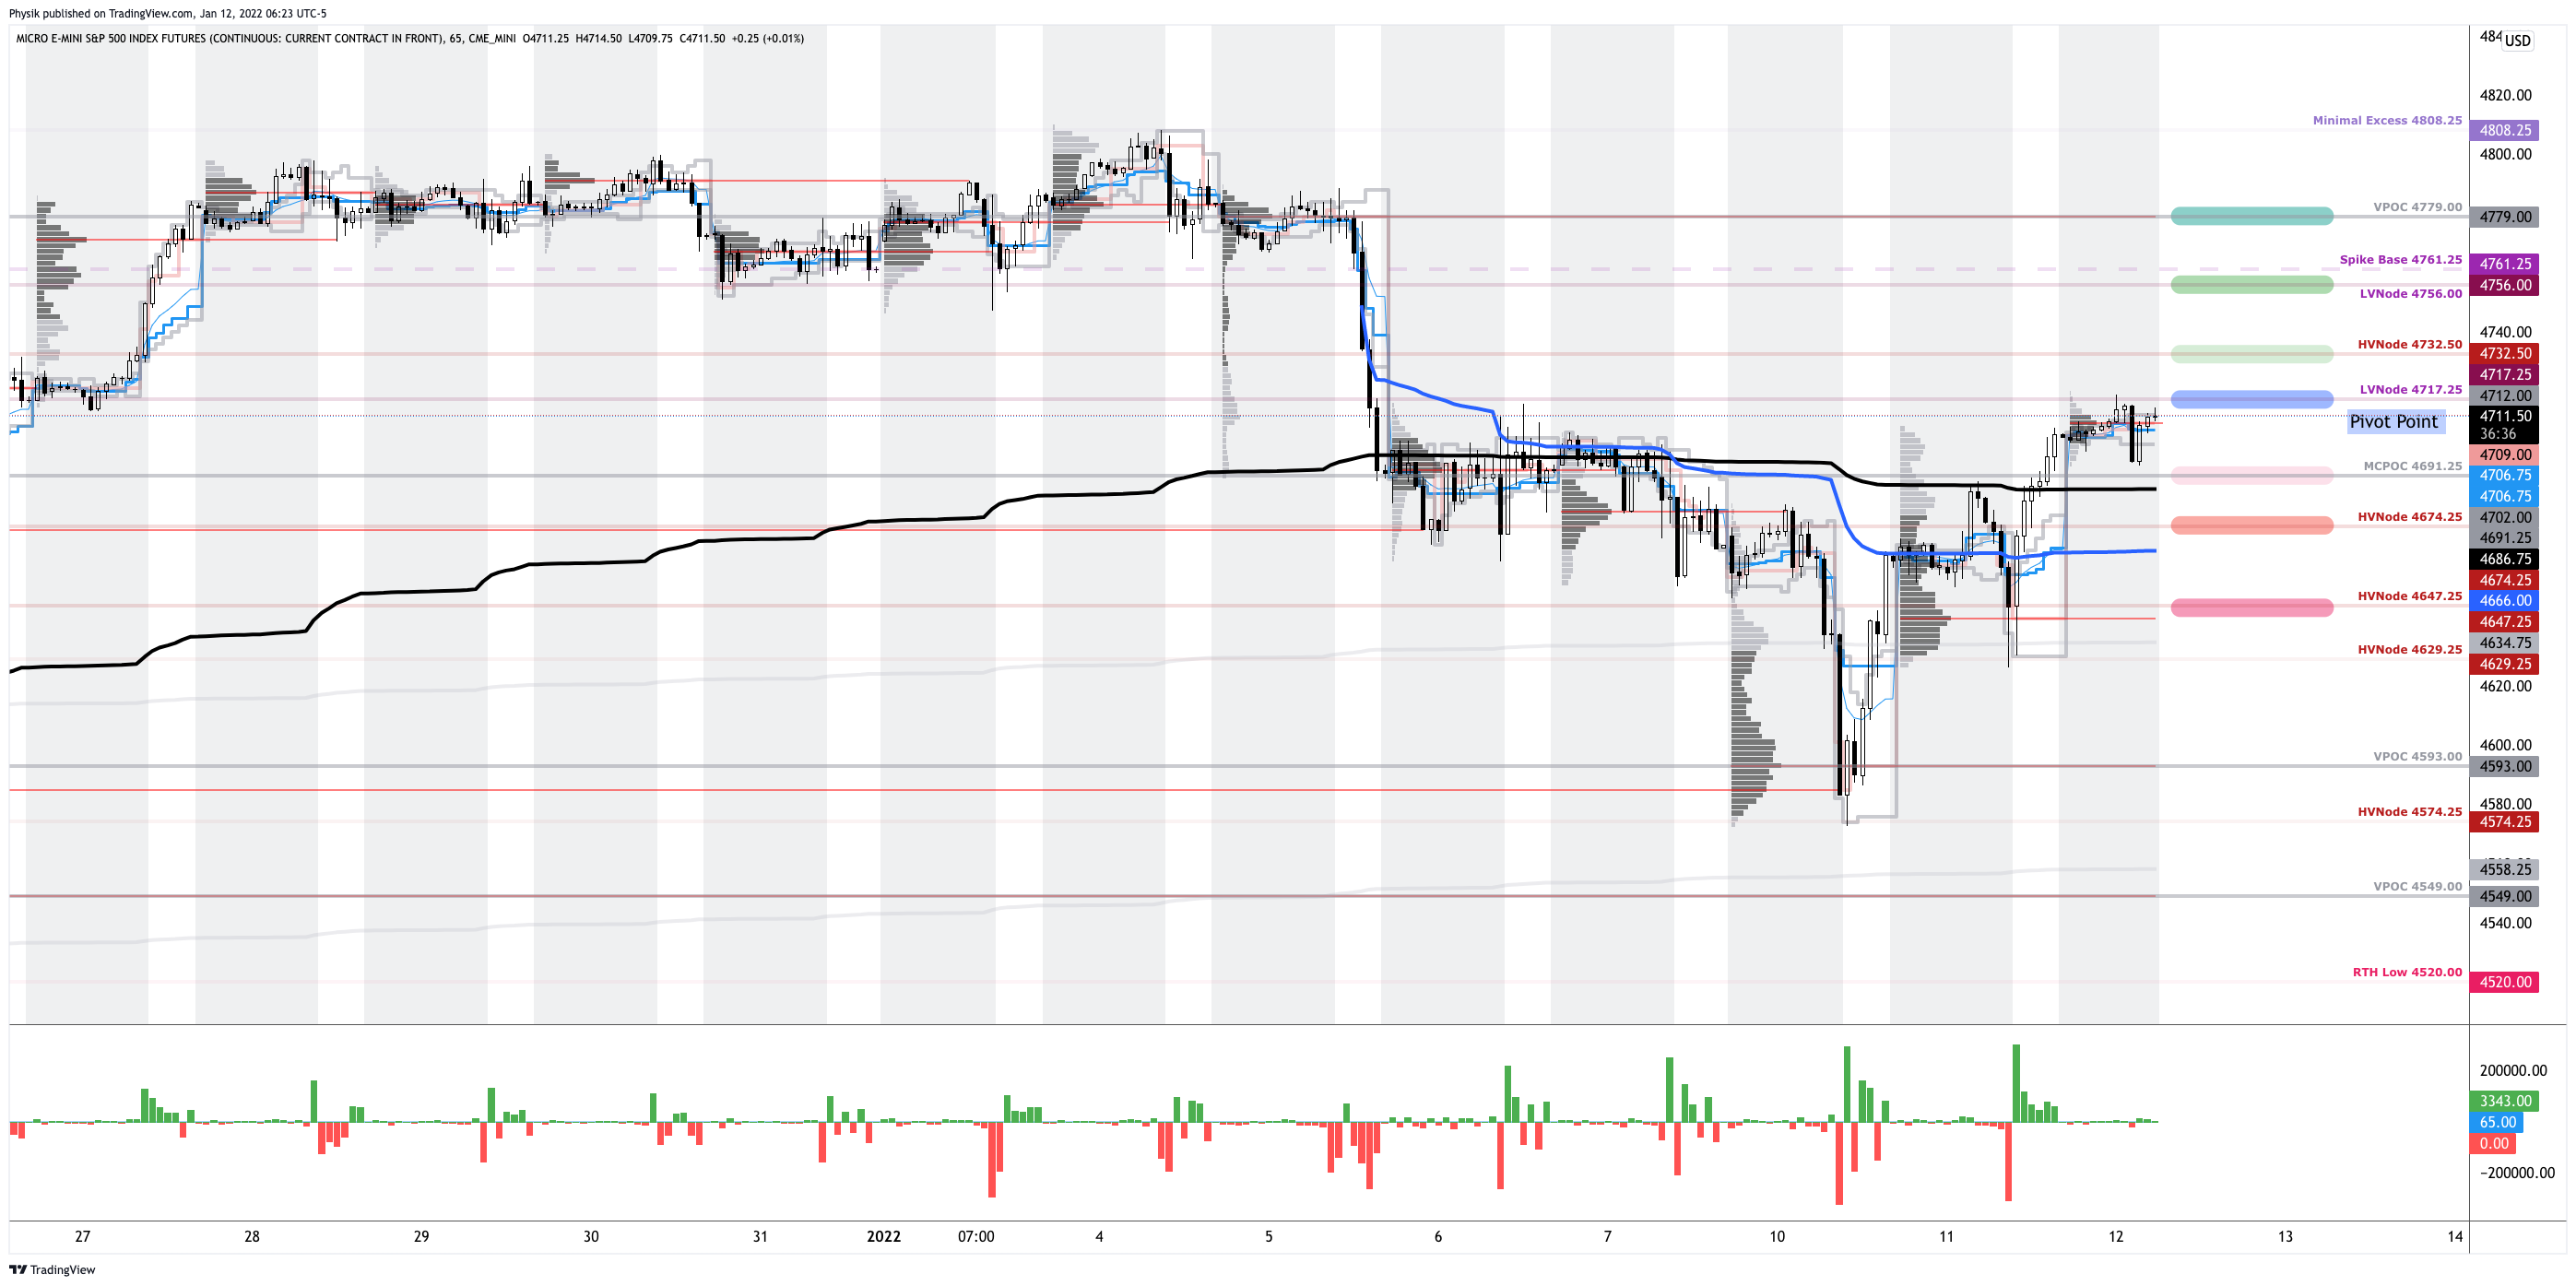
In the best case, the S&P 500 trades higher; activity above the $4,717.25 low volume area (LVNode) puts in play the $4,732.50 high volume area (HVNode). Initiative trade beyond the HVNode could reach as high as the $4,756.00 LVNode and $4,779.00 untested point of control (VPOC), or higher.
In the worst case, the S&P 500 trades lower; activity below the $4,717.25 LVNode puts in play the $4,691.25 micro composite point of control (MCPOC). Initiative trade beyond the MCPOC could reach as low as the $4,674.25 and $4,647.25 HVNode, or lower.
Click here to load today’s key levels into the web-based TradingView charting platform. Note that all levels are derived using the 65-minute timeframe. New links are produced, daily.
What People Are Saying
Definitions
Volume Areas: A structurally sound market will build on areas of high volume (HVNodes). Should the market trend for long periods of time, it will lack sound structure, identified as low volume areas (LVNodes). LVNodes denote directional conviction and ought to offer support on any test.
If participants were to auction and find acceptance into areas of prior low volume (LVNodes), then future discovery ought to be volatile and quick as participants look to HVNodes for favorable entry or exit.
POCs: POCs are valuable as they denote areas where two-sided trade was most prevalent in a prior day session. Participants will respond to future tests of value as they offer favorable entry and exit.
MCPOCs: POCs are valuable as they denote areas where two-sided trade was most prevalent over numerous day sessions. Participants will respond to future tests of value as they offer favorable entry and exit.
About
After years of self-education, strategy development, mentorship, and trial-and-error, Renato Leonard Capelj began trading full-time and founded Physik Invest to detail his methods, research, and performance in the markets.
Capelj is also a Benzinga finance and technology reporter interviewing the likes of Shark Tank’s Kevin O’Leary, JC2 Ventures’ John Chambers, FTX’s Sam Bankman-Fried, and ARK Invest’s Catherine Wood, as well as a SpotGamma contributor developing insights around impactful options market dynamics.
Disclaimer
Physik Invest does not carry the right to provide advice.
In no way should the materials herein be construed as advice. Derivatives carry a substantial risk of loss. All content is for informational purposes only.