Categories
Commentary

Daily Brief For March 16, 2022

Editor’s Note: The Daily Brief is a free glimpse into the prevailing fundamental and technical drivers of U.S. equity market products. Join the 200+ that read this report daily, below!

What Happened

Stock index futures were higher after positive developments, abroad.

According to some reports, the talks between Russia and Ukraine are making progress. This is while China vows to stabilize markets with a promise “to ease a regulatory crackdown, support property, and technology companies and stimulate the economy.”

On the China news, the Hang Seng China Enterprises Index (INDEX: HSCEI) rose ~13% (in the context of a ~30% 1-month drawdown).

At home, in the U.S., the Federal Reserve is expected to increase rates by a quarter-point, the first since 2018. Markets are pricing up to seven hikes this year.

Ahead is data on retail sales and import prices (8:30 AM ET). The NAHB home builders index and business inventories (10:00 AM ET). As well as the Federal Open Market Committee (FOMC) announcement (2:00 PM ET) and press conference (2:30 PM ET).
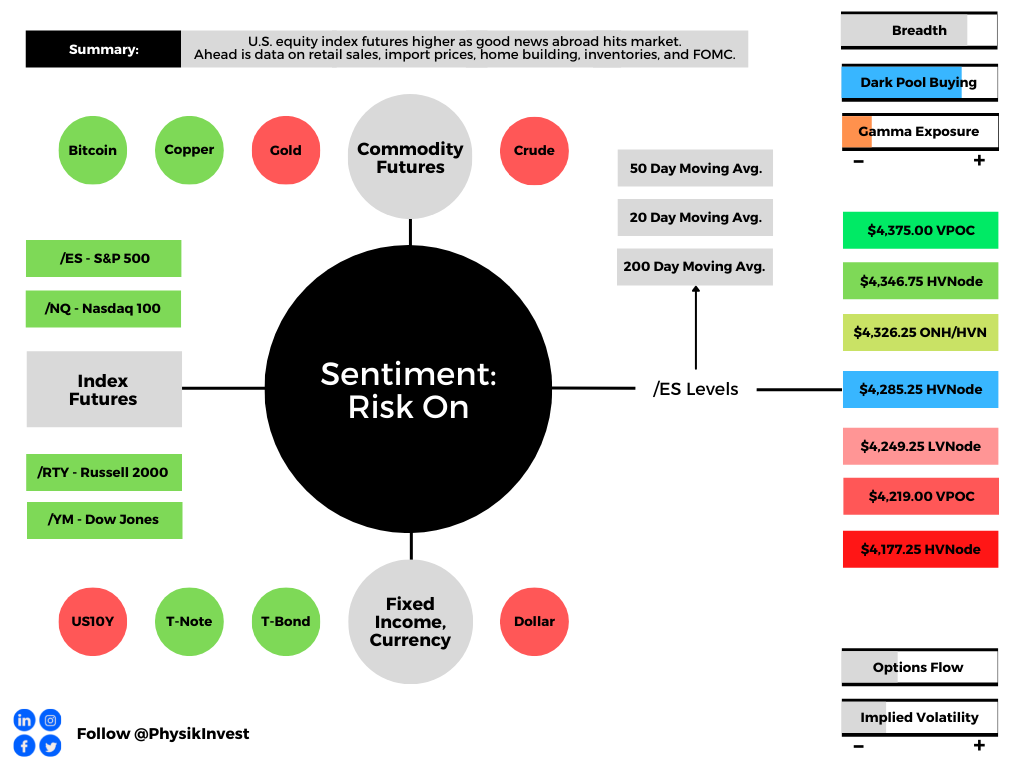
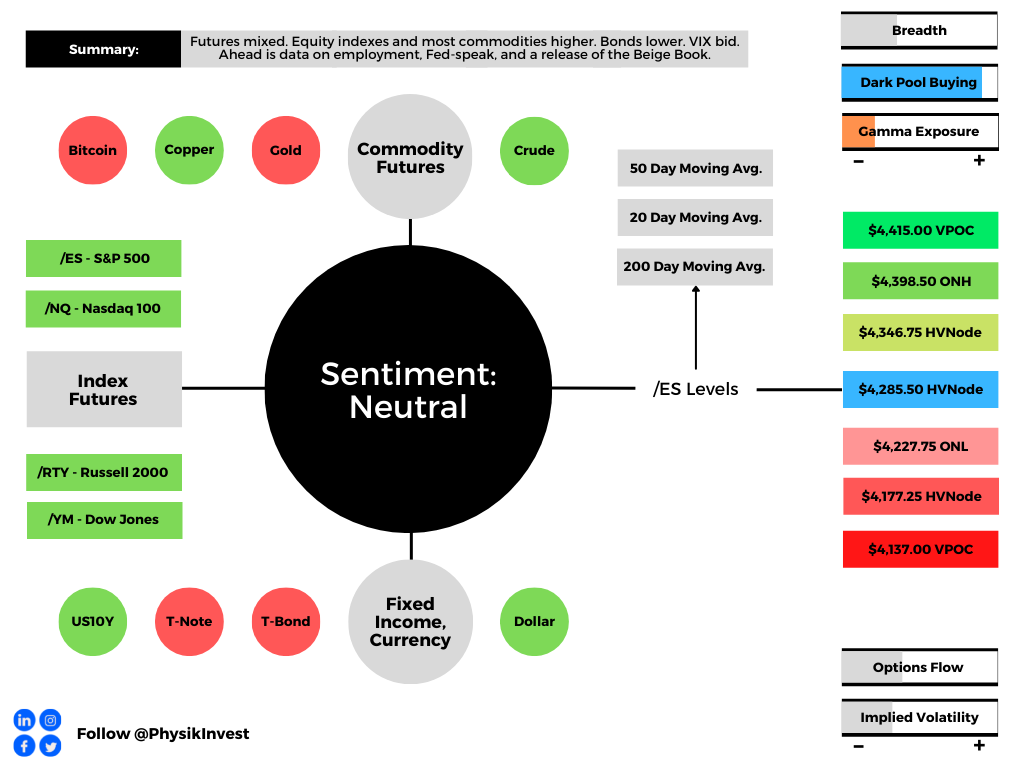
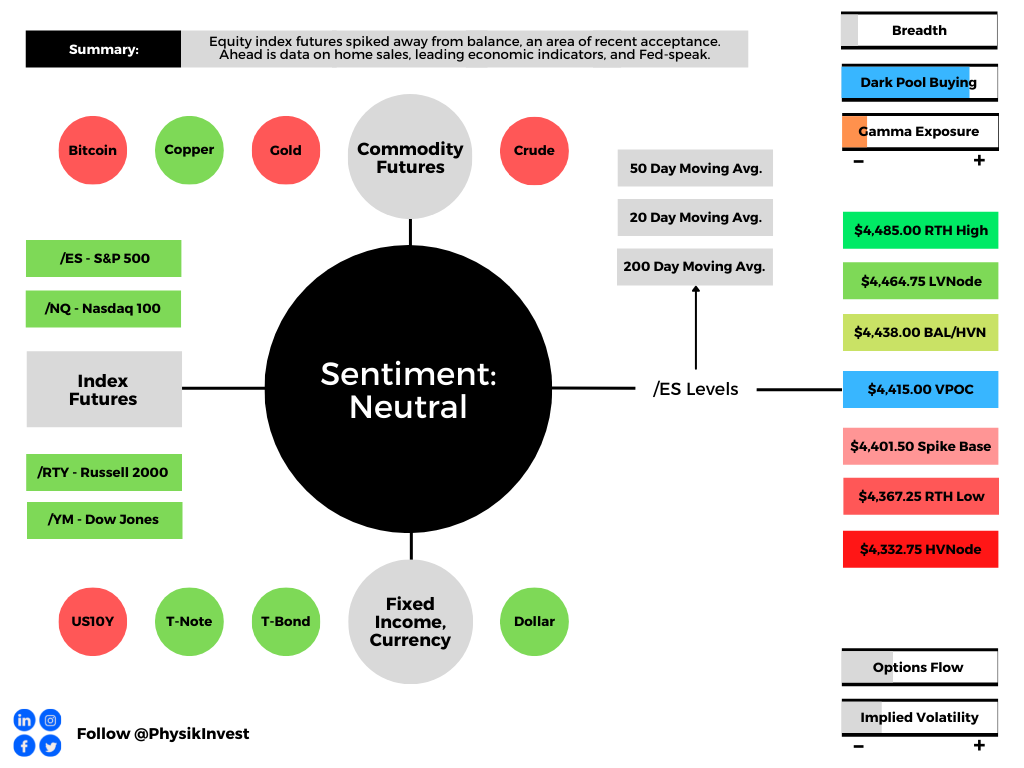
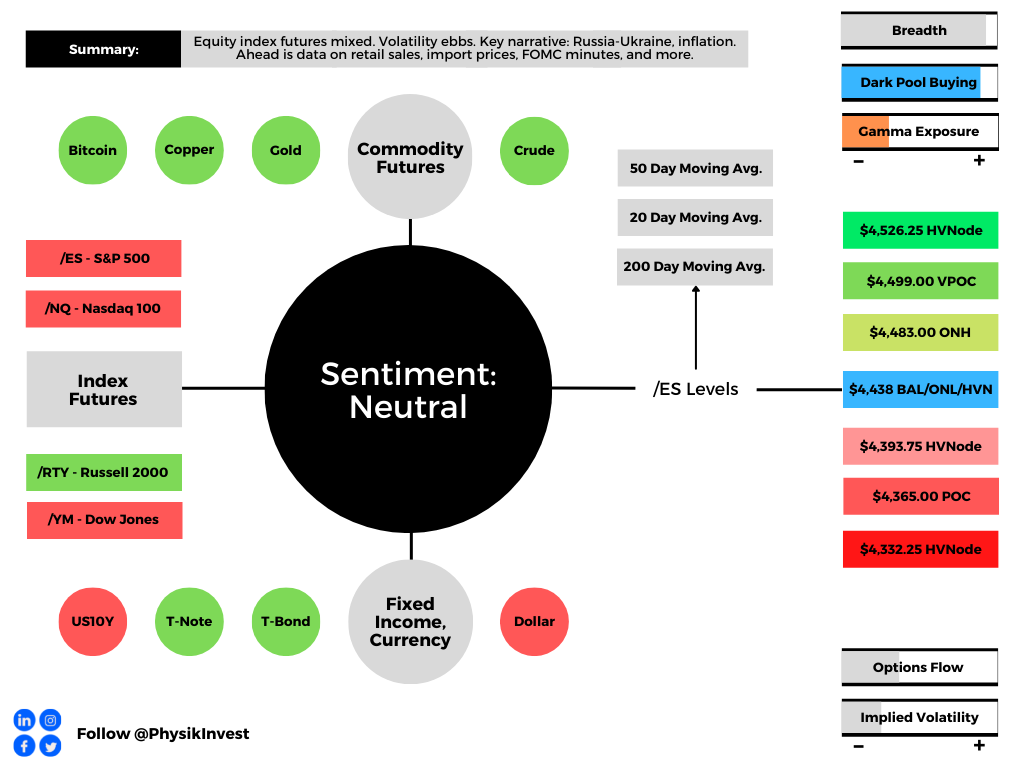
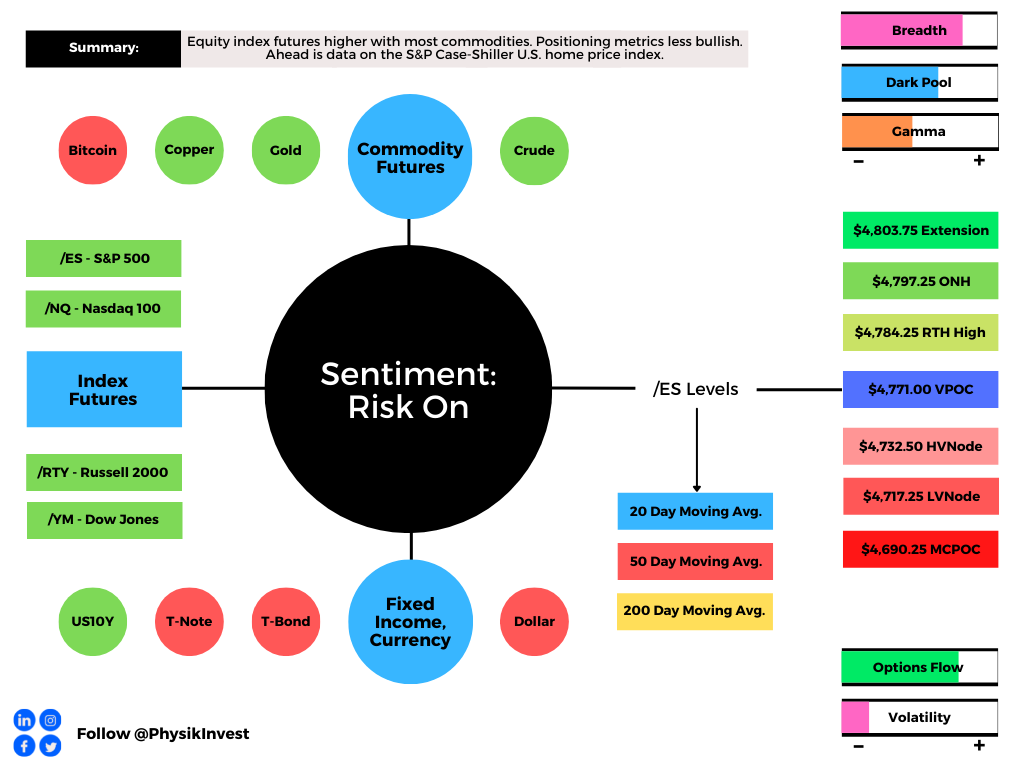
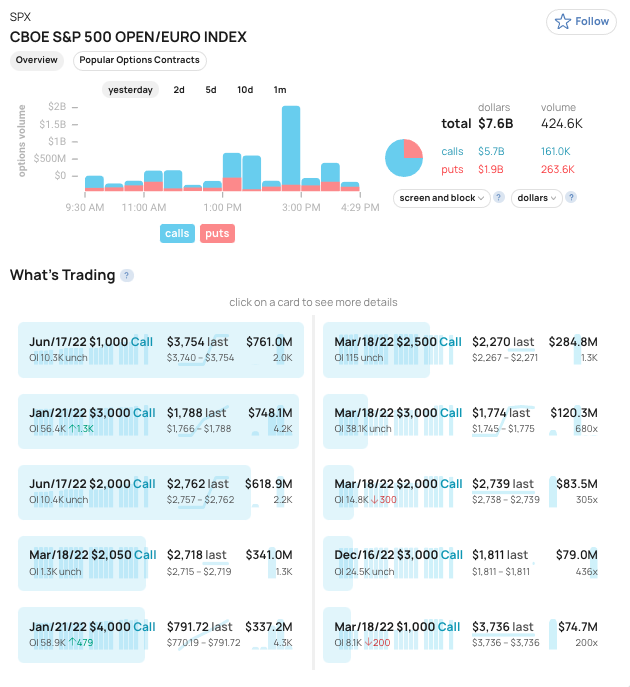
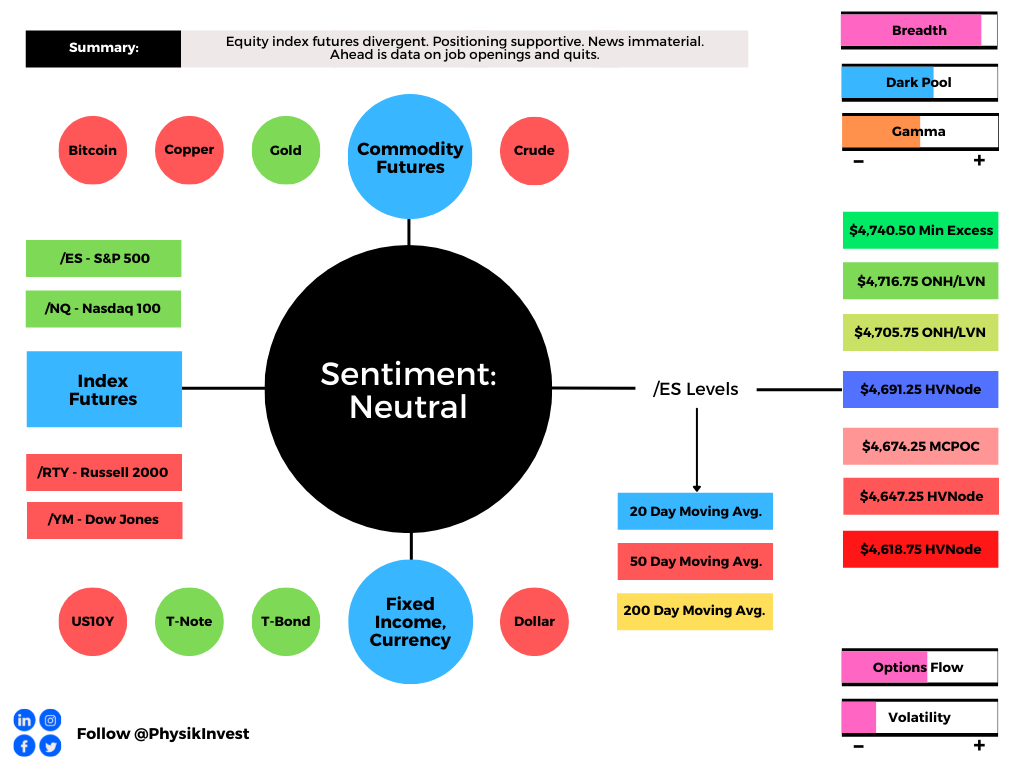
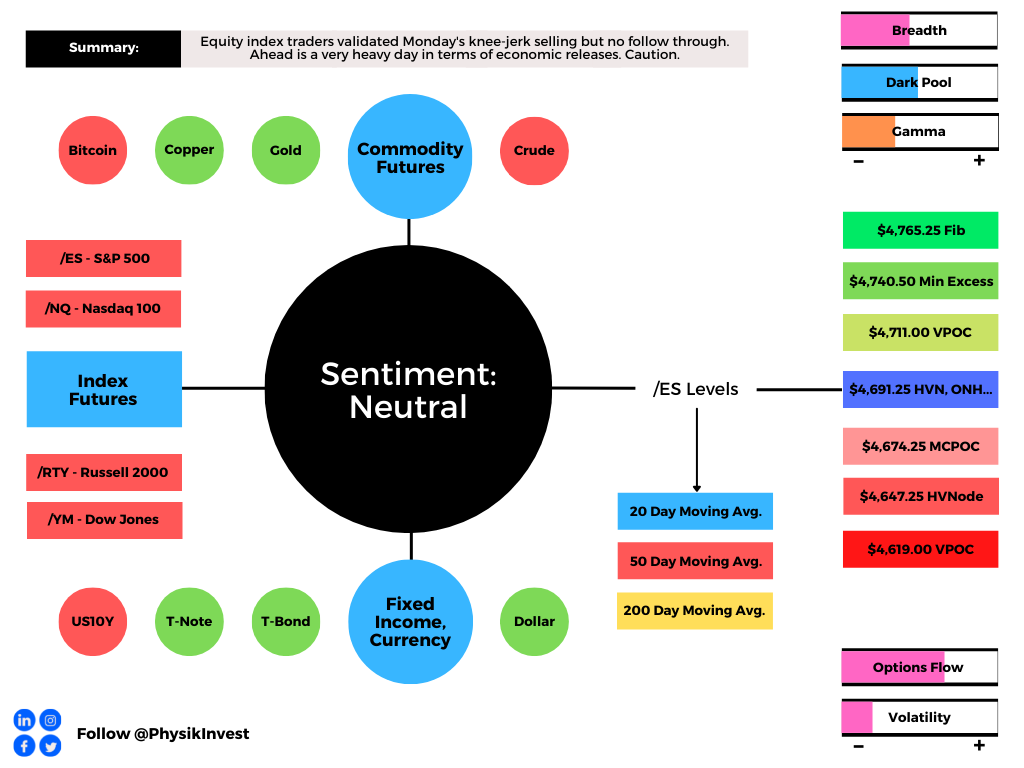
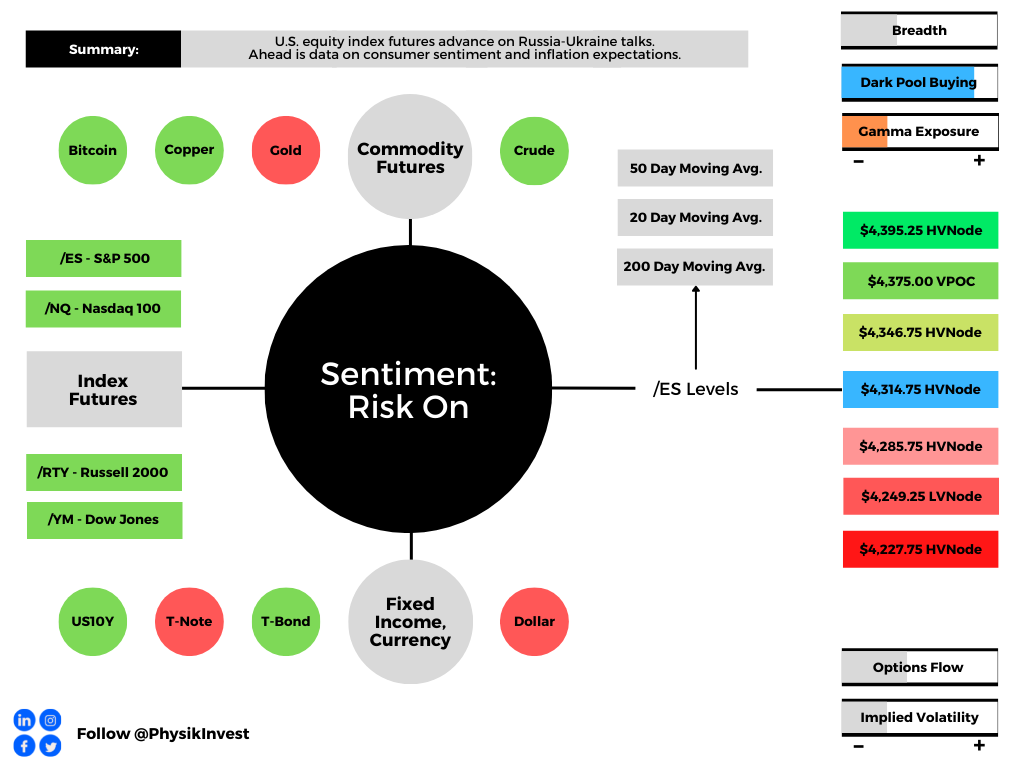
Graphic updated 6:30 AM ET. Sentiment Risk-On if expected /ES open is above the prior day’s range. /ES levels are derived from the profile graphic at the bottom of the following section. Levels may have changed since initially quoted; click here for the latest levels. SqueezeMetrics Dark Pool Index (DIX) and Gamma (GEX) calculations are based on where the prior day’s reading falls with respect to the MAX and MIN of all occurrences available. A higher DIX is bullish. At the same time, the lower the GEX, the more (expected) volatility. Learn the implications of volatility, direction, and moneyness. SHIFT data used for S&P 500 (INDEX: SPX) options activity. Note that options flow is sorted by the call premium spent; if more positive, then more was spent on call options. Breadth reflects a reading of the prior day’s NYSE Advance/Decline indicator. VIX reflects a current reading of the CBOE Volatility Index (INDEX: VIX) from 0-100.

What To Expect

Fundamental: The 60/40 portfolio is headed for its worst performance since the financial crisis of 2008 as assets are hurt by a mix of slowing economic growth and inflation.
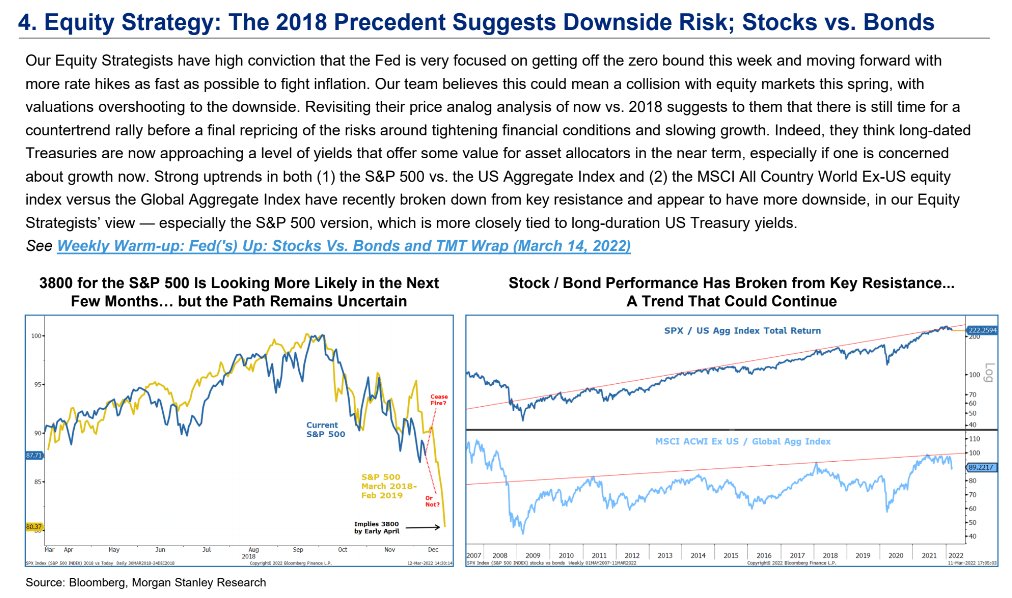
Graphic: Via Morgan Stanley (NYSE: MS). Stocks and bond relationship upended. Adding, per a Bank of America Corporation (NYSE: BAC) survey, participants believe the markets would have to fall 24% (from peak to trough) – $3,636.00 SPX – to solicit a Fed pivot.

Further, this letter has talked about the “bonds down, equities down” phenomenon before. To borrow from letters published over the past two months, in short, over the past 40 or so years, monetary policy was used as a crutch to support the economy. 
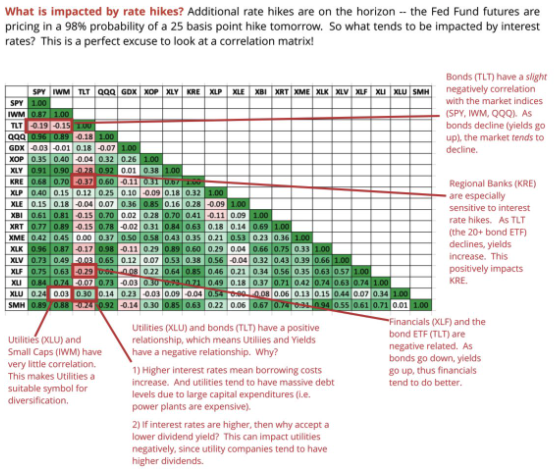
Graphic: Via tastytrade. Asset correlations matrix.

This promoted deflation, innovation, and the subsequent rise in valuations.

With rates lifting, that’s a headwind; coupled with participants’ increased exposure to rate and equity market risk, which can play into cross-market hedging and de-leveraging cascades, 60/40 turns into somewhat of a poor hedge.

Why? Let’s back up for a moment.

For an investor to take on additional risk for return, they must receive in excess of the risk-free rate (as provided by the Treasury). This excess is the risk premium.

As Investopedia details well, therefore, “the total return on a stock is the sum of two parts: the risk-free rate and the risk premium.”

Moreover, higher rates and risk premiums increase the required rate of return.

Higher interest rates, basically, decrease the present value of future cash flows, making stocks, especially those that are high growth, less attractive.

So, at higher rates, shares should fall. At lower rates, shares should rise. Some strategists estimate that annual returns for 60/40 will be less than 5% over the next decade, as a result.
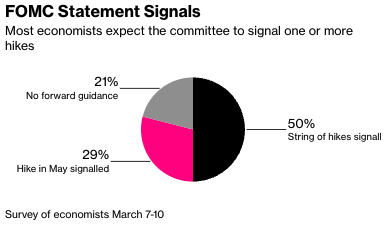
Graphic: Via Bloomberg. The FOMC is likely to signal more hikes.

This conversation has me bringing up a conversation I had with Karan Sood, the CEO and Managing Director, Head of Product Development at Cboe Vest Financial LLC.

“Bonds have been giving you really good returns because interest rates have been going down since the 1970s when they peaked at about 11%,” Sood explained to me. 

“That’s changing now; we’re at the zero bound, and it’s unlikely that will be as a strong of a tailwind. Worse, it could be a headwind if interest rates start to rise.”
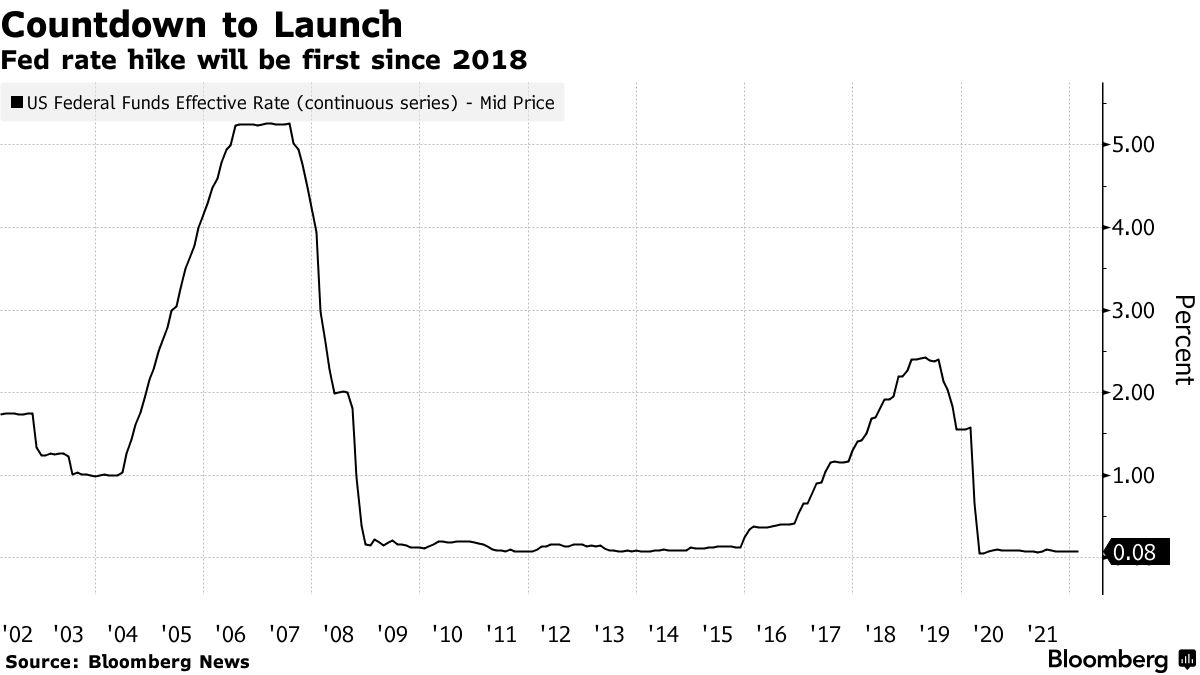
Graphic: Via Bloomberg. Federal Reserve to raise rates for the first time in years.

In regards to the Federal Reserve’s balance sheet, Bloomberg explains that participants ought to receive updates on the pace of buying, as well as the sale of assets.

“That may include setting out caps on how many billions of dollars worth of Treasuries and mortgage-backed securities will be allowed to mature every month without reinvestment, something that Powell told Congress earlier this month would be discussed at this meeting.”
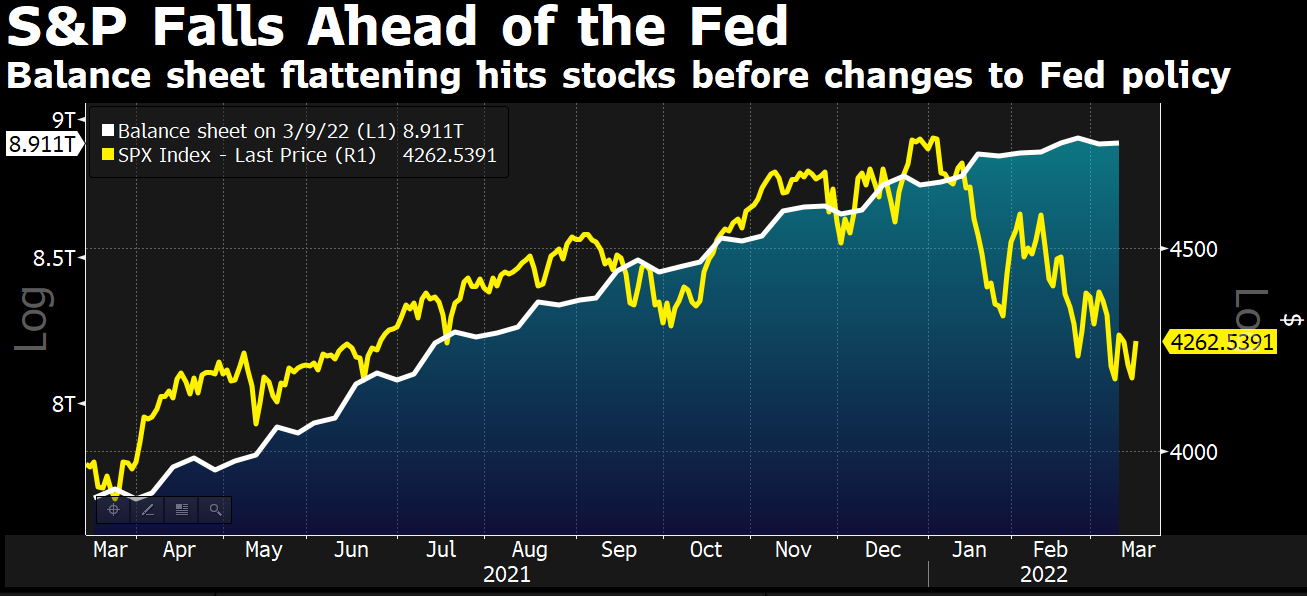
Graphic: Via Bloomberg. S&P 500 participants proactively price in the Federal Reserve’s intent to cut support. It is monetary frameworks and max liquidity that enabled markets to diverge from fundamentals.

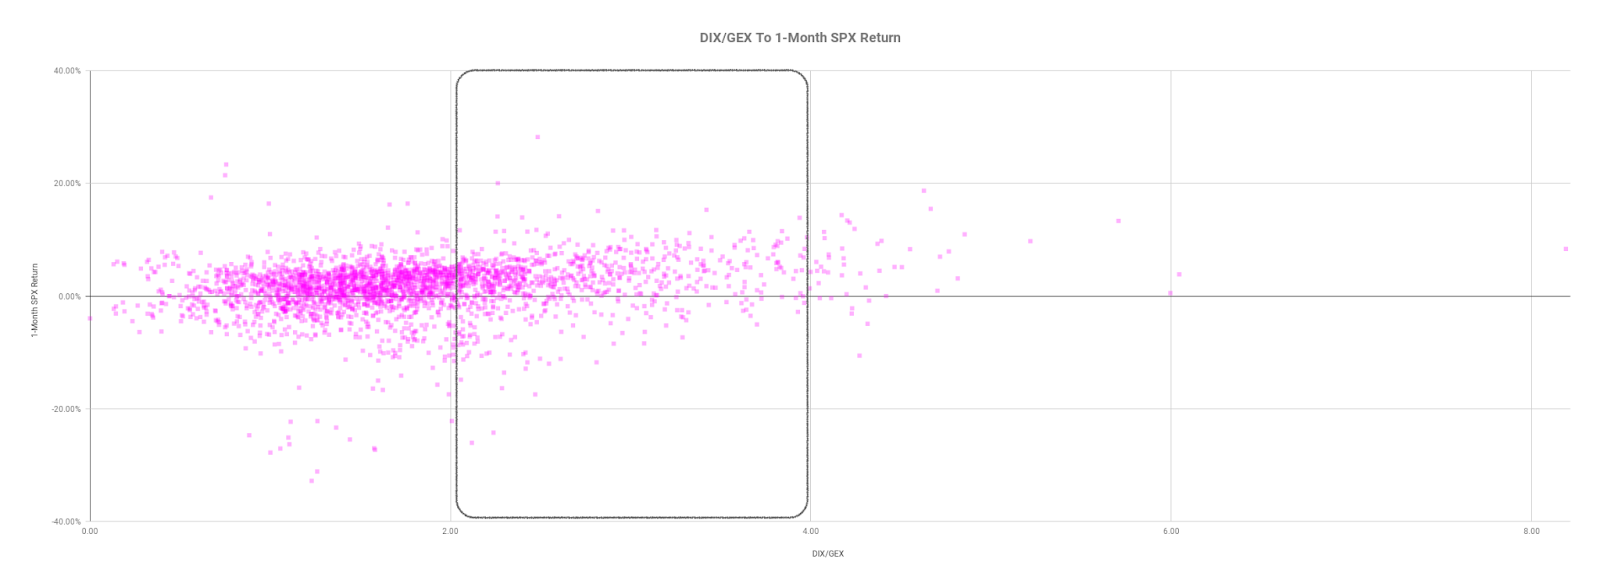
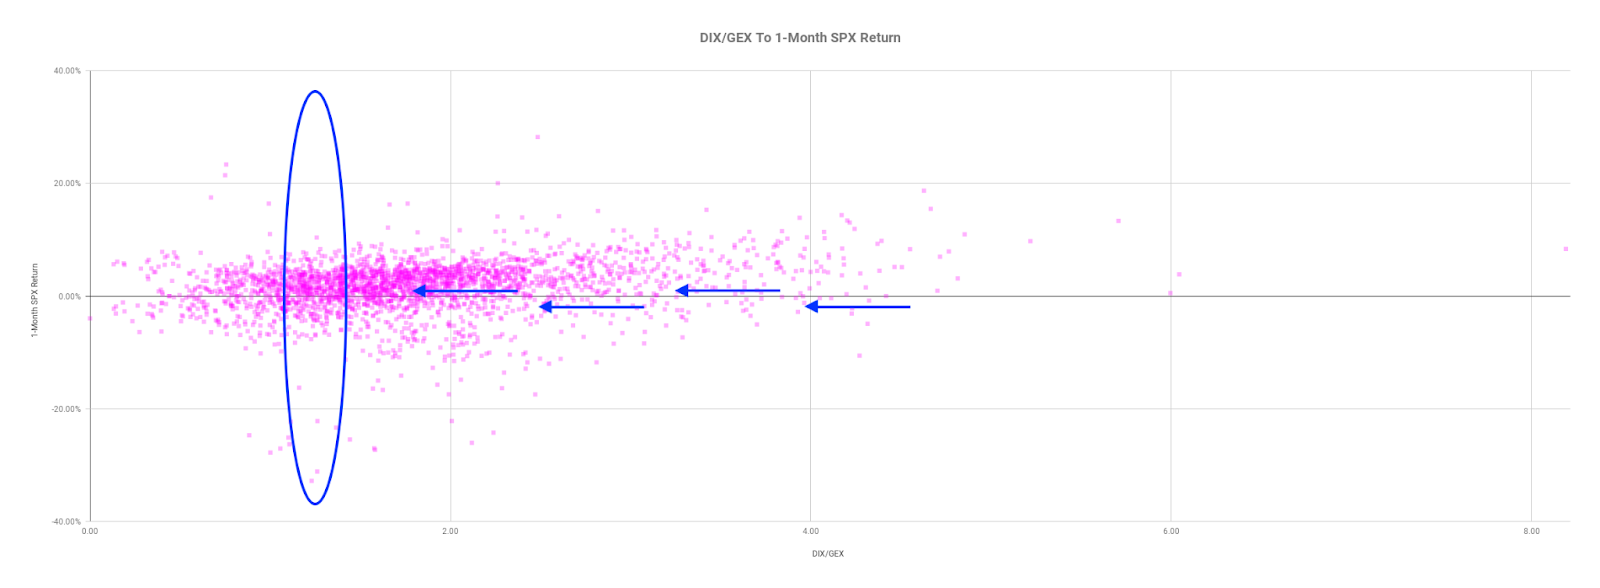
Positioning: Based on a comparison of present options positioning and buying metrics, the returns distribution remains skewed positive.
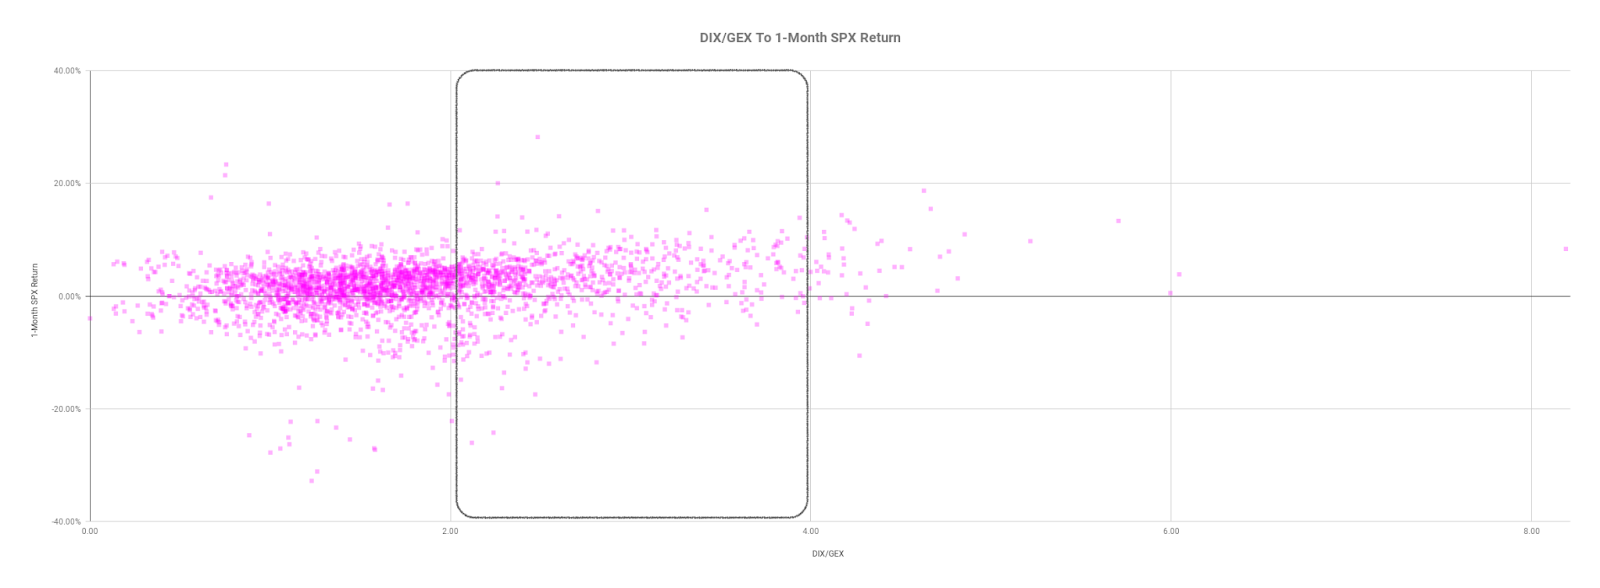
Graphic: Via Physik Invest. Data via SqueezeMetrics.

Pursuant to the buying support remark, JPMorgan Chase & Co (NYSE: JPM) strategists say pension and sovereign wealth funds, in rebuilding risk-on positions, may boost markets by as much as 10%. 

“It’s the biggest rebalancing since 2020 in terms of buying equities,” JPMorgan strategist Nikolaos Panigirtzoglou said. An inflow of at least $100 billion and as much as $230 billion could trigger gains of between 5% and 10% to global stocks, he said.
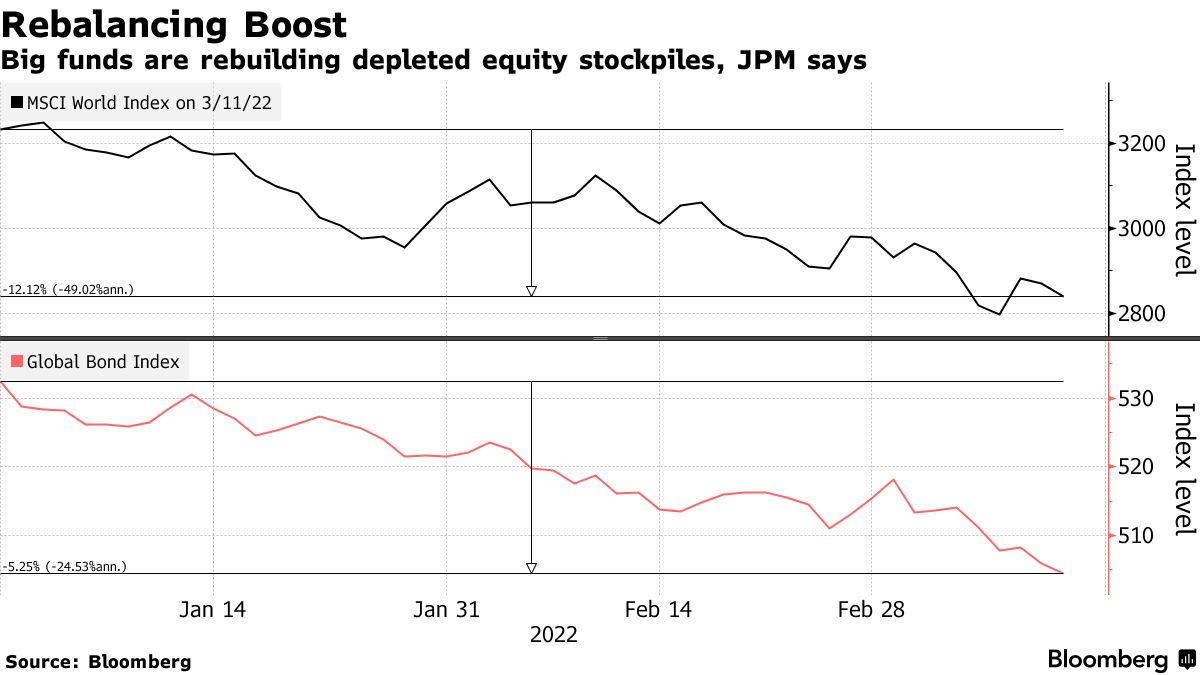
Graphic: Via Bloomberg. “[D]eclines have driven down the value of targeted allocations for the world’s biggest funds, many of which hew to a traditional mix of 60% stocks and 40% bonds. To address the shortfall, they have to buy equities.”

At the same time, expected is further compression of volatility (via the passage of FOMC), as well as the removal of customer puts (and associated hedging pressures) via OPEX (options expiration).
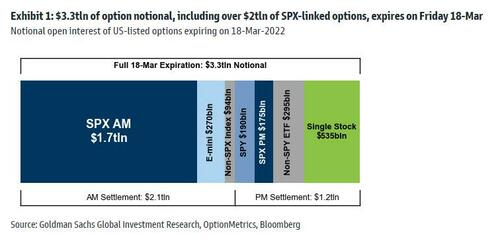
Graphic: Via Goldman Sachs Group Inc (NYSE: GS). 

To note, there is the potential, according to SpotGamma, for some “path dependency,” as “the expiration and/or covering of a large swath of these put hedges may place the market back into an ‘underhedged’ position.” 

In such a case, new demand would add fuel to weakness.

Technical: As of 6:30 AM ET, Wednesday’s regular session (9:30 AM – 4:00 PM ET), in the S&P 500, will likely open in the upper part of a positively skewed overnight inventory, outside of prior-range and -value, suggesting a potential for immediate directional opportunity.

Gap Scenarios: Gaps ought to fill quickly. Should they not, that’s a signal of strength; do not fade. Leaving value behind on a gap-fill or failing to fill a gap (i.e., remaining outside of the prior session’s range) is a go-with indicator.

Auctioning and spending at least 1-hour of trade back in the prior range suggests a lack of conviction; in such a case, do not follow the direction of the most recent initiative activity.

In the best case, the S&P 500 trades higher; activity above the $4,285.25 high volume area (HVNode) puts in play the $4,326.25 overnight high (ONH). Initiative trade beyond the ONH could reach as high as the $4,346.75 HVNode and $4,375.00 untested point of control (VPOC), or higher.

In the worst case, the S&P 500 trades lower; activity below the $4,285.25 HVNode puts in play the $4,249.25 low volume area (LVNode). Initiative trade beyond the LVNode could reach as low as the $4,219.00 VPOC and $4,177.25 HVNode, or lower.

Considerations: Push-and-pull, as well as responsiveness near key-technical areas (that are discernable visually on a chart), suggests technically-driven traders with short time horizons are very active. 

Such traders often lack the wherewithal to defend retests and, additionally, the type of trade may be indicative of the other time frame participants waiting for more information to initiate trades.

Click here to load today’s key levels into the web-based TradingView charting platform. Note that all levels are derived using the 65-minute timeframe. New links are produced, daily.
Graphic: 65-minute profile chart of the Micro E-mini S&P 500 Futures.

Definitions

Overnight Rally Highs (Lows): Typically, there is a low historical probability associated with overnight rally-highs (lows) ending the upside (downside) discovery process.

Volume Areas: A structurally sound market will build on areas of high volume (HVNodes). Should the market trend for long periods of time, it will lack sound structure, identified as low volume areas (LVNodes). LVNodes denote directional conviction and ought to offer support on any test. 

If participants were to auction and find acceptance into areas of prior low volume (LVNodes), then future discovery ought to be volatile and quick as participants look to HVNodes for favorable entry or exit.

About

After years of self-education, strategy development, mentorship, and trial-and-error, Renato Leonard Capelj began trading full-time and founded Physik Invest to detail his methods, research, and performance in the markets.

Capelj is also a Benzinga finance and technology reporter interviewing the likes of Shark Tank’s Kevin O’Leary, JC2 Ventures’ John Chambers, FTX’s Sam Bankman-Fried, and ARK Invest’s Catherine Wood, as well as a SpotGamma contributor developing insights around impactful options market dynamics.

Disclaimer

Physik Invest does not carry the right to provide advice.

In no way should the materials herein be construed as advice. Derivatives carry a substantial risk of loss. All content is for informational purposes only.

Categories
Commentary

Daily Brief For March 11, 2022

Editor’s Note: The Daily Brief is a free glimpse into the prevailing fundamental and technical drivers of U.S. equity market products. Join the 200+ that read this report daily, below!

What Happened

On reports that there was progress in talks between Russia and Ukraine, stock index futures advanced putting the S&P 500 back inside a large consolidation area.

Thus far, trade has been volatile and responsive to key visual levels suggesting that the larger other time frame (non-technical) participants are waiting for more information to initiate trades.

Ahead is data on the University of Michigan Sentiment (10:00 AM ET) and inflation expectations (10:00 AM ET).

Graphic updated 6:45 AM ET. Sentiment Risk-On if expected /ES open is above the prior day’s range. /ES levels are derived from the profile graphic at the bottom of the following section. Levels may have changed since initially quoted; click here for the latest levels. SqueezeMetrics Dark Pool Index (DIX) and Gamma (GEX) calculations are based on where the prior day’s reading falls with respect to the MAX and MIN of all occurrences available. A higher DIX is bullish. At the same time, the lower the GEX, the more (expected) volatility. Learn the implications of volatility, direction, and moneyness. SHIFT data used for S&P 500 (INDEX: SPX) options activity. Note that options flow is sorted by the call premium spent; if more positive, then more was spent on call options. Breadth reflects a reading of the prior day’s NYSE Advance/Decline indicator. VIX reflects a current reading of the CBOE Volatility Index (INDEX: VIX) from 0-100.

What To Expect

Fundamental: Yesterday’s letter covered a lot of ground. Check it out if you haven’t already.

Volatility is heightened and the narratives we may attribute that to are concerned with the intent to tighten monetary policy, slower economic growth, and geopolitics.

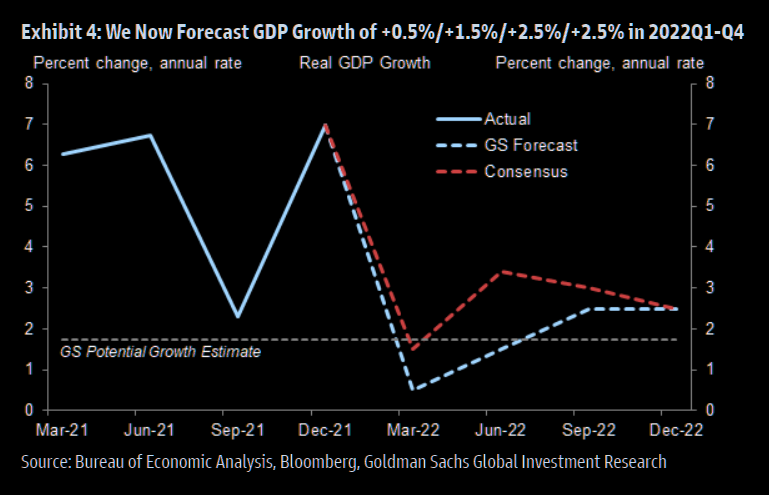
Graphic: Via Goldman Sachs Group Inc (NYSE: GS). Taken from The Market Ear. “We are downgrading our US GDP forecast to reflect higher oil prices and other drags on growth related to the war in Ukraine.”

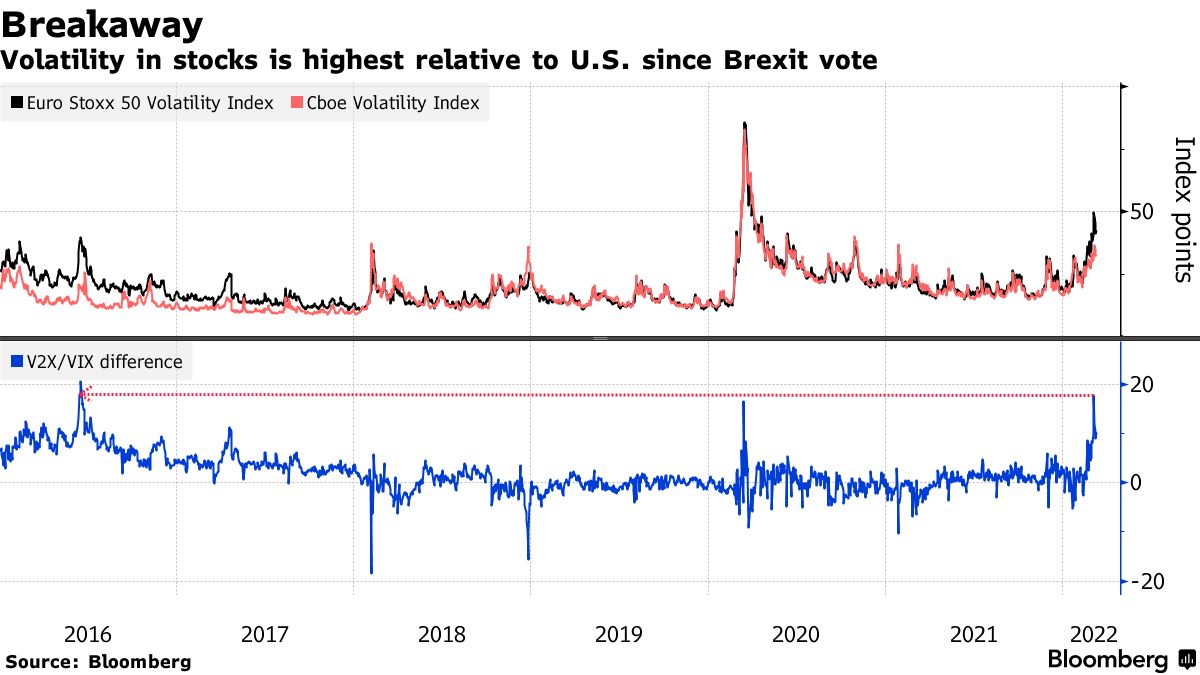
In comparison, though, U.S. equity product volatility is less than that in Europe and this points to the “risk premium for investing in Europe’s markets that are teeming with cyclical stocks acutely vulnerable to growth and inflation risks,” among other things.

Adding to the turbulence was the European Central Bank’s pivot toward hawkishness; the institution will accelerate the wind-down of its monetary stimulus. Pursuant to this decision, Euro-area equity funds had their largest weekly outflows on record.

Graphic: Via Bloomberg. 

U.S. policymakers are expected to ramp their tightening efforts, next week, also, as inflation expectations are surging.

Graphic: Via Bloomberg. “[T]he central bank is widely expected to announce a 25-basis point increase Wednesday, along with fresh projections for the economy and path of interest rates.”

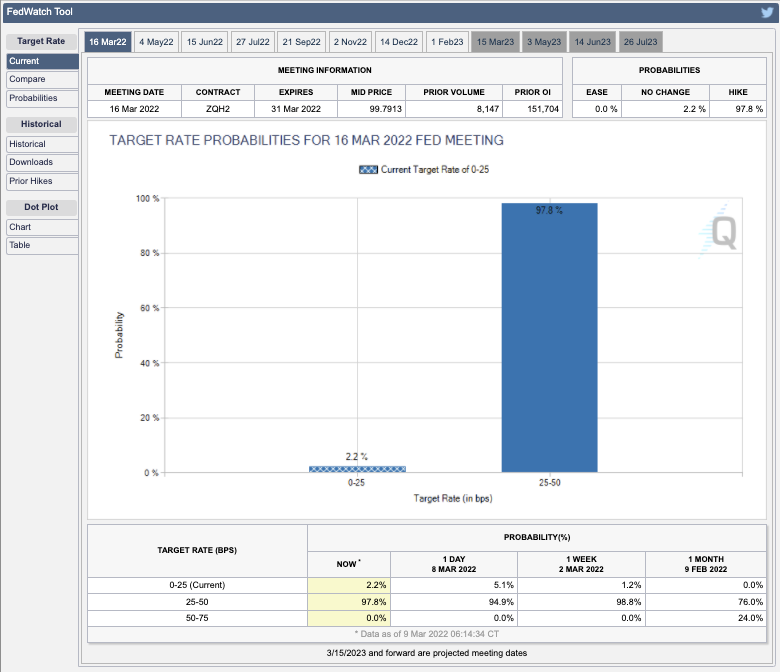
Per CME Group Inc’s (NASDAQ: CME) FedWatch Tool, participants are pricing a near 100% chance of a hike in the target rate.

Graphic: Via CME Group Inc (NASDAQ: CME). Participants price in an increased probability of a shift in the target rate. Click here to access the FedWatch Tool.

In the face of all the bearish narratives, however, many products – at the single-stock level – have been de-rating now for nearly a year. 

Ahead of bullish seasonality and rebalancing flow (from fixed income into equities), JPMorgan Chase & Co (NYSE: JPM) strategists suggest that “we could be through [the] worst of it.” 

“When either All Strats or Equity L/S net leverage fell by at least 1.5z or more, the SPX generally rallied over the next 1wk and 4wks,” a bulletin published by The Market Ear read. 

Positioning: Based on a comparison of present options positioning and buying metrics, the returns distribution is skewed positive, albeit less so than before. 

Graphic: Via Physik Invest. Data via SqueezeMetrics.

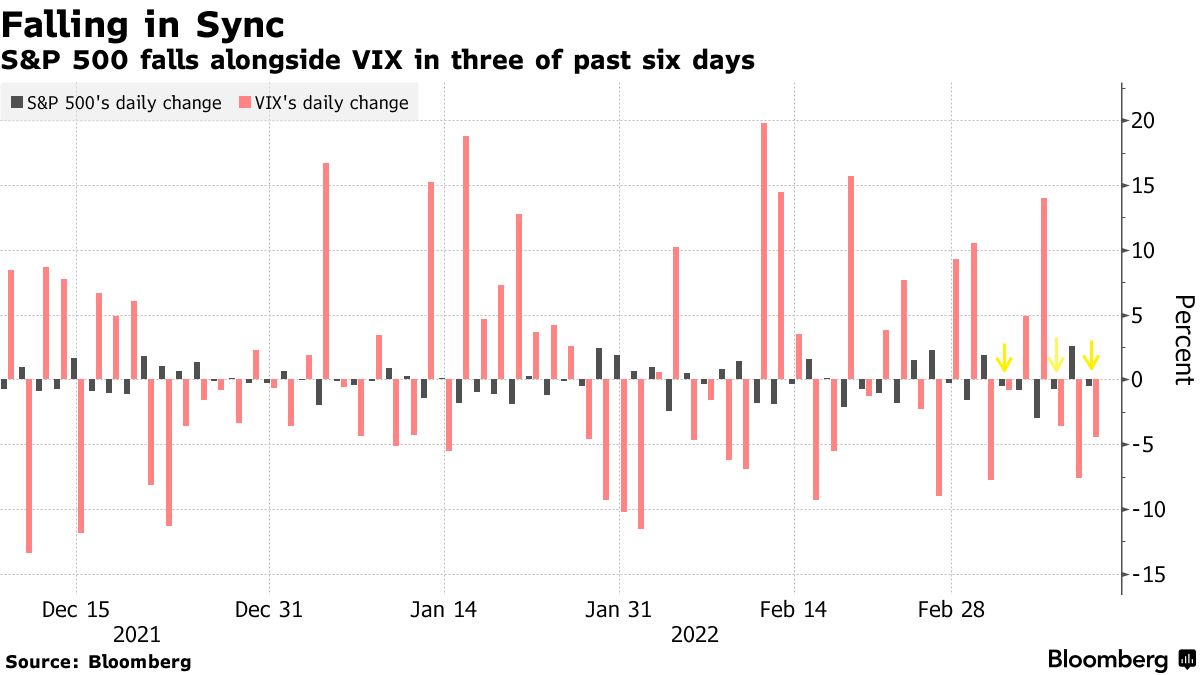
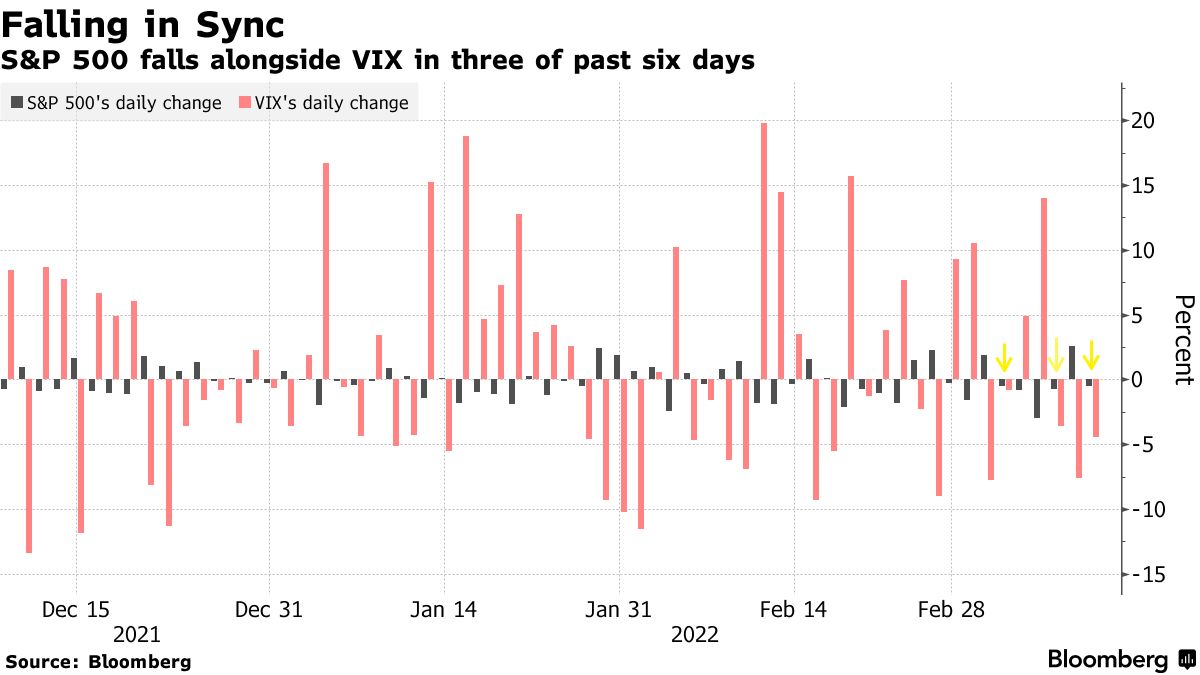
Adding, over the past weeks, we talked about the SPX and VIX down dynamic. This in part has to do with the supply and demand of protection, at the index level. Hyperlinked are our past conversations.

Graphic: Via Bloomberg. S&P 500 (INDEX: SPX) down, CBOE Volatility Index (INDEX: VIX) down.

“We’re back to another point of people being well hedged and well-positioned,” Amy Wu Silverman of Royal Bank of Canada’s (NYSE: RY) capital markets group, said. 

“You’re also seeing people selling that volatility and doing some overwriting. That can probably dampen volatility.”

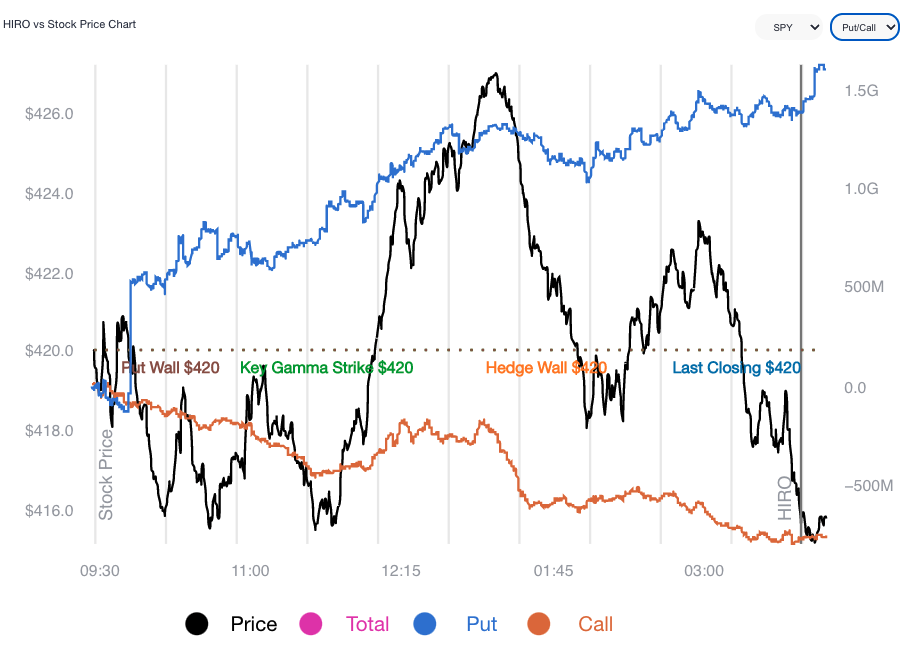
Graphic: SpotGamma’s Hedging Impact of Real-Time Options (HIRO) indicator for the SPDR S&P 500 ETF Trust (NYSE: SPY). Into the S&P 500’s March 8, 2022 decline, participants sold volatility on both sides of the options chain.

“When implied volatility is high, that same 1% move lower is much more ‘expected’ so there generally won’t be the same upward pressure on volatility and in fact it might decline,” said Christopher Jacobson, a strategist at Susquehanna Financial Group LLP.

“Along the same lines, investors at that point have had more opportunity and time to hedge, so those same market moves may not lead to as much hedging activity.”

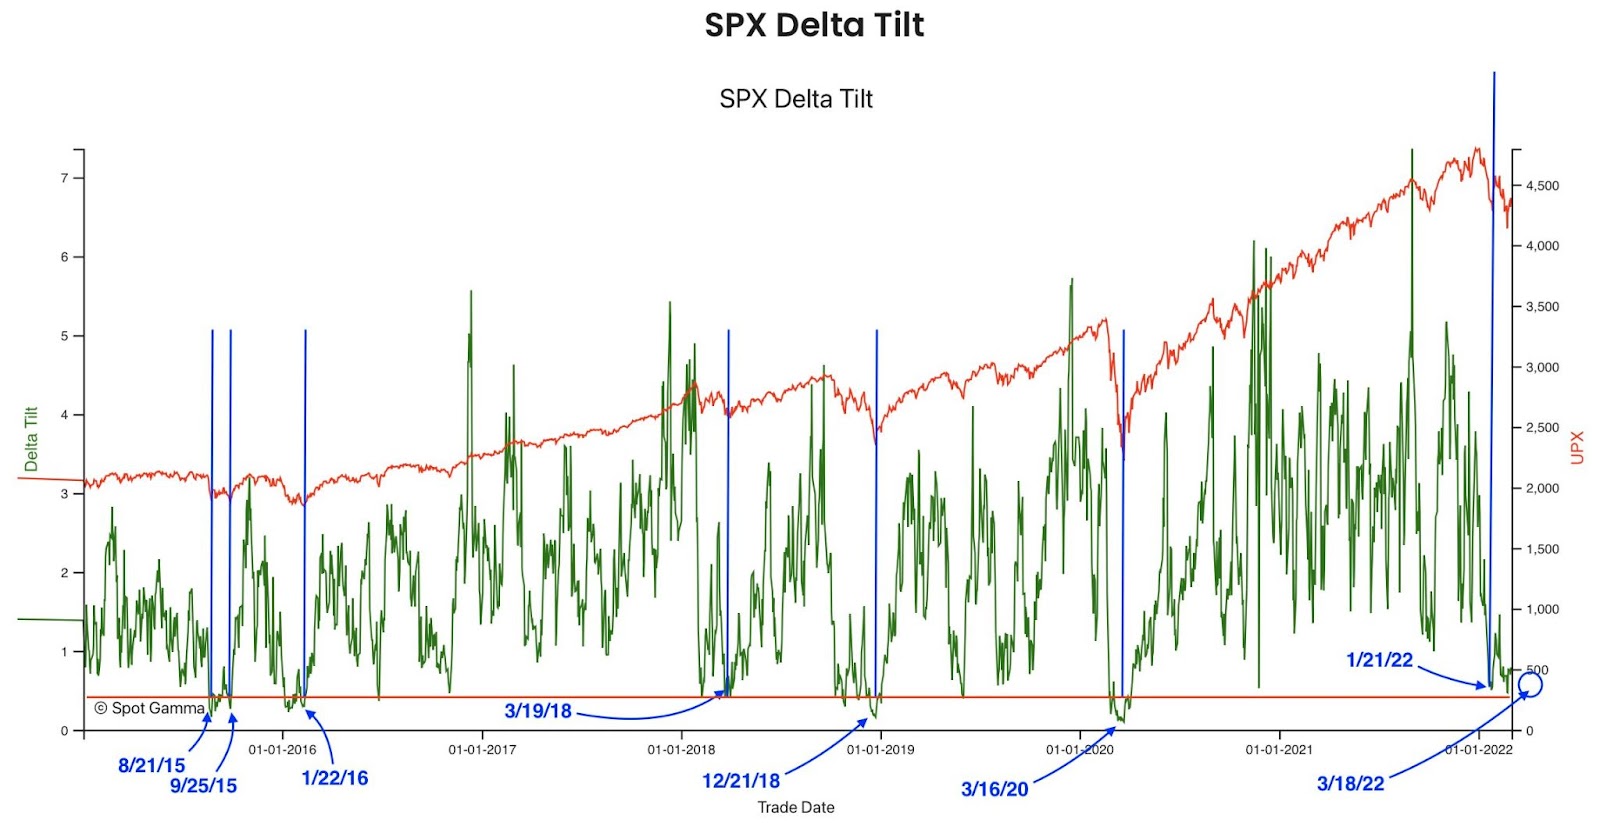
Graphic: Via SpotGamma. “Netting call & put delta, you can see we’re near extremes in terms of put:call positions. Often large put positions are removed by expirations, which seems to coincide with market lows. Many of these are quarterly expirations which coincide w/FOMC meetings – such as next week.”

Taking this together, in accordance with metrics referred to earlier, “we could be closer to the end than the beginning of the discretionary de-risking,” as JPMorgan analysts best explain.

Further, the compression of volatility (via passage of FOMC) or removal of counterparty negative exposure (via OPEX) may serve to alleviate some of this pressure

Until then, participants can expect the options landscape to add to market volatility.

Technical: As of 6:30 AM ET, Friday’s regular session (9:30 AM – 4:00 PM ET), in the S&P 500, will likely open in the upper part of a positively skewed overnight inventory, outside of prior-range and -value, suggesting a potential for immediate directional opportunity.

Balance-Break + Gap Scenarios: A change in the market (i.e., the transition from two-time frame trade, or balance, to one-time frame trade, or trend) is occurring.

Monitor for acceptance (i.e., more than 1-hour of trade) outside of the balance area. 

Leaving value behind on a gap-fill or failing to fill a gap (i.e., remaining outside of the prior session’s range) is a go-with indicator. 

Rejection (i.e., return inside of balance) portends a move to the opposite end of the balance.

In the best case, the S&P 500 trades higher; activity above the $4,314.75 high volume area (HVNode) puts in play the $4,346.75 HVNode. Initiative trade beyond the $4,346.75 HVNode could reach as high as the $4,375.00 untested point of control (VPOC) and $4,395.25 HVNode, or higher.

In the worst case, the S&P 500 trades lower; activity below the $4,314.75 HVNode puts in play the $4,285.75 HVNode. Initiative trade beyond the $4,285.75 HVNode could reach as low as the $4,249.25 low volume area (LVNode) and $4,227.75 HVNode, or lower.

Considerations: Push-and-pull, as well as responsiveness near key-technical areas (that are discernable visually on a chart), suggests technically-driven traders with short time horizons are very active. 

Such traders often lack the wherewithal to defend retests and, additionally, the type of trade may be indicative of the other time frame participants waiting for more information to initiate trades.

Click here to load today’s key levels into the web-based TradingView charting platform. Note that all levels are derived using the 65-minute timeframe. New links are produced, daily.
Graphic: 65-minute profile chart of the Micro E-mini S&P 500 Futures.

What People Are Saying

Definitions

Overnight Rally Highs (Lows): Typically, there is a low historical probability associated with overnight rally-highs (lows) ending the upside (downside) discovery process.

Volume Areas: A structurally sound market will build on areas of high volume (HVNodes). Should the market trend for long periods of time, it will lack sound structure, identified as low volume areas (LVNodes). LVNodes denote directional conviction and ought to offer support on any test. 

If participants were to auction and find acceptance into areas of prior low volume (LVNodes), then future discovery ought to be volatile and quick as participants look to HVNodes for favorable entry or exit.

POCs: POCs are valuable as they denote areas where two-sided trade was most prevalent in a prior day session. Participants will respond to future tests of value as they offer favorable entry and exit.

About

After years of self-education, strategy development, mentorship, and trial-and-error, Renato Leonard Capelj began trading full-time and founded Physik Invest to detail his methods, research, and performance in the markets.

Capelj is also a Benzinga finance and technology reporter interviewing the likes of Shark Tank’s Kevin O’Leary, JC2 Ventures’ John Chambers, FTX’s Sam Bankman-Fried, and ARK Invest’s Catherine Wood, as well as a SpotGamma contributor developing insights around impactful options market dynamics.

Disclaimer

Physik Invest does not carry the right to provide advice.

In no way should the materials herein be construed as advice. Derivatives carry a substantial risk of loss. All content is for informational purposes only.

Categories
Commentary

Daily Brief For March 9, 2022

Editor’s Note: The Daily Brief is a free glimpse into the prevailing fundamental and technical drivers of U.S. equity market products. Join the 200+ that read this report daily, below!

What Happened

Overnight, equity index futures, led by the tech- and growth-heavy Nasdaq 100 auctioned higher. This is immediately after a session characterized by rampant, two-way volatility. 

Much of the action in the equity indices and commodity markets is headline-driven. 

For instance, at one point, alongside news that Ukraine would no longer insist on NATO membership, the S&P 500 auctioned higher nearly 3%. Thereafter, responsive selling at a very key technical level preceded the index’s over 3% drop shortly after.

This push-and-pull, as well as responsiveness near key-technical areas (that are discernable visually on a chart), suggests technically-driven traders with short time horizons are very active. 

Such traders often lack the wherewithal to defend retests and, additionally, the type of trade may be indicative of the other time frame participants waiting for more information to initiate trades.

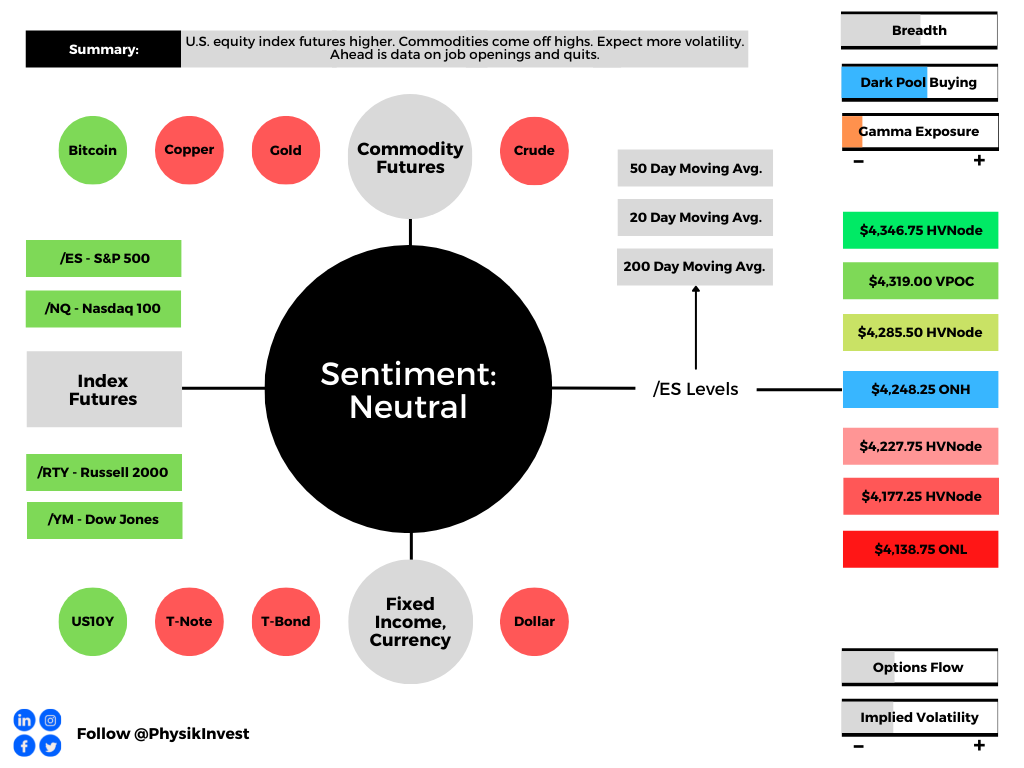
Ahead is data on job openings and quits (10:00 AM ET).

Graphic updated 6:45 AM ET. Sentiment Neutral if expected /ES open is inside of the prior day’s range. /ES levels are derived from the profile graphic at the bottom of the following section. Levels may have changed since initially quoted; click here for the latest levels. SqueezeMetrics Dark Pool Index (DIX) and Gamma (GEX) calculations are based on where the prior day’s reading falls with respect to the MAX and MIN of all occurrences available. A higher DIX is bullish. At the same time, the lower the GEX, the more (expected) volatility. Learn the implications of volatility, direction, and moneyness. SHIFT data used for S&P 500 (INDEX: SPX) options activity. Note that options flow is sorted by the call premium spent; if more positive, then more was spent on call options. Breadth reflects a reading of the prior day’s NYSE Advance/Decline indicator. VIX reflects a current reading of the CBOE Volatility Index (INDEX: VIX) from 0-100.

What To Expect

Fundamental: The prevailing narrative is concerned with the slowdown in economic growth, the intent to withdraw monetary stimulus, and the response to Russia’s invasion of Ukraine.

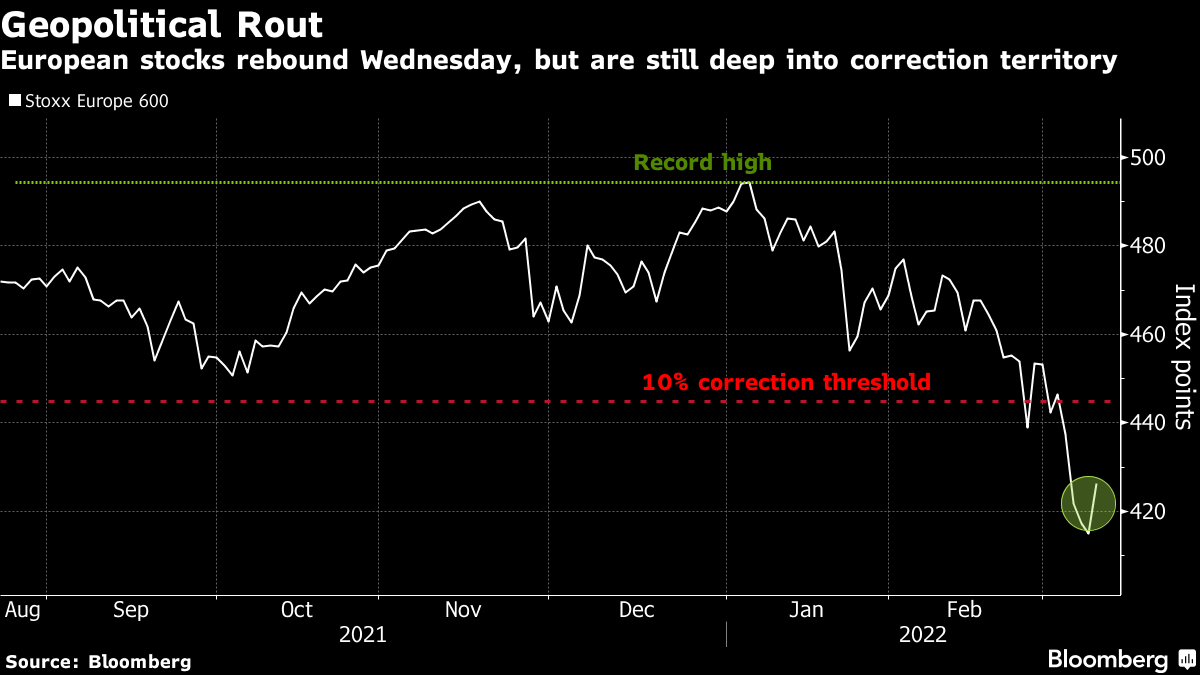
Graphic: Bloomberg. U.S. equity indexes spared of recent bloodshed, abroad.

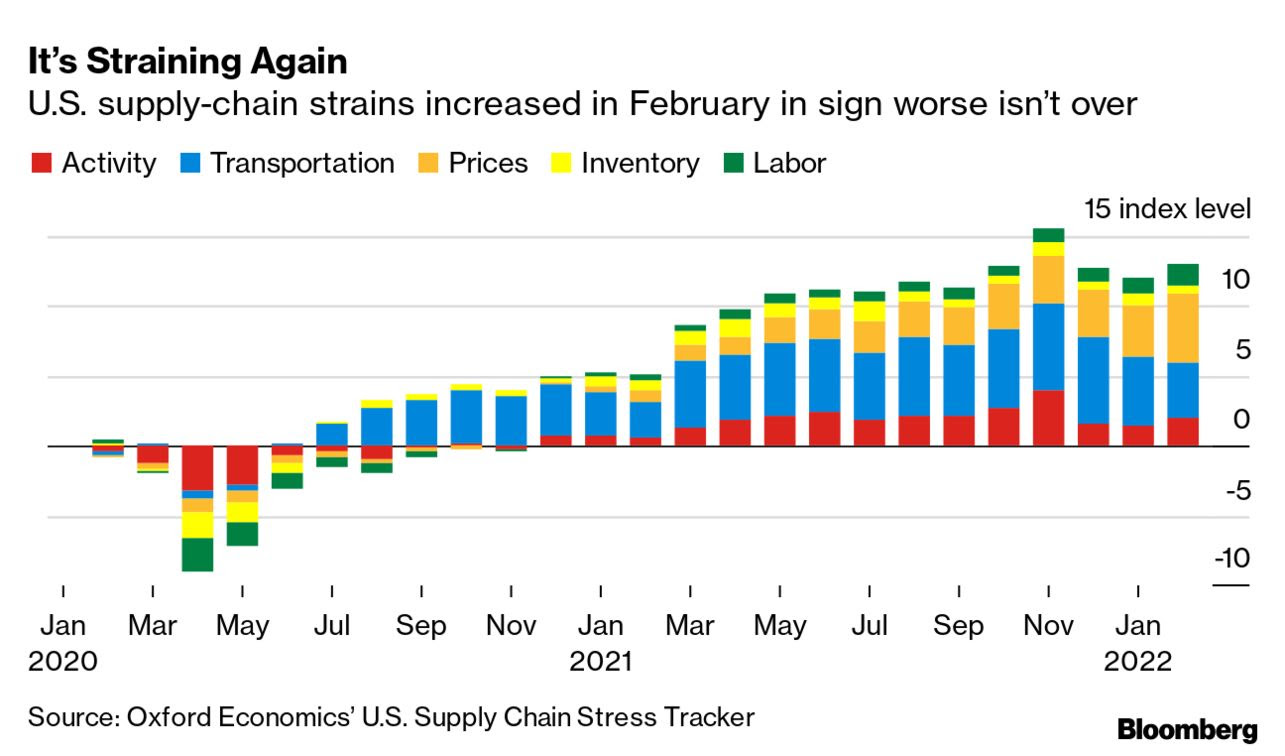
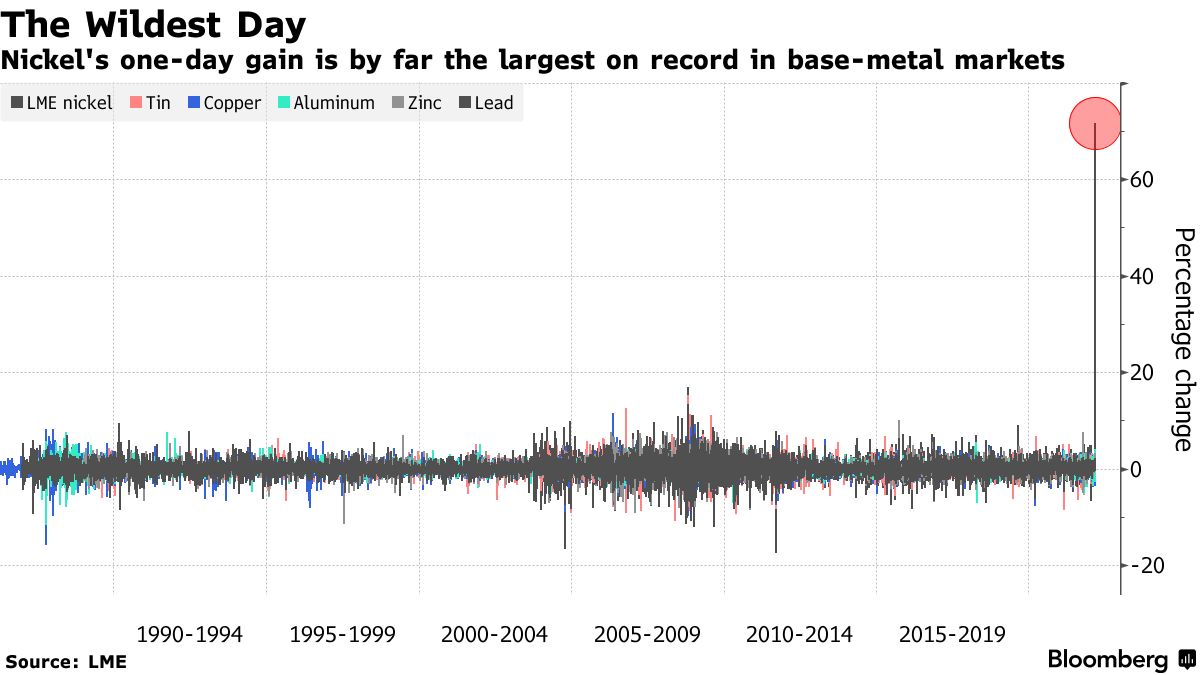
Pursuant to the response to Russia’s invasion of Ukraine has been a disruption in supply chains; commodities, like oil and nickel, have risen and that has inflation and growth impacts.

Graphic: Via Bloomberg, Oxford Economics. “The war in Ukraine is making it harder and more costly for goods to move freely across the globe. Key shipping routes are blocked, and others are feeling ripple effects from the conflict.”

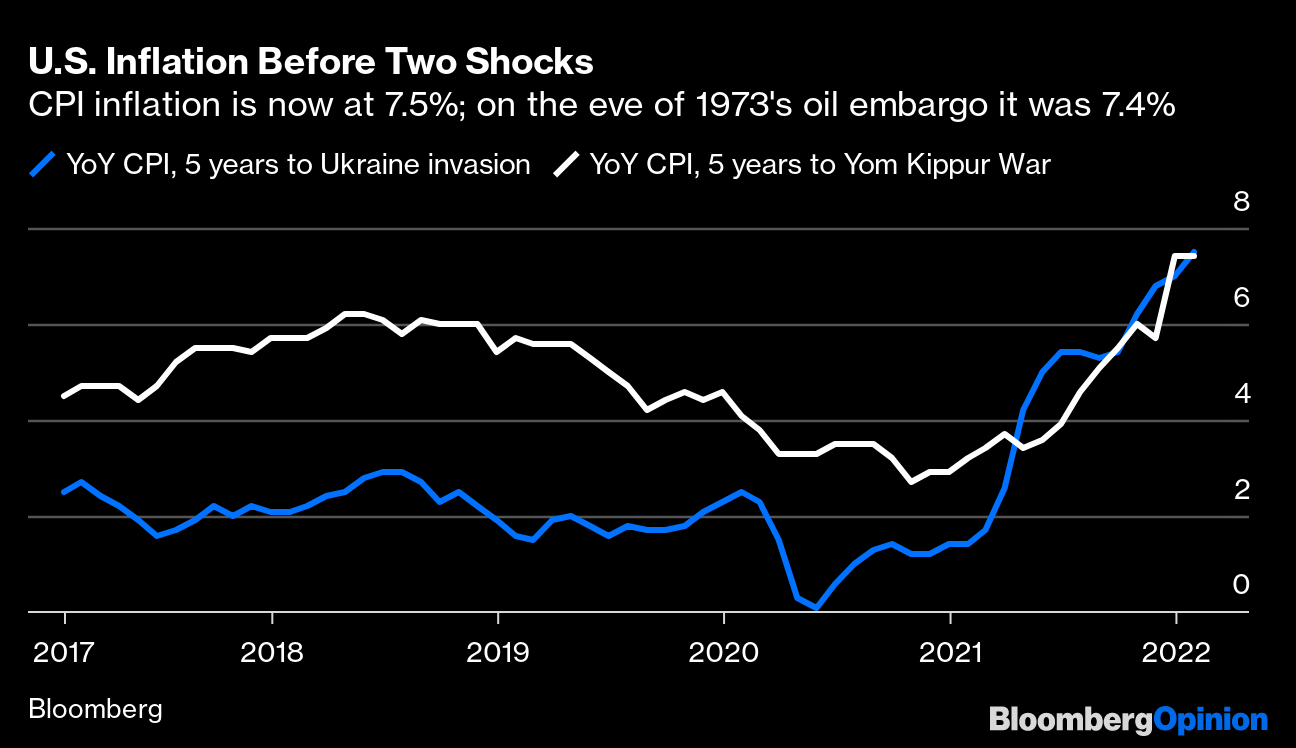
In the coming days and weeks, central banks will announce their monetary policy decisions. Per Bloomberg, commodity costs underline the inflation challenge to the Federal Reserve.

Graphic: Via Bloomberg. The historical analogy is different but close (as today’s economy is less dependent on oil); the “Fed responded to the [1973] shock, and to the growing wave of inflation that preceded it, with a massive tightening.”

With breakevens on 30-year inflation-linked Treasuries – an indicator of the pace of price gains over three decades – climbing to their highest level, the Fed is expected to hike rates 25 bps.

Graphic: Via CME Group Inc (NASDAQ: CME). Participants price in an increased probability of a shift in the target rate. Click here to access the FedWatch Tool.

In the past days, there have been a variety of takes on what’s going on. A pessimistic, yet, interesting take is offered by Credit Suisse Group AG’s (NYSE: CS) Zoltan Pozsar.

Mainly, there is a commodity crisis. Commodities are collateral and collateral is money.

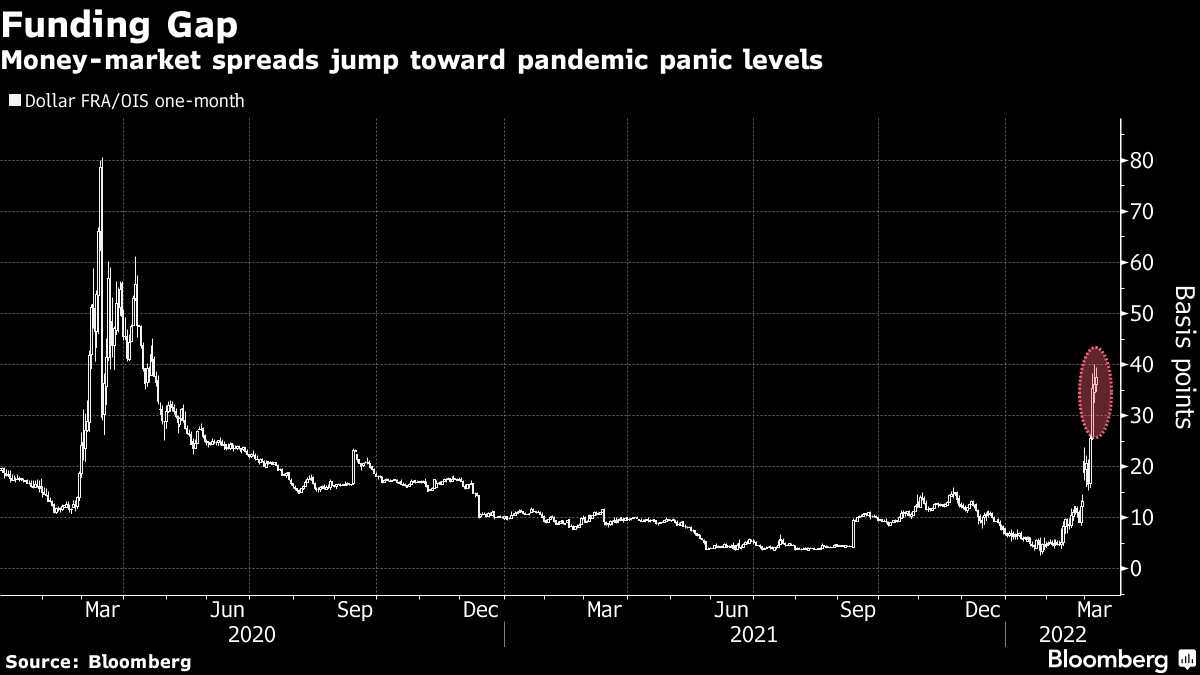
Graphic: Via Bloomberg. The “FRA/OIS, a key gauge of interbank funding risk, as of the close on Monday.” Click here to listen to Zoltan Pozsar’s Bloomberg conversation on Russia, Gold, and the U.S. dollar.

“[E]very crisis occurs at the intersection of funding and collateral markets and that, in the presently unfolding crisis, commodities are collateral, and more precisely, Russian commodities are like subprime collateral and all other stuff is prime.”

Pozsar explains that instability in commodity prices feeds into financial instability as margin calls trigger the failure of commodity traders and (potentially) commodity exchanges.

Graphic: Via Bloomberg. Commodity price rises solicit margin calls.

“Again, commodity correlations are at 1, which is never a good thing,” he says. “The Fed and other central banks will be able to provide liquidity backstops, … but those will be Band-Aid solutions.”

Liquidity is the manifestation of a larger problem – the Russian-non-Russian commodities basis – and its resolve portends a “regime shift” which Pozsar posits China will be at the front of.

“When this crisis (and war) is over, the U.S. dollar should be much weaker and, on the flip side, the renminbi much stronger, backed by a basket of commodities.”

MUFG Securities’ (NYSE: MUFG) George Goncalves makes a similar point, drawing parallels to the early days of 2008. 

“The situation in Europe is precarious enough on its own, but if conditions worsen in a highly connected financial system, balance sheets may get curtailed via haircuts,” Concalves wrote

“Meanwhile there is an eerily similar pattern to the current action in [short-term interest rates] and oil prices to the early summer of 2008. Recall, in response to inflation and central bank hawkishness, markets priced in nearly 150bps in hikes in 2008 before GFC cracked.”

Positioning: Based on metrics often quoted in this morning letter, buying support appears to be cooling. Overlaying options positioning metrics, the returns distribution is skewed positive, still.

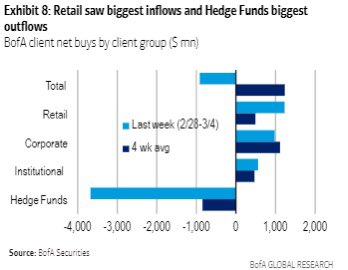
This is in opposition to some of the reporting by large outlets. The narrative is along the lines of institutional investors offloading equities to retail.

Graphic: Via Bank of America Corporation (NYSE: BAC).

According to statements by The Ambrus Group’s Kris Sidial, “This is partially a byproduct of the long equity firms that have programs that are designed to exit when Cboe Volatility Index (INDEX: VIX) gets over a certain level and equities drop under a certain percentage.”

Graphic: Via Pat Hennessy. “ES goes +2%, -2%, +3%, -3% in 14 hours! Yes – the close/close move was weak, but the intraday moves were massive – IMO enough to support a 37 VIX. Strange to see vols so soft given intraday realized + close on lows.”

“There is no doubt about it that we have noticed heavier institutional flow throughout the day over the last two weeks. However, there are still large institutions that are putting cash to work in equities. Ironically a rotation out of some European equities into U.S., [and] there is also a good amount of buyback flow that is projected to hit some areas in U.S equities.

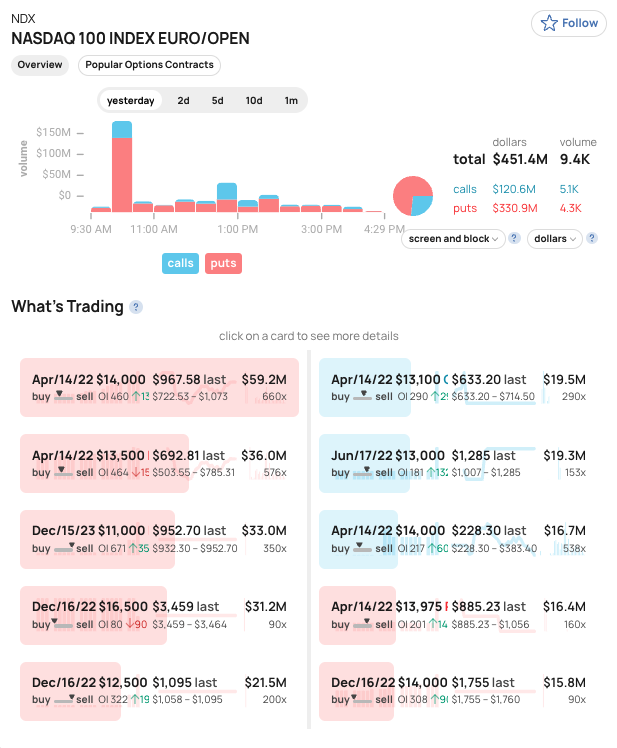
Pursuant to remarks in the fundamental section (and Sidial’s note on the heavier institutional flow), we saw some noteworthy put buying in products like the cash-settled Nasdaq 100 (INDEX: NDX) and iShares iBoxx $ Inv Grade Corporate Bond ETF (NYSE: LQD).

Graphic: Via SHIFT. Buying closer strikes. Selling farther strikes.

Whether these are hedges, the replacement of existing linear short positions, or speculation on the downside, it all plays into this negative gamma environment markets are in.

When customers demand downside (put) protection (a negative delta, positive gamma trade that has its gains multiplied to the downside), counterparties sell underlying futures and stock to hedge their positive delta, negative gamma trade which has the effect of pressuring markets.

The compression of volatility (via passage of FOMC) or removal of counterparty negative exposure (via OPEX) may serve to alleviate some of this pressure. Until then, participants can expect the options landscape to add to market volatility.

Technical: As of 6:45 AM ET, Wednesday’s regular session (9:30 AM – 4:00 PM ET), in the S&P 500, will likely open in the upper part of a positively skewed overnight inventory, inside of prior-range and -value, suggesting a limited potential for immediate directional opportunity.

In the best case, the S&P 500 trades higher; activity above the $4,248.25 overnight high (ONH) puts in play the $4,285.50 high volume area (HVNode). Initiative trade beyond the HVNode could reach as high as the $4,319.00 untested point of control (VPOC) and $4,346.75 high volume area (HVNode), or higher.

In the worst case, the S&P 500 trades lower; activity below the $4,248.25 ONH puts in play the $4,227.75 HVNode. Initiative trade beyond the $4,227.75 HVNode could reach as low as the $4,177.25 HVNode and $4,138.75 ONL, or lower.

Click here to load today’s key levels into the web-based TradingView charting platform. Note that all levels are derived using the 65-minute timeframe. New links are produced, daily.
Graphic: 65-minute profile chart of the Micro E-mini S&P 500 Futures.

Definitions

Overnight Rally Highs (Lows): Typically, there is a low historical probability associated with overnight rally-highs (lows) ending the upside (downside) discovery process.

Volume Areas: A structurally sound market will build on areas of high volume (HVNodes). Should the market trend for long periods of time, it will lack sound structure, identified as low volume areas (LVNodes). LVNodes denote directional conviction and ought to offer support on any test. 

If participants were to auction and find acceptance into areas of prior low volume (LVNodes), then future discovery ought to be volatile and quick as participants look to HVNodes for favorable entry or exit.

POCs: POCs are valuable as they denote areas where two-sided trade was most prevalent in a prior day session. Participants will respond to future tests of value as they offer favorable entry and exit.

About

After years of self-education, strategy development, mentorship, and trial-and-error, Renato Leonard Capelj began trading full-time and founded Physik Invest to detail his methods, research, and performance in the markets.

Capelj is also a Benzinga finance and technology reporter interviewing the likes of Shark Tank’s Kevin O’Leary, JC2 Ventures’ John Chambers, FTX’s Sam Bankman-Fried, and ARK Invest’s Catherine Wood, as well as a SpotGamma contributor developing insights around impactful options market dynamics.

Disclaimer

Physik Invest does not carry the right to provide advice.

In no way should the materials herein be construed as advice. Derivatives carry a substantial risk of loss. All content is for informational purposes only.

Categories
Commentary

Daily Brief For March 2, 2022

Editor’s Note: The Daily Brief is a free glimpse into the prevailing fundamental and technical drivers of U.S. equity market products. Join the 200+ that read this report daily, below!

What Happened

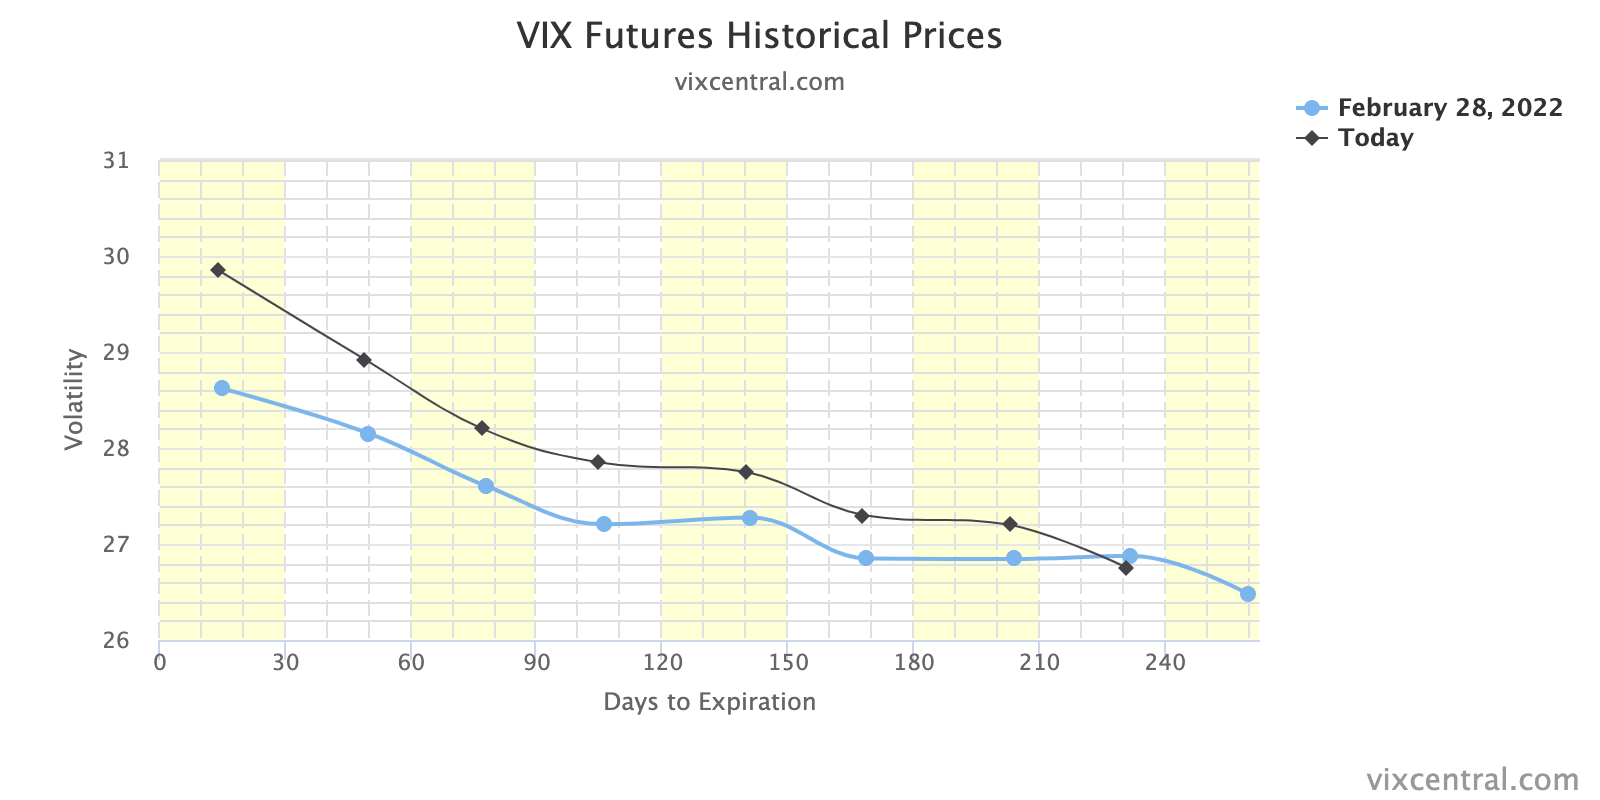
Overnight, futures were mixed. The equity indices auctioned sideways to higher, in line with most commodity products. Bonds were lower, as was the VIX, an implied volatility measure.

Pursuant to the VIX remark, volatility measures in the rates, foreign exchange, and commodity markets are surging amidst geopolitical uncertainties and monetary policy action.

Ahead is data on ADP employment (8:15 AM ET), Fed-speak by Charles Evans (9:00 AM ET), James Bullard (9:30 AM ET), and Jerome Powell (10:00 AM ET). Later, is a release of the Beige Book (2:00 PM ET).

Graphic updated 6:30 AM ET. Sentiment Neutral if expected /ES open is inside of the prior day’s range. /ES levels are derived from the profile graphic at the bottom of the following section. Levels may have changed since initially quoted; click here for the latest levels. SqueezeMetrics Dark Pool Index (DIX) and Gamma (GEX) calculations are based on where the prior day’s reading falls with respect to the MAX and MIN of all occurrences available. A higher DIX is bullish. At the same time, the lower the GEX, the more (expected) volatility. Learn the implications of volatility, direction, and moneyness. SHIFT data used for S&P 500 (INDEX: SPX) options activity. Note that options flow is sorted by the call premium spent; if more positive, then more was spent on call options. Breadth reflects a reading of the prior day’s NYSE Advance/Decline indicator. VIX reflects a current reading of the CBOE Volatility Index (INDEX: VIX) from 0-100.

What To Expect

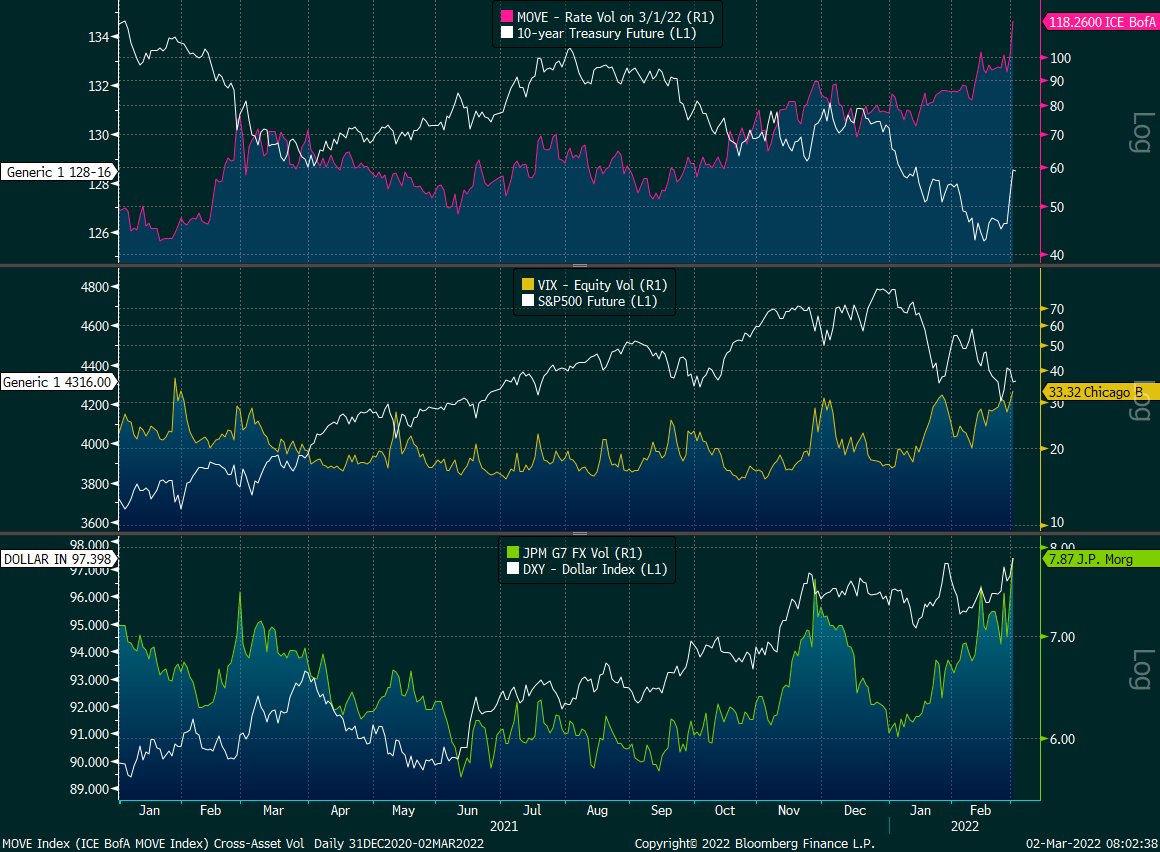
Fundamental: Cross-asset volatility is spiking as investors look to protect against Russia-Ukraine and monetary policy action, among other things.

Graphic: Via @EffMktHype. “Rate vol through the roof, FX picking up steam while equity vol arguably still cheap in comparison despite being at the high end of its 1-year end.” Please note the spike in rate and FX vol versus equity vol (which is sideways to higher, mostly).

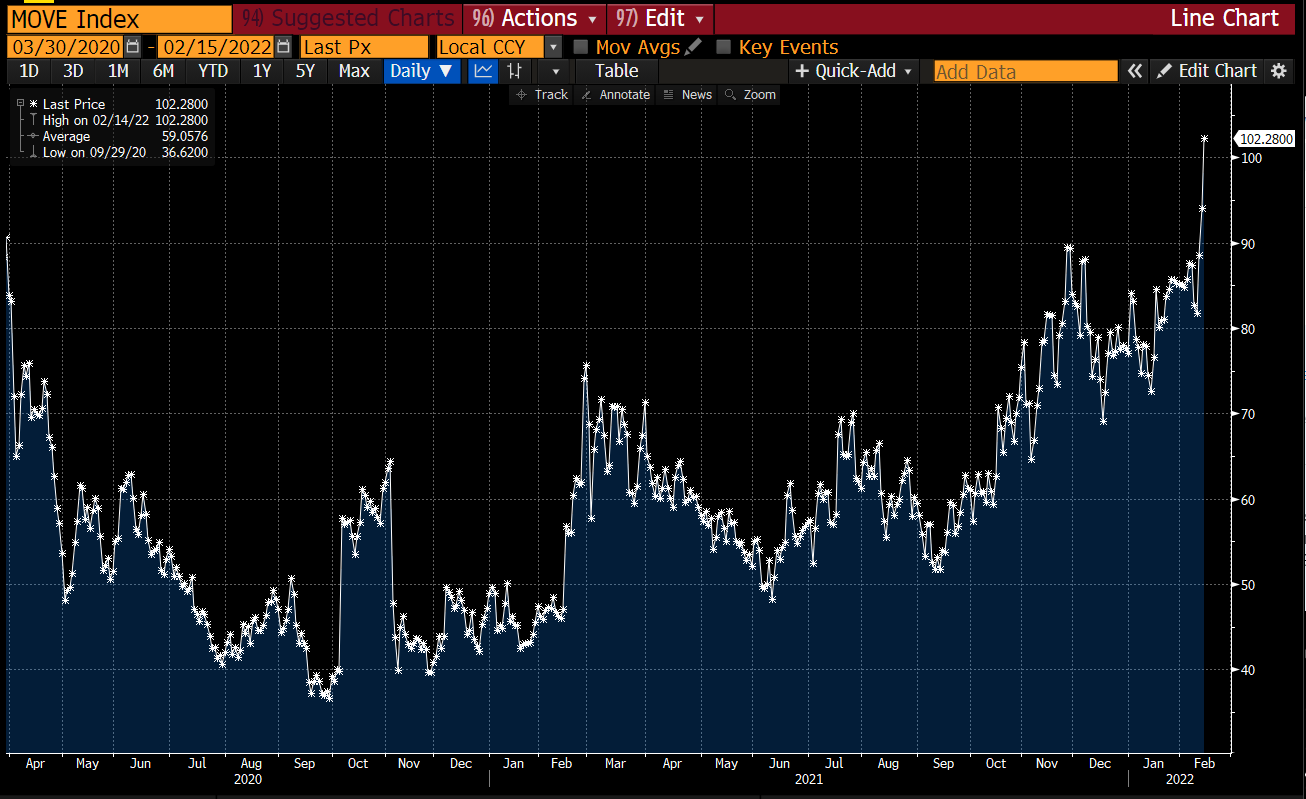
Very interesting is action in the rates market where there was a “5-sigma upward shift in MOVE on 3/1/22. [This] has happened 13 times prior in the last 22 years,” said one commentator.

Graphic: Via @EffMktHype. Merrill Lynch Option Volatility Estimate (INDEX: MOVE).

Taken together, the bond market’s pricing of risk – reflected by the Merrill Lynch Option Volatility Estimate (INDEX: MOVE) – is not in line (or moving in-step) with equity market risk, via the CBOE Volatility Index (INDEX: VIX).

The fear in one market tends to feed into the fear of another; regardless of the cause, it seems that equity and bond market participants are not (quite) on the same page.

Moreover, this is in part beyond a decline in liquidity (the variable that’s been connected with the creation of wealth through higher asset prices over time), and has much to do with participants “de-risking” amidst a wide distribution of potential outcomes, another commentator explained

These fears are in the face of emerging risks to growth (given Russia-Ukraine and beyond); the question is whether there is a dovish surprise and this lends to assuaging participants of fear.

Graphic: Via @EffMktHype. “Forward OIS have coalesced since end-Jan and started to aggressively price out rate hikes.”

Taking a look at the U.S. high yield OAS (option-adjusted spread), participants see a “risk-off” bottom; deteriorating credit conditions are a bearish leading indicator. 

Will there be further deterioration that feeds into an eventual repricing of equity market risk? Or, will there be a pullback on hawkishness like the market has started pricing?

Graphic: Via St. Louis Fed. ICE BoA High YIeld OAS.

Positioning: Pursuant to the remarks made on equity implied volatility, March 1, 2022, was “the first day since late January that the options market [was] pricing up volatility a noteworthy but not extreme amount (on a closing basis).”

This is, per SpotGamma, amidst participants’ heightened demand for downside (put) protection; in purchasing protection, traders indirectly take liquidity as counterparties hedge exposure in the underlying.

The effects of this hedging are more notable given reticence on the part of counterparties.

“Essentially, with markets swinging there is a hesitance amongst liquidity providers to step in. This creates an environment in which the absorption of orders deteriorates,” SpotGamma explains. “Given this, the hedging of options exposure further amplifies market moves.”

A heightened VIX, in the face of an equity market that is not trading much weaker, is a clear reflection of this so-called reticence.

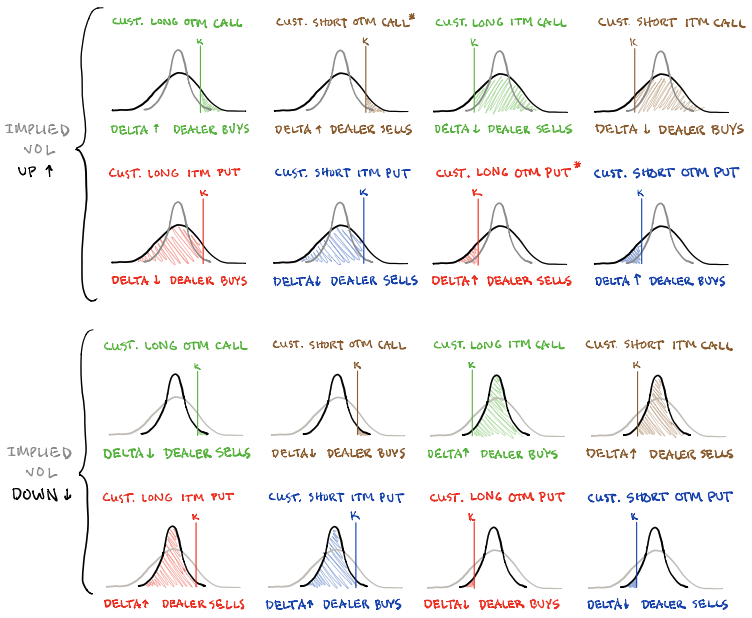
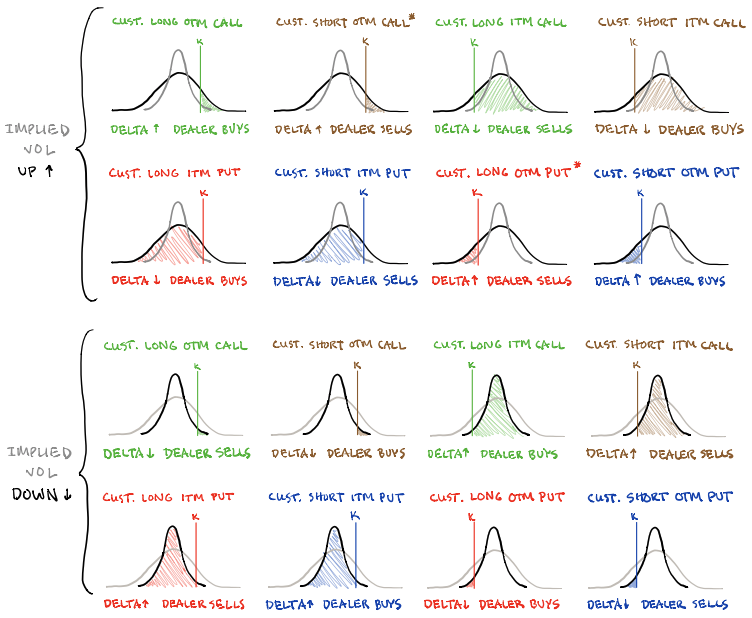
Pictured: SqueezeMetrics highlights implications of volatility, direction, and moneyness.

Going forward, bearing in mind the continued passive buying support alluded to in past commentaries, if participants were to be assuaged of their fears, that would likely coincide with less(er) demand for downside protection and compression in volatility.

The implications of this? Reduced demand for protection coincides with less counterparty negative gamma exposure (as counterparty put buying [a negative delta, positive gamma trade] coincides with the addition of liquidity [purchase of underlying, a positive delta trade]). 

In counterparties being less exposed to losses on the downside (via reduced negative gamma exposure), their (re)hedging may bolster attempts higher (i.e., open the door to the upside).

The likelihood of this dynamic coming to fruition is low(er), up until the passage of the Federal Open Market Committee event March 15-16, 2022, and options expiration (that same week).

Graphic: Fear and demand for protection concentrated in shorter-dated contracts most sensitive to changes in implied volatility and direction results in pressure from hedging. The compression of volatility likely coincides with support of attempts higher (as this removes pressure).

Technical: As of 6:30 AM ET, Wednesday’s regular session (9:30 AM – 4:00 PM ET), in the S&P 500, will likely open in the upper part of a balanced overnight inventory, inside of prior-range and -value, suggesting a limited potential for immediate directional opportunity.

In the best case, the S&P 500 trades higher; activity above the $4,285.50 high volume area (HVNode) puts in play the $4,346.75 HVNode. Initiative trade beyond the $4,346.75 HVNode could reach as high as the $4,398.50 overnight high (ONH) and $4,415.00 VPOC, or higher.

In the worst case, the S&P 500 trades lower; activity below the $4,285.50 HVNode puts in play the $4,227.75 overnight low. Initiative trade beyond the ONL could reach as low as the $4,177.25 HVNode and $4,137.00 untested point of control (VPOC), or lower.

Considerations: The market is in balance or rotational trade that suggests current prices offer favorable entry and exit. Balance-areas make it easy to spot a change in the market (i.e., the transition from two-time frame trade, or balance, to one-time frame trade, or trend). 

Modus operandi is responsive trade (i.e., fade the edges), rather than initiative trade (i.e., play the break).

Click here to load today’s key levels into the web-based TradingView charting platform. Note that all levels are derived using the 65-minute timeframe. New links are produced, daily.
Graphic: 65-minute profile chart of the Micro E-mini S&P 500 Futures.

What People Are Saying

Definitions

Volume Areas: A structurally sound market will build on areas of high volume (HVNodes). Should the market trend for long periods of time, it will lack sound structure, identified as low volume areas (LVNodes). LVNodes denote directional conviction and ought to offer support on any test. 

If participants were to auction and find acceptance into areas of prior low volume (LVNodes), then future discovery ought to be volatile and quick as participants look to HVNodes for favorable entry or exit.

Gamma: Gamma is the sensitivity of an option to changes in the underlying price. Dealers that take the other side of options trades hedge their exposure to risk by buying and selling the underlying. When dealers are short-gamma, they hedge by buying into strength and selling into weakness. When dealers are long-gamma, they hedge by selling into strength and buying into weakness. The former exacerbates volatility. The latter calms volatility.

Vanna: The rate at which the delta of an option changes with respect to volatility.

Charm: The rate at which the delta of an option changes with respect to time.

POCs: POCs are valuable as they denote areas where two-sided trade was most prevalent in a prior day session. Participants will respond to future tests of value as they offer favorable entry and exit.

Volume-Weighted Average Prices (VWAPs): A metric highly regarded by chief investment officers, among other participants, for quality of trade. Additionally, liquidity algorithms are benchmarked and programmed to buy and sell around VWAPs.

Rates: Low rates have to potential to increase the present value of future earnings making stocks, especially those that are high growth, more attractive. To note, inflation and rates move inversely to each other. Low rates stimulate demand for loans (i.e., borrowing money is more attractive).

About

After years of self-education, strategy development, mentorship, and trial-and-error, Renato Leonard Capelj began trading full-time and founded Physik Invest to detail his methods, research, and performance in the markets.

Capelj is also a Benzinga finance and technology reporter interviewing the likes of Shark Tank’s Kevin O’Leary, JC2 Ventures’ John Chambers, FTX’s Sam Bankman-Fried, and ARK Invest’s Catherine Wood, as well as a SpotGamma contributor developing insights around impactful options market dynamics. 

Disclaimer

Physik Invest does not carry the right to provide advice.

In no way should the materials herein be construed as advice. Derivatives carry a substantial risk of loss. All content is for informational purposes only.
Categories
Commentary

Daily Brief For March 1, 2022

Editor’s Note: The Daily Brief is a free glimpse into the prevailing fundamental and technical drivers of U.S. equity market products. Join the 200+ that read this report daily, below!

What Happened

Overnight, equity indices auctioned lower, further into the thick of Monday’s wide trading range. 

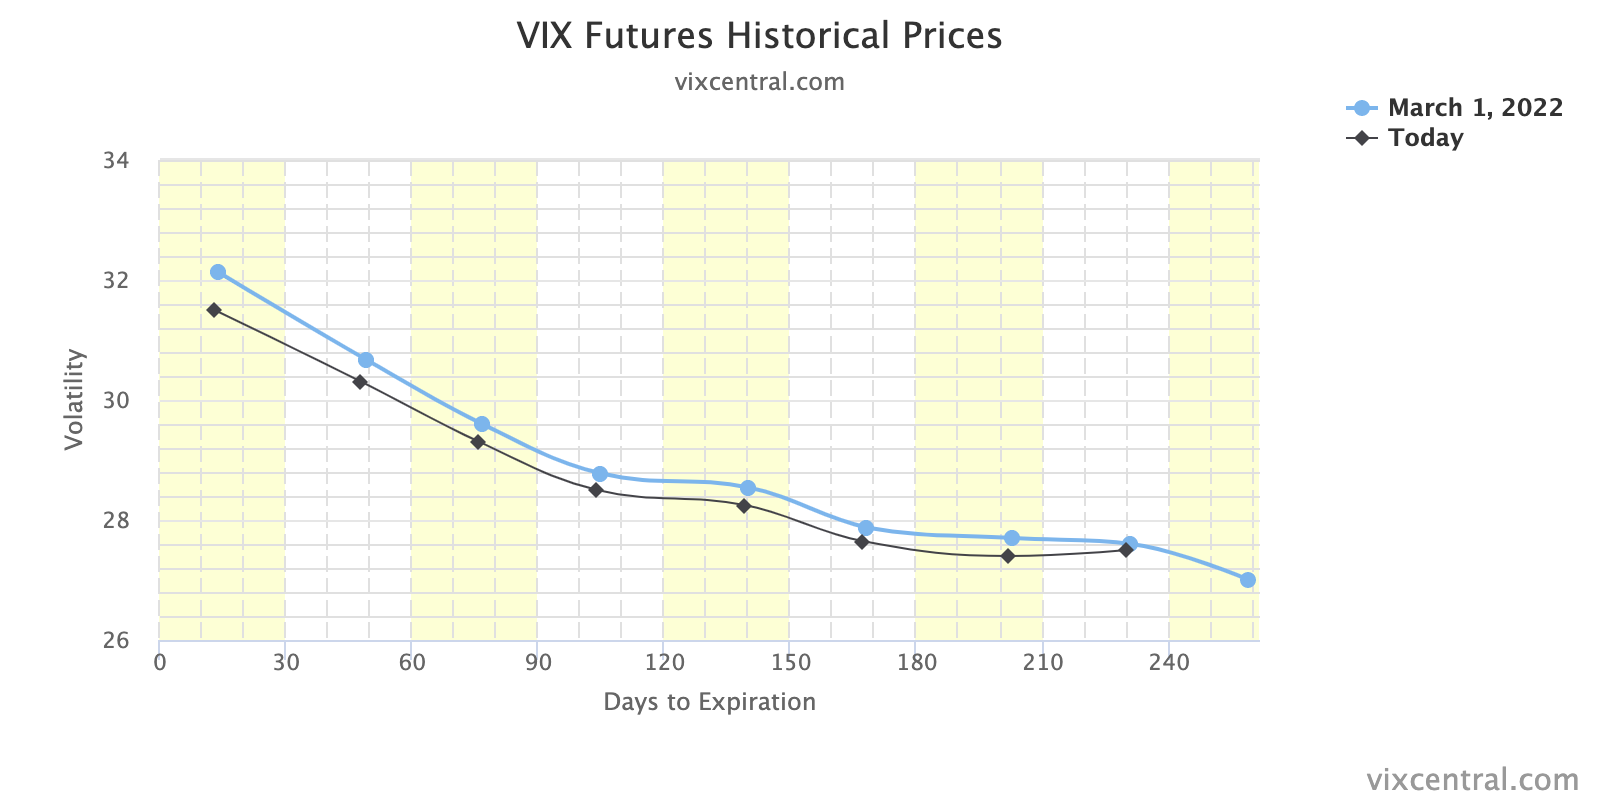
The implied volatility (VIX) term structure is downward sloping as front-month contracts price higher than those in the back as a result of participants’ heightened fear in the short-term.

The take by some on current events and their impact on markets is mixed. 

Some suggest the ‘worst might be behind us’ while others suggest markets may tend toward instability until participants’ fears are assuaged at the next Federal Reserve meeting, and the decline in so-called negative gamma exposures post-options expiry later this month.

Ahead is data on Markit manufacturing PMI (9:45 AM ET), as well as ISM manufacturing index and constructions spending (10:00 AM ET).

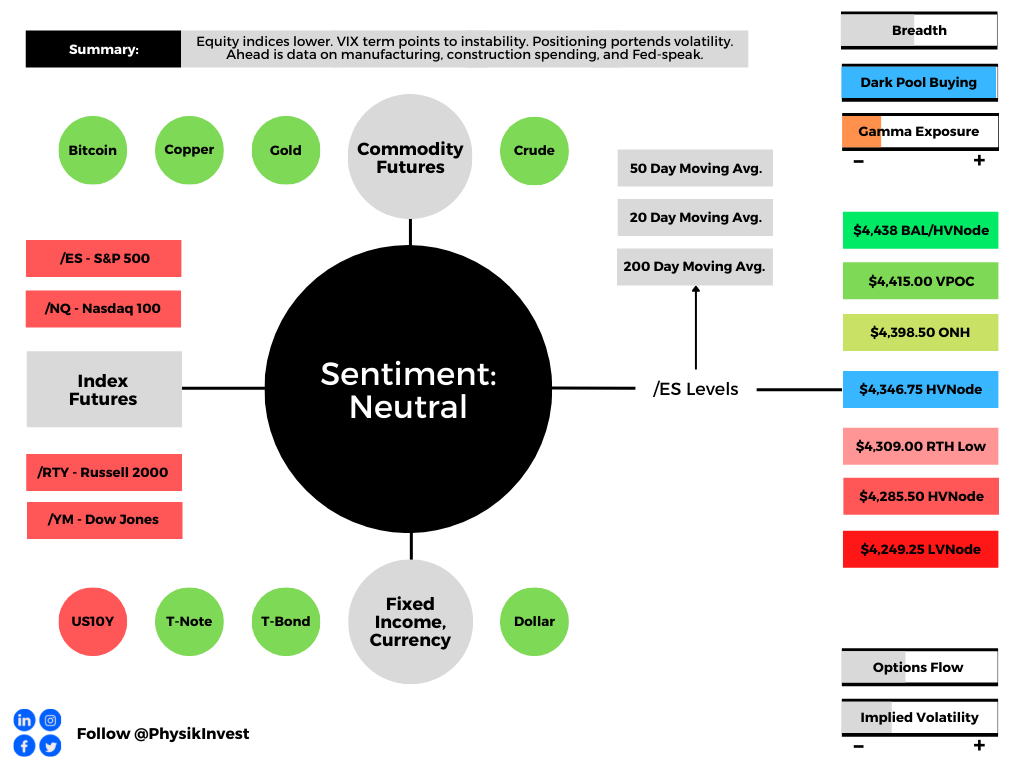
Graphic updated 6:45 AM ET. Sentiment Neutral if expected /ES open is inside of the prior day’s range. /ES levels are derived from the profile graphic at the bottom of the following section. Levels may have changed since initially quoted; click here for the latest levels. SqueezeMetrics Dark Pool Index (DIX) and Gamma (GEX) calculations are based on where the prior day’s reading falls with respect to the MAX and MIN of all occurrences available. A higher DIX is bullish. At the same time, the lower the GEX, the more (expected) volatility. Learn the implications of volatility, direction, and moneyness. SHIFT data used for S&P 500 (INDEX: SPX) options activity. Note that options flow is sorted by the call premium spent; if more positive, then more was spent on call options. Breadth reflects a reading of the prior day’s NYSE Advance/Decline indicator. VIX reflects a current reading of the CBOE Volatility Index (INDEX: VIX) from 0-100.

What To Expect

Fundamental: Pursuant to remarks this commentary disclosed yesterday from Credit Suisse Group AG’s (NYSE: CS) Zoltan Pozsar, other strategists, like JPMorgan Chase & Co’s (NYSE: JPM) Marko Kolanovic believe geopolitical conflicts (and harsh responses) are likely to dim the prospects for aggressive Federal Reserve monetary tightening initiatives. 

“The worst might be behind us for risk assets,” Kolanovic said. The strategist sees heightened short-term opportunity in growth stocks such as tech and medium-term value in value stocks and commodity-linked assets.

“Indirect risks are more substantial, given effects of higher commodity prices on inflation, growth, and consumers; however, one silver lining is that the crisis forced a dovish reassessment of the Fed by the market.” 

Graphic: Per Bloomberg, after the escalation of conflict abroad, the market priced in diminished odds of a 50-basis-point rate hike in March.

This is in opposition to valuation worries by Morgan Stanley’s (NYSE: MS) Mike Wilson.

“The median stock forward P/E for the S&P is still 19x (94th percentile of historical levels back 40 years). We think this lends support to the idea that multiples across the index have room to compress due to our Ice thesis even after discounting the geopolitical developments of the last couple of weeks as well as a hawkish Fed.” 

To note, historically speaking, though “big stock gains tend to happen late in a mid-term year, … be aware that March tends to see strength,” LPL Financial’s Ryan Detrick says.

Graphic: Via LPL Financial.

Positioning: As stated, yesterday, there is strong passive buying support (via buybacks and retail inflows), and this is in the face of a negative-gamma, lower liquidity, high-volatility regime.

Graphic: Via Goldman Sachs. Taken from The Market Ear. “US equities on the GS Prime book saw the largest $ net buying in the past month (1-Year Z score +2.0), driven by long buys and to a lesser extent short covers (2.4 to 1), … [and] single Names saw the largest net buying in a month (1-Year Z score +2.0), driven entirely by long buys as short flows were relatively flat.”

Participants have pulled forward their bets and are trading in some of the most short-dated contracts, and this is evidenced still via a downward sloping VIX term structure.

Graphic: VIX term structure. Shifts higher portend negative delta hedging flows with respect to increases in volatility (vanna). Shifts lower portend positive vanna flows.

Jefferies Financial Group (NYSE: JEF) ran an analysis and found that VIX inversions often precede positive resolve.

“[W]e ran SPX performance from VIX inversions going back to 2004. While the performance seems a bit middling, outside of the GFC, it balloons, with 6M SPX performance over 6% and 12M over 12%. In addition, the inversion we saw on Wednesday was over 3 handles, which has led to even better performance. Outside of the GFC, 12M SPX performance has averaged over 17% and been positive in every single instance.”

Graphic: Via Jefferies. Taken from The Market Ear.

Further, prevailing monetary frameworks and max liquidity promoted a large divergence in price from fundamentals. The evolution of monetary policy may make valuations much less justifiable. 

Therefore, participants are looking to events such as the March Federal Open Market Committee (FOMC) meeting mid-March (March 15-16) for clarity on policy. 

After this event provides clarity and potentially assuages participants of their fears, there is a large options expiration the same week. 

Participants having less fear likely coincides with the lesser need to hedge, while the large options expiration is to “reset” options counterparty gamma exposures.

At present, the demand for downside (put) protection leaves counterparties short puts (i.e., a positive-delta, negative-gamma trade in which losses are amplified on increases in volatility or trade lower). 

Options expirations work to clear this exposure and therefore are to reduce the amount of negative gamma. In having less negative gamma to hedge, there will be counterparty-based support (i.e., a buy-back of the short stock and futures hedges to the short put exposures).

Technical: As of 6:30 AM ET, Tuesday’s regular session (9:30 AM – 4:00 PM ET), in the S&P 500, will likely open in the lower part of a balanced overnight inventory, inside of prior-range and -value, suggesting a limited potential for immediate directional opportunity.

In the best case, the S&P 500 trades higher; activity above the $4,346.75 high volume area (HVNode) puts in play the $4,398.50 overnight high (ONH). Initiative trade beyond the ONH could reach as high as the $4,415.00 untested point of control (VPOC) and $4,438.75 key response area, or higher.

In the worst case, the S&P 500 trades lower; activity below the $4,346.75 HVNode puts in play the $4,309.00 regular trade low (RTH Low). Initiative trade beyond the RTH Low could reach as low as the $4,285.50 HVNode and $4,249.25 low volume area (LVNode), or lower.

Click here to load today’s key levels into the web-based TradingView charting platform. Note that all levels are derived using the 65-minute timeframe. New links are produced, daily.
Graphic: 65-minute profile chart of the Micro E-mini S&P 500 Futures.

Definitions

Cave-Fill Process: Widened the area deemed favorable to transact at by an increased share of participants. This is a good development.

Overnight Rally Highs (Lows): Typically, there is a low historical probability associated with overnight rally-highs (lows) ending the upside (downside) discovery process.

Volume Areas: A structurally sound market will build on areas of high volume (HVNodes). Should the market trend for long periods of time, it will lack sound structure, identified as low volume areas (LVNodes). LVNodes denote directional conviction and ought to offer support on any test. 

If participants were to auction and find acceptance into areas of prior low volume (LVNodes), then future discovery ought to be volatile and quick as participants look to HVNodes for favorable entry or exit.

Gamma: Gamma is the sensitivity of an option to changes in the underlying price. Dealers that take the other side of options trades hedge their exposure to risk by buying and selling the underlying. When dealers are short-gamma, they hedge by buying into strength and selling into weakness. When dealers are long-gamma, they hedge by selling into strength and buying into weakness. The former exacerbates volatility. The latter calms volatility.

Vanna: The rate at which the delta of an option changes with respect to volatility.

POCs: POCs are valuable as they denote areas where two-sided trade was most prevalent in a prior day session. Participants will respond to future tests of value as they offer favorable entry and exit.

About

After years of self-education, strategy development, mentorship, and trial-and-error, Renato Leonard Capelj began trading full-time and founded Physik Invest to detail his methods, research, and performance in the markets.

Capelj is also a Benzinga finance and technology reporter interviewing the likes of Shark Tank’s Kevin O’Leary, JC2 Ventures’ John Chambers, FTX’s Sam Bankman-Fried, and ARK Invest’s Catherine Wood, as well as a SpotGamma contributor developing insights around impactful options market dynamics.

Disclaimer

Physik Invest does not carry the right to provide advice.

In no way should the materials herein be construed as advice. Derivatives carry a substantial risk of loss. All content is for informational purposes only.
Categories
Commentary

Daily Brief For February 18, 2022

Editor’s Note: The Daily Brief is a free glimpse into the prevailing fundamental and technical drivers of U.S. equity market products. Join the 200+ that read this report daily, below!

What Happened

Overnight, equity index futures auctioned back up into range after a spike lower from multi-day balance. The overnight response, higher, happened after Russian Foreign Minister Sergei Lavrov agreed to meet U.S. Secretary of State Antony Blinken for talks in Europe next week.

Ahead is data on existing home sales and leading economic indicators (10:00 AM ET), as well as Fed-speak by Christopher Waller (10:15 AM ET), John Williams (11:00 AM ET), and Lael Brainard (1:30 PM ET).

In observance of Washington’s Birthday, markets are closed Monday, February 21, 2022.

Graphic updated 6:45 AM ET. Sentiment Neutral if expected /ES open is inside of the prior day’s range. /ES levels are derived from the profile graphic at the bottom of the following section. Levels may have changed since initially quoted; click here for the latest levels. SqueezeMetrics Dark Pool Index (DIX) and Gamma (GEX) calculations are based on where the prior day’s reading falls with respect to the MAX and MIN of all occurrences available. A higher DIX is bullish. At the same time, the lower the GEX, the more (expected) volatility. Learn the implications of volatility, direction, and moneyness. SHIFT data used for S&P 500 (INDEX: SPX) options activity. Note that options flow is sorted by the call premium spent; if more positive, then more was spent on call options. Breadth reflects a reading of the prior day’s NYSE Advance/Decline indicator. VIX reflects a current reading of the CBOE Volatility Index (INDEX: VIX) from 0-100.

What To Expect

Fundamental: Given the persistence of mechanical responses to key levels, visually-driven, weaker-handed participants (which seldom bear the wherewithal to defend retests) carry a heavier hand in recent price discovery.

The takeaway is that the larger, other time frame (OTF) participants are waiting for more information before committing to substantial expansion of range via large sales or buys.

Information the OTFs are seeking to process and position themselves in accordance with are (but not limited to) geopolitical tensions and contractionary monetary policy.

Thursday’s commentary went in-depth on the implications of more severe Fed-action. Mainly, to slow inflation and rid the market of excesses, “a Volcker moment” is needed a strategist said.

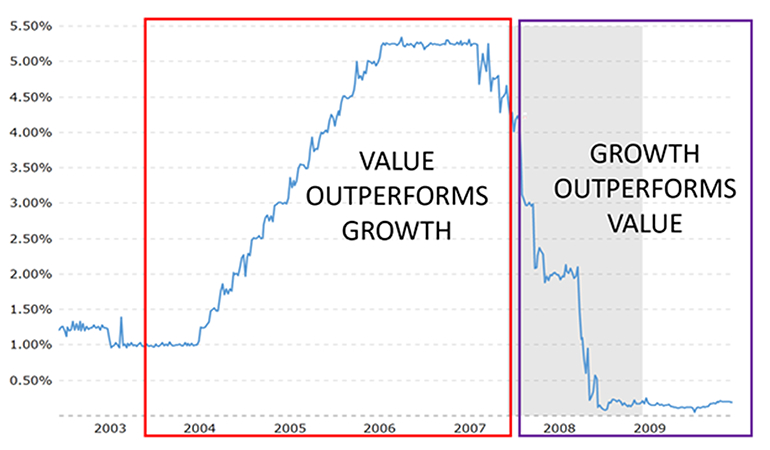
Graphic: Via MacroTrends & Cboe Options Institute. “Value stocks started to outperform when the Federal Reserve (under Greenspan) communicated their intent to tighten policy. Value fell out of favor in the middle of 2007 following a UST yield curve inversion and looser monetary policy (under Bernanke).”

The Ambrus Group’s Kris Sidial, and others, expressed their differing sentiments on the issue, given that equities are so intertwined with consumer savings.

“There is no way the fed looks to use additional volatility as a policeman,” he explained. “It’s one of those things that sounds ok in theory but will not work in real-world applications.”

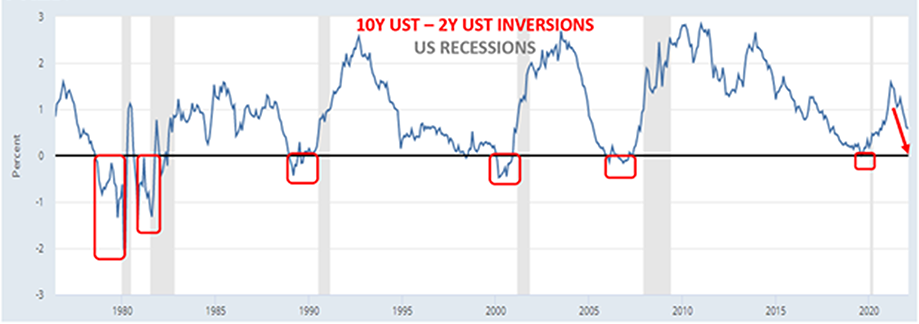
As Moody’s Corporation (NYSE: MCO) puts well, “This cycle is unlike any recent one and, while there are a ton of reasons to be optimistic about the U.S. economy’s near-term prospects, there are also reasons to worry that a recession isn’t far off on the horizon.”

Graphic: Via St. Louis Fed. Taken from Cboe Global Markets Inc (BATS: CBOE). “In fact, a dynamic where short-dated bond yields are higher than longer-dated bonds can reinforce an economic slowdown. The cost of capital is perhaps the most important component for evaluating so many other market relationships. Any investment that involves borrowed money becomes more expensive when the cost of capital increases. More is spent on interest payments. Higher rates incentivize saving (as opposed to consumption) which impacts businesses and the economy as a whole.”

“If the Fed is forced to raise the fed funds rate above its neutral rate to tame inflation, the stage will be set for recession. Also, some Fed officials believe they are falling further behind the curve, which could lead to a more aggressive tightening cycle, a recipe for an economic downturn in 2023 or 2024.”

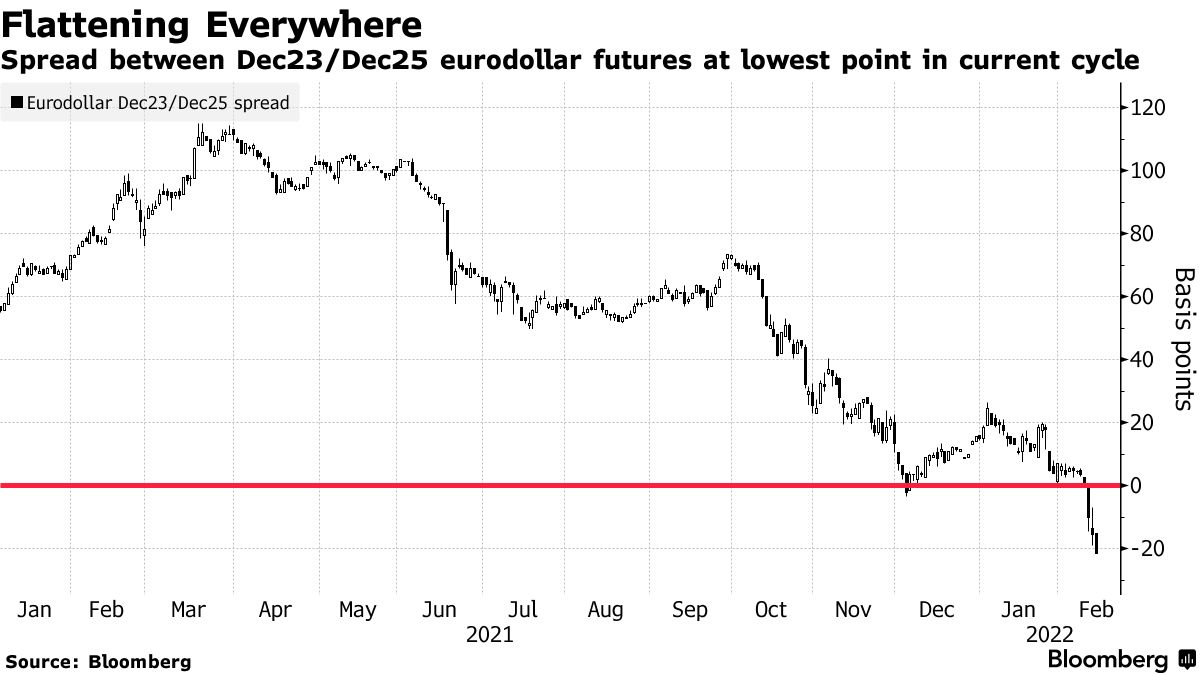
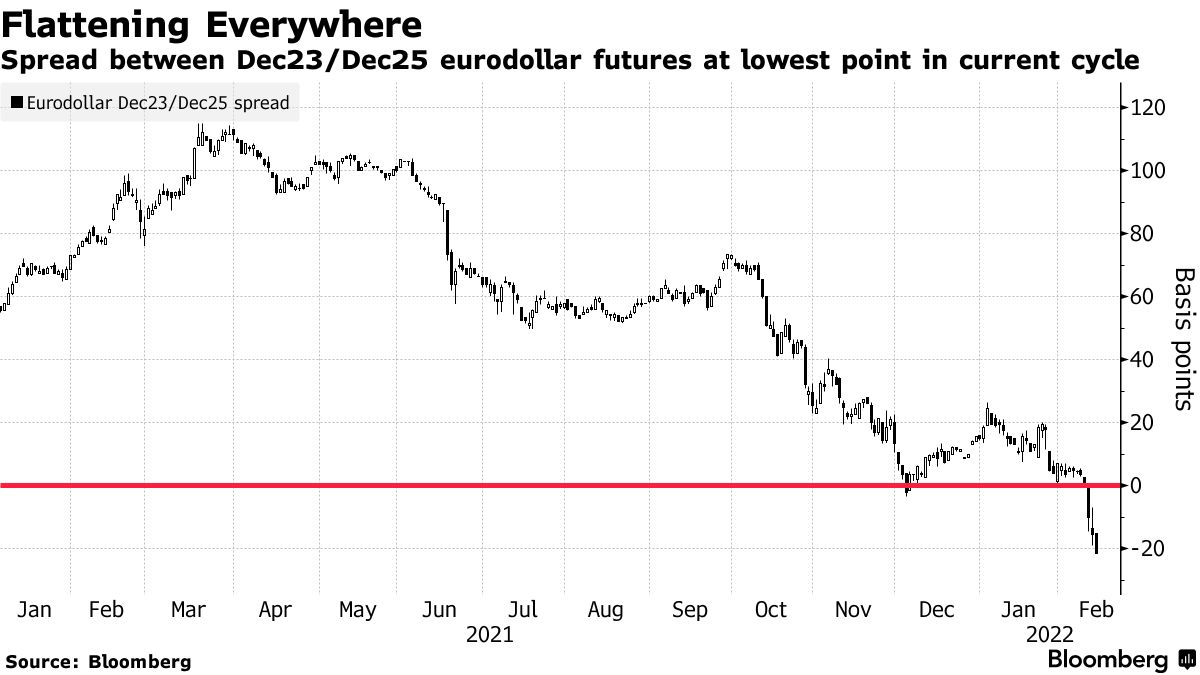
Based on this sentiment, investors have already bet – via the eurodollar futures contract – on the Fed reversing its tightening course in late 2023. The current baseline calls for four 25-basis point rate hikes this year.

Graphic: Via Bloomberg. “In the eurodollar futures markets, the spread between the December 2023 and December 2025 contracts has dropped further into negative territory on Monday — implying a near-25 basis point cut in the federal funds benchmark over this 24-month timeframe.”

“We, therefore, think that the more likely path is a longer series of 25-basis point increases in the target range for the fed funds rate and we may need to add an additional rate hike to our baseline forecast in March,” Moody’s says in response to more hawkish pricings as a result of market focus on comments by hawkish regional Fed presidents.

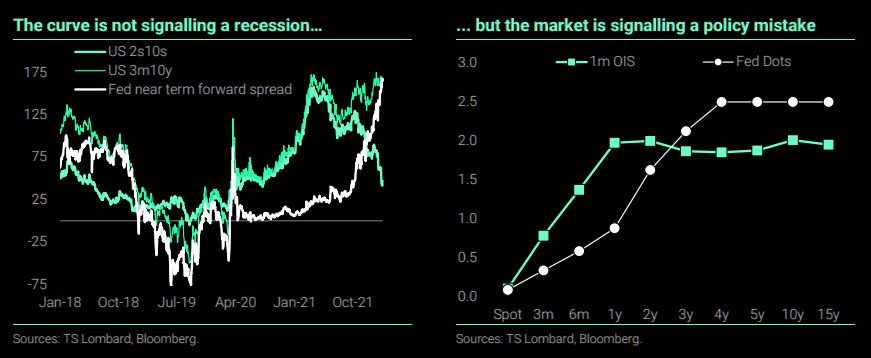
Graphic: Via TS Lombard. Taken from The Market Ear. “Flattening is normal when the Fed is tightening. Looking at the past eight hiking cycles, almost every segment of the curve has flattened on average without immediately triggering a recession.”

On that note, Mark Haefele, chief investment officer at UBS Group AG’s (NYSE: UBS) Global Wealth Management arm says that “Despite the recent volatility, it’s important to remember that we are still in an environment of robust economic and earnings growth.”

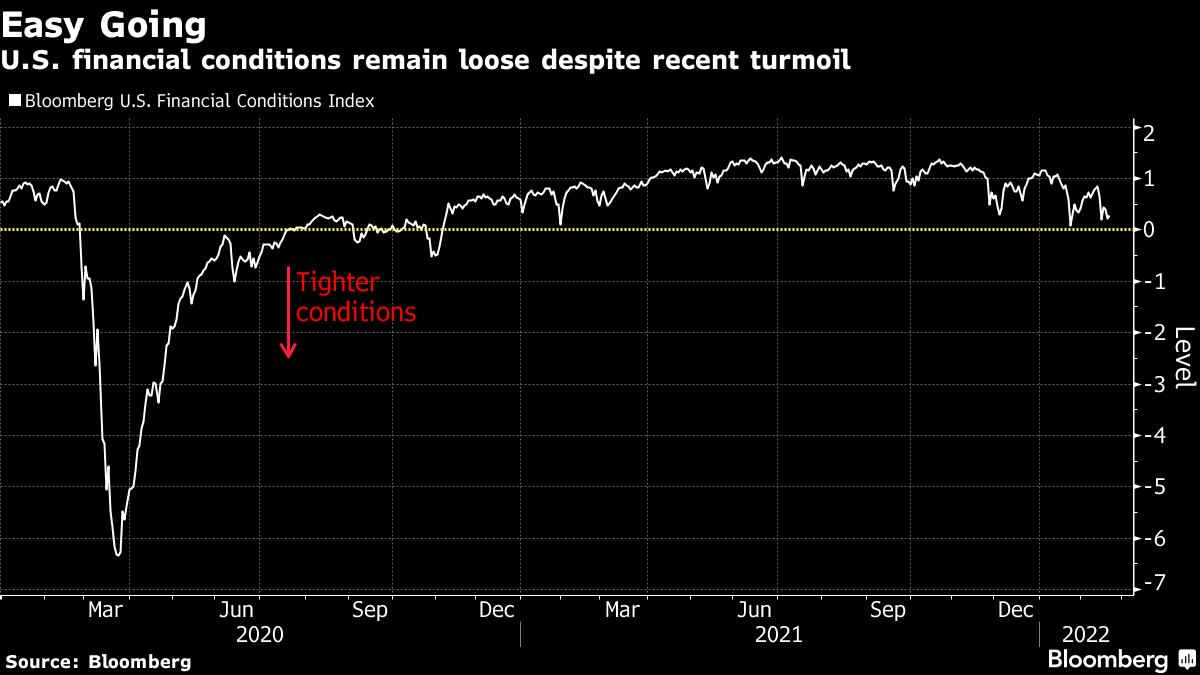
Graphic: Via Bloomberg. “If market dysfunction is reflected in tighter conditions, then this chart shows we’re nowhere near stressed levels — after all, central bank policy globally is historically loose.”

“Our base case we expect upside for equity markets over the balance of the year.”

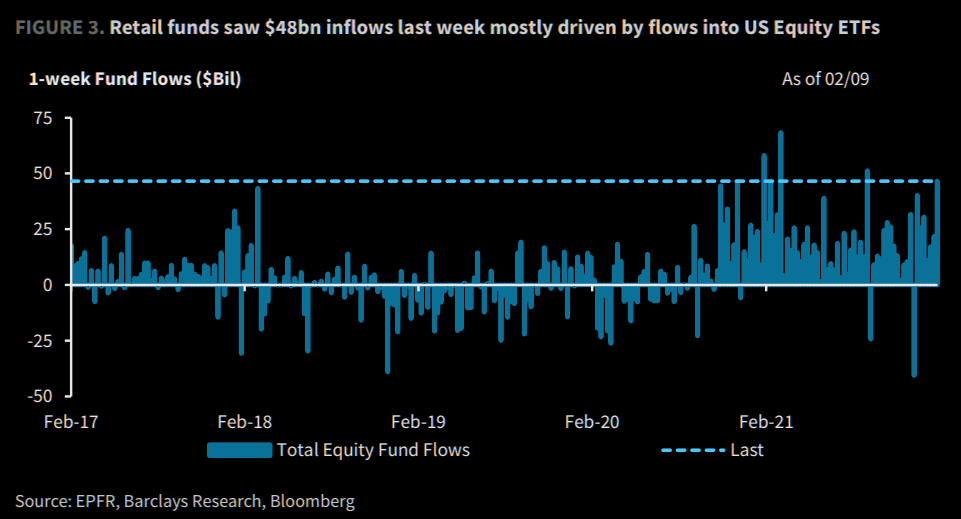
Positioning: Passive buying flows persist alongside a drop in bearish sentiment readings.

Graphic: Via EPFR, Barclays PLC (NYSE: BCS), and Bloomberg. Taken from The Market Ear

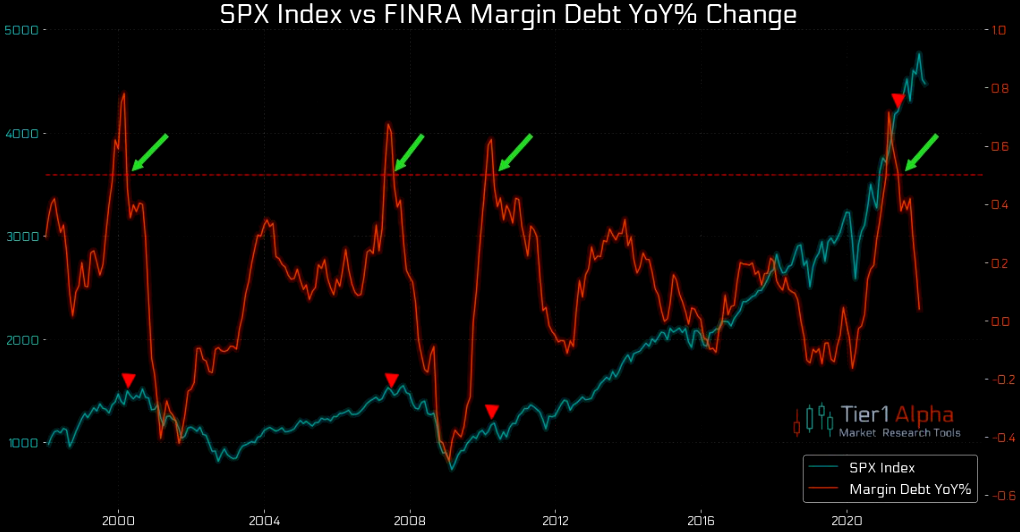
This action is in the face of a collapse in margin debt.

Graphic: Via Tier1Alpha. Taken from The Market Ear. “Margin debt is a big part of the puzzle, but even more important is the “delta” of the margin debt. The YoY % change of FINRA margin debt looks slightly scary.”

In the credit markets, investment-grade spreads are at some of their widest levels since 2020. Per Bloomberg, put option (bets on the downside) open interest in corporate bond ETFs is at an all-time high.

“Rotate into credit now,” Chris Sheldon, the co-head of credit and markets at KKR, explained, taking a contrarian view. “As the rate volatility plays through the market segment, we think high yield could become more attractive very quickly.”

On the single-stock and index-level, options positioning suggests participants should continue to brace for volatility. Participants’ demand for protection (negative delta exposure) has left counterparties (dealers taking the other side and warehousing risk) adding negative delta exposure linearly (via stock and futures sales) to hedge.

To note, owning an option offers someone positive exposure to gamma or convexity (to have profits multiplied if the direction is correct, all else equal). On the other side, though, participants who are short gamma or convexity may have their losses multiplied if incorrect.

Making some naive assumptions on the build-in interest in options strikes at lower prices, we may surmise that dealers are exposed to increased negative gamma exposure. 

To hedge this, if volatility were to remain unchanged, dealers must sell (buy) into weakness (strength) to hedge increasing (decreasing) negative gamma exposure. If volatility rises (drops), then more stock and futures must be sold (bought/covered).

Pictured: SqueezeMetrics highlights implications of volatility, direction, and moneyness.

The monthly options expiration (OPEX) will coincide with the removal of lots of put-heavy exposures. This will decrease the dealers’ positive exposure to delta and make gamma exposures less negative. 

Therefore, absent some exogenous event that increases demand for protection, again, there is the potential for strength, post-OPEX. That’s when that real-money buying, alluded to above, may resolve in higher prices.

Technical: As of 6:30 AM ET, Friday’s regular session (9:30 AM – 4:00 PM ET), in the S&P 500, will likely open in the middle part of a positively skewed overnight inventory, inside of prior-range and -value, suggesting a limited potential for immediate directional opportunity.

Spikes: Spikes mark the beginning of a break from value. Spikes higher (lower) are validated by trade at or above (below) the spike base (i.e., the origin of the spike).

In the best case, the S&P 500 trades higher; activity above the $4,415.00 untested point of control (VPOC) puts in play the $4,438.00 key response area (balance boundary and high volume area). Initiative trade beyond the key response area could reach as high as the $4,464.75 low volume area (LVNode) and $4,485.00 regular trade high (RTH High), or higher.

In the worst case, the S&P 500 trades lower; activity below the $4,415.00 VPOC puts in play the $4,401.50 spike base. Initiative trade beyond the spike base could reach as low as the $4,367.25 regular trade low (RTH Low) and $4,332.75 high volume area (HVNode), or lower.

Click here to load today’s key levels into the web-based TradingView charting platform. Note that all levels are derived using the 65-minute timeframe. New links are produced, daily.
Graphic: 65-minute profile chart of the Micro E-mini S&P 500 Futures.

Definitions

Overnight Rally Highs (Lows): Typically, there is a low historical probability associated with overnight rally-highs (lows) ending the upside (downside) discovery process.

Volume Areas: A structurally sound market will build on areas of high volume (HVNodes). Should the market trend for long periods of time, it will lack sound structure, identified as low volume areas (LVNodes). LVNodes denote directional conviction and ought to offer support on any test. 

If participants were to auction and find acceptance into areas of prior low volume (LVNodes), then future discovery ought to be volatile and quick as participants look to HVNodes for favorable entry or exit.

POCs: POCs are valuable as they denote areas where two-sided trade was most prevalent in a prior day session. Participants will respond to future tests of value as they offer favorable entry and exit.

Options Expiration (OPEX): Traditionally, option expiries mark an end to pinning (i.e, the theory that market makers and institutions short options move stocks to the point where the greatest dollar value of contracts will expire) and the reduction dealer gamma exposure. In recent history, this reset in dealer positioning has been front-run; prior, there was an increase in volatility after the removal of large options positions and associated hedging.

Balance (Two-Timeframe Or Bracket): Rotational trade that denotes current prices offer favorable entry and exit. Balance-areas make it easy to spot a change in the market (i.e., the transition from two-time frame trade, or balance, to one-time frame trade, or trend). 

Modus operandi is responsive trade (i.e., fade the edges), rather than initiative trade (i.e., play the break).

Volume-Weighted Average Prices (VWAPs): A metric highly regarded by chief investment officers, among other participants, for quality of trade. Additionally, liquidity algorithms are benchmarked and programmed to buy and sell around VWAPs.

About

After years of self-education, strategy development, mentorship, and trial-and-error, Renato Leonard Capelj began trading full-time and founded Physik Invest to detail his methods, research, and performance in the markets.

Capelj is also a Benzinga finance and technology reporter interviewing the likes of Shark Tank’s Kevin O’Leary, JC2 Ventures’ John Chambers, FTX’s Sam Bankman-Fried, and ARK Invest’s Catherine Wood, as well as a SpotGamma contributor developing insights around impactful options market dynamics.

Disclaimer

Physik Invest does not carry the right to provide advice.

In no way should the materials herein be construed as advice. Derivatives carry a substantial risk of loss. All content is for informational purposes only.
Categories
Commentary

Daily Brief For February 16, 2022

Editor’s Note: The Daily Brief is a free glimpse into the prevailing fundamental and technical drivers of U.S. equity market products. Join the 200+ that read this report daily, below!

What Happened

After auctioning up into a key supply area, overnight, equity indices were responsively sold.

Ahead is data on retail sales and import prices (8:30 AM ET), industrial production and capacity utilization (9:15 AM ET), business inventories, and the NAHB home builders’ index (10:00 AM ET), as well as the release of Federal Open Market Committee (FOMC) minutes (2:00 PM ET).

Graphic updated 6:40 AM ET. Sentiment Neutral if expected /ES open is inside of the prior day’s range. /ES levels are derived from the profile graphic at the bottom of the following section. Levels may have changed since initially quoted; click here for the latest levels. SqueezeMetrics Dark Pool Index (DIX) and Gamma (GEX) calculations are based on where the prior day’s reading falls with respect to the MAX and MIN of all occurrences available. A higher DIX is bullish. At the same time, the lower the GEX, the more (expected) volatility. Learn the implications of volatility, direction, and moneyness. SHIFT data used for S&P 500 (INDEX: SPX) options activity. Note that options flow is sorted by the call premium spent; if more positive, then more was spent on call options. Breadth reflects a reading of the prior day’s NYSE Advance/Decline indicator. VIX reflects a current reading of the CBOE Volatility Index (INDEX: VIX) from 0-100.

What To Expect

Fundamental: The market has de-rated substantially at the single-stock level.

“Stocks have been de-rating for almost a year now as investors began to anticipate the inevitable tightening from the Fed, given the robustness of the recovery and building imbalances,” Morgan Stanley’s (NYSE: MS) Michael Wilson says.

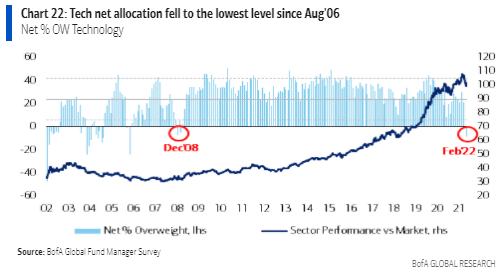
Graphic: Via Bank of America Corporation (NYSE: BAC). Taken from Bloomberg. “Perhaps most strikingly, fund managers are now more thoroughly underweight in technology stocks than at any time since 2006.”

“We think this de-rating is about 80% done at the stock level with the S&P 500 P/E still about 10% too high (19.5x versus our 18x target). In other words, the de-rating is more complete at the stock level than at the index level, at least for the high-quality S&P 500.”

At the same time, the bond market’s pricing of risk – reflected by the Merrill Lynch Option Volatility Estimate (INDEX: MOVE) – is not in line with the pricing of equity market risk, via the CBOE Volatility Index (INDEX: VIX).  

Graphic: MOVE Index. Taken from Lisa Abramowicz.

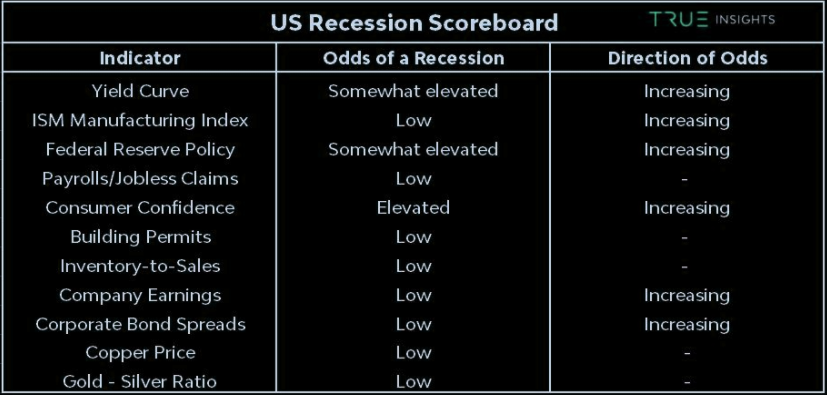
That said, fear in one market tends to feed into the fear of another; regardless of the cause, equity and bond market participants are not on the same page. 

Graphic: Via True Insight. Taken from The Market Ear.

Moreover, prevailing monetary frameworks and max liquidity promoted a large divergence in price from fundamentals. Growth in passive investing – the effect of increased moneyness among nonmonetary assets – and derivatives trading imply a lot of left-tail risks.

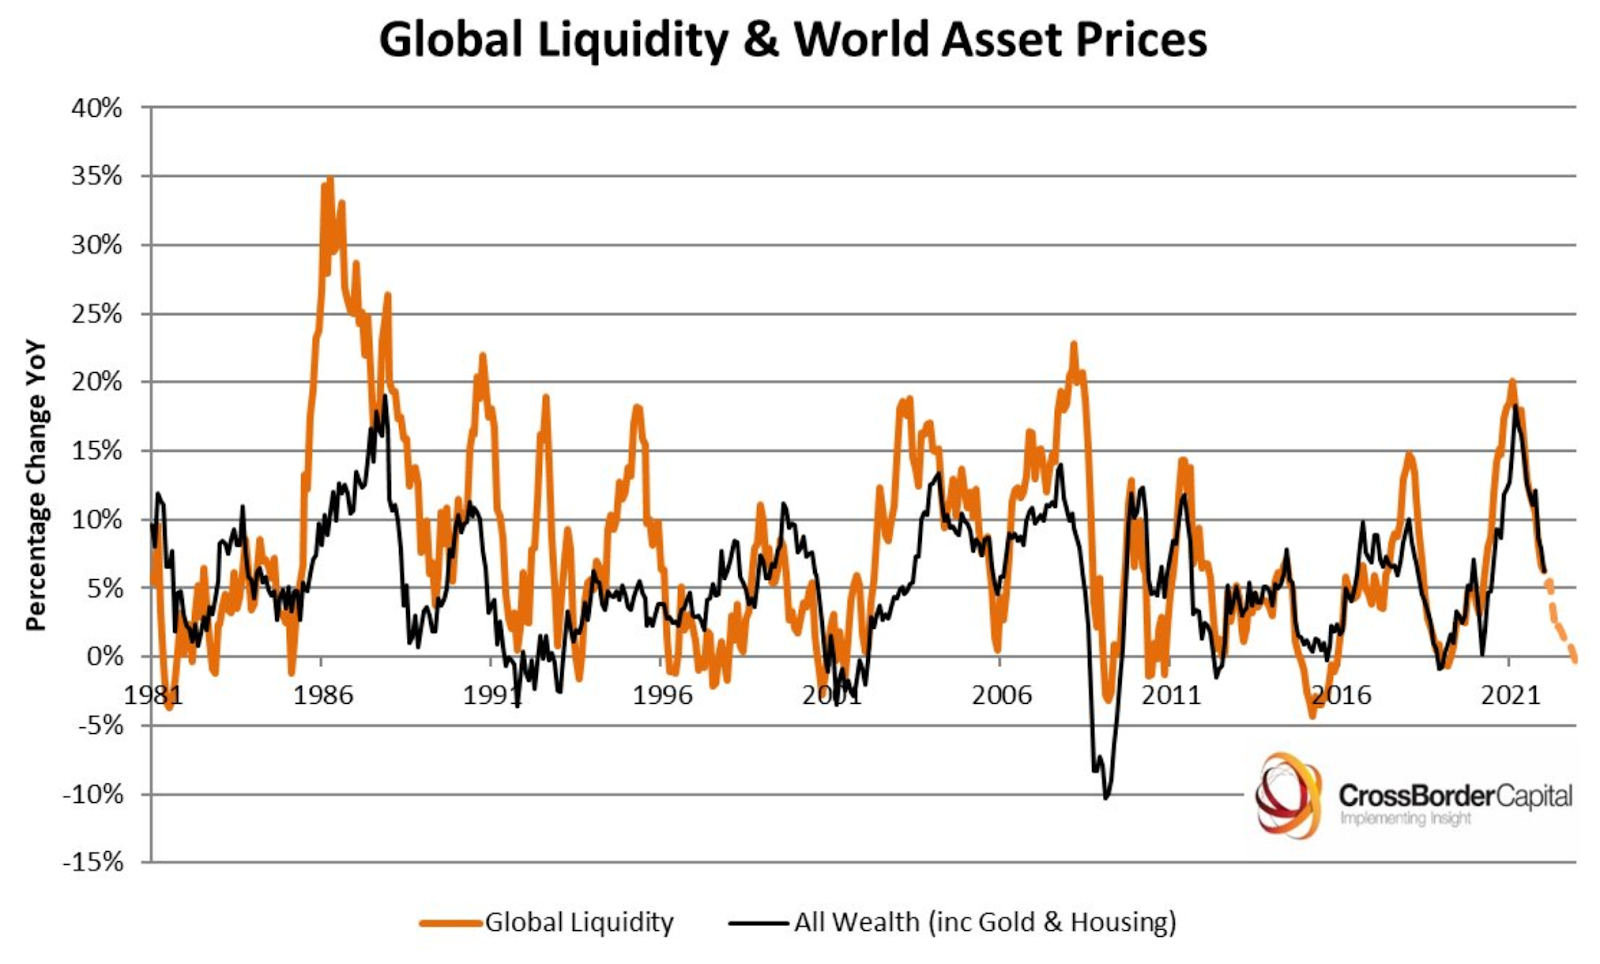
The “provision of liquidity and the creation of wealth through higher asset prices are intimately connected over time,” John Authers of Bloomberg explains.

Falling liquidity, while obviously necessary now that the emergency has passed and inflation is rising, could well signal problems ahead.”

Graphic: Via CrossBorder Capital. Taken from Bloomberg. 

To establish the point, these shifts in liquidity have large effects on bond markets, too, and that’s what participants are likely pricing in via MOVE.

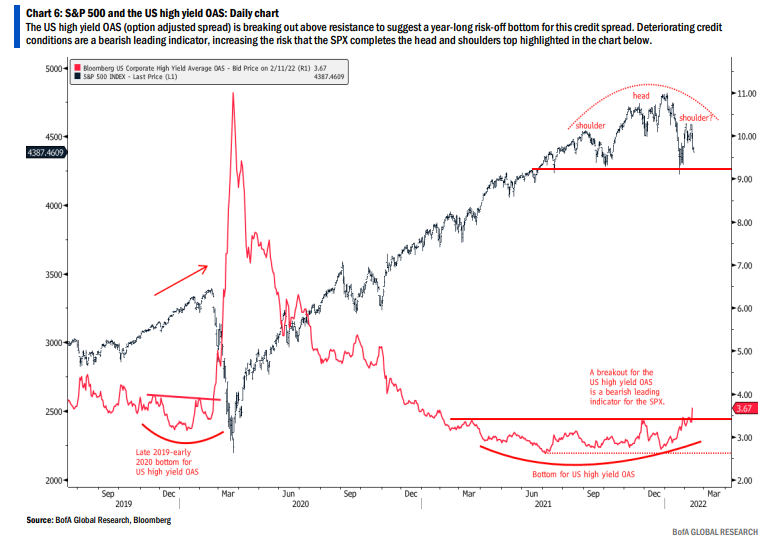
A “flatter yield curve tends to be followed quite swiftly by rising credit spreads. While there is no great issue with solvency at present, this suggests that credit may already be causing problems by the end of this year.”

Graphic: Via Bank of America Corporation (NYSE: BAC). Taken from Samantha LaDuc

“The U.S. high yield OAS (option-adjusted spread) is breaking out above resistance to suggest a year-long risk-off bottom for this credit spread,” Bank of America explains. 

Deteriorating credit conditions are a bearish leading indicator, increasing the risk that the S&P 500 (INDEX: SPX) completes the head and shoulders top highlighted in the chart below.”

Taken together, it is the above-mentioned dynamics that will ultimately make it hard for the Fed to continue with rate hikes, Authers adds.

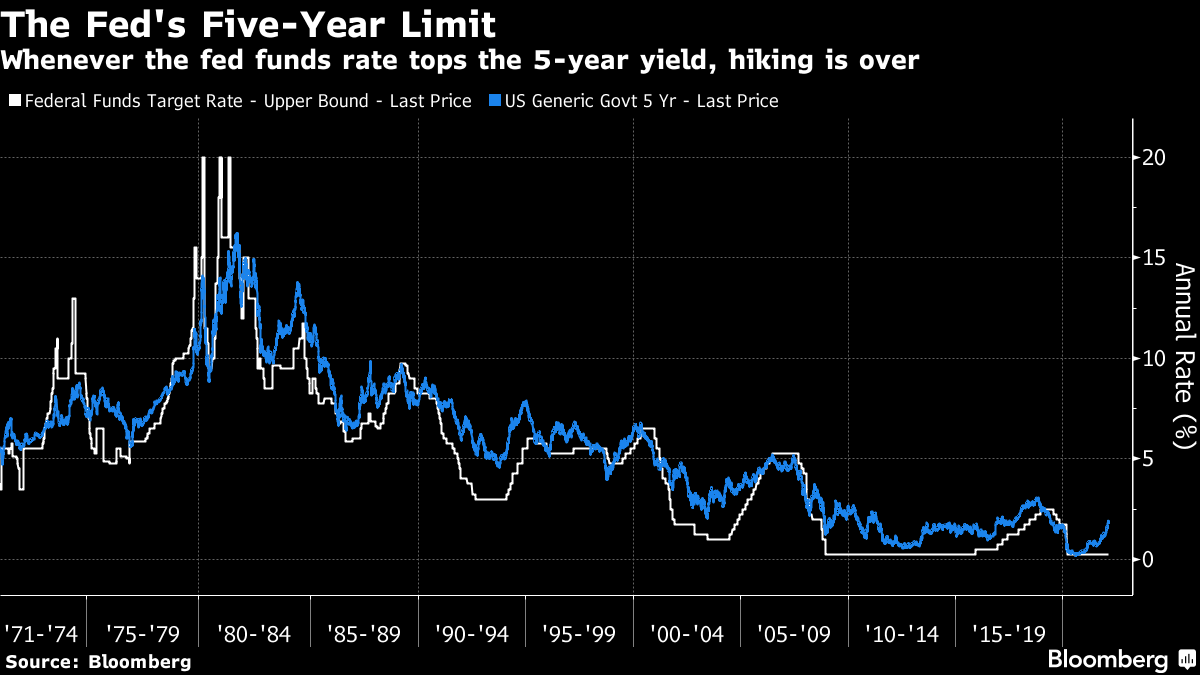
Graphic: Via Bloomberg, “there is a 50-year history that the Fed never hikes rates once the fed funds rate has risen above the five-year yield. That point could come before the end of 2022, and suggests that it will be very difficult to continue with tightening to the extent that the Fed currently believes necessary to bring down inflation to its target.”

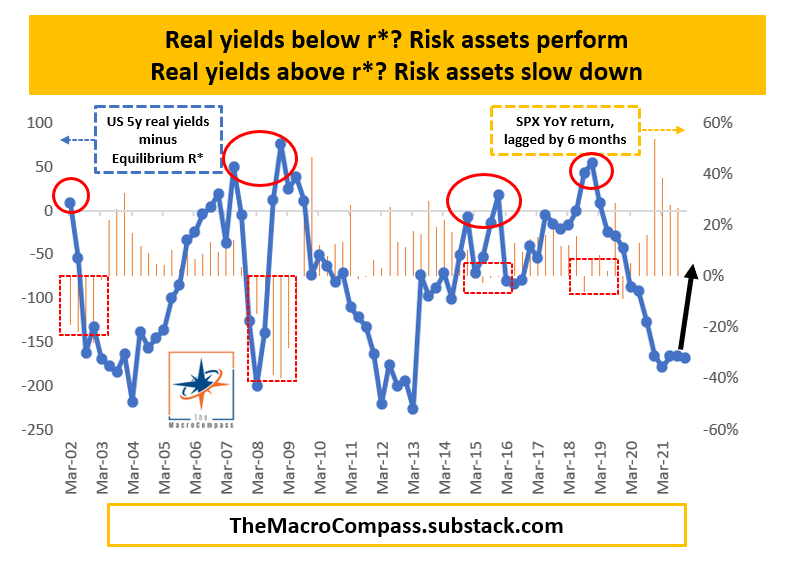
To conclude this section, I quote Alfonso Peccatiello, the former head of a $20 billion investment portfolio and author of The Macro Compass: “If the Fed pushes the hawkish narrative further, we might see deeper cracks in the walls.”

Graphic: Via The Macro Compass, “Once real yields approach equilibrium levels, subsequent S&P500 returns tend to be poor.”

Positioning: In the past weeks this commentary expressed a more bullish tilt. 

This tilt is not entirely incorrect. Indeed, there are (as pointed to in past commentaries) few metrics that suggest that there have been strong(er) levels of accumulation.

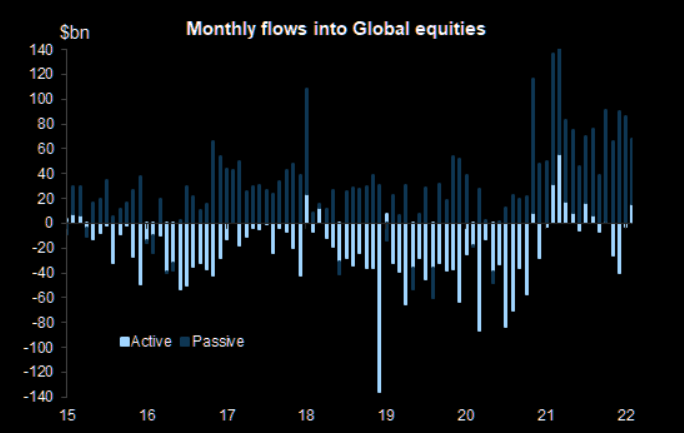
Graphic: Via EPFR. Taken from The Market Ear. A “nice steady tune of >$50bn per month into global equities.”

However, other positioning metrics point to an increased potential for instability, and implied volatility, though heightened, may not provide much of a boost if further compressed. 

As options modeling and analysis provider SqueezeMetrics explains, “I don’t see the upside catalyst in the data right now. VIX back at 25 isn’t compelling from a vanna-rally perspective (back to 20 seems possible, but how much more?).”

“Have enough puts been bought to propel prices from vanna rally and subsequent vol rolldown? Mehhh.”

To put it in simpler terms, “it is a lot easier to knock [the market] down than it is to lift up.”

What’s known for sure is that this week’s put-heavy options expiration (OPEX) “may make gamma exposures less negative,” according to options analysis provider SpotGamma.

For context, delta is an options exposure to direction. Gamma is the rate of change in delta. ​​

“In an environment characterized by negative gamma (wherein an options delta falls with stock price rises and rises when stock prices fall), options expiries ought to make gamma less negative.”

Therefore, with a reduction in negative gamma, “there will be a removal of [counterparties’] linear short (-delta) hedges which may further bolster attempts higher.”

Technical: As of 6:30 AM ET, Wednesday’s regular session (9:30 AM – 4:00 PM ET), in the S&P 500, will likely open in the middle part of a balanced overnight inventory, inside of prior-range and -value, suggesting a limited potential for immediate directional opportunity.

In the best case, the S&P 500 trades higher; activity above the $4,438.00 key response area (balance boundary, high-volume area, and prior overnight low) puts in play the $4,483.00 overnight high (ONH). Initiative trade beyond the ONH could reach as high as the $4,499.00 untested point of control (VPOC) and $4,526.25 high volume area (HVNode), or higher.

In the worst case, the S&P 500 trades lower; activity below the $4,438.00 key response area puts in play the $4,393.75 HVNode. Initiative trade beyond the HVNode could reach as low as the $4,365.00 POC and $4,332.25 HVNode, or lower.

Considerations: Tuesday’s trade built out areas of high volume via the cave-fill process in locations where prior discovery left weak structure – gaps and p-shaped emotional, multiple distribution profile structures (i.e., Friday’s knee-jerk liquidation of poorly positioned longs).

Click here to load today’s key levels into the web-based TradingView charting platform. Note that all levels are derived using the 65-minute timeframe. New links are produced, daily.
Graphic: 65-minute profile chart of the Micro E-mini S&P 500 Futures.

Definitions

Cave-Fill Process: Widened the area deemed favorable to transact at by an increased share of participants. This is a good development.

Overnight Rally Highs (Lows): Typically, there is a low historical probability associated with overnight rally-highs (lows) ending the upside (downside) discovery process.

Volume Areas: A structurally sound market will build on areas of high volume (HVNodes). Should the market trend for long periods of time, it will lack sound structure, identified as low volume areas (LVNodes). LVNodes denote directional conviction and ought to offer support on any test. 

If participants were to auction and find acceptance into areas of prior low volume (LVNodes), then future discovery ought to be volatile and quick as participants look to HVNodes for favorable entry or exit.

Vanna: The rate at which the delta of an option changes with respect to volatility.

POCs: POCs are valuable as they denote areas where two-sided trade was most prevalent in a prior day session. Participants will respond to future tests of value as they offer favorable entry and exit.

Options Expiration (OPEX): Traditionally, option expiries mark an end to pinning (i.e, the theory that market makers and institutions short options move stocks to the point where the greatest dollar value of contracts will expire) and the reduction dealer gamma exposure.

Volume-Weighted Average Prices (VWAPs): A metric highly regarded by chief investment officers, among other participants, for quality of trade. Additionally, liquidity algorithms are benchmarked and programmed to buy and sell around VWAPs.

About

After years of self-education, strategy development, mentorship, and trial-and-error, Renato Leonard Capelj began trading full-time and founded Physik Invest to detail his methods, research, and performance in the markets.

Capelj is also a Benzinga finance and technology reporter interviewing the likes of Shark Tank’s Kevin O’Leary, JC2 Ventures’ John Chambers, FTX’s Sam Bankman-Fried, and ARK Invest’s Catherine Wood, as well as a SpotGamma contributor developing insights around impactful options market dynamics.

Disclaimer

Physik Invest does not carry the right to provide advice.

In no way should the materials herein be construed as advice. Derivatives carry a substantial risk of loss. All content is for informational purposes only.
Categories
Commentary

Daily Brief For December 28, 2021

Notice: Up to January 3, 2022, any commentaries published will be lighthearted and, generally, shorter in length.

What Happened

Overnight, equity index futures were sideways to higher with most commodities, yields. 

This is as volatility implodes; the CBOE Volatility Index, from December 20, went as low as 17.55 this week [down 9.84 (35.93%)]. This coincides with a compression in the VIX’s term structure, and that has so-called bullish/supportive implications.

Ahead is data on the S&P Case-Shiller U.S. home price index (9:00 AM ET).

Graphic updated 7:00 AM ET. Sentiment Risk-On if expected /ES open is above the prior day’s range. /ES levels are derived from the profile graphic at the bottom of the following section. Levels may have changed since initially quoted; click here for the latest levels. SqueezeMetrics Dark Pool Index (DIX) and Gamma (GEX) calculations are based on where the prior day’s reading falls with respect to the MAX and MIN of all occurrences available. A higher DIX is bullish. At the same time, the lower the GEX, the more (expected) volatility. Learn the implications of volatility, direction, and moneyness. SHIFT data used for S&P 500 (INDEX: SPX) options activity. Note that options flow is sorted by the call premium spent; if more positive then more was spent on call options. Breadth reflects a reading of the prior day’s NYSE Advance/Decline indicator. VIX reflects a current reading of the CBOE Volatility Index (INDEX: VIX) from 0-100.

What To Expect

On lackluster breadth and divergent market liquidity metrics, the S&P 500 continues to auction away from intraday value, the levels at which participants found it most favorable to transact.

Moreover, given the persistence of mechanical responses to technical levels, visually-driven, weaker-handed participants (which seldom bear the wherewithal to defend retests) likely carry a heavier hand in recent price discovery.

Via volume profile analysis, we see a plethora of low-volume pockets – voids, if you will – that likely hold virgin tests. 

As stated over the past few days, successful penetration often portends follow-through as the participants that were most active at those levels (quickly run for the exits when wrong).

Context: Recall that a collapse in implied volatility, coupled with relentless, seasonally-aligned passive buying would bring in positive flows that would bolster any attempt higher.

At the same time “options selling strategies [became] attractive,” according to Goldman Sachs Group Inc (NYSE: GS); the commitment of capital to options strikes at higher prices implies participants are pushing up their bets on S&P 500 movement. That’s bullish.

Graphic: Shift Search S&P 500 data (excluding weeklies) suggests participants are likely initiating box spreads and rolling their call exposure out in time (as much as 6 months).

According to SpotGamma, “[s]ince, customers are thought to be net short calls (short-delta), as the index moves toward the high activity $4,800.00 strike, they become longer delta.”

Why? When a position’s delta rises with stock or index price rises, gamma – the expected change in delta given movement in the underlying – is added to delta. 

“As participants keep adding to their bets at $4,800.00, the dealer only takes on more exposure to positive gamma, which they hedge by selling futures and adding liquidity to the market.”

The commitment of capital on lower volatility ups the dealers’ exposure to positive gamma; this will be offset through a supply of liquidity (via short futures), which weighs on price discovery.

Taking into account this positioning, versus buying pressure (measured via short sales or liquidity provision on the market-making side), positioning metrics remain positively skewed, albeit less so than before.

Graphic: Data SqueezeMetrics. Graph via Physik Invest.

Going forward, coming into Friday’s weighty options expirations, at the index level, hedging pressures ought to be sticky and weigh on the upside. 

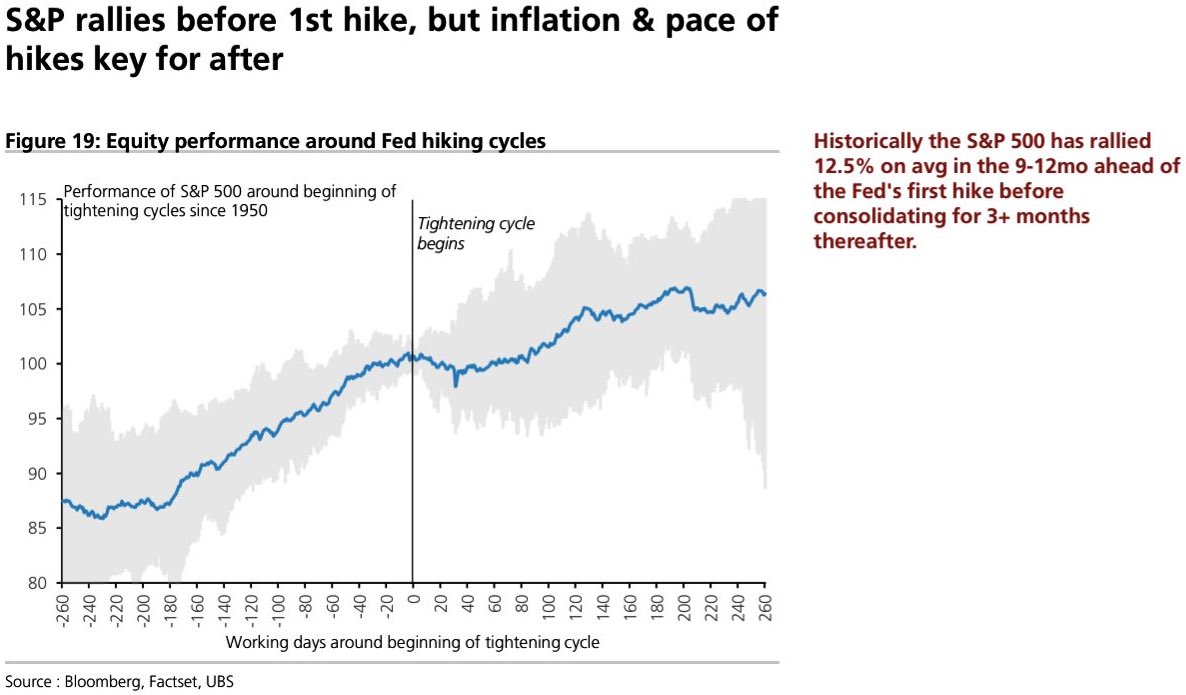
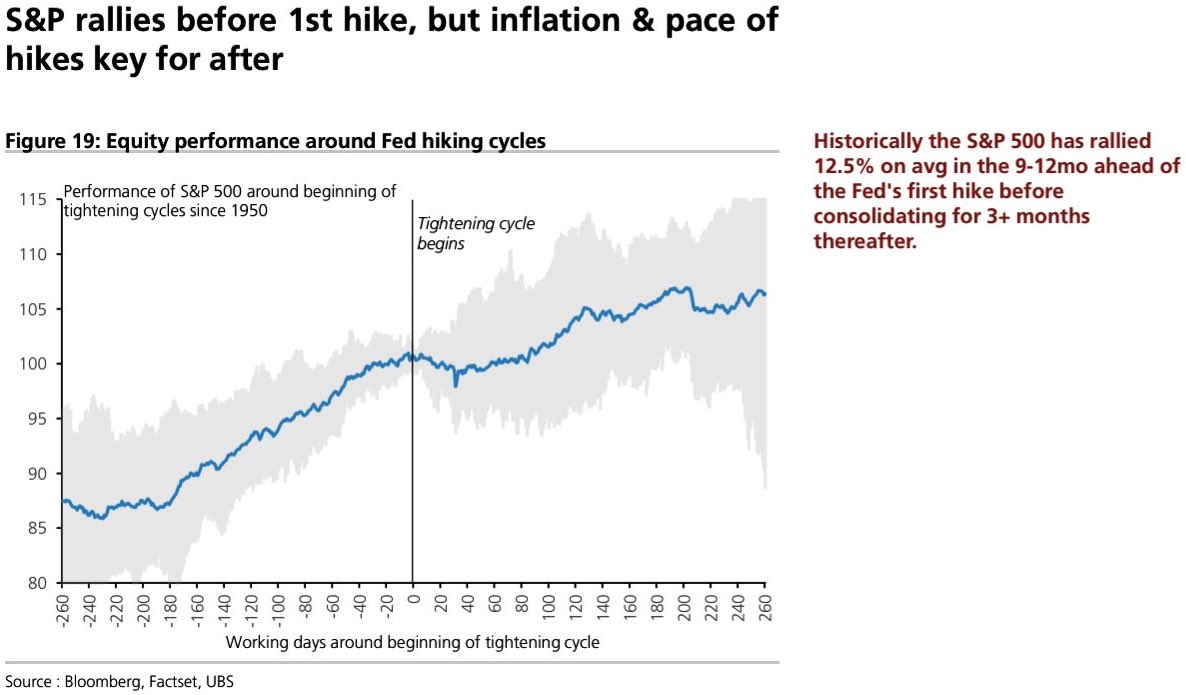
Thereafter, positive fundamental forces and dealers’ covering of hedges to remaining “put-heavy” positioning could bolster any seasonally-aligned price rise into the very first interest rate hikes.

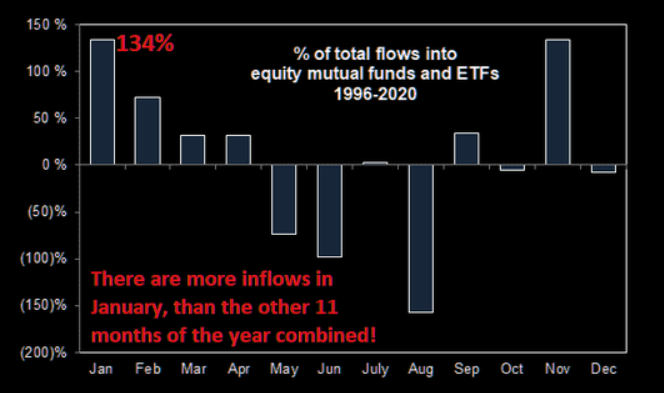
Graphic: Per The Market Ear, “January typically sees 134% of inflows (the rest of the 11 months -34%). And with every private wealth manager in the world right now pitching increased allocations into equities (out of cash and out of bonds), Goldman calculates that keeping 2021 pace, This would be $125BN worth of inflows quickly in January.”

Moody’s Corporation’s (NYSE: MCO) forecast is in agreement: “the Dow Jones Industrial Average increases this quarter and peaks in early 2022, … [followed by] steady decline through 2022.”

Graphic: S&P 500 performance before and after rate hikes.

Expectations: As of 7:00 AM ET, Tuesday’s regular session (9:30 AM – 4:00 PM ET), in the S&P 500, will likely open in the upper part of a positively skewed overnight inventory, just outside of prior-range and -value, suggesting a potential for immediate directional opportunity.

Gap Scenarios: Gaps ought to fill quickly. Should they not, that’s a signal of strength; do not fade. Leaving value behind on a gap-fill or failing to fill a gap (i.e., remaining outside of the prior session’s range) is a go-with indicator.

Auctioning and spending at least 1-hour of trade back in the prior range suggests a lack of conviction; in such a case, do not follow the direction of the most recent initiative activity.

In the best case, the S&P 500 trades sideways or higher; activity above the $4,771.00 untested point of control (VPOC) puts in play the $4,784.25 regular trade high (RTH High). Initiative trade beyond the RTH High could reach as high as the $4,797.25 overnight high (ONH) and $4,803.75 extension, or higher.

In the worst case, the S&P 500 trades lower; activity below the $4,771.00 VPOC puts in play the $4,732.50 high volume area (HVNode). Initiative trade beyond the HVNode could reach as low as the $4,717.25 low volume area (LVNode) and $4,690.25 micro composite point of control (MCPOC), or lower.

Click here to load today’s key levels into the web-based TradingView charting platform. Note that all levels are derived using the 65-minute timeframe. New links are produced, daily.
Graphic: 65-minute profile chart of the Micro E-mini S&P 500 Futures. Learn about the profile.

Definitions

Overnight Rally Highs (Lows): Typically, there is a low historical probability associated with overnight rally-highs (lows) ending the upside (downside) discovery process.

Volume Areas: A structurally sound market will build on areas of high volume (HVNodes). Should the market trend for long periods of time, it will lack sound structure, identified as low volume areas (LVNodes). LVNodes denote directional conviction and ought to offer support on any test. 

If participants were to auction and find acceptance into areas of prior low volume (LVNodes), then future discovery ought to be volatile and quick as participants look to HVNodes for favorable entry or exit.

POCs: POCs are valuable as they denote areas where two-sided trade was most prevalent in a prior day session. Participants will respond to future tests of value as they offer favorable entry and exit.

MCPOCs: POCs are valuable as they denote areas where two-sided trade was most prevalent over numerous day sessions. Participants will respond to future tests of value as they offer favorable entry and exit.

Options Expiration (OPEX): Traditionally, option expiries mark an end to pinning (i.e, the theory that market makers and institutions short options move stocks to the point where the greatest dollar value of contracts will expire) and the reduction dealer gamma exposure.

Volume-Weighted Average Prices (VWAPs): A metric highly regarded by chief investment officers, among other participants, for quality of trade. Additionally, liquidity algorithms are benchmarked and programmed to buy and sell around VWAPs.

About

After years of self-education, strategy development, and trial-and-error, Renato Leonard Capelj began trading full-time and founded Physik Invest to detail his methods, research, and performance in the markets.

Additionally, Capelj is a Benzinga finance and technology reporter interviewing the likes of Shark Tank’s Kevin O’Leary, JC2 Ventures’ John Chambers, and ARK Invest’s Catherine Wood, as well as a SpotGamma contributor, helping develop insights around impactful options market dynamics.

Disclaimer

At this time, Physik Invest does not carry the right to provide advice. In no way should the materials herein be construed as advice. Derivatives carry a substantial risk of loss. All content is for informational purposes only.
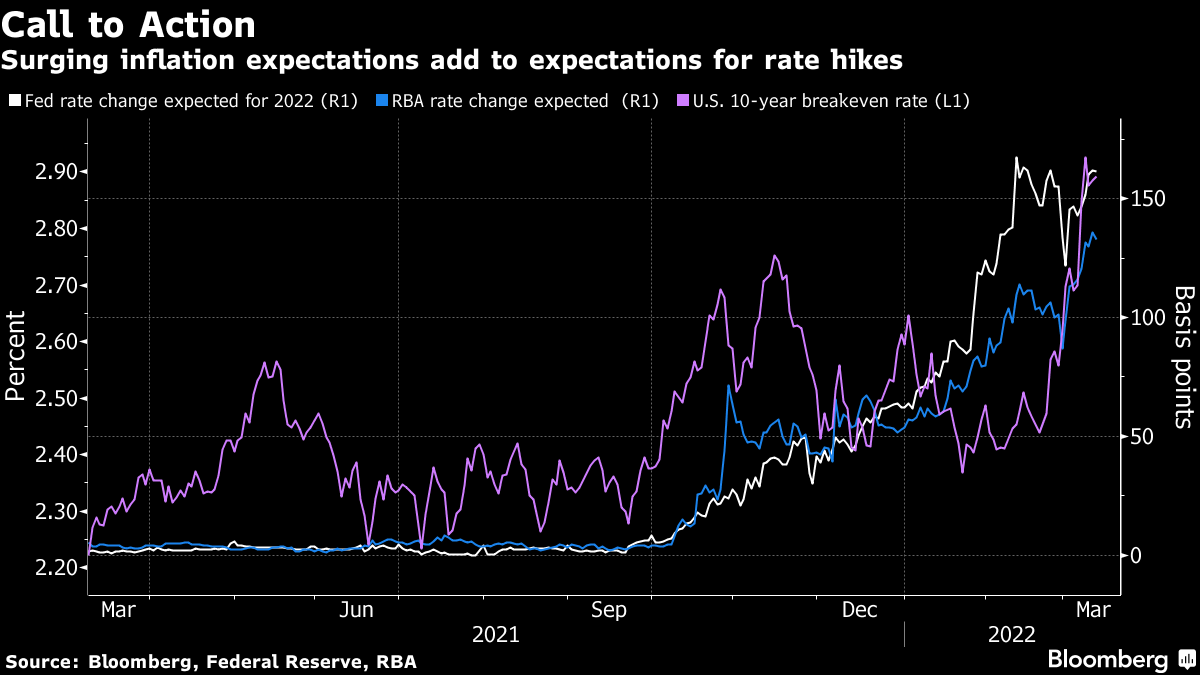
Categories
Commentary

Daily Brief For December 8, 2021

Editor’s Note: The purpose of these commentaries is to align ourselves better for the day ahead. Seldom, however, do we step away to align ourselves with trade across larger time horizons. 

Given the proximity to the new year, I shall be placing more attention on planning.

How do we model a trading plan? Here is one link on things to consider.

What Happened

Overnight, equity index futures were divergent; the Russell 2000 and Dow Jones Industrial Averaged traded weak relative to their peers the S&P 500 and Nasdaq 100. 

This is as scientists discovered a harder-to-detect version of omicron that may be countered with an extra dose of vaccine.

In other news, the U.K. was set to impose new COVID-19 restrictions, the House passed a bill opening the way to a quick debt ceiling increase, and the list of Chinese developers warning they may not be able to meet upcoming financial obligations grew.

Ahead is data on job openings and quits (10:00 AM ET). 

Graphic updated 6:30 AM ET. Sentiment Neutral if expected /ES open is inside of the prior day’s range. /ES levels are derived from the profile graphic at the bottom of the following section. Levels may have changed since initially quoted; click here for the latest levels. SqueezeMetrics Dark Pool Index (DIX) and Gamma (GEX) calculations are based on where the prior day’s reading falls with respect to the MAX and MIN of all occurrences available. A higher DIX is bullish. At the same time, the lower the GEX, the more (expected) volatility. Learn the implications of volatility, direction, and moneyness. SHIFT data used for S&P 500 (INDEX: SPX) options activity. Note that options flow is sorted by the call premium spent; if more positive then more was spent on call options. Breadth reflects a reading of the prior day’s NYSE Advance/Decline indicator. VIX reflects a current reading of the CBOE Volatility Index (INDEX: VIX) from 0-100.

What To Expect

On strong intraday breadth and divergent market liquidity metrics, the best case outcome occurred, yesterday, evidenced by an upside gap, expansion of range, and separation of value.

Similar to Tuesday’s commentary, though this activity marks participants’ willingness to change the trend, the structure is poor. As a result, there is technical instability.

Specifically, both Monday and Tuesday’s sessions left gaps and p-shaped emotional, multiple-distribution profile structures (i.e., old-money shorts covering).

As said before, participants will look to revisit, repair, and strengthen – build out areas of high volume (HVNodes) via the cave-fill process – these areas of low volume (LVNodes).

Graphic: Divergent delta (i.e., non-committed buying as measured by volume delta or buying and selling power as calculated by the difference in volume traded at the bid and offer) in SPDR S&P 500 ETF Trust (NYSE: SPY), one of the largest ETFs that track the S&P 500 index, via Bookmap. The readings are supportive of responsive trade (i.e., rotational trade that suggests current prices offer favorable entry and exit; the market is attempting to balance).

Context: Has anything really changed since the November monthly options expiration (OPEX)?

Sure, we had some news with respect to COVID-19, China, and U.S. growth, but any associated fears were fast assuaged. 

In the span of four days, the S&P 500 rose nearly 5.00%. That’s just over 200 points!

Much of what we’re seeing is the direct result of changing market structure; participants are more exposed to leveraged products, among other things, which increases the speed with which volatility is realized.

Participants went from being exuberant and underexposed to protection – in the face of weakening breadth/fundamentals – to generating destabilizing demand for protection.

Alongside that demand of (shorter-dated) protection (where options sensitivity to direction is higher) was the market’s entry into short-gamma. In such an environment, counterparties to customers’ options trades exacerbate underlying volatility through hedging. 

Note all that movement in the front-end of the VIX futures term structure, below. Wow!

In the face of all the fear was “natural, passive buying support,” however, and expectations that short-dated protection (if realized volatility was to not be expressed to the downside) would either roll off the table (expire) or be monetized, resulting in counterparties reversing their hedges (initially short stock/futures) and supporting the market (buying to cover).

As said on December 6, and many commentaries before that, this “flow is stabilizing and may play into a seasonally-aligned rally into Christmas as participants see defenses rolled out against the new COVID-19 variant,” and so on.

Based on this week’s trade, thus far, it seems that the bull thesis is playing out. 

So you’re telling me to buy every S&P 500 call under the sun, right? NO!

There has yet to be a notable strengthening in overall market breadth and volatility remains rich in the face of the fast-approaching December OPEX and December 15-16 Federal Open Market Committee (FOMC) meeting.

Traders are antsy and have already started pricing in potential rate overshoots; Federal Reserve Chair Jerome Powell went from being uber dovish to increasingly hawkish on the topic of taper and interest rate expansion.

Though today’s rates and earnings support validations better than in the ‘90s, an intent to moderate stimulus serves as a headwind; the U.S. may realize the swiftest tightening in financial conditions since 2005 if the Fed was to hike rates three times next year. Yikes!

So, we have to be careful here. 

Despite the S&P rallying into the first hike, historically, dynamics with respect to market structure introduce a lot of noise. Therefore, we ought to be looking at structures that have little to lose in episodes where stress surfaces and volatility is expressed to the downside. 

Graphic: UBS Group AG (NYSE: UBS) research on S&P performance into rate hikes.

Examples of low-cost options structures include call-side calendars, butterflies, and ratio spreads.

Graphic: Via Banco Santander SA (NYSE: SAN) research, the return profile, at expiry, of a classic 1×2 (long 1, short 2 further away) ratio spread.

If opportune (and well-capitalized), there are opportunities to finance debits on the call side with structures on the put side. 

This, above, is no recommendation. It’s more so how I’m looking at the current market.

In summation, the return distribution is skewed positive, still, at this juncture, but a lot of the opportunity (based on how participants were positioned just a weak ago) has disappeared.

That’s not to say we can’t go higher; upon a smooth passage of the December FOMC and OPEX there may be an unwind of “structural positioning that naturally drives markets higher as long as volatility is compressed.”

Expectations: As of 6:30 AM ET, Wednesday’s regular session (9:30 AM – 4:00 PM ET), in the S&P 500, will likely open in the middle part of a balanced overnight inventory, inside of prior-range and -value, suggesting a limited potential for immediate directional opportunity.

In the best case, the S&P 500 trades sideways or higher; activity above the $4,691.25 HVNode puts in play the $4,705.75 LVNode and overnight high (ONH). Initiative trade beyond the latter could reach as high as the $4,716.75 LVNode/ONH and $4,740.50 minimal excess high, or higher.

In the worst case, the S&P 500 trades lower; activity below the $4,691.25 HVNode puts in play the $4,674.25 micro composite point of control (MCPOC). Initiative trade beyond the MCPOC could reach as low as the $4,647.25 and $4,618.75 HVNode, or lower.

Click here to load today’s key levels into the web-based TradingView charting platform. Note that all levels are derived using the 65-minute timeframe. New links are produced, daily.
Graphic: 65-minute profile chart of the Micro E-mini S&P 500 Futures. Learn about the profile.

What People Are Saying

Definitions

Cave-Fill Process: Widened the area deemed favorable to transact at by an increased share of participants. This is a good development.

Overnight Rally Highs (Lows): Typically, there is a low historical probability associated with overnight rally-highs (lows) ending the upside (downside) discovery process.

Volume Areas: A structurally sound market will build on areas of high volume (HVNodes). Should the market trend for long periods of time, it will lack sound structure, identified as low volume areas (LVNodes). LVNodes denote directional conviction and ought to offer support on any test. 

If participants were to auction and find acceptance into areas of prior low volume (LVNodes), then future discovery ought to be volatile and quick as participants look to HVNodes for favorable entry or exit.

MCPOCs: POCs are valuable as they denote areas where two-sided trade was most prevalent over numerous day sessions. Participants will respond to future tests of value as they offer favorable entry and exit.

Options Expiration (OPEX): Traditionally, option expiries mark an end to pinning (i.e, the theory that market makers and institutions short options move stocks to the point where the greatest dollar value of contracts will expire) and the reduction dealer gamma exposure.

Excess: A proper end to price discovery; the market travels too far while advertising prices. Responsive, other-timeframe (OTF) participants aggressively enter the market, leaving tails or gaps which denote unfair prices.

Value-Area Placement: Perception of value unchanged if value overlapping (i.e., inside day). Perception of value has changed if value not overlapping (i.e., outside day). Delay trade in the former case.

About

After years of self-education, strategy development, and trial-and-error, Renato Leonard Capelj began trading full-time and founded Physik Invest to detail his methods, research, and performance in the markets.

Additionally, Capelj is a Benzinga finance and technology reporter interviewing the likes of Shark Tank’s Kevin O’Leary, JC2 Ventures’ John Chambers, and ARK Invest’s Catherine Wood, as well as a SpotGamma contributor, helping develop insights around impactful options market dynamics.

Disclaimer

At this time, Physik Invest does not carry the right to provide advice. In no way should the materials herein be construed as advice. Derivatives carry a substantial risk of loss. All content is for informational purposes only.
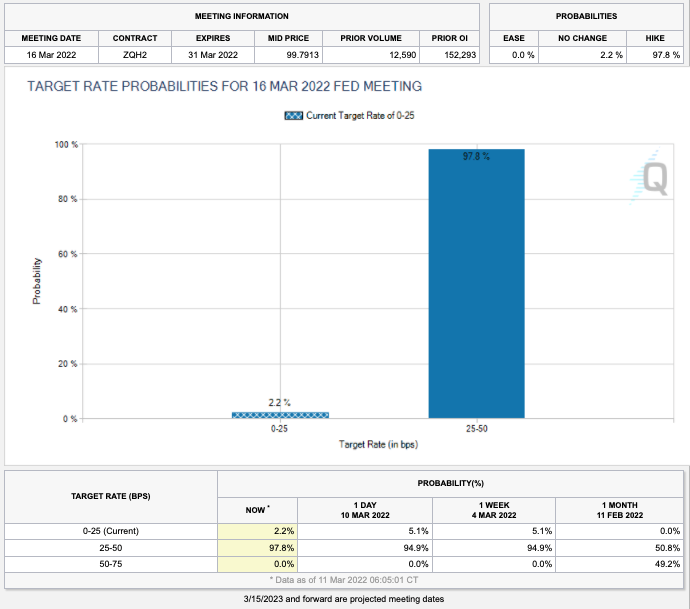
Categories
Commentary

Daily Brief For November 24, 2021

What Happened

Overnight, equity index futures auctioned within the confines of Tuesday’s range, unable to follow through on attempts higher or lower. This comes as there was a clear validation of Monday’s knee-jerk selling.

This sideways-to-lower price action in the index products is happening alongside a sell-off in new issues and richly priced technology stocks. Part of the weakness may have something to do with investors booking capital losses to lower their capital gains. 

The other part of it, according to Bloomberg, is an exodus among professional investors who were counting on high-flyers to salvage their year. 

“There was a desire to kind of keep up with the broader index. And there was definitely a view that those are higher-beta assets and that’s a way to try and play a little bit of catch-up,” Barclays Plc’s (NYSE: BCS) Todd Sandoz said. “When the market turns and it’s not working, you need to take risks down. And everybody’s in those names, so you also probably have a view to try to cut things faster.”

With indices pinned and heavily weighted constituents sideways to higher, there is only one form of reconciliation – a decline in correlation. Nonetheless, fundamentals are no different; investors may be able to buy quality stocks at a discount amidst the market’s entry into a seasonally bullish period. 

Buybacks and increased retail engagement, resilient activity, and macro metrics, as well as excess liquidity, in the face of central bank cautiousness, suggest “dips should be bought,” according to Barclays.

Ahead is data on jobless claims, GDP, durable and core capital goods orders, and trade in goods (8:30 AM ET). Thereafter is data on personal and disposable income, consumer spending, core inflation, home sales, sentiment, and 5-year inflation expectations (10:00 AM ET). FOMC minutes come later (2:00 PM ET). 

Graphic updated 6:00 AM ET. Sentiment Neutral if expected /ES open is inside of the prior day’s range. /ES levels are derived from the profile graphic at the bottom of the following section. Levels may have changed since initially quoted; click here for the latest levels. SqueezeMetrics Dark Pool Index (DIX) and Gamma (GEX) calculations are based on where the prior day’s reading falls with respect to the MAX and MIN of all occurrences available. A higher DIX is bullish. At the same time, the lower the GEX, the more (expected) volatility. Learn the implications of volatility, direction, and moneyness. SHIFT data used for S&P 500 (INDEX: SPX) options activity. Note that options flow is sorted by the call premium spent; if more positive then more was spent on call options. Breadth reflects a reading of the prior day’s NYSE Advance/Decline indicator. VIX reflects a current reading of the CBOE Volatility Index (INDEX: VIX) from 0-100.

What To Expect

On divergent intraday breadth and market liquidity metrics, the worst-case outcome occurred, evidenced by an acceptance of Monday’s knee-jerk, high-tempo selling.

Though this activity marks a potential willingness to start trending lower, the nature of Monday’s liquidation, as well as the failure to follow-through (i.e., expand the range to the downside) forces us to question whether participants have it in them to push indices lower. 

In light of the activity we’re seeing, it’s tough to pick a direction and stick with it; the higher odds play, in light of the divergences we’re seeing in breadth metrics between exchanges, as well as market liquidity (below), is to responsively buy dips and sell rips.

Key levels to trade against are the high volume areas (HVNodes) at $4,691.25 and $4,647.25. The latter level corresponds with the 20-day simple moving average.

These levels are the clearest ways to measure risk, given the mechanical responses in prior trade. Should participants manage to break past either level, then conditions have changed. Follow-through is likely. Reason being? Those visual levels are acted on by short-term, technically-driven market participants who generally are unable to defend retests.
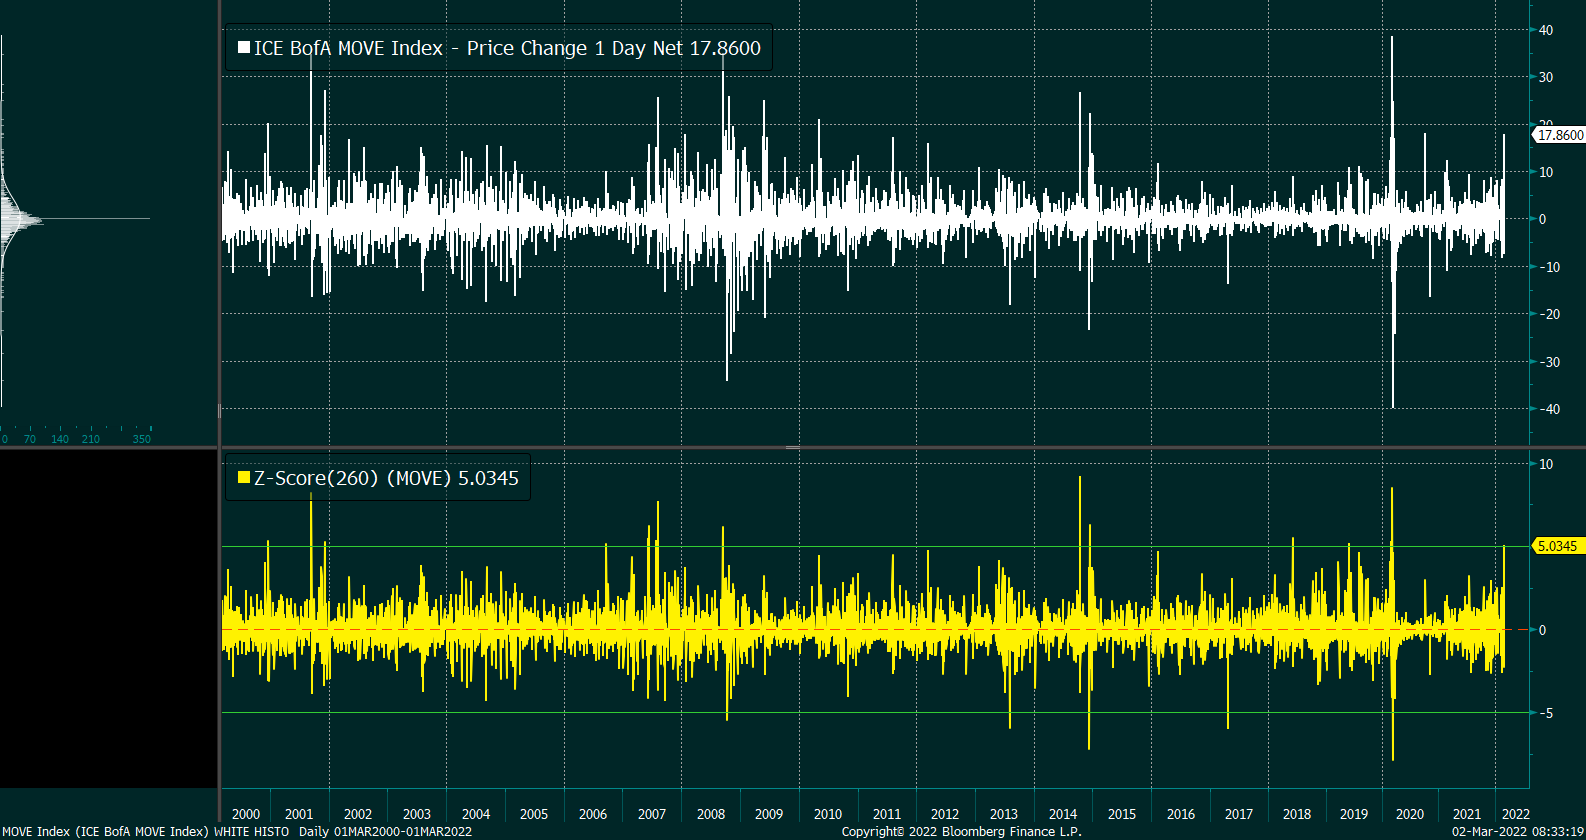
Graphic: Divergent delta (i.e., non-committed selling as measured by volume delta or buying and selling power as calculated by the difference in volume traded at the bid and offer) in SPDR S&P 500 ETF Trust (NYSE: SPY), one of the largest ETFs that track the S&P 500 index, via Bookmap. The readings are supportive of responsive trade (i.e., rotational trade that suggests current prices offer favorable entry and exit; the market is in balance).

Context: Keeping this section very short.

We saw the CBOE Volatility Index (INDEX: VIX) end higher, yesterday. 
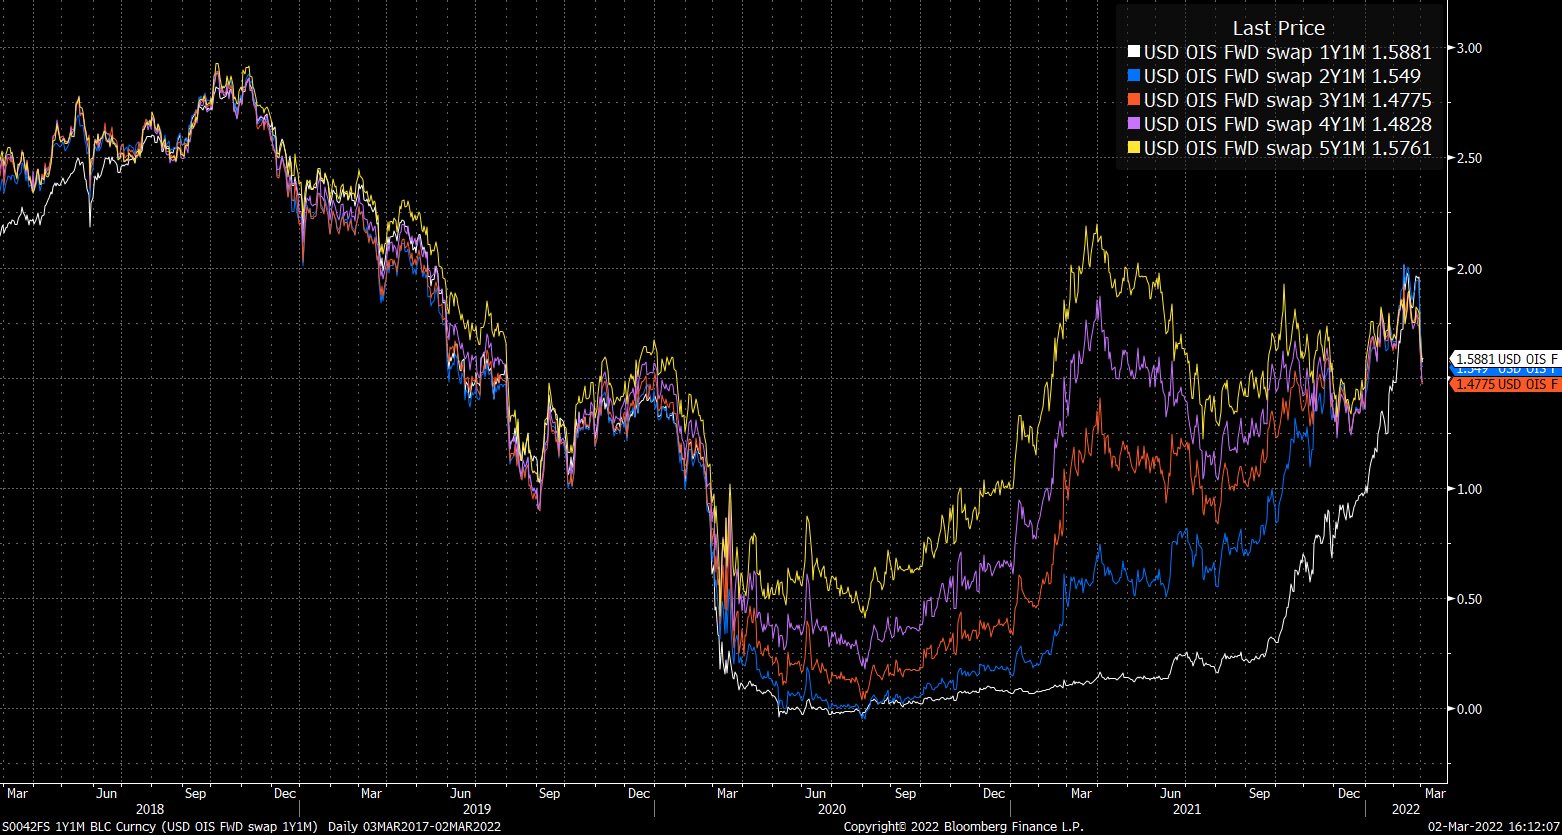
However, supply came in across the entire area of the VIX futures term structure. That, with the long-gamma environment (defined below), suggests participants are not reaching for hedges.
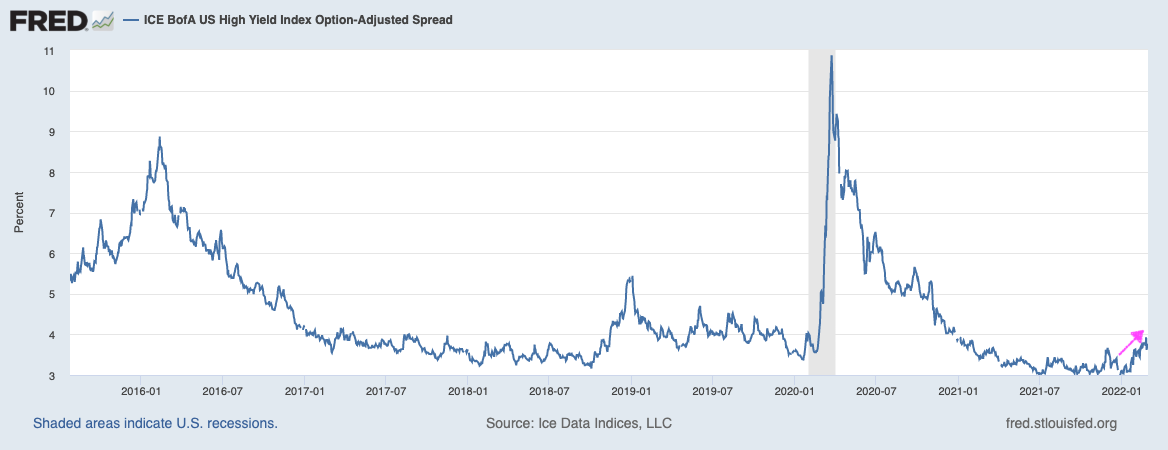
For the time being, that’s stabilizing, cognizant of the fact that exuberance in individual stocks, over the past weeks, fed into the stock indices themselves.

Further, the price action we’re seeing is likely the resolve of some of that weak breadth we were seeing, recently, in addition to some of the topics discussed at the beginning of this newsletter.

Graphic: Divergences in breadth. SPX versus % of SPX stocks above the 200-day average.

In short, however, should volatility continue to pick up, those participants (who were once exuberant) may reach for protection forcing dealers to reflexively hedge in a destabilizing manner.

Once that protection rolls off the table (expires and/or is monetized), dealers will reverse and support the market, buying-to-close existing stock/futures hedges to negative gamma positions. 

This flow is stabilizing and may support a seasonally-aligned rally into Christmas.

Expectations: As of 6:00 AM ET, Wednesday’s regular session (9:30 AM – 4:00 PM ET), in the S&P 500, will likely open in the middle part of a negatively skewed overnight inventory, inside of prior-range and -value, suggesting a limited potential for immediate directional opportunity.

Spike Scenario In Play: A spike marks the beginning of a break from value. Spikes higher (lower) are validated by trade at or above (below) the spike base (i.e., the origin of the spike).

The spike may also be looked at as a pivot; in today’s case, the spike base is $4,697.50.

In the best case, the S&P 500 trades sideways or higher; activity above the $4,691.25 high volume area (HVNode) puts in play the $4,711.00 untested point of control (VPOC). Initiative trade beyond the VPOC could reach as high as the $4,740.50 minimal excess high and $4,765.25 Fibonacci, or higher.

In the worst case, the S&P 500 trades lower; activity below the $4,691.25 HVNode puts in play the $4,674.25 micro composite point of control (MCPOC). Initiative trade beyond the MCPOC could reach as low as the $4,647.25 HVNode and $4,619.00 VPOC, or lower.

Click here to load today’s updated key levels into the web-based TradingView charting platform. Note that all levels are derived using the 65-minute timeframe. New links are produced, daily.
Graphic: 65-minute profile chart of the Micro E-mini S&P 500 Futures. Learn about the profile.

Charts To Watch

What People Are Saying

Definitions

Overnight Rally Highs (Lows): Typically, there is a low historical probability associated with overnight rally-highs (lows) ending the upside (downside) discovery process.

Volume Areas: A structurally sound market will build on areas of high volume (HVNodes). Should the market trend for long periods of time, it will lack sound structure, identified as low volume areas (LVNodes). LVNodes denote directional conviction and ought to offer support on any test. 

If participants were to auction and find acceptance into areas of prior low volume (LVNodes), then future discovery ought to be volatile and quick as participants look to HVNodes for favorable entry or exit.

Gamma: Gamma is the sensitivity of an option to changes in the underlying price. Dealers that take the other side of options trades hedge their exposure to risk by buying and selling the underlying. When dealers are short-gamma, they hedge by buying into strength and selling into weakness. When dealers are long-gamma, they hedge by selling into strength and buying into weakness. The former exacerbates volatility. The latter calms volatility.

POCs: POCs are valuable as they denote areas where two-sided trade was most prevalent in a prior day session. Participants will respond to future tests of value as they offer favorable entry and exit.

MCPOCs: POCs are valuable as they denote areas where two-sided trade was most prevalent over numerous day sessions. Participants will respond to future tests of value as they offer favorable entry and exit.

About

After years of self-education, strategy development, and trial-and-error, Renato Leonard Capelj began trading full-time and founded Physik Invest to detail his methods, research, and performance in the markets.

Additionally, Capelj is a Benzinga finance and technology reporter interviewing the likes of Shark Tank’s Kevin O’Leary, JC2 Ventures’ John Chambers, and ARK Invest’s Catherine Wood, as well as a SpotGamma contributor, developing insights around impactful options market dynamics.

Disclaimer

At this time, Physik Invest does not manage outside capital and is not licensed. In no way should the materials herein be construed as advice. Derivatives carry a substantial risk of loss. All content is for informational purposes only.