
The Daily Brief is a free glimpse into the prevailing fundamental and technical drivers of U.S. equity market products. Join the 200+ that read this report daily, below!
What Happened
Overnight, equity indices auctioned sideways to lower after a failed balance-area breakout resulted in a rotation back toward the most accepted (or traded at) price levels over two weeks.
Ahead is data on ADP National Employment Report (8:15 AM ET), Markit Services PMI (9:45 AM ET), and FOMC minutes (2:00 PM ET).
What To Expect
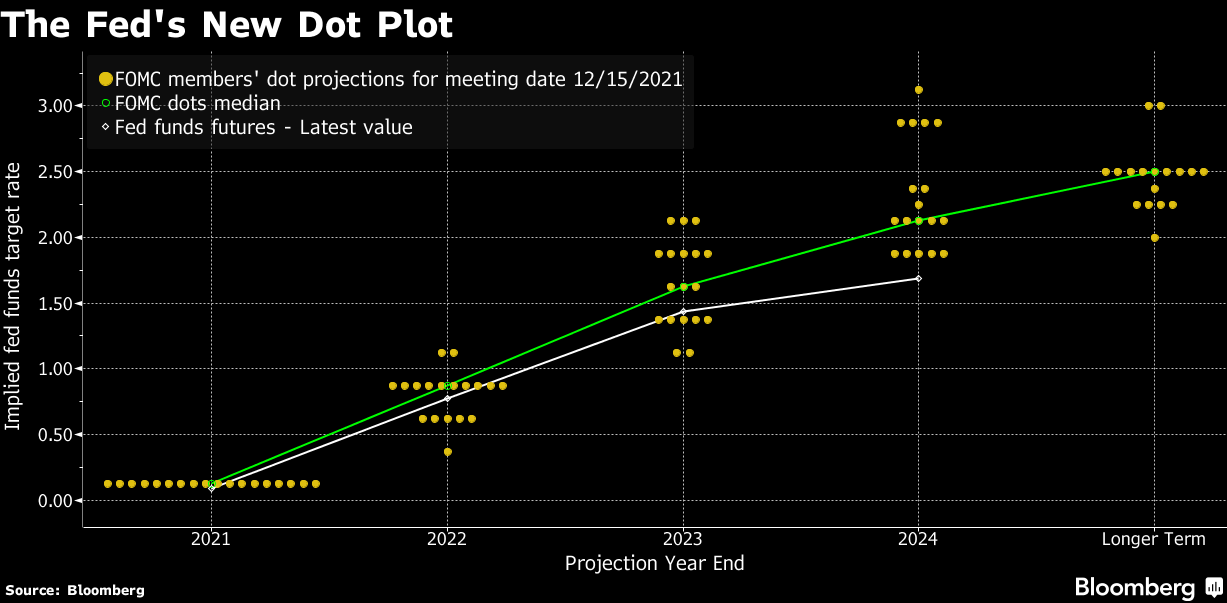
Fundamental: Today, participants ought to get further clarity around the timing of the Federal Reserve’s first interest-rate hike and its taper to the pace of asset buying.
The central bank doubled the pace of tapering in mid-December, setting the stage for rate hikes, later in 2022.
According to Bloomberg, expected are three quarter-percentage-point increases in the key federal funds rate target in 2022.
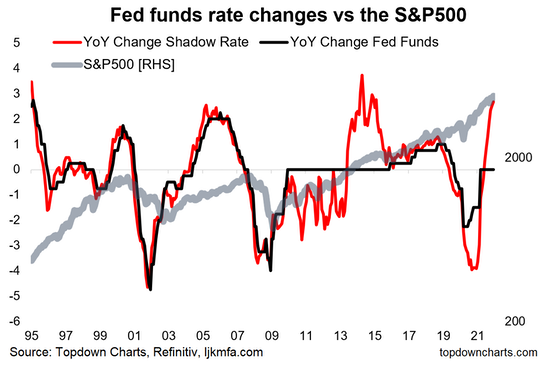
This expectation has coincided with a move higher in Treasury yields and weakness in the growth- and innovation-heavy Nasdaq 100.
Recall that inflation and rates move inverse to each other. In defending against the pressures of inflation, higher rates have the potential to decrease the present value of future earnings making stocks, especially those that are high growth, less attractive.
Moreover, a concern is that “[t]he minutes could hint at a quicker start to shrinking the balance sheet than after the prior tapering.”
With the equity market rallying on the back of easy monetary frameworks and max liquidity, markets diverged from fundamentals.
Reductions in the balance sheet (i.e., removal of liquidity) may help prick the bubble.
Additionally, with the use of leveraged products trending higher than in the past, cross-asset correlations increase with volatility and stress. This may result in “hedging and de-leveraging cascades that affect the stability of all markets,” as well put in one article I recently wrote.
In other words, the response by customers, as well as the dynamics of dealers’ risk exposure to direction and volatility, can cause violent crash dynamics to transpire, further cutting into liquidity, and aiding an unraveling.
“It’s not a coincidence that the mid-February to mid-March 2020 downturn literally started the day after February expiration and ended the day of March quarterly expiration,” Kai Volatility’s Cem Karsan once told me. “These derivatives are incredibly embedded in how the tail reacts and there’s not enough liquidity, given the leverage, if the Fed were to taper.”
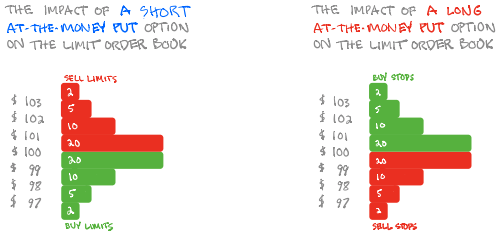
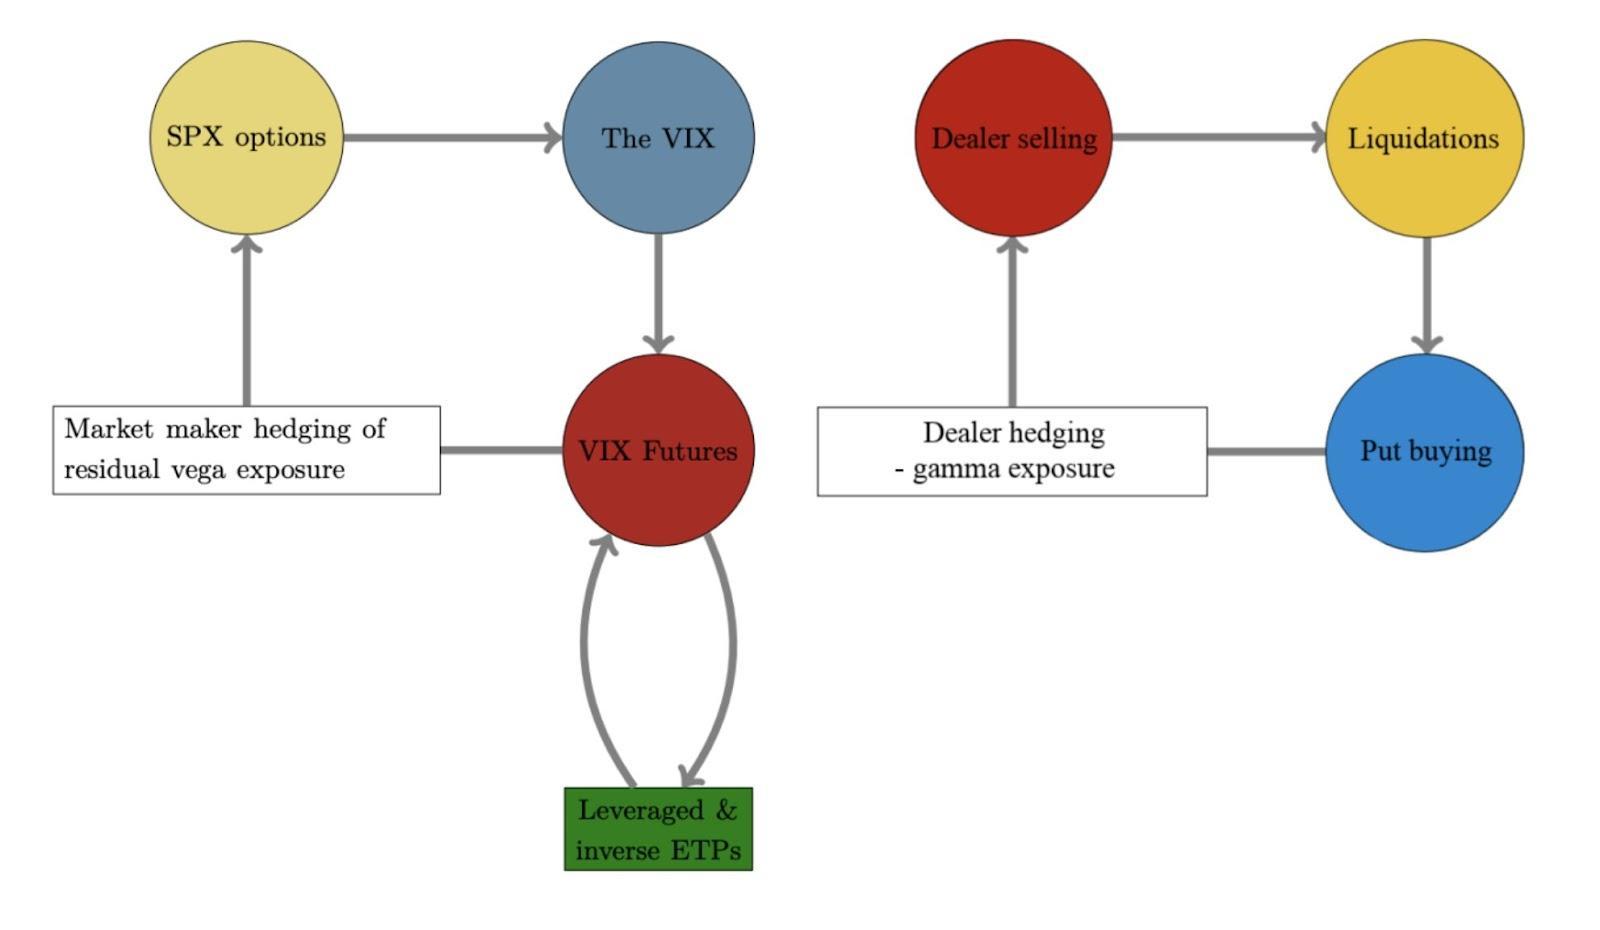
See the graphic below for implications of customers’ demands for downside protection.
Positioning: Pursuant to some of the comments made in yesterday’s commentary, expected is a continued compression in volatility.
Monday saw the selling of upside (call) and downside (put) protection. Tuesday saw more of the former, and that promoted some of the reversion, for lack of better phrasing, seen yesterday.
Recall that the participant on the other side of this dominant trade is taking on more exposure to positive delta.
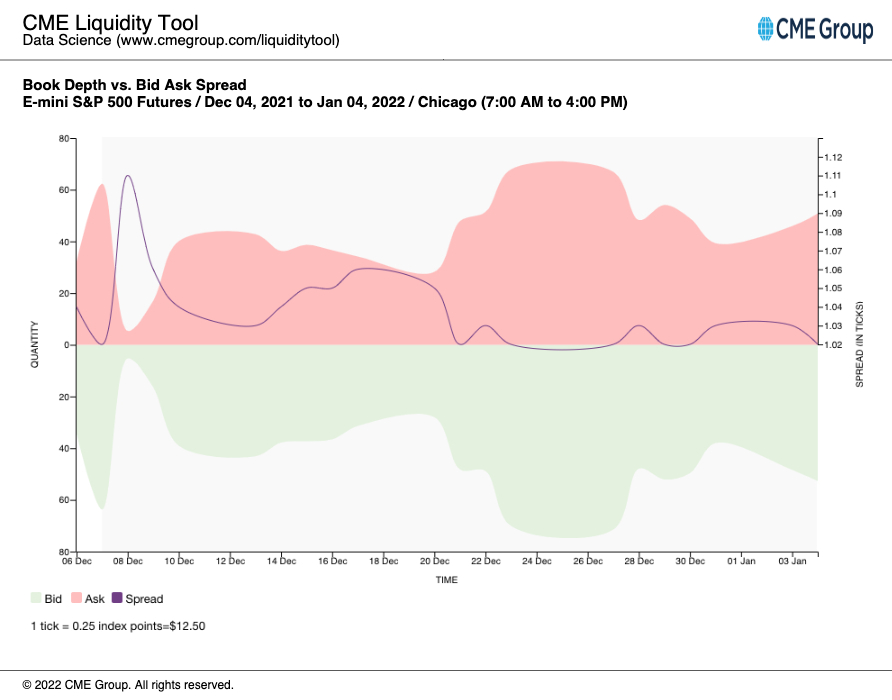
Why? Well, with any price rise, gamma (or how an option’s delta is expected to change given a change in the underlying) is added to the delta. Counterparties are to offset gamma by adding liquidity (as can be approximated with thickening of book depth, below) to the market (i.e., buy dips, sell rips).
The continued compression of volatility will only serve to bolster any price rise as “hedging vanna and charm flows, and whatnot will push the markets higher.”
Were participants to reach for downside protection, markets will tend toward instability. Not seeing this yet.
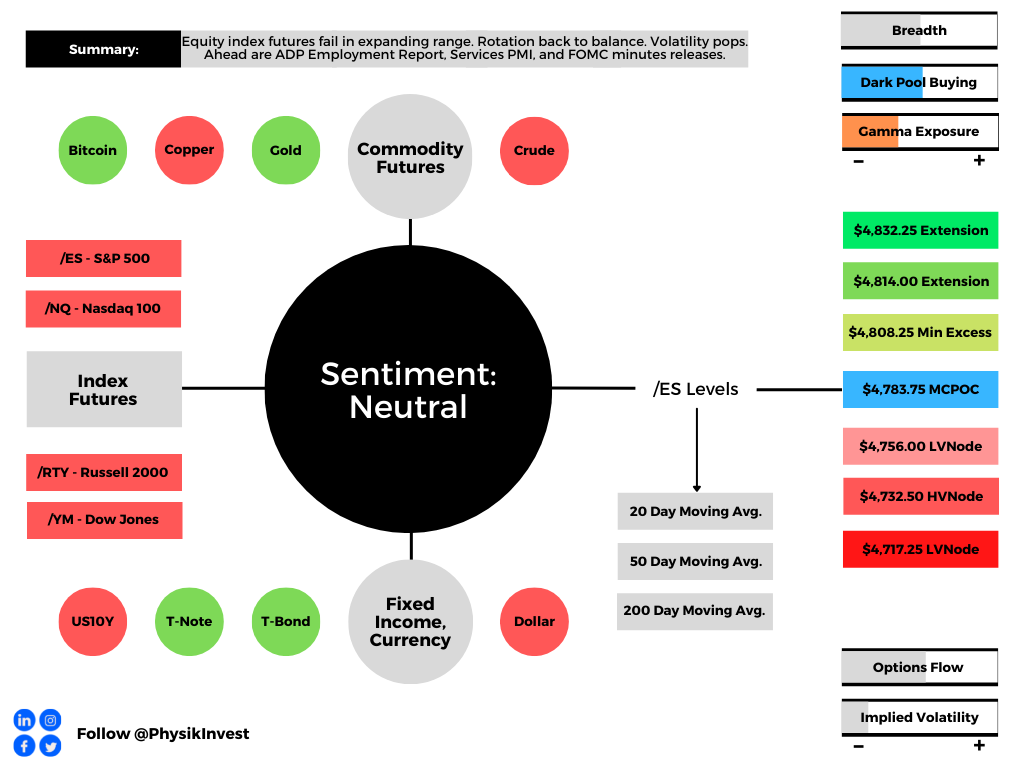
Technical: As of 6:40 AM ET, Wednesday’s regular session (9:30 AM – 4:00 PM ET), in the S&P 500, will likely open in the middle part of a negatively skewed overnight inventory, inside of prior-range and -value, suggesting a limited potential for immediate directional opportunity.
Balance (Two-Timeframe Or Bracket) Scenarios: Rotational trade that denotes current prices offer favorable entry and exit. Balance-areas make it easy to spot a change in the market (i.e., the transition from two-time frame trade, or balance, to one-time frame trade, or trend).

Modus operandi is responsive trade (i.e., fade the edges), rather than initiative trade (i.e., play the break).
In the best case, the S&P 500 trades higher; activity above the $4,783.75 micro composite point of control (MCPOC) puts in play the $4,808.25 minimal excess high. Initiative trade beyond the $4,808.25 figure could reach as high as the $4,814.00 and $4,832.25 extension, or higher.
In the worst case, the S&P 500 trades lower; activity below the $4,783.75 MCPOC puts in play the $4,756.00 low volume area (LVNode). Initiative trade beyond the LVNode could reach as low as the $4,732.50 high volume area (HVNode) and $4,717.25 LVNode, or lower.
Considerations: The aforementioned trade in the S&P 500 marks a potential willingness to continue balance, and it is built on poor structure, a dynamic that adds to technical instability.
On a liquidation that finds acceptance (i.e., more than 30-minutes of trade at a particular price level) below $4,756.00, there is increased potential for a fast move lower to $4,732.50 or lower.
This is as there has been a persistence of responses to technical levels; weaker-handed participants (which seldom defend retests) are carrying a heavier hand in recent discovery.
With that, any penetration of low-volume pockets – voids like gaps that can be seen on a chart – there ought to be follow-through as the participants that were most active at those levels run for the exits.
Click here to load today’s key levels into the web-based TradingView charting platform. Note that all levels are derived using the 65-minute timeframe. New links are produced, daily.

What People Are Saying
Definitions
Volume Areas: A structurally sound market will build on areas of high volume (HVNodes). Should the market trend for long periods of time, it will lack sound structure, identified as low volume areas (LVNodes). LVNodes denote directional conviction and ought to offer support on any test.
If participants were to auction and find acceptance into areas of prior low volume (LVNodes), then future discovery ought to be volatile and quick as participants look to HVNodes for favorable entry or exit.
Gamma: Gamma is the sensitivity of an option to changes in the underlying price. Dealers that take the other side of options trades hedge their exposure to risk by buying and selling the underlying. When dealers are short-gamma, they hedge by buying into strength and selling into weakness. When dealers are long-gamma, they hedge by selling into strength and buying into weakness. The former exacerbates volatility. The latter calms volatility.
Vanna: The rate at which the delta of an option changes with respect to volatility.
Charm: The rate at which the delta of an option changes with respect to time.
Options: If an option buyer was short (long) stock, he or she would buy a call (put) to hedge upside (downside) exposure. Option buyers can also use options as an efficient way to gain directional exposure.
MCPOCs: POCs are valuable as they denote areas where two-sided trade was most prevalent over numerous day sessions. Participants will respond to future tests of value as they offer favorable entry and exit.
Excess: A proper end to price discovery; the market travels too far while advertising prices. Responsive, other-timeframe (OTF) participants aggressively enter the market, leaving tails or gaps which denote unfair prices.
About
After years of self-education, strategy development, mentorship, and trial-and-error, Renato Leonard Capelj began trading full-time and founded Physik Invest to detail his methods, research, and performance in the markets.
Capelj is also a Benzinga finance and technology reporter interviewing the likes of Shark Tank’s Kevin O’Leary, JC2 Ventures’ John Chambers, FTX’s Sam Bankman-Fried, and ARK Invest’s Catherine Wood, as well as a SpotGamma contributor developing insights around impactful options market dynamics.
Disclaimer
Physik Invest does not carry the right to provide advice.
In no way should the materials herein be construed as advice. Derivatives carry a substantial risk of loss. All content is for informational purposes only.