Categories
Commentary

Daily Brief For October 5, 2022

The daily brief is a free glimpse into the prevailing fundamental and technical drivers of U.S. equity market products. Join the 1000+ that read this report daily, below!
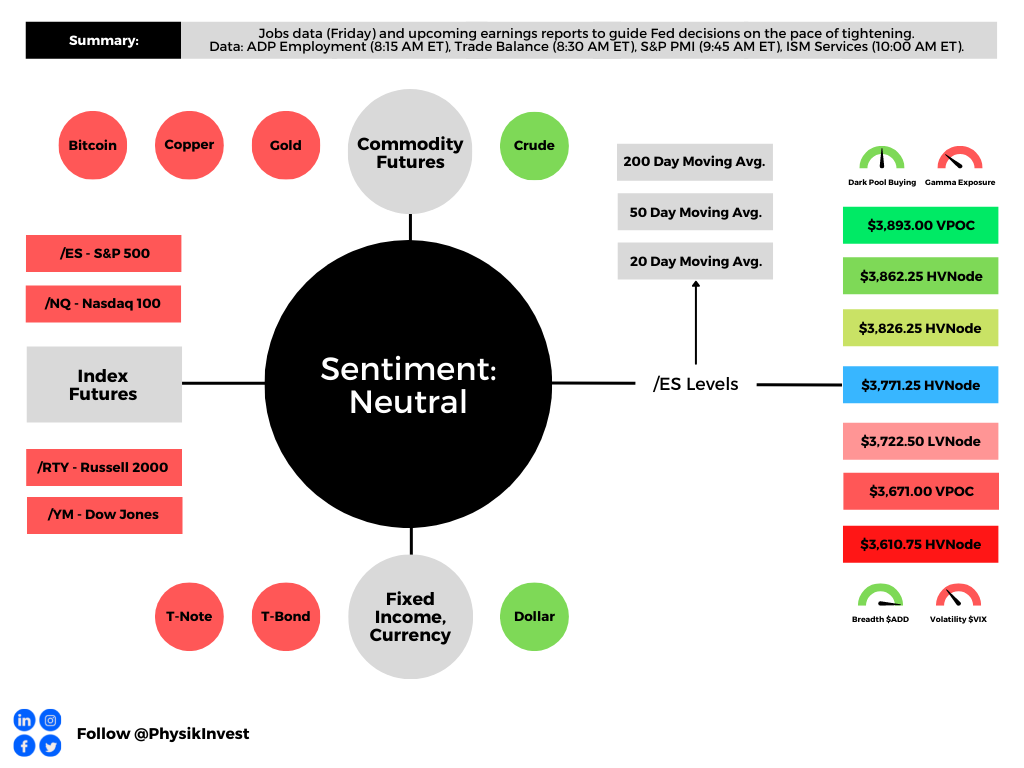
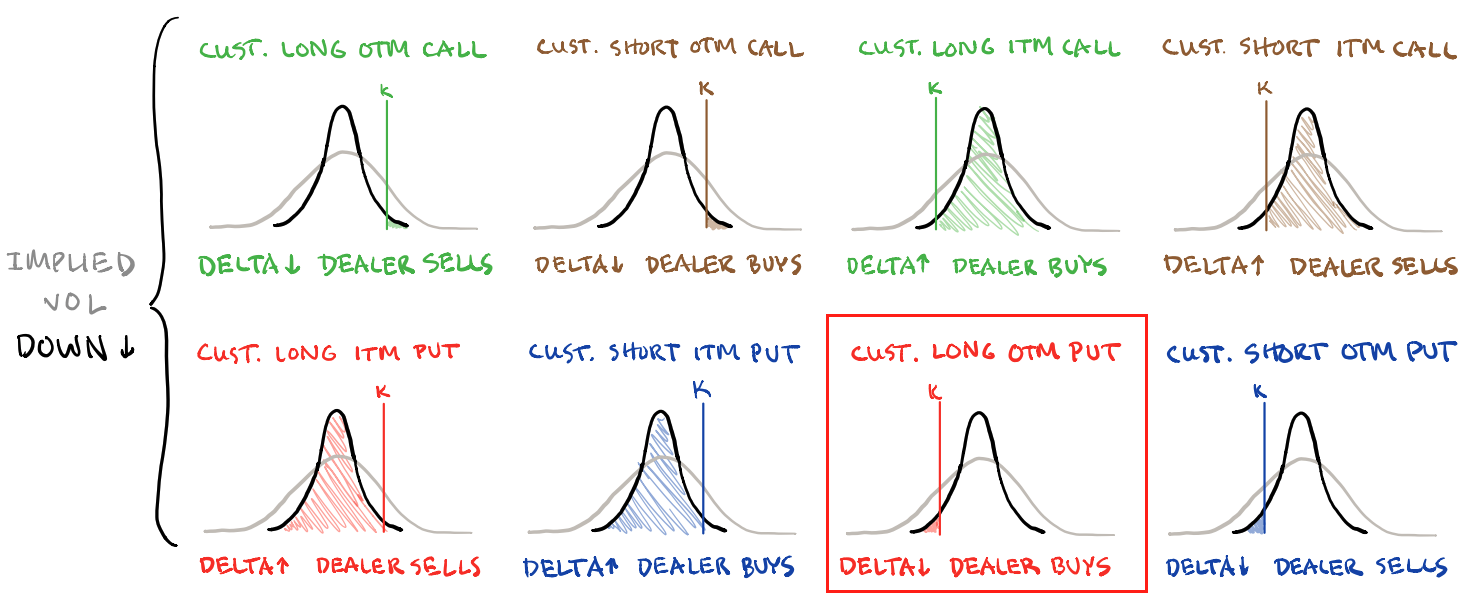
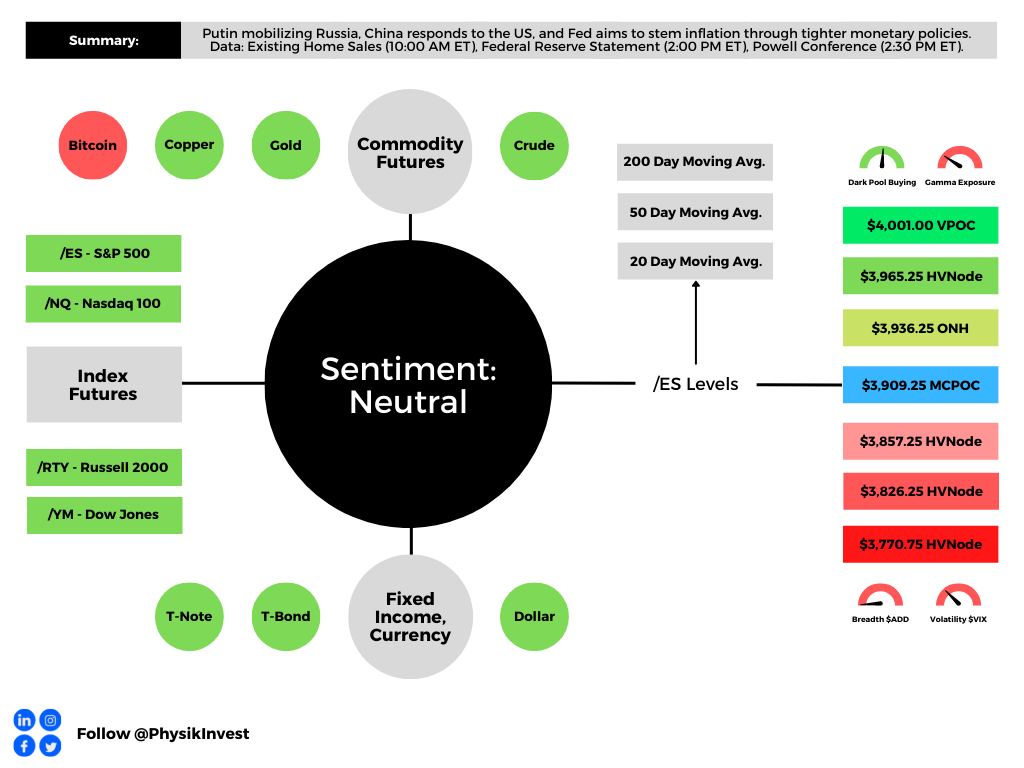
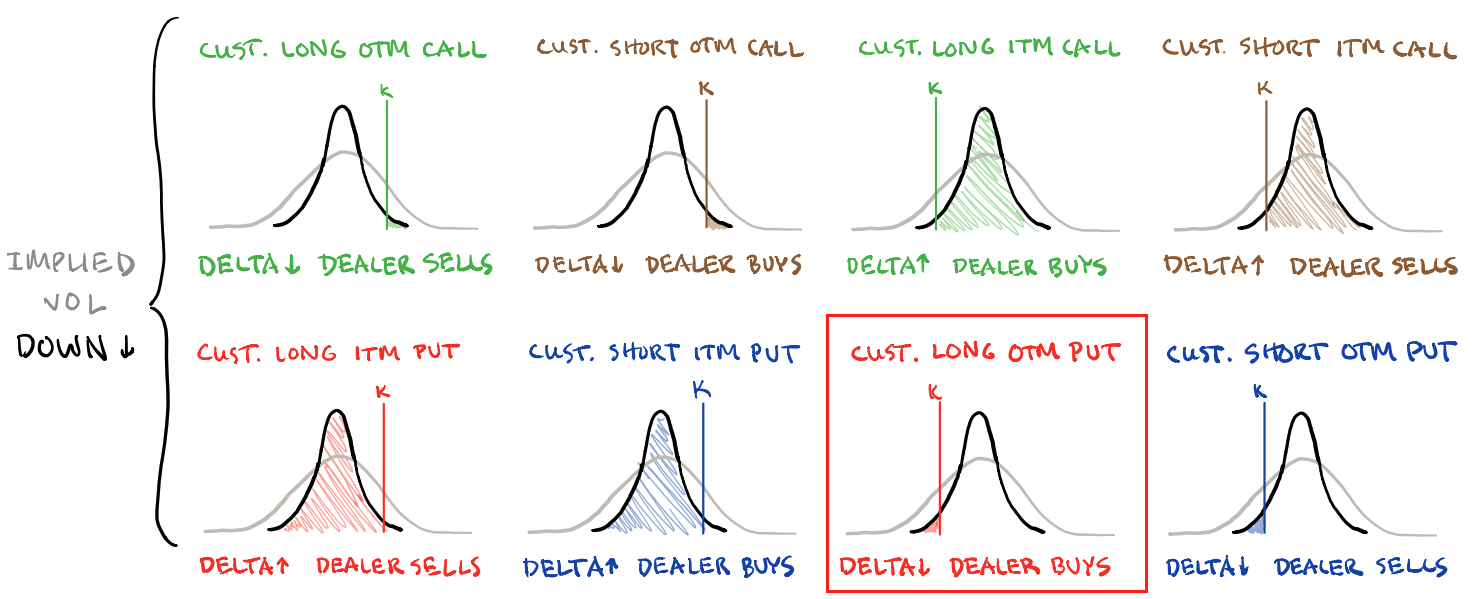
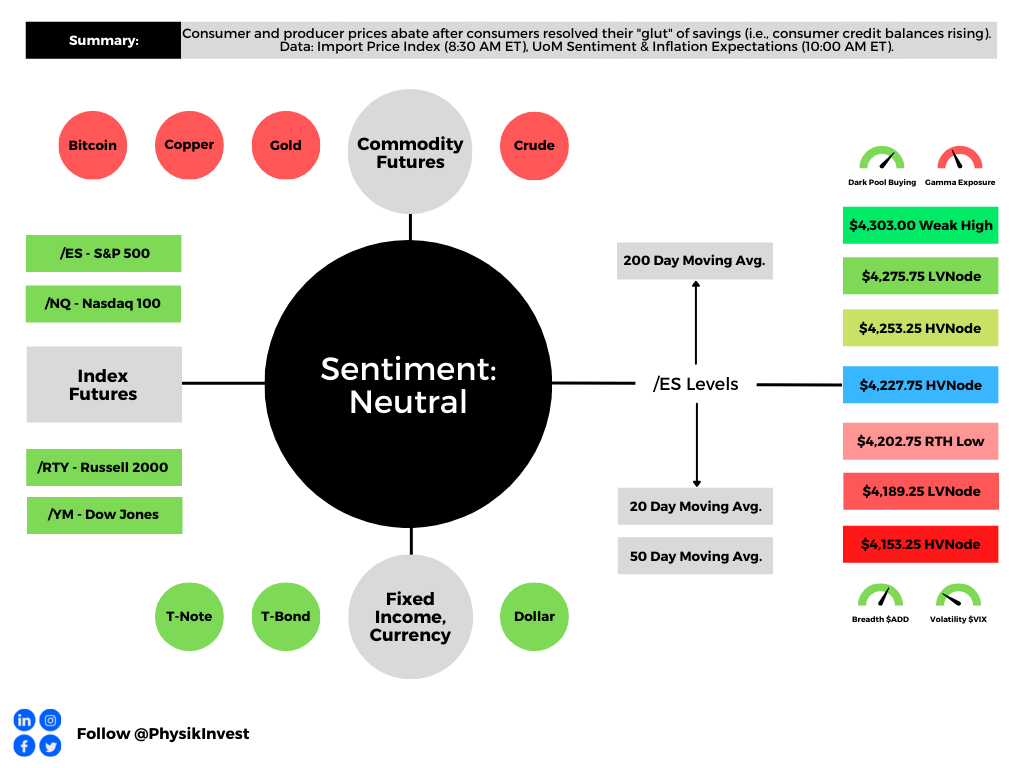
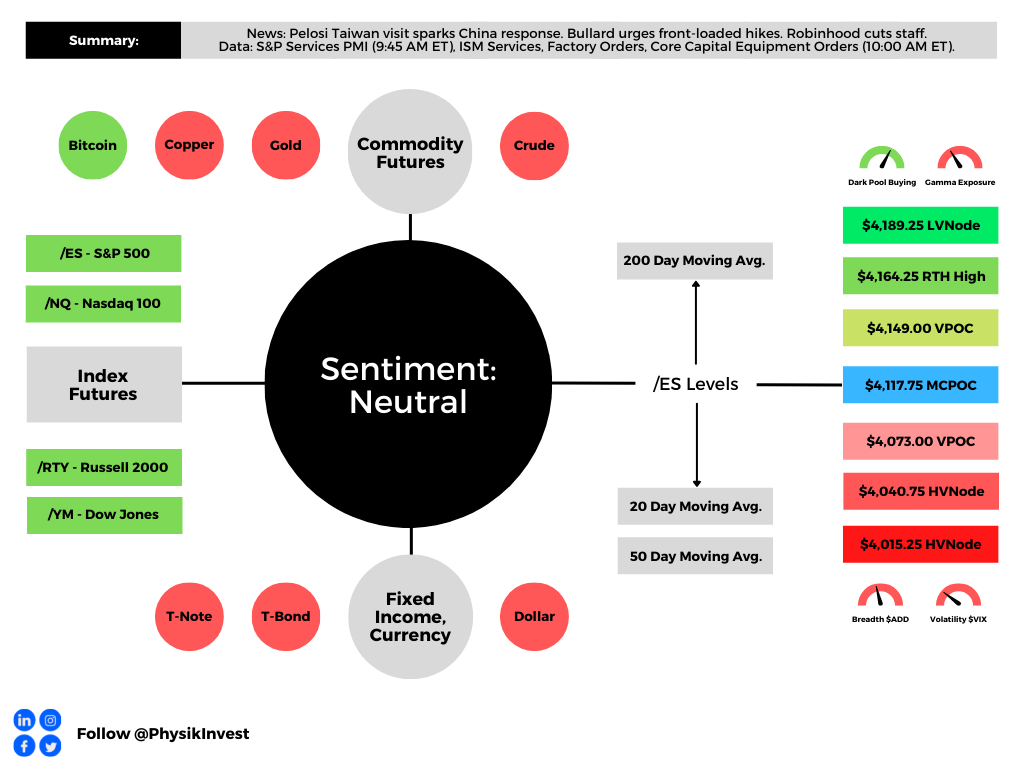
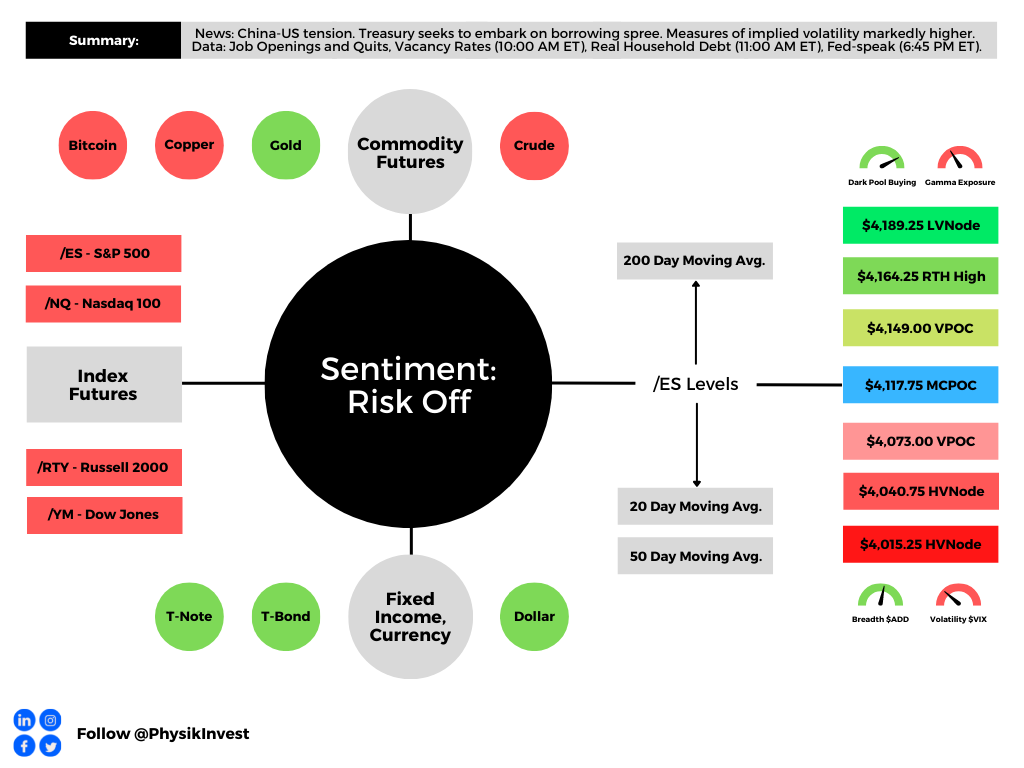
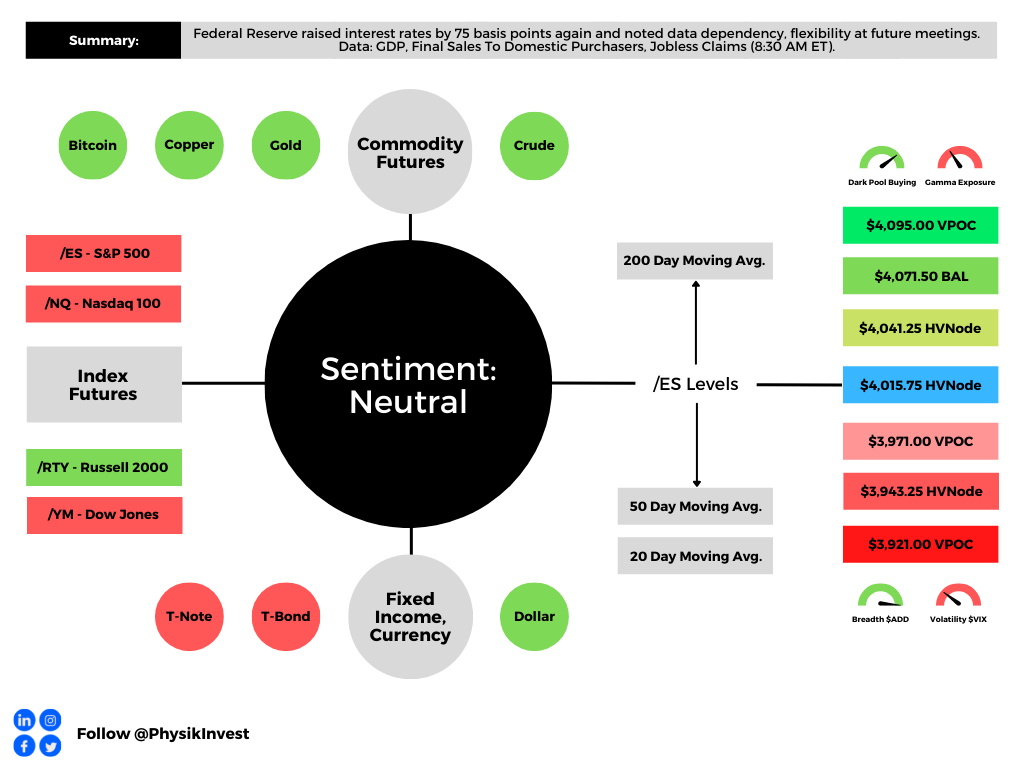
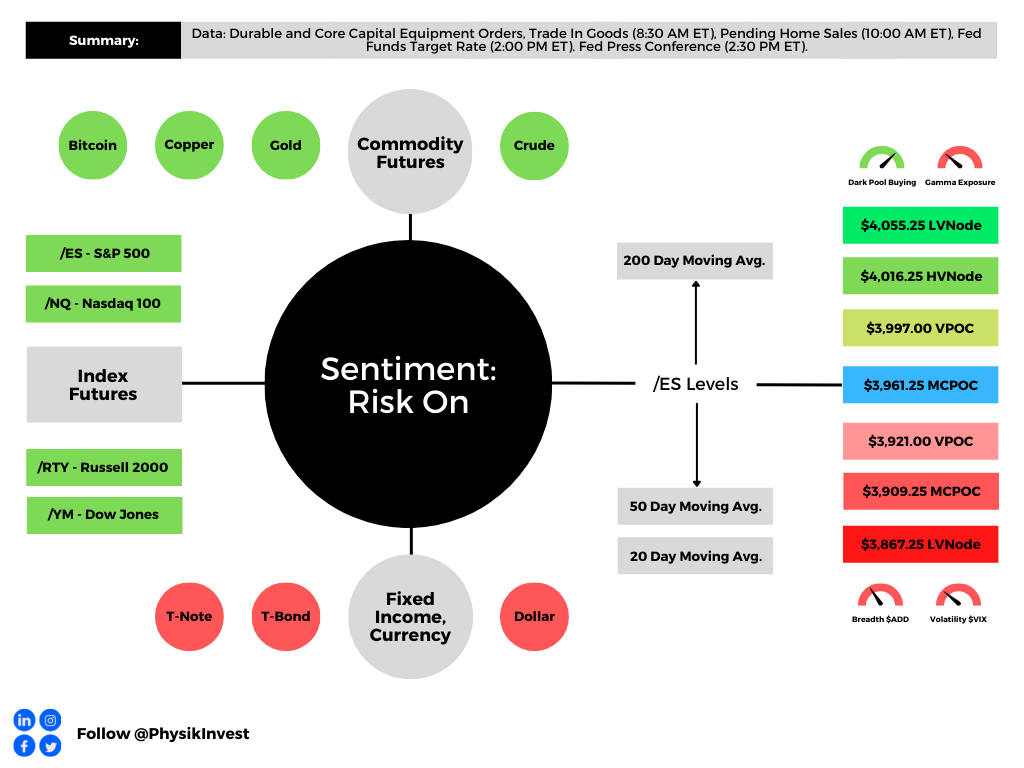
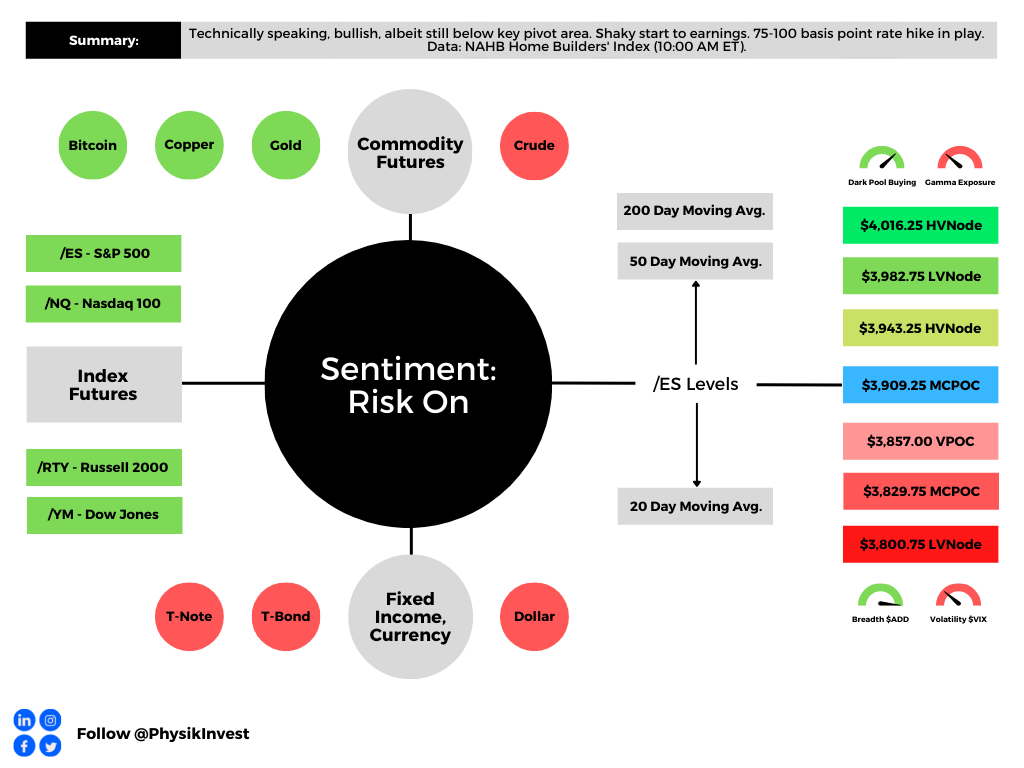
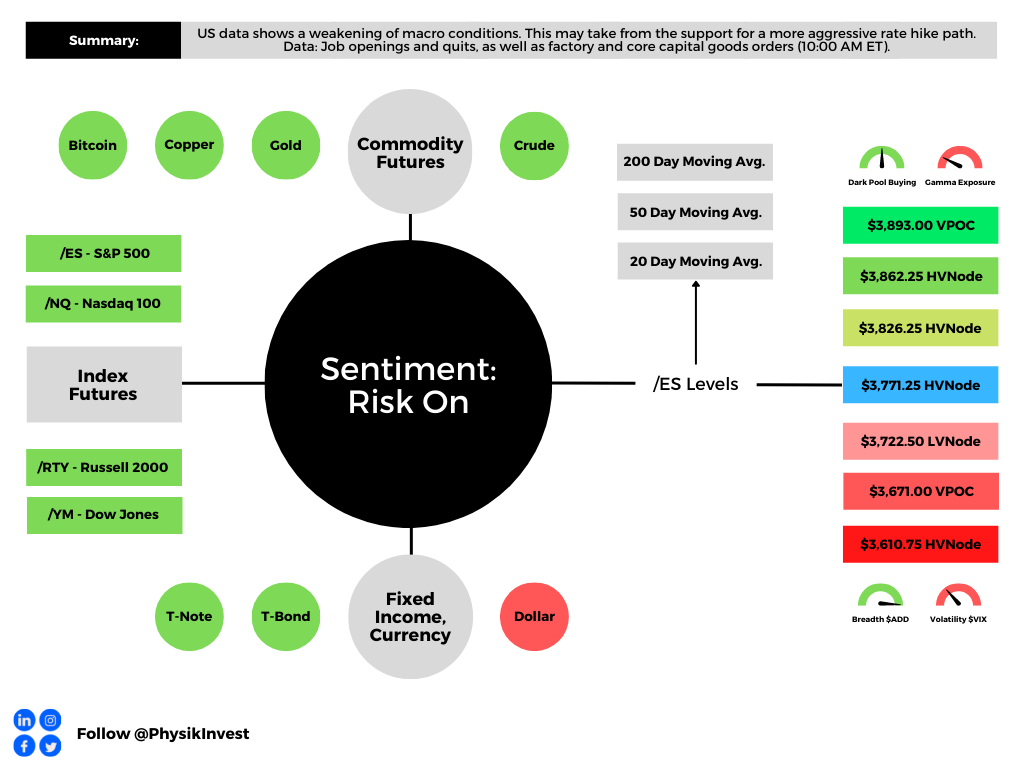
Graphic updated 6:45 AM ET. Sentiment Neutral if expected /ES open is inside of the prior day’s range. /ES levels are derived from the profile graphic at the bottom of the following section. Levels may have changed since initially quoted; click here for the latest levels. SqueezeMetrics Dark Pool Index (DIX) and Gamma (GEX) calculations are based on where the prior day’s reading falls with respect to the MAX and MIN of all occurrences available. A higher DIX is bullish. At the same time, the lower the GEX, the more (expected) volatility. Learn the implications of volatility, direction, and moneyness. Breadth reflects a reading of the prior day’s NYSE Advance/Decline indicator. VIX reflects a current reading of the CBOE Volatility Index (INDEX: VIX) from 0-100.

Administrative

Expect no letter on Friday, October 7, 2022.

Fundamental

Markets printed lower, this morning, ahead of the US cash-open. This bonds, commodities, and equities down phenomenon we’ve unpacked in detail many times before. 

At its core, supply chokepoints and a hot labor market are keeping inflation high and sticky. To lessen this inflation, policymakers are seeking to tighten monetary policy. 

That means raising interest rates and quantitative tightening (QT). 

As we discussed on September 20, the transmission mechanisms of these drivers vary with QT having a very weak transmission “to economic activity but very strong to financial markets.” On the other end are rates that have a stronger transmission to economic activity.

And so, on “the incremental effects on liquidity” these drivers pose, markets are trading more in sync; on the way up, through fiscal stimuli, interest rate decreases, and QE (i.e., buying of US Treasuries and mortgage securities), investors sought more yield elsewhere. 

Risk assets like stocks, crypto, and beyond thus enjoyed a boost.

In a way, the opposite is happening now, and selling across risk -on and -off assets is persistent. 

Liquidity measures (which we began unpacking months ago, and were covered in Bloomberg by Kevin Muir of TheMacroTourist.com, recently, too) show a near-lockstep decline in the S&P 500 (INDEX: SPX). Please check out Kevin Muir’s Substack, too!

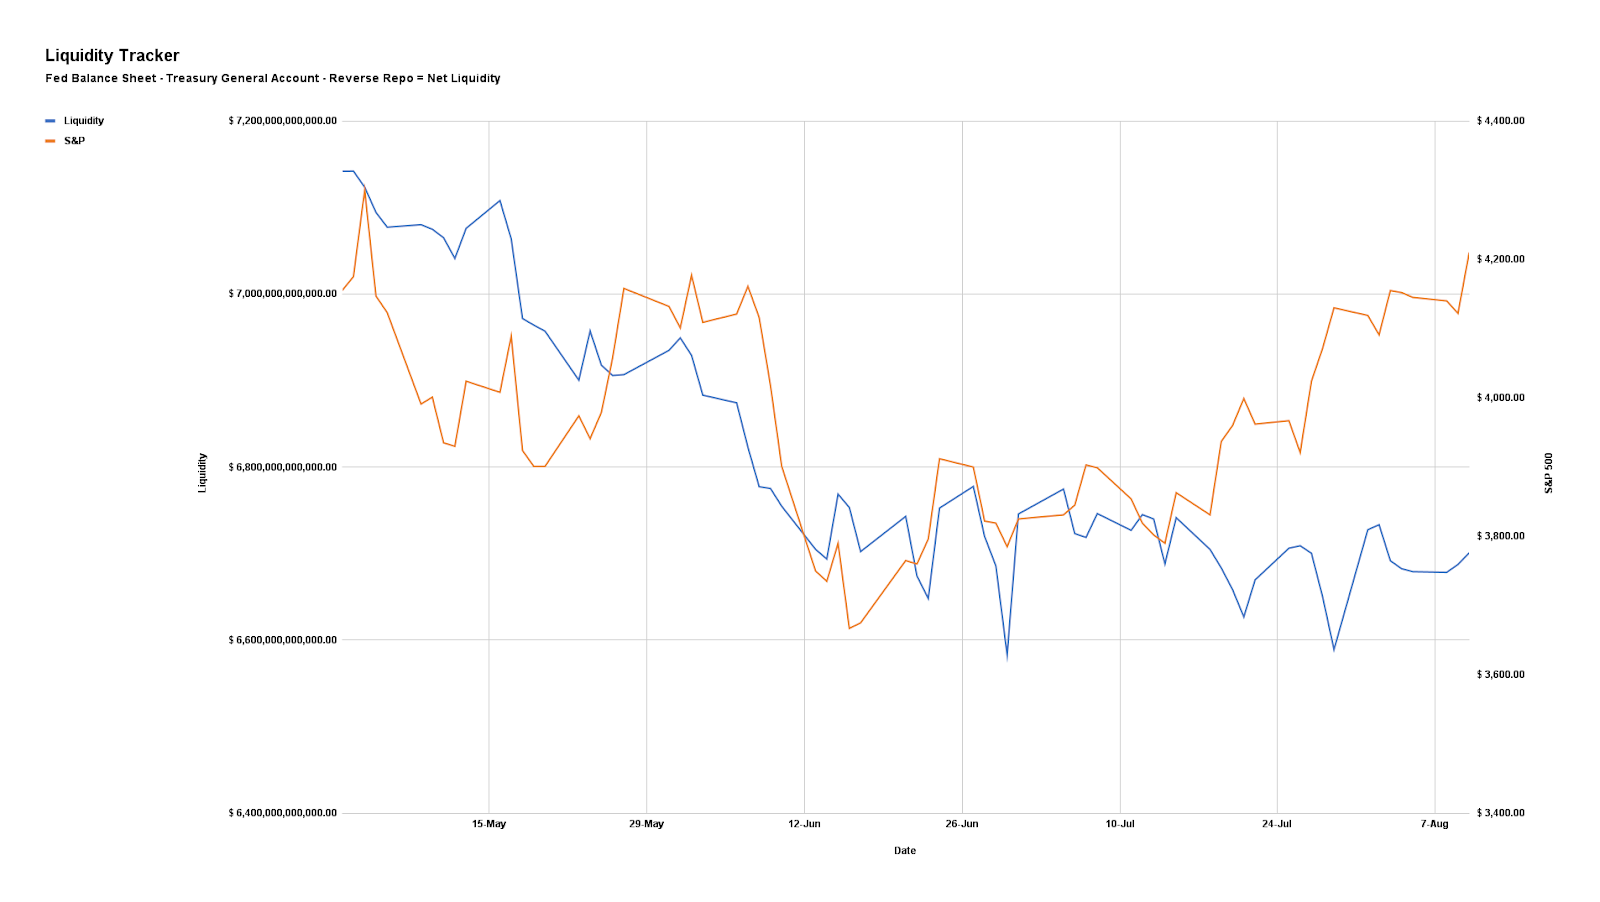
Net liquidity (NL) we calculate by taking the size of the Fed’s balance sheet (BS) and subtracting both the amounts in the reverse repo operation (RRP) and Treasury General Account (TGA).

Muir said that “the liquidity created from QE and fiscal stimulus was so great that commercial banks no longer wanted deposits from large institutional clients because there were not enough safe assets available to purchase.” 

This prompted the expansion of RRP (beyond primary dealers to include the mutual funds and non-traditional accounts), a liquidity-draining operation (cash in the system removed through an increase in the number of bonds), through which the Fed would deliver “high-quality collateral with the promise to buy it back in a certain number of days at a higher price,” Muir explained.

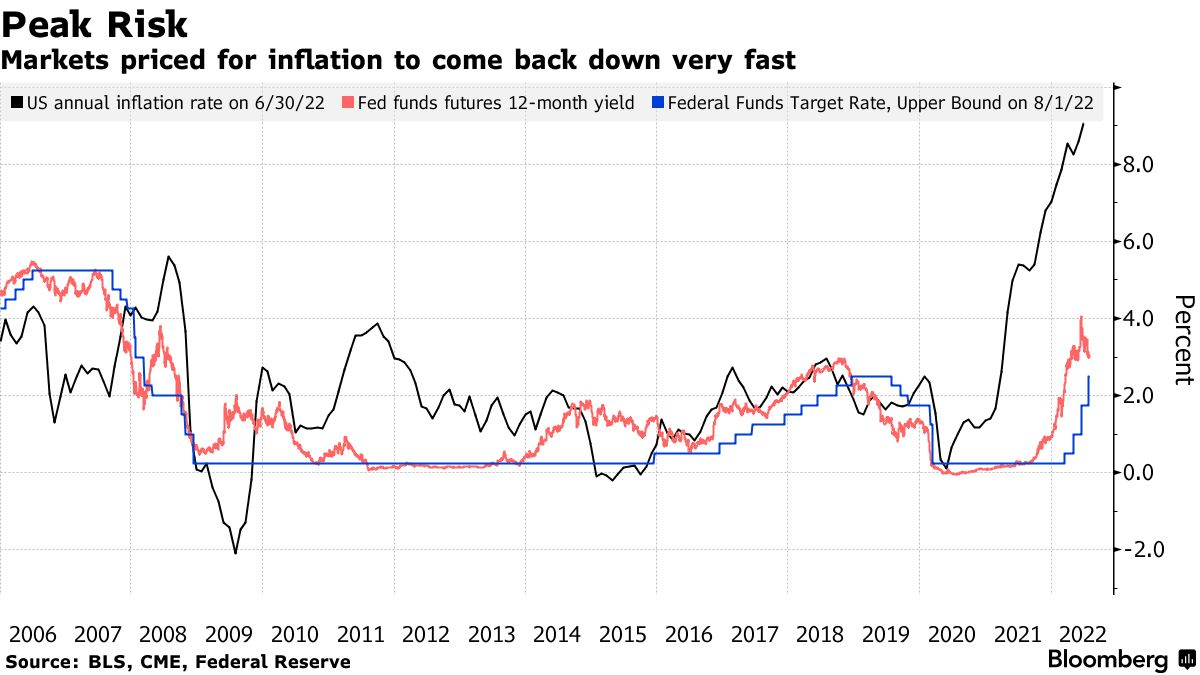
Graphic: Retrieved from Bloomberg.

Other NL drivers include the TGA which, prior to Covid, was fairly well-balanced by taxes (i.e., money coming in) and the issue of fixed-income securities (i.e., money coming out). 

Post-Covid, the TGA increased a lot and this has “the same effect as QT … [as] bonds are issued and cash [is] withdrawn from the financial system, but the money is not distributed into the economy,” Muir elaborated.
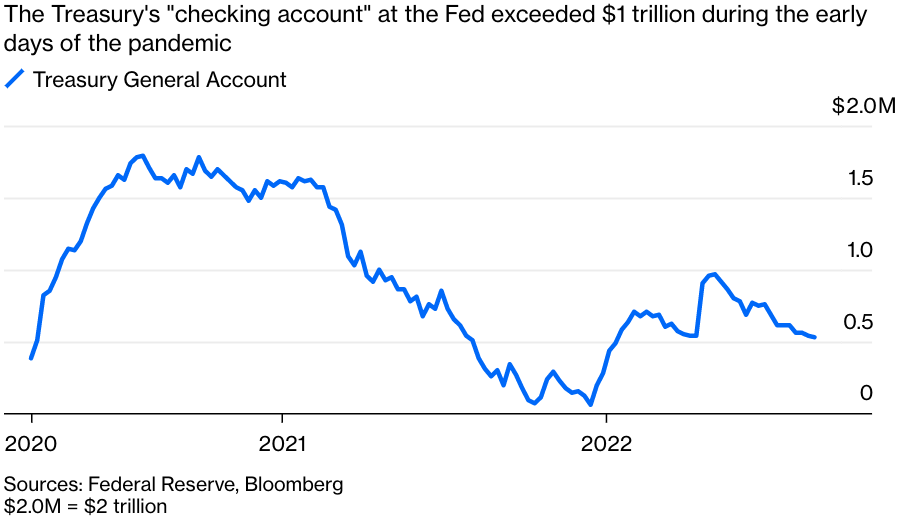
Graphic: Retrieved from Bloomberg.

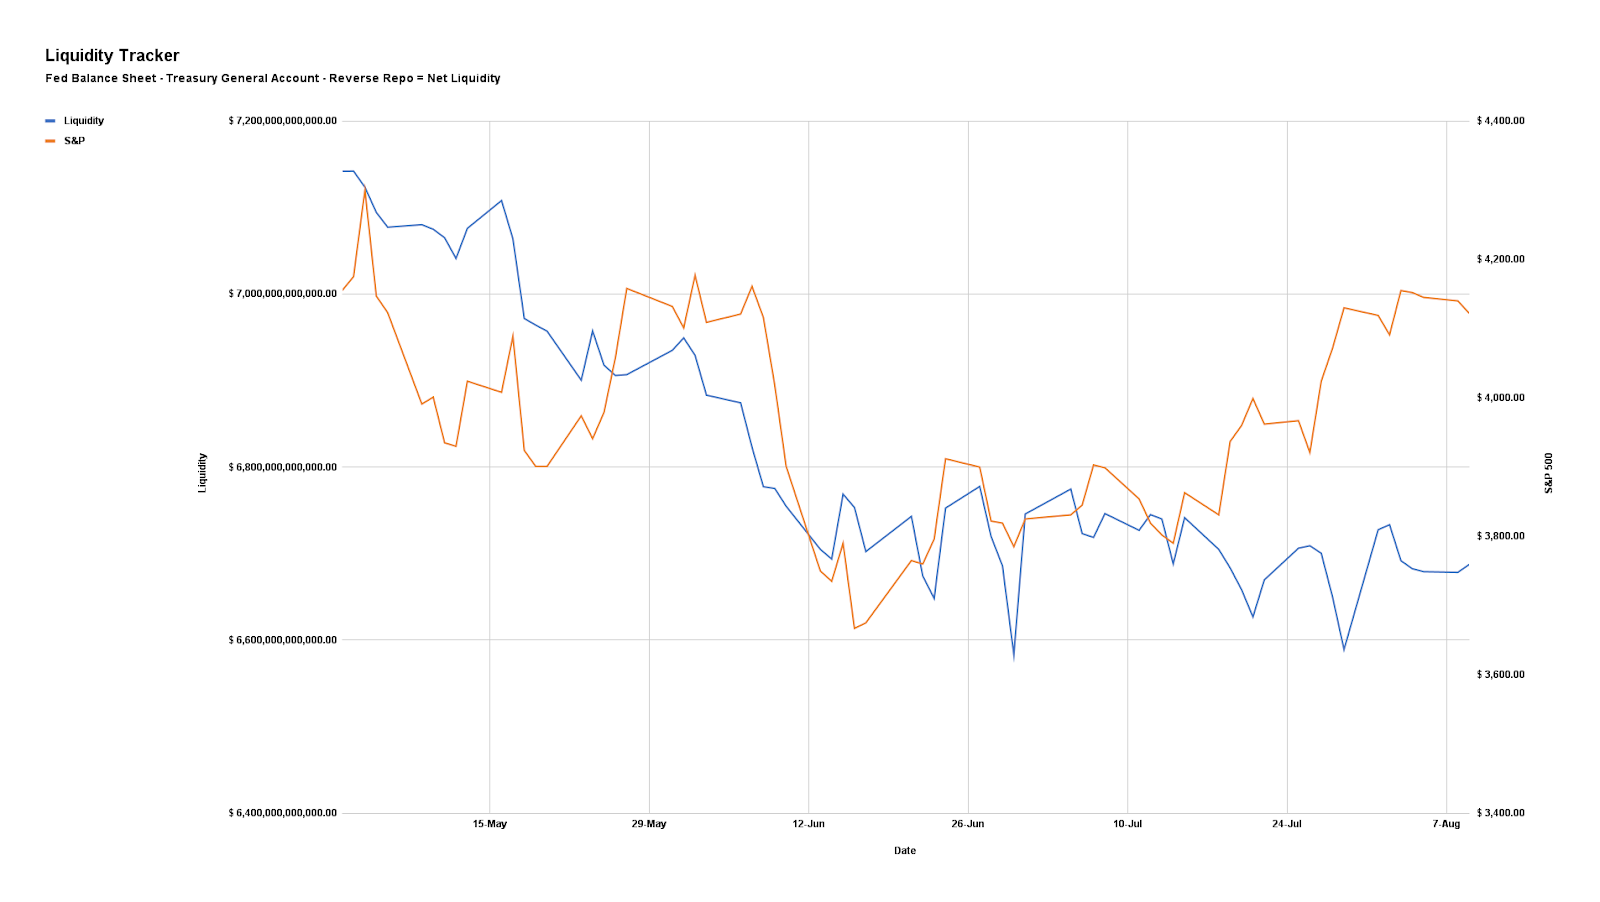
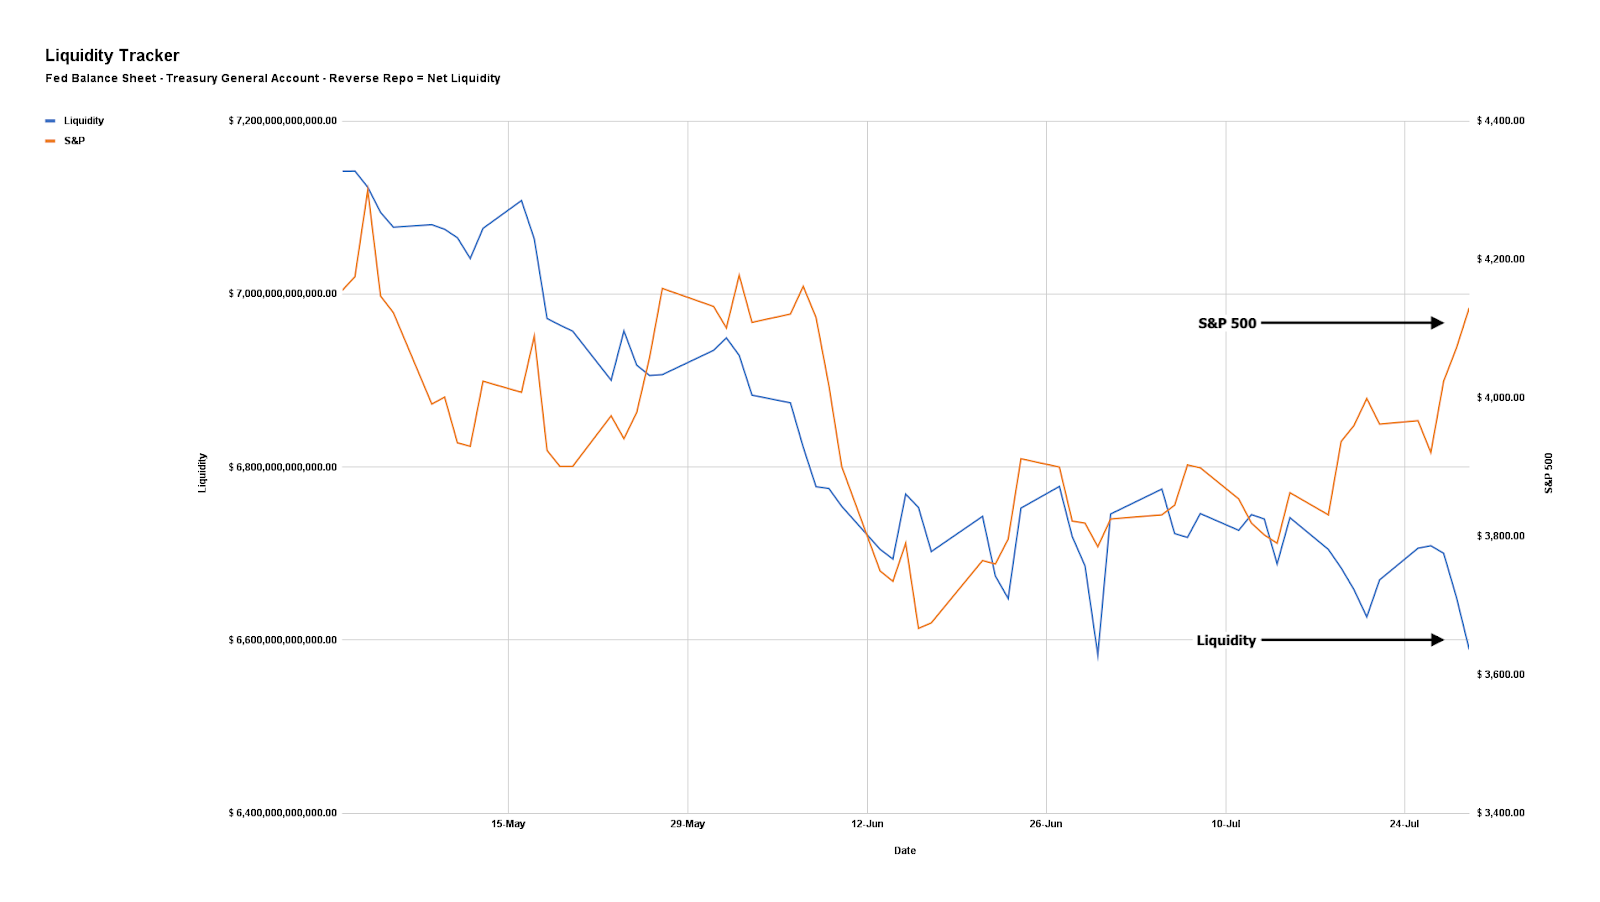
Combining the moves of the RRP and TGA, with the BS, provides us a measure of NL (shown below) that well explains stock price movements, as we’ve put forth in letters before.

Graphic: Via Physik Invest. Data compiled by @jkonopas623. Fed Balance Sheet data, here. Treasury General Account Data, here. Reverse Repo data, here. NL = BS – TGA – RRP.

And, despite the far-spreading risk-on and -off context (i.e., stocks, crypto, and bonds down), it is believed that the large amounts in liquidity-draining operations (RRP and TGA), the impacts of QT, from hereon, may be lessened; per Muir, “[i]f the Fed had securities on its balance sheet that matched the maturity profile demanded by the institutions engaging in reverse repos, it could sell an amount equal to the total reverse repo balance to these institutions, reducing the need for reverse repos and elicit no change in the financial or real economy.”

“On top of that, the actual amount of monthly QT [$95 billion per month] is not that large,” Muir added. That’s because, over the span of five months, into the end of 2021 and the beginning of 2022, the TGA was up $816 billion. This equates to ~$163.2 or so billion per month of QT.

At the end of the day, though, the programs outlined above do less to provide market support. One can argue that the market has priced the programs and some economic slowing. It is not likely the market has priced the impacts of a sharply slowing economy and business.

That said, some data – less corporate profits falling out of bed – suggests “the stock market tends to do better when EPS growth rates are negative than when they are hugely positive.”
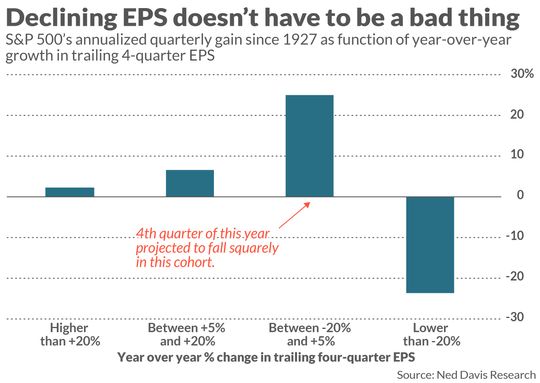
Graphic: Retrieved from Ned Davis Research via MarketWatch. “[A]n inverse relationship between earnings growth rates and the market’s average return.”

The key to explaining this is to remember markets are a forward-looking mechanism. 

“By the time earnings growth rates are extremely high–as they were late last year and early this–they have long since been reflected in stock prices.”

“During such periods, the market has instead shifted its focus to earnings several quarters hence—to factors such as the Fed having to put the brakes on an overheating economy.”

The reverse will happen when the year-over-year growth rate in trailing fourth-quarter EPS is negative; “investors will have shifted their focus to earnings’ likely imminent rebound.”

Positioning

Pending is a final resolution “tied to the incremental effects on liquidity,” (e.g., QT manifesting itself as “$4.5 billion less in demand for assets per day,” and buyback blackout).
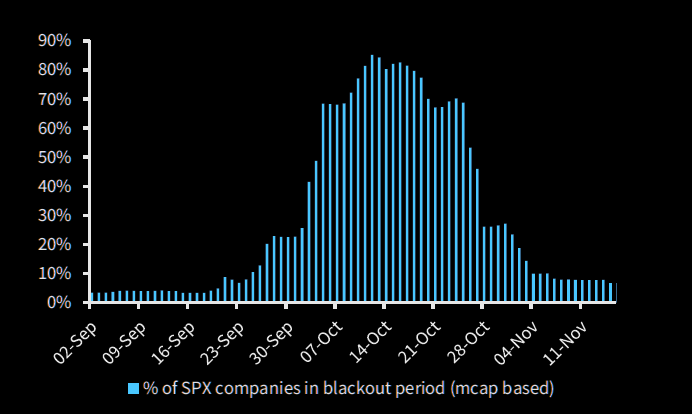
Graphic: Retrieved from Barclays PLC (NYSE: BCS) via The Market Ear.

This is all the while options repositioning may actually make the case for increased fragility, as traders’ falling demand for put protection opens the door to less supportive hedging flows and more impact from macro-type flows (talked about above) if we will.
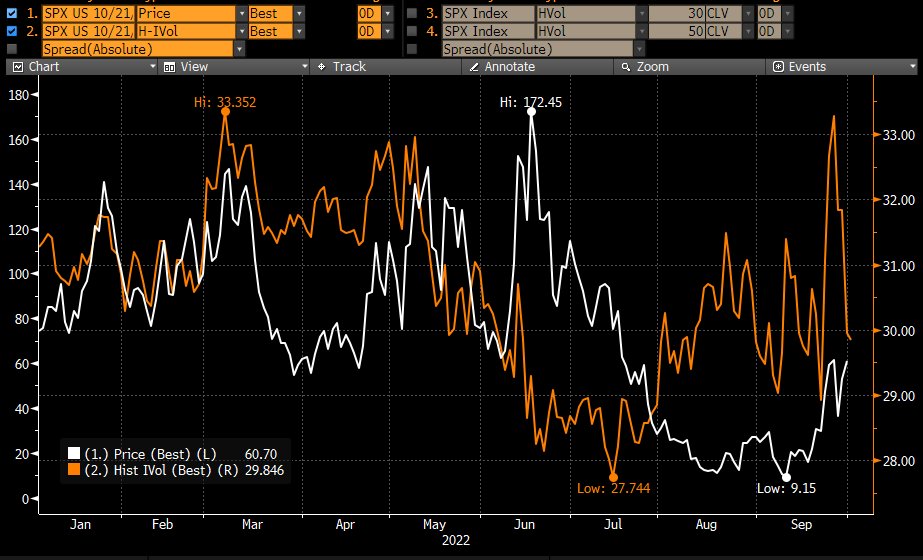
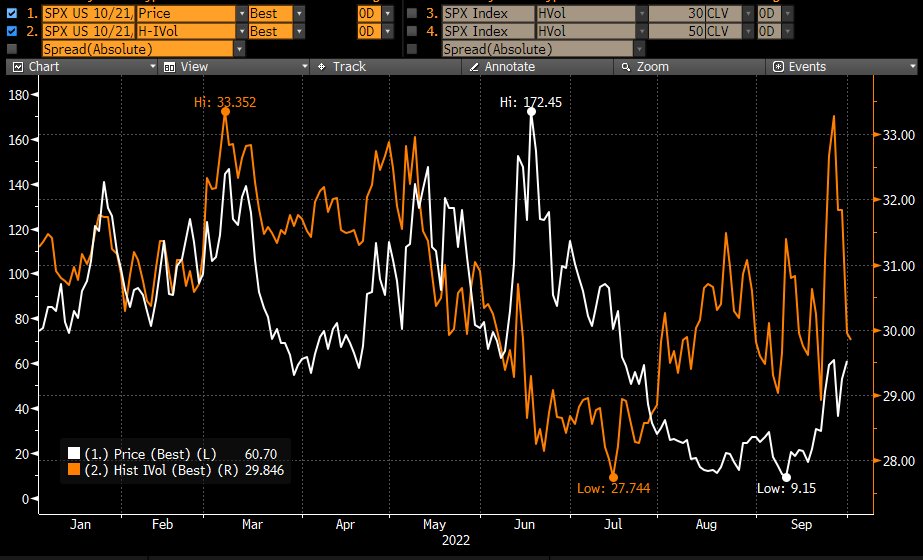
Graphic: Taken from @Alpha_Ex_LLC who retrieved from Bloomberg. S&P 500 (INDEX: SPX) October put option lower in price and volatility.

The last-mentioned SpotGamma explained well: 

“As traders realize that options protection is doing little to protect them, there may be a flip; the sale of volatility, which appears to be a good trade (now), could leave markets vulnerable to an event into which traders are no longer well-hedged. Should something bad happen and traders reach for protection, that could result in limit-down type of movement.”

If unsure of what direction to participate, consider pricing some Box Spreads that offer some competitive and guaranteed interest rates, similar to those earned with Treasury bills.

Technical

As of 6:40 AM ET, Wednesday’s regular session (9:30 AM – 4:00 PM ET), in the S&P 500, is likely to open in the lower part of a negatively skewed overnight inventory, inside of prior-range and -value, suggesting a limited potential for immediate directional opportunity.

In the best case, the S&P 500 trades higher.

Any activity above the $3,771.25 HVNode puts into play the $3,826.25 HVNode. Initiative trade beyond the last-mentioned could reach as high as the $3,862.25 HVNode and $3,893.00 VPOC, or higher.

In the worst case, the S&P 500 trades lower.

Any activity below the $3,771.25 HVNode puts into play the $3,722.50 LVNode. Initiative trade beyond the LVNode could reach as low as the $3,671.00 VPOC and $3,610.75 HVNode, or lower.

Click here to load today’s key levels into the web-based TradingView charting platform. Note that all levels are derived using the 65-minute timeframe. New links are produced, daily.
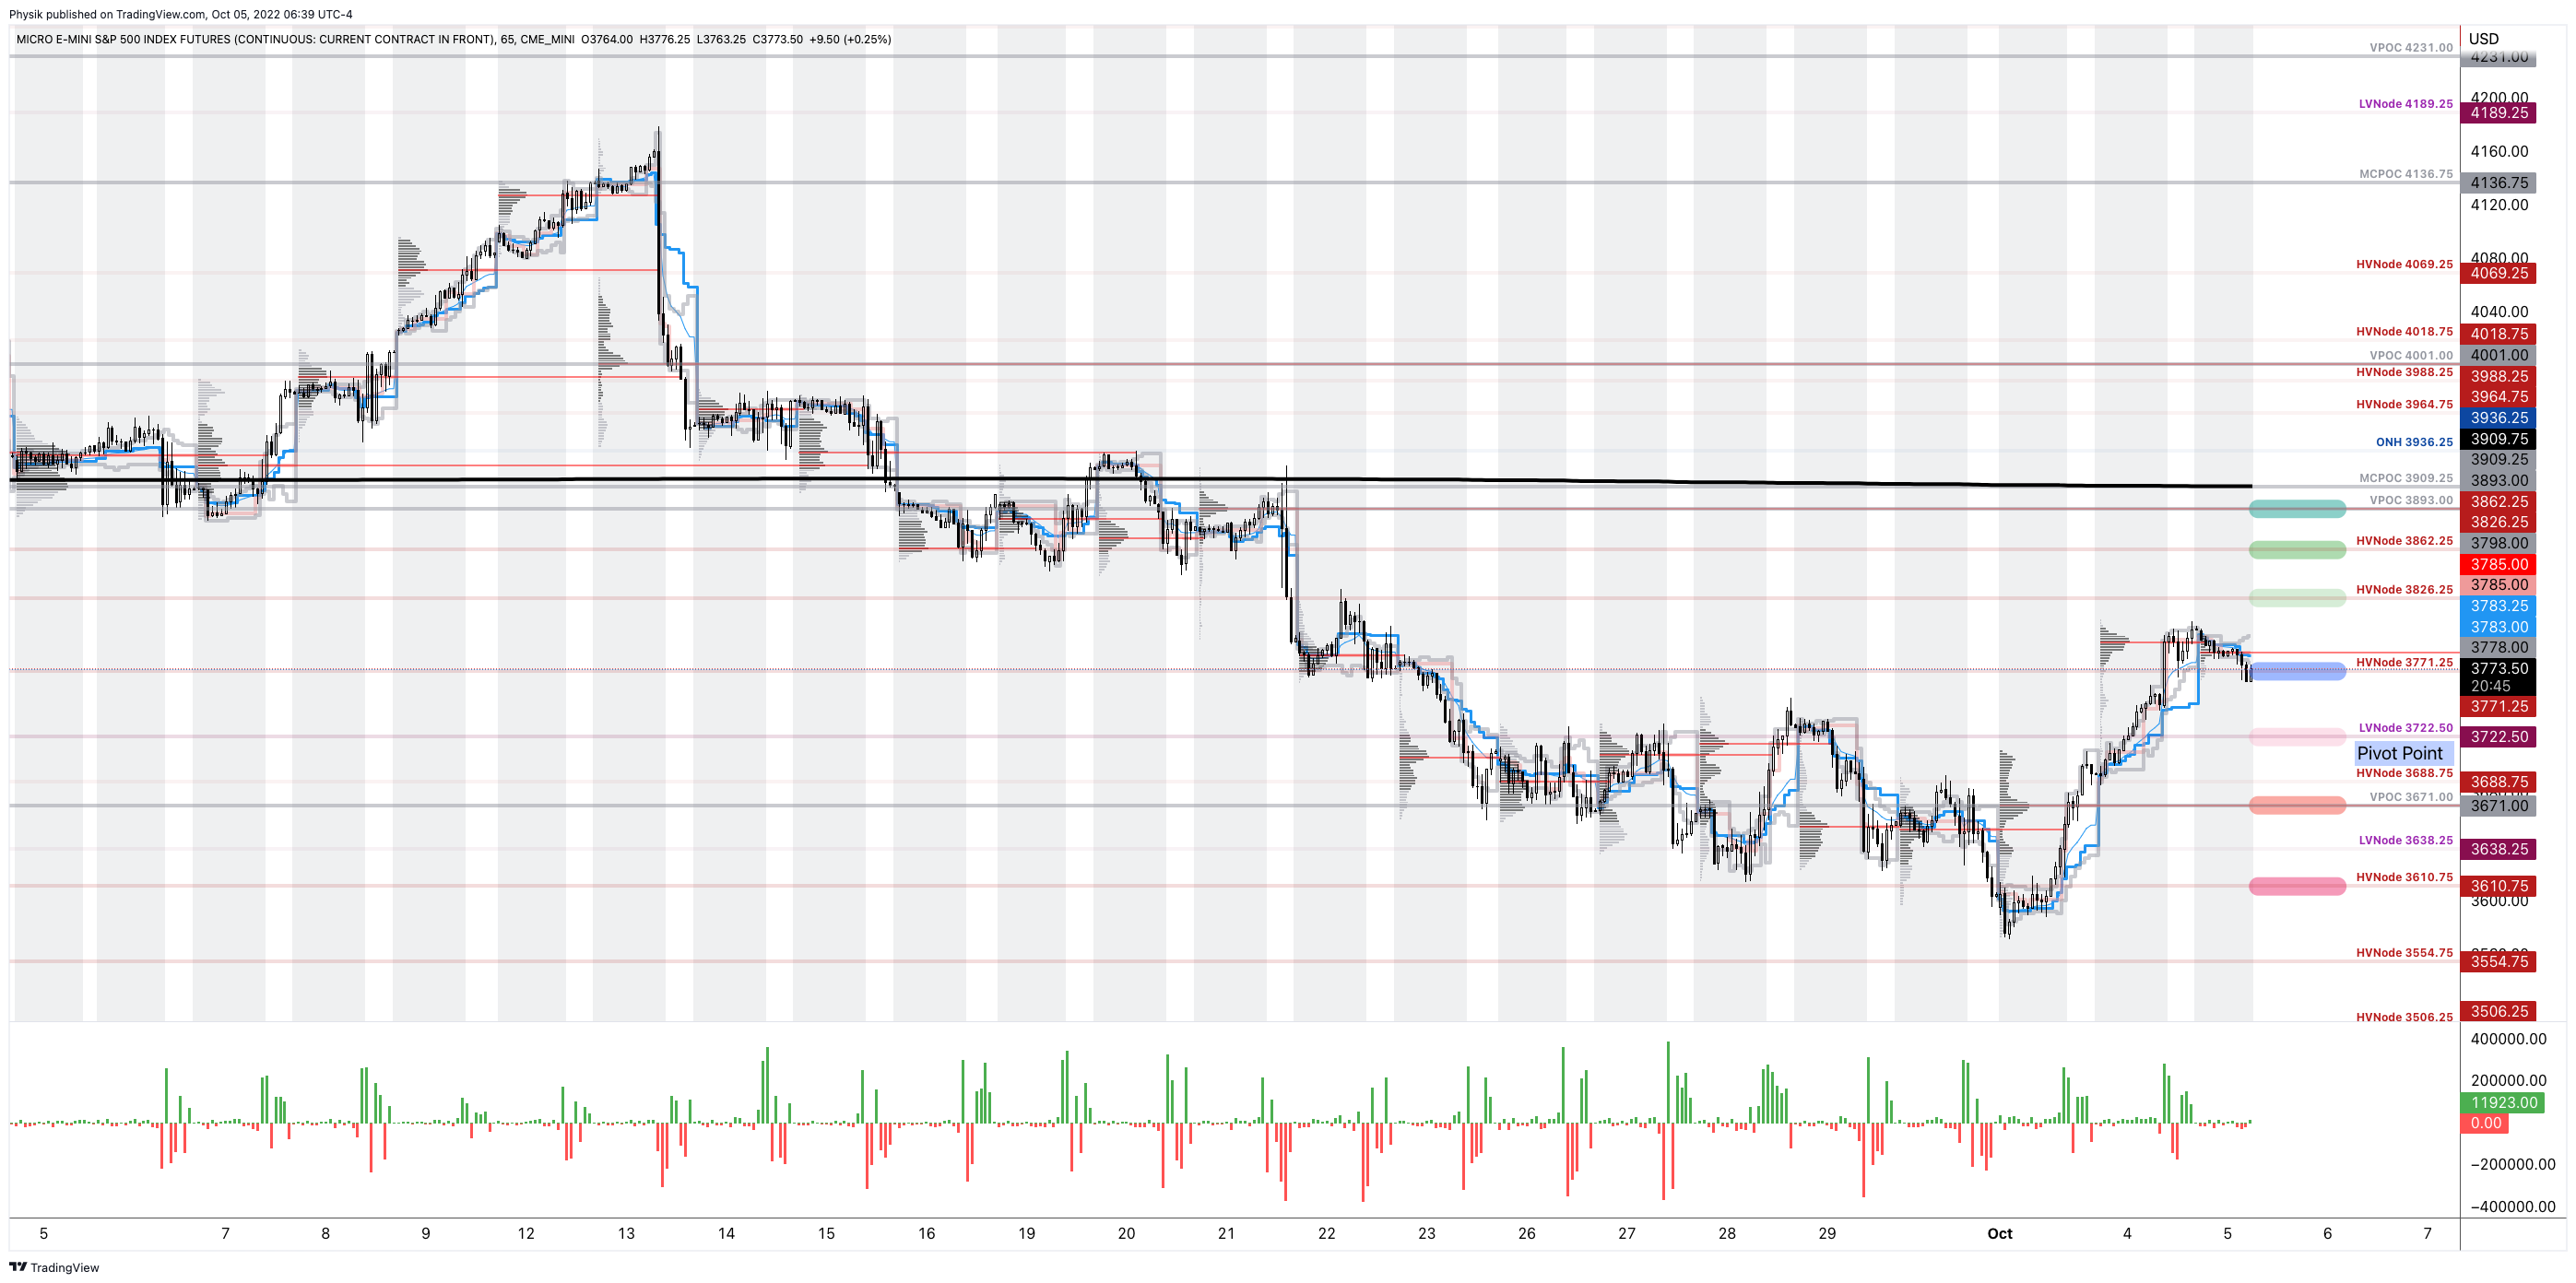
Graphic: 65-minute profile chart of the Micro E-mini S&P 500 Futures.

Definitions

Volume Areas: A structurally sound market will build on areas of high volume (HVNodes). Should the market trend for long periods of time, it will lack sound structure, identified as low volume areas (LVNodes). LVNodes denote directional conviction and ought to offer support on any test. 

If participants were to auction and find acceptance into areas of prior low volume (LVNodes), then future discovery ought to be volatile and quick as participants look to HVNodes for favorable entry or exit.

POCs: POCs are valuable as they denote areas where two-sided trade was most prevalent in a prior day session. Participants will respond to future tests of value as they offer favorable entry and exit.

About

After years of self-education, strategy development, mentorship, and trial-and-error, Renato Leonard Capelj began trading full-time and founded Physik Invest to detail his methods, research, and performance in the markets.

Capelj also develops insights around impactful options market dynamics at SpotGamma and is a Benzinga reporter.

Some of his works include conversations with ARK Invest’s Catherine Wood, investors Kevin O’Leary and John Chambers, FTX’s Sam Bankman-Fried, ex-Bridgewater Associate Andy Constan, Kai Volatility’s Cem Karsan, The Ambrus Group’s Kris Sidial, among many others.

Disclaimer

In no way should the materials herein be construed as advice. Derivatives carry a substantial risk of loss. All content is for informational purposes only.

Categories
Commentary

Daily Brief For October 4, 2022

The daily brief is a free glimpse into the prevailing fundamental and technical drivers of U.S. equity market products. Join the 990+ that read this report daily, below!

Graphic updated 9:20 AM ET. Sentiment Risk-On if expected /ES open is above the prior day’s range. /ES levels are derived from the profile graphic at the bottom of the following section. Levels may have changed since initially quoted; click here for the latest levels. SqueezeMetrics Dark Pool Index (DIX) and Gamma (GEX) calculations are based on where the prior day’s reading falls with respect to the MAX and MIN of all occurrences available. A higher DIX is bullish. At the same time, the lower the GEX, the more (expected) volatility. Learn the implications of volatility, direction, and moneyness. Breadth reflects a reading of the prior day’s NYSE Advance/Decline indicator. VIX reflects a current reading of the CBOE Volatility Index (INDEX: VIX) from 0-100.

Fundamental

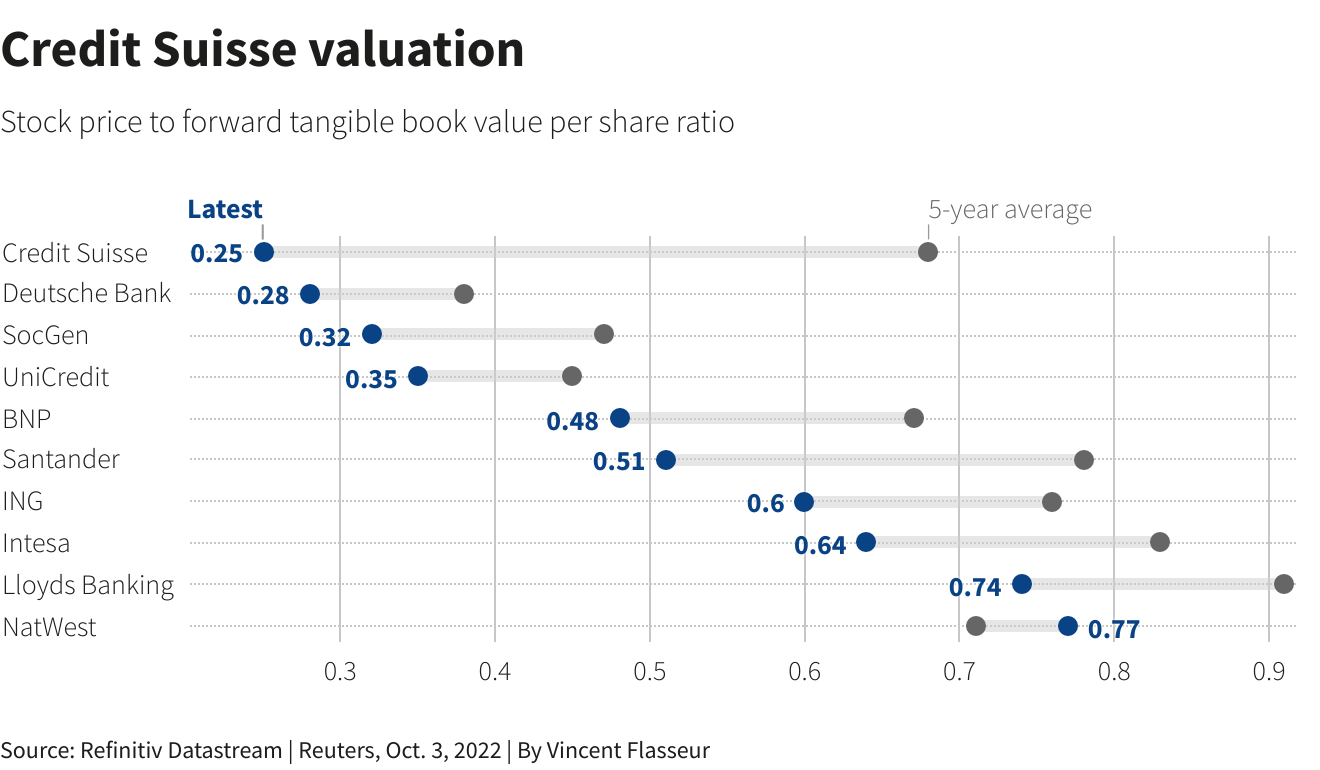
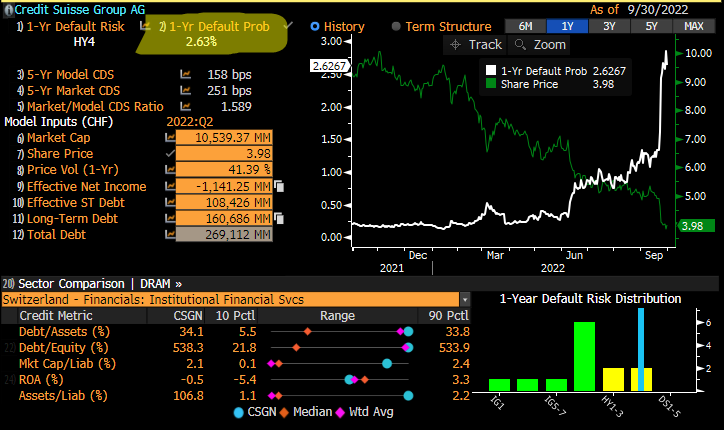
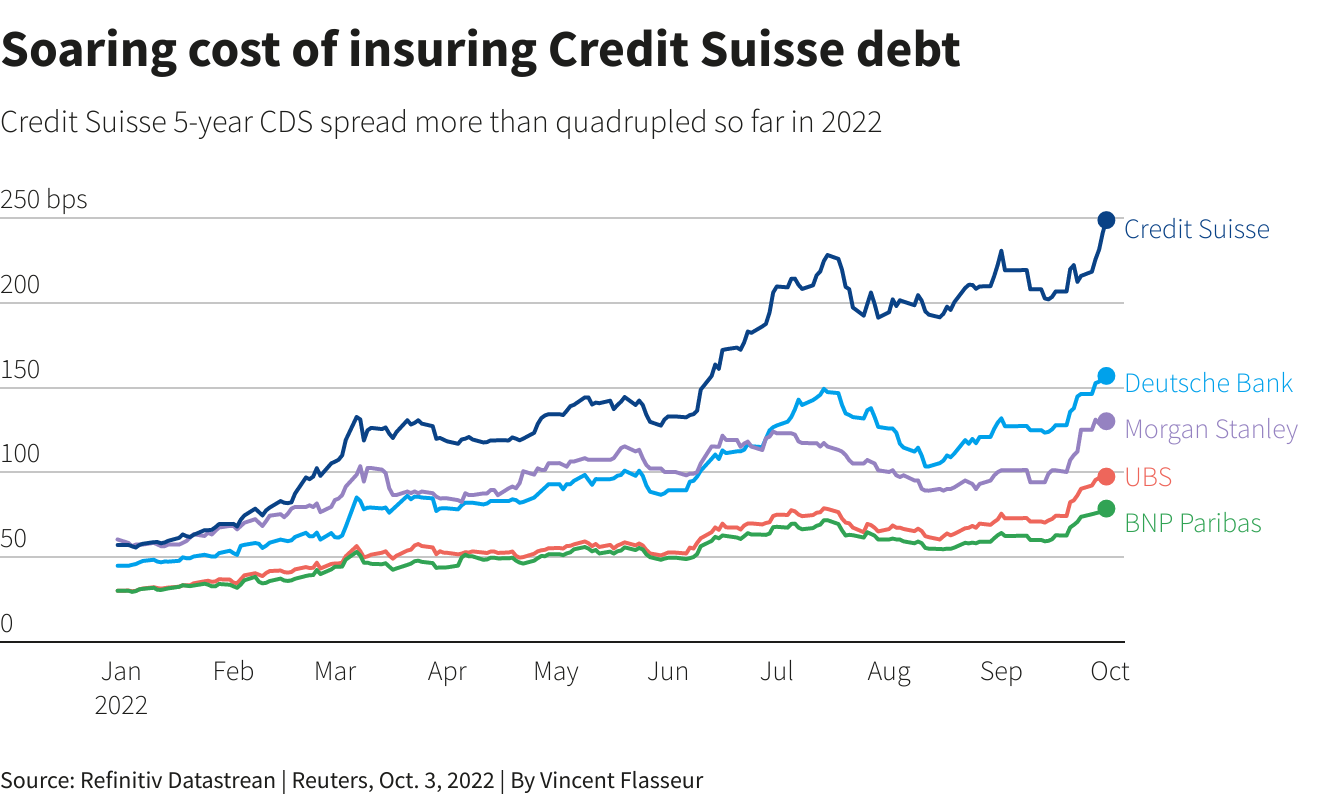
Fresh and top of mind, still, is the Credit Suisse Group AG (NYSE: CS) debacle. However, despite the bank’s “critical moment,” as discussed in yesterday’s letter, credit default swap (CDS) levels, though still rising, are “far from distressed.”

Graphic: Retrieved from Reuters.

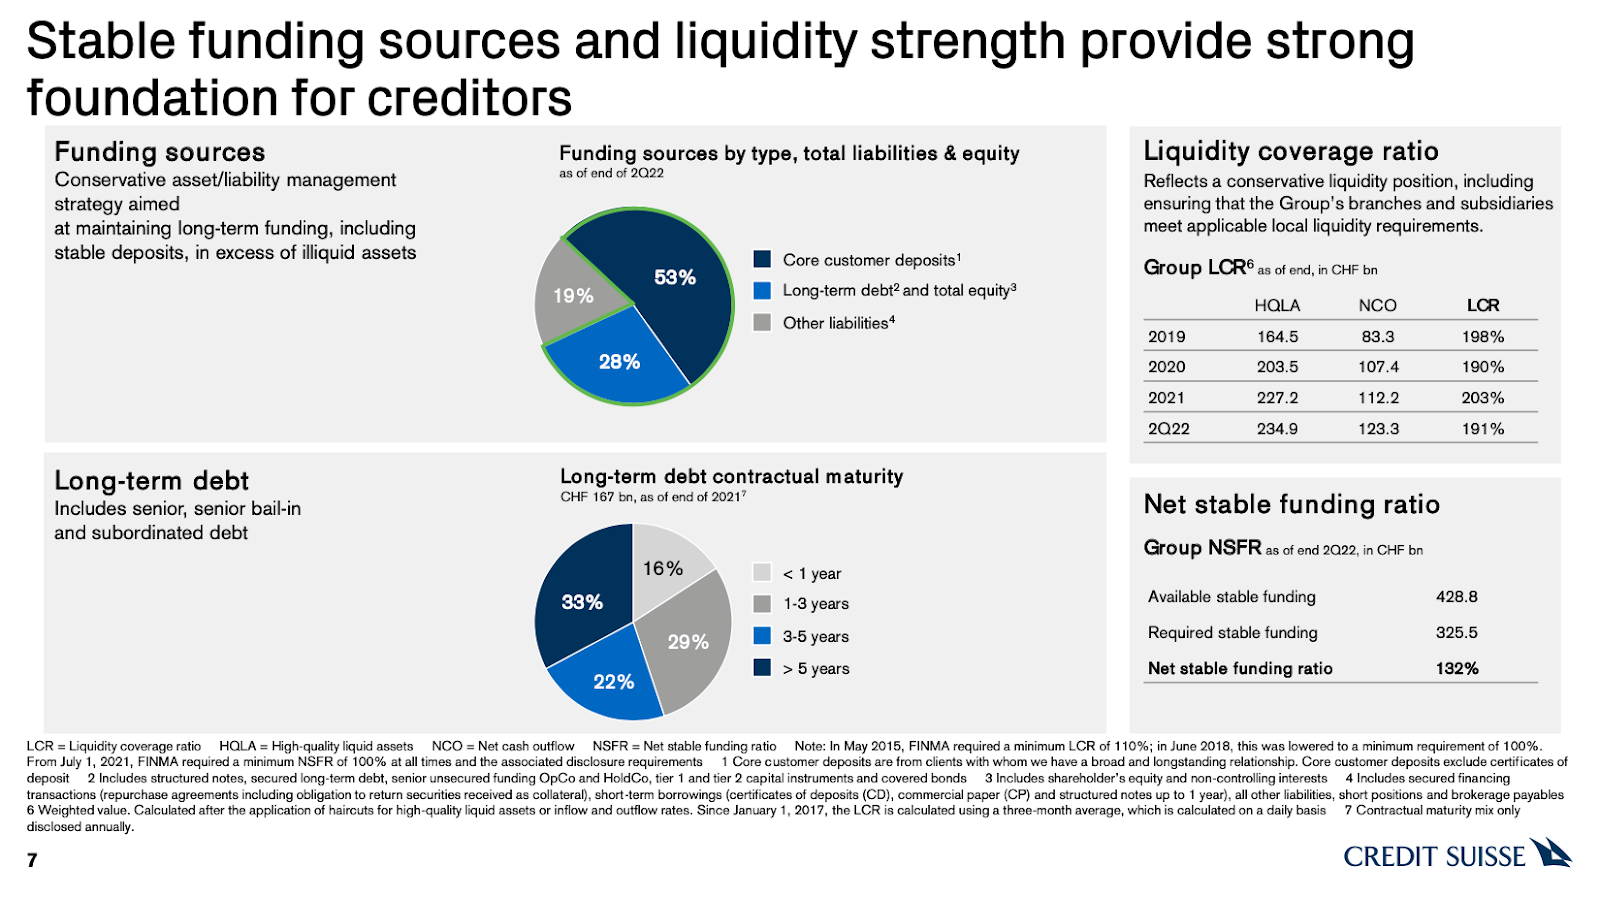
Adding, not reflected by the stock is a “strong capital base and liquidity position,” per CS.

Graphic: Retrieved from Credit Suisse Group AG (NYSE: CS).

A big topic speculated on was CS’ probability of default. At its core, CDS spreads relate to the probability of default in the following way, per Deutsche Bank AG (NYSE: DB) research

(CDS Spread) / (1 – Recovery Rate) = Implied Probability Of Default.

The recovery rate is basically the (estimated) amount of a loan that will be repaid in the case of a bankruptcy or default. Per European Central Bank research, “the standard recovery rate used by the industry in price calculations is 40%.”

Roughly speaking, below is a quick calculation:

250 basis points / (1 – 0.40) = 416.67 basis points = 4.17% Implied Probability Of Default

In CS’ case, if the spread is 250 basis points, assuming a 40% recovery, that’s a 4.17% default probability implied. If the spread was at 150 basis points, then, assuming a 40% recovery, that’s a 2.5% chance of default.

Graphic: Taken from @EffMktHype who retrieved from Bloomberg. “So many [Bloomberg] screenshots of CS CDS levels and talking about massive default prob numbers. Zero people actually using [the] same terminal to look at default risk screen.”

Taken together, in short, similar to as we put forth, yesterday, “[t]his is not 2008,” per Citigroup Inc’s (NYSE: C) Andrew Coombs. Bloomberg adds that Morgan Stanley (NYSE: MS) faced its own credit spread debacle during 2011 European debt exposure rumors; “it took months for the price of the default swaps to fall as the feared losses never materialized.”

Graphic: Retrieved from Reuters.

Ahead of an October 27 CS review covering topics including “a large-scale investment banking retreat, … [i]nvestors are worried about how much the bank will [have to] cover” a restructuring.

Bloomberg adds: “A sale of Credit Suisse’s structured-products group, which trades securitized debt, has attracted interest from potential buyers, … [amid] rising interest rates.”

Per UBS Group AG (NYSE: UBS) research, a sale of such businesses, which may be worth more than the market is currently implying, “could help to avoid a dilutive capital increase.”

Positioning

“Month-end portfolio rebalances and [the] expiration of quarterly option strategies [acted] in support of the market,” JPMorgan Chase & Co’s (NYSE: JPM) Marko Kolanovic stated in a September 30, 2022 commentary titled “Throwing rocks in glass houses.”

In that same commentary, Kolanovic eased support for his 2022 price targets on economic volatility led by central banks, the war in Europe, and beyond.

As stated last week, per Kai Volatility’s Cem Karsan, it’s the case that the removal of options strategies and potential supply of protection (as investors further come to the realization that options protection has done little to protect against downside) may provide markets a boost.

Graphic: Taken from @Alpha_Ex_LLC who retrieved from Bloomberg. S&P 500 (INDEX: SPX) October put option lower in price and volatility.

Ultimately, though, a final resolution would be “tied to the incremental effects on liquidity,” (e.g., QT manifesting itself as “$4.5 billion less in demand for assets per day,” and buyback blackout) while options repositioning may make the case for increased fragility, as traders’ falling demand for put protection opens the door to less supportive hedging flows with respect to time (Charm) and volatility (Vanna) changes.

Graphic: Retrieved from SqueezeMetrics.

Therefore, trades such as the Short Ratio Put Spread, particularly if narrower, may be far riskier to employ into the end of this year and the middle half of next year. For context, this was a trade to have on this year.

As participants continue to make the aforementioned realizations and supply to the market put (downside protection), tails may “continue to be cheap,” and discount “crash risk,” according to The Ambrus Group’s Kris Sidial.

A lot more to resolve this jumbled mess of a newsletter in the coming days.

Technical

As of 9:10 AM ET, Tuesday’s regular session (9:30 AM – 4:00 PM ET), in the S&P 500, is likely to open in the upper part of a positively skewed overnight inventory, outside of prior-range and -value, suggesting a potential for immediate directional opportunity.

In the best case, the S&P 500 trades higher.

Any activity above the $3,771.25 HVNode puts into play the $3,826.25 HVNode. Initiative trade beyond the last-mentioned could reach as high as the $3,862.25 HVNode and $3,893.00 VPOC, or higher.

In the worst case, the S&P 500 trades lower.

Any activity below the $3,771.25 HVNode puts into play the $3,722.50 LVNode. Initiative trade beyond the LVNode could reach as low as the $3,671.00 VPOC and $3,610.75 HVNode, or lower.

Click here to load today’s key levels into the web-based TradingView charting platform. Note that all levels are derived using the 65-minute timeframe. New links are produced, daily.
Graphic: 65-minute profile chart of the Micro E-mini S&P 500 Futures.

Definitions

Volume Areas: A structurally sound market will build on areas of high volume (HVNodes). Should the market trend for long periods of time, it will lack sound structure, identified as low volume areas (LVNodes). LVNodes denote directional conviction and ought to offer support on any test. 

If participants were to auction and find acceptance into areas of prior low volume (LVNodes), then future discovery ought to be volatile and quick as participants look to HVNodes for favorable entry or exit.

POCs: POCs are valuable as they denote areas where two-sided trade was most prevalent in a prior day session. Participants will respond to future tests of value as they offer favorable entry and exit.

Vanna: The rate at which the delta of an option changes with respect to volatility.

Charm: The rate at which the delta of an option changes with respect to time.

About

After years of self-education, strategy development, mentorship, and trial-and-error, Renato Leonard Capelj began trading full-time and founded Physik Invest to detail his methods, research, and performance in the markets.

Capelj also develops insights around impactful options market dynamics at SpotGamma and is a Benzinga reporter.

Some of his works include conversations with ARK Invest’s Catherine Wood, investors Kevin O’Leary and John Chambers, FTX’s Sam Bankman-Fried, ex-Bridgewater Associate Andy Constan, Kai Volatility’s Cem Karsan, The Ambrus Group’s Kris Sidial, among many others.

Disclaimer

In no way should the materials herein be construed as advice. Derivatives carry a substantial risk of loss. All content is for informational purposes only.

Categories
Commentary

Daily Brief For September 21, 2022

The daily brief is a free glimpse into the prevailing fundamental and technical drivers of U.S. equity market products. Join the 900+ that read this report daily, below!

Graphic updated 7:00 AM ET. Sentiment Neutral if expected /ES open is inside of the prior day’s range. /ES levels are derived from the profile graphic at the bottom of the following section. Levels may have changed since initially quoted; click here for the latest levels. SqueezeMetrics Dark Pool Index (DIX) and Gamma (GEX) calculations are based on where the prior day’s reading falls with respect to the MAX and MIN of all occurrences available. A higher DIX is bullish. At the same time, the lower the GEX, the more (expected) volatility. Learn the implications of volatility, direction, and moneyness. Breadth reflects a reading of the prior day’s NYSE Advance/Decline indicator. VIX reflects a current reading of the CBOE Volatility Index (INDEX: VIX) from 0-100.

Administrative

Short and to the point, today, after yesterday’s detailed letter on inflation, monetary policy action, and beyond. Good luck, everyone!

Fundamental

Ongoing is a “messy divorce” between large powers. We have talked about this in the past.

In the news was Putin’s mobilization of troops and renewed warning of a nuclear threat. This is a day after Biden said the US would defend Taiwan against China. In response, Mao Ning, the Chinese foreign ministry spokesperson, said this:

“The US remarks seriously violate the one-China principle … and send a severely wrong signal to the separatist forces of Taiwan independence. China strongly deplores and rejects it and has made solemn complaints with the US side.”

“We will do our utmost to strive for the prospect of peaceful reunification with the utmost sincerity, while we will not tolerate any activities aimed at splitting China and reserve the option to take all necessary measures.”

The aforementioned do more to shift “the pillars of the low inflation world” – de-globalization and populism – which the Federal Reserve (Fed) has a limited toolkit to solve for.

Pending is a large “L”-shaped recession to slow inflation, generate negative wealth effects, lower demand, and position for a recovery that will likely be “fiscally funded industrial policy.”

Shifting to today, the Federal Reserve is to step up its efforts to tame inflation by raising interest rates to the highest level since 2008. The consensus calls for up to a 75 basis point rate hike. 

Bloomberg economist Anna Wong, Andrew Husby, and Eliza Winger put forth:

“Powell will emphasize the committee’s determination to hold rates higher for longer. He will be more forthcoming in acknowledging the likely pain involved in bringing down inflation. He may opt not to say that the committee plans to downshift the pace of rate hikes.”

Positioning

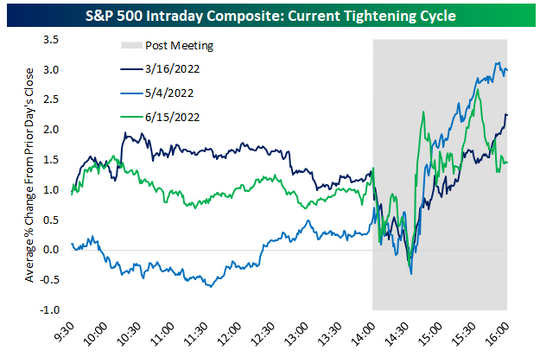
Yesterday, we briefly talked about post-event moves which are often positive and driven by the structural “rebalancing of dealer inventory,” per Kai Volatility’s Cem Karsan.

“In the past four Fed Days, the benchmark index has climbed an average of roughly 1.4% on all days, with more than 2% gains on three of the four,” said Bloomberg’s John Authers. Adding, “the S&P 500 has averaged a gain of more than 1% on Fed Days over the last 10 meetings.”

Graphic: Retrieved from Bloomberg. Via the Bespoke Investment Group.

Basically, into the event, traders have demanded protection and bid implied volatility (IVOL).

Graphic: Retrieved from SpotGamma. 

Should fears be assuaged, the supply of that protection should decrease IVOL, this is what may provide markets a boost.

Graphic: Retrieved from SqueezeMetrics.

From thereon, the “second move and final resolution, if you wait for it, is usually tied to the incremental effects on liquidity (QE/QT).”

In the case of the latter, per The Ambrus Group’s Kris Sidial, “[o]utright tails in single stocks continue to be ‘cheap’ relative to what you are seeing in the broad market.”

“Market is discounting any sort of crash risk. Which seems reasonable granted that a lot of the current macro theme is geared towards a longer-term effect.”

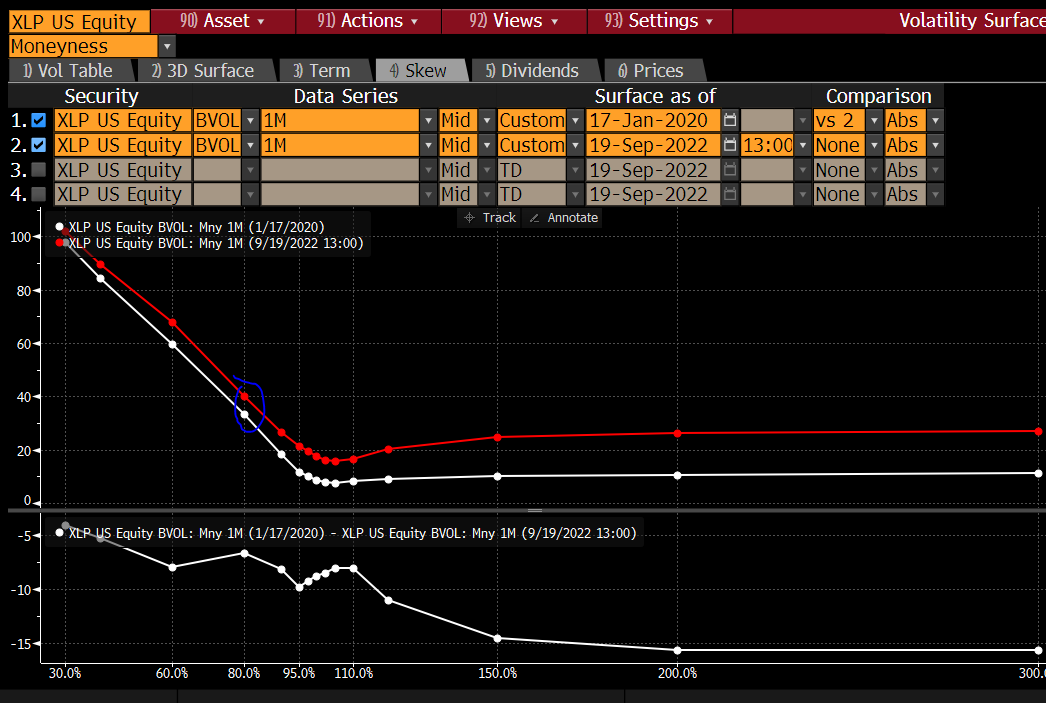
Graphic: Retrieved from Bloomberg. Taken from Kris Sidial. “January 2022 was a time that was associated with really low vol (VIX = ~12). Consumer Staples Select Sector SPDR Fund (NYSE: XLP) 1M 80MNY tails today are only 4 vols over where they were during that time.”

Technical

As of 7:00 AM ET, Wednesday’s regular session (9:30 AM – 4:00 PM ET), in the S&P 500, is likely to open in the upper part of a negatively skewed overnight inventory, inside of prior-range and -value, suggesting a limited potential for immediate directional opportunity.

In the best case, the S&P 500 trades higher.

Any activity above the $3,909.25 MCPOC puts into play the $3,936.25 ONH. Initiative trade beyond the ONH could reach as high as the $3,965.25 HVNode and $4,001.00 VPOC, or higher.

In the worst case, the S&P 500 trades lower.

Any activity below the $3,909.25 MCPOC puts into play the $3,857.25 HVNode. Initiative trade beyond the latter could reach as low as the $3,826.25 and $3,770.75 HVNode, or lower.

Click here to load today’s key levels into the web-based TradingView charting platform. Note that all levels are derived using the 65-minute timeframe. New links are produced, daily.
Graphic: 65-minute profile chart of the Micro E-mini S&P 500 Futures.

Definitions

Volume Areas: A structurally sound market will build on areas of high volume (HVNodes). Should the market trend for long periods of time, it will lack sound structure, identified as low volume areas (LVNodes). LVNodes denote directional conviction and ought to offer support on any test. 

If participants were to auction and find acceptance into areas of prior low volume (LVNodes), then future discovery ought to be volatile and quick as participants look to HVNodes for favorable entry or exit.

POCs: POCs are valuable as they denote areas where two-sided trade was most prevalent in a prior day session. Participants will respond to future tests of value as they offer favorable entry and exit.

MCPOCs: POCs are valuable as they denote areas where two-sided trade was most prevalent over numerous day sessions. Participants will respond to future tests of value as they offer favorable entry and exit.

About

After years of self-education, strategy development, mentorship, and trial-and-error, Renato Leonard Capelj began trading full-time and founded Physik Invest to detail his methods, research, and performance in the markets.

Capelj also develops insights around impactful options market dynamics at SpotGamma and is a Benzinga reporter.

Some of his works include conversations with ARK Invest’s Catherine Wood, investors Kevin O’Leary and John Chambers, FTX’s Sam Bankman-Fried, ex-Bridgewater Associate Andy Constan, Kai Volatility’s Cem Karsan, The Ambrus Group’s Kris Sidial, among many others.

Disclaimer

In no way should the materials herein be construed as advice. Derivatives carry a substantial risk of loss. All content is for informational purposes only.

Categories
Commentary

Daily Brief For August 12, 2022

The daily brief is a free glimpse into the prevailing fundamental and technical drivers of U.S. equity market products. Join the 750+ that read this report daily, below!

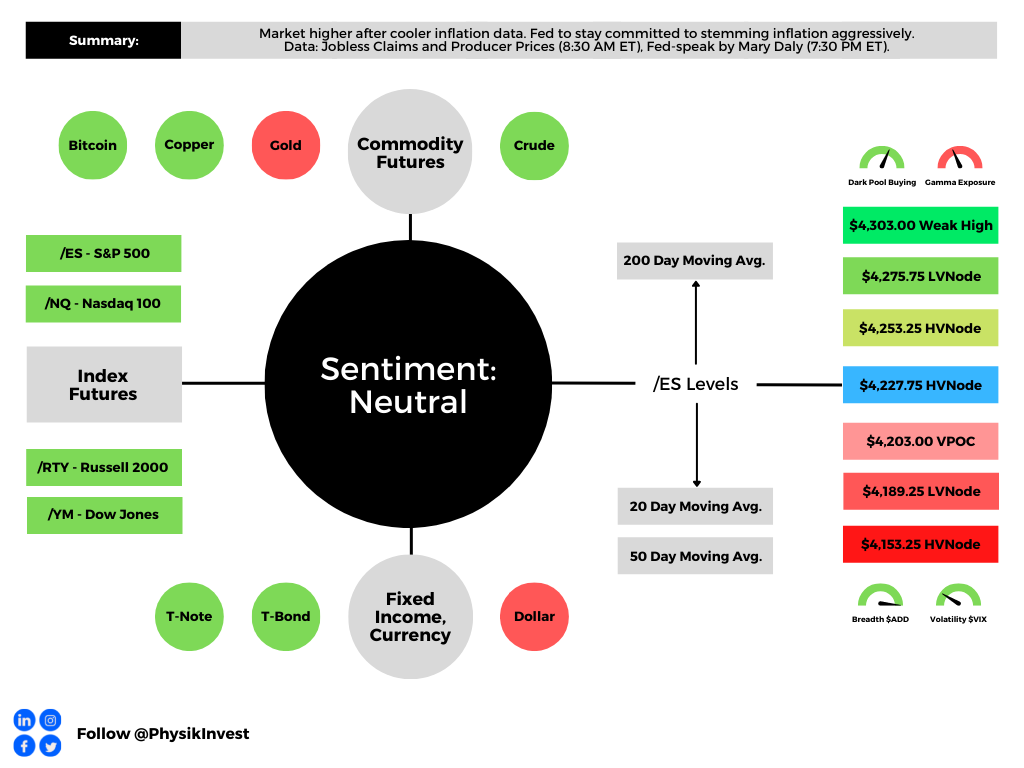
Graphic updated 7:00 AM ET. Sentiment Neutral if expected /ES open is inside of the prior day’s range. /ES levels are derived from the profile graphic at the bottom of the following section. Levels may have changed since initially quoted; click here for the latest levels. SqueezeMetrics Dark Pool Index (DIX) and Gamma (GEX) calculations are based on where the prior day’s reading falls with respect to the MAX and MIN of all occurrences available. A higher DIX is bullish. At the same time, the lower the GEX, the more (expected) volatility. Learn the implications of volatility, direction, and moneyness. Breadth reflects a reading of the prior day’s NYSE Advance/Decline indicator. VIX reflects a current reading of the CBOE Volatility Index (INDEX: VIX) from 0-100.

Fundamental

We’ll skip the fundamentals section, today, and do an in-depth review, sometime next week.

Positioning

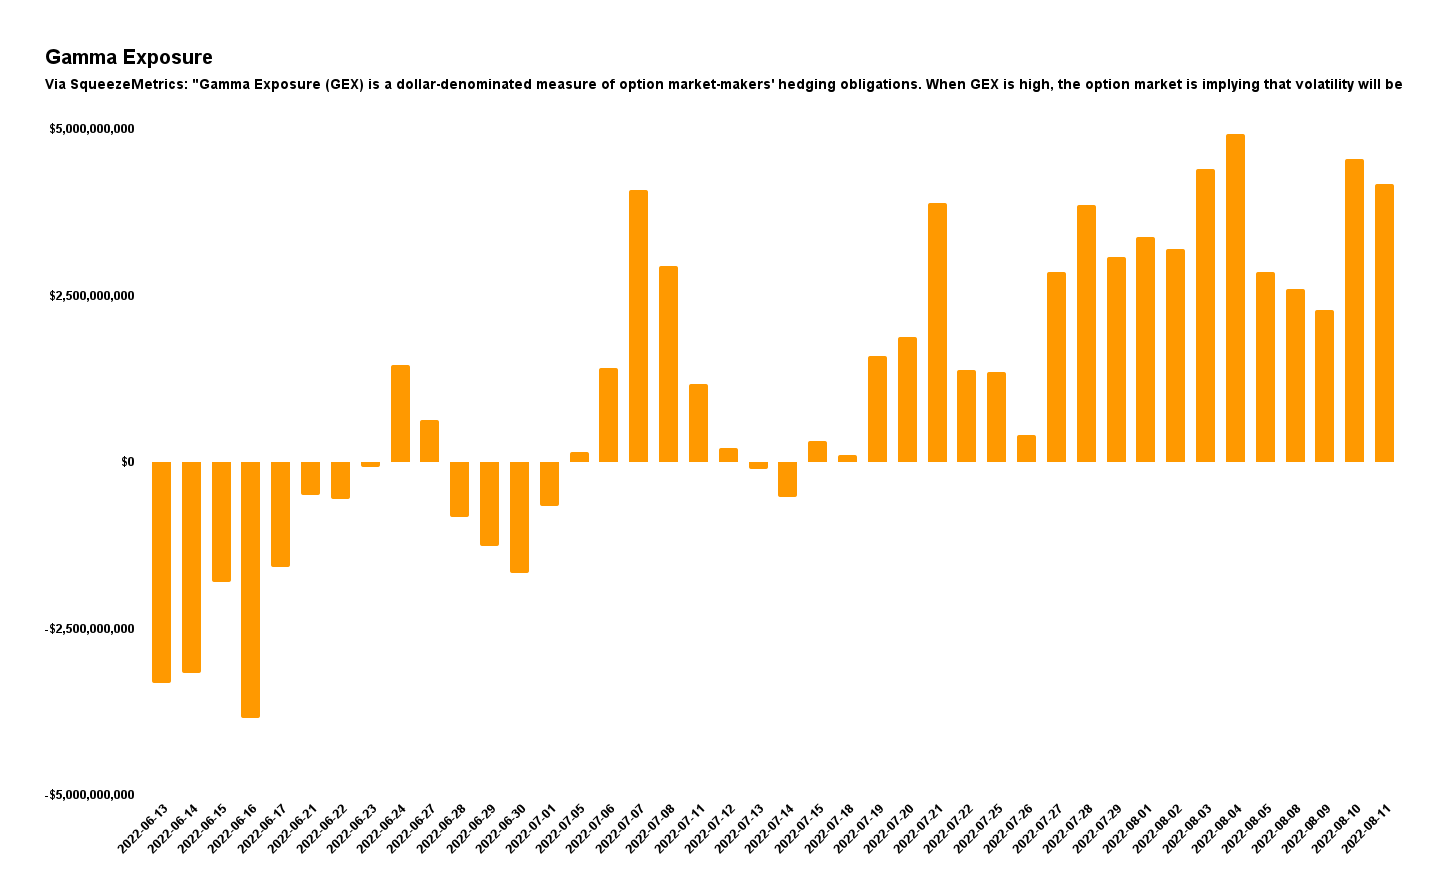
As of 7:00 AM ET, Friday’s expected volatility, via the Cboe Volatility Index (INDEX: VIX), sits at ~1.06%. Net gamma exposures generally rising may promote tighter trading ranges.

Graphic: Via Physik Invest. Data retrieved from SqueezeMetrics.

As stated yesterday, it may be beneficial for traders to shift their focus to dynamic structures. In other words, be a buyer of options structures (i.e., replace static directional exposures or Delta with those that are dynamic).

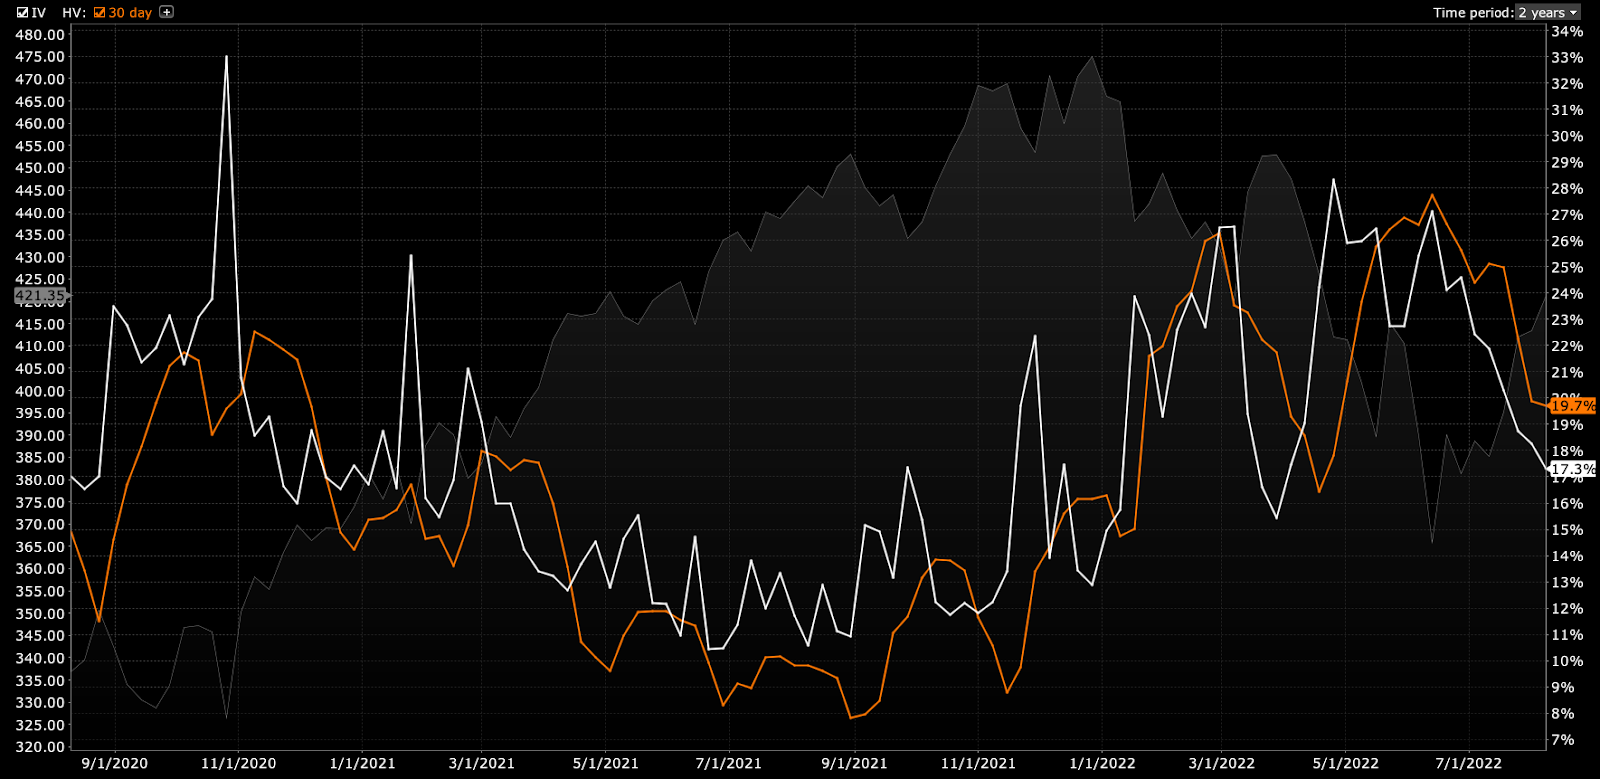
This is (1) due to where realized (RVOL) and implied (IVOL) volatility measures, and skew. 

Graphic: Retrieved from Interactive Brokers Group Inc’s (NASDAQ: IBKR) Trader Workstation.

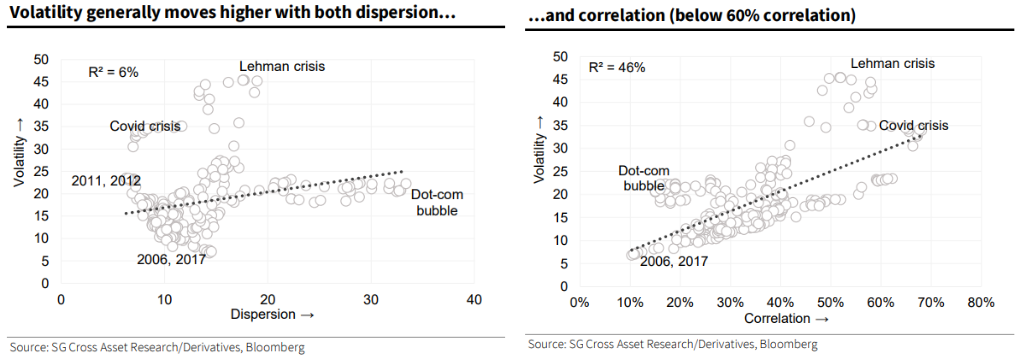
As well as (2) increased average stock correlation and lower return dispersion which, per Societe Generale SA (OTC: SCGLY) research, make stock picking hard(er).

It can be the case that Delta hedging becomes easier, too, as one asset, in a more correlated environment, can better offset the first-order sensitivities elsewhere.

Graphic: Retrieved from Bloomberg. Via Societe Generale.

The reason why? 

In regards to the correlation and dispersion remark, that’s more to do with the risk-off sentiment and the impact of tightening liquidity affecting all risk assets, basically.

Graphic: Via Physik Invest. Data compiled by @jkonopas623. Fed Balance Sheet data, here. Treasury General Account Data, here. Reverse Repo data, here. NL = BS – TGA – RRP.

Regarding the volatility issue (RVOL, IVOL, and skew), that’s more to do with hedging trends. 

Essentially, the monetization and counterparty hedging of existing customer hedges, as well as the sale of short-dated volatility, particularly in some of the single names where there was “rich” volatility, into the fall, lent to lackluster performance in IVOL and index mean reversion.

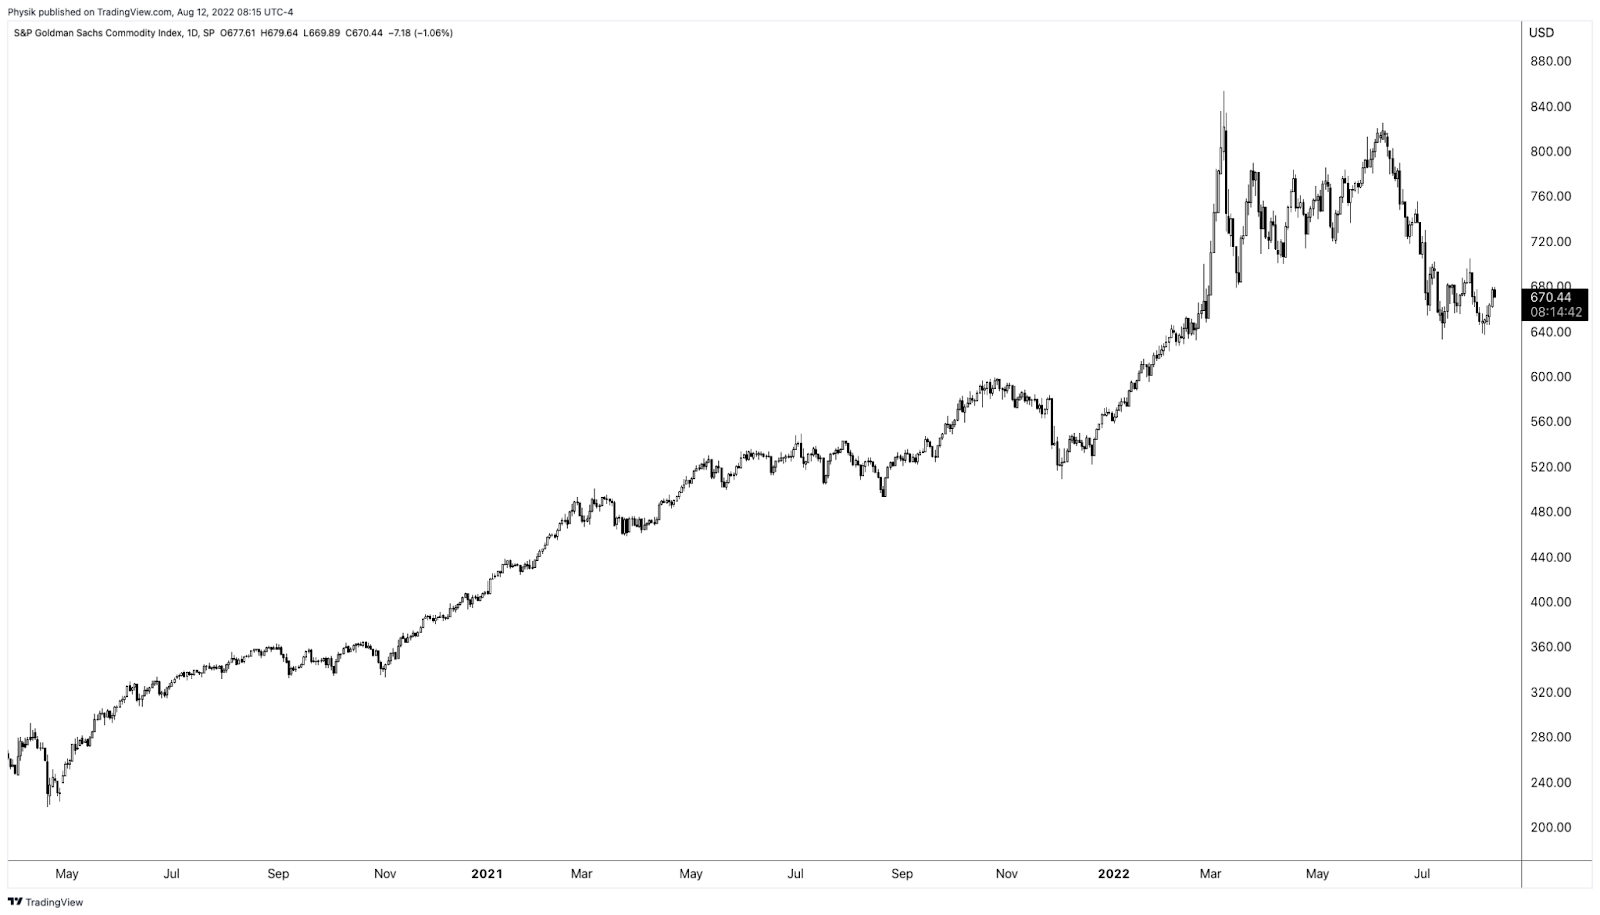
Accordingly, “if commodities are not performing … as a hedge, that opens the door,” to markets falling and traders demand equity volatility hedges, per The Ambrus Group’s Kris Sidial.

Learn about options dealer flows, inflation, and investing in a changing world with Cem Karsan.
Graphic: Retrieved by Physik Invest from TradingView. S&P Goldman Sachs Commodity Index.

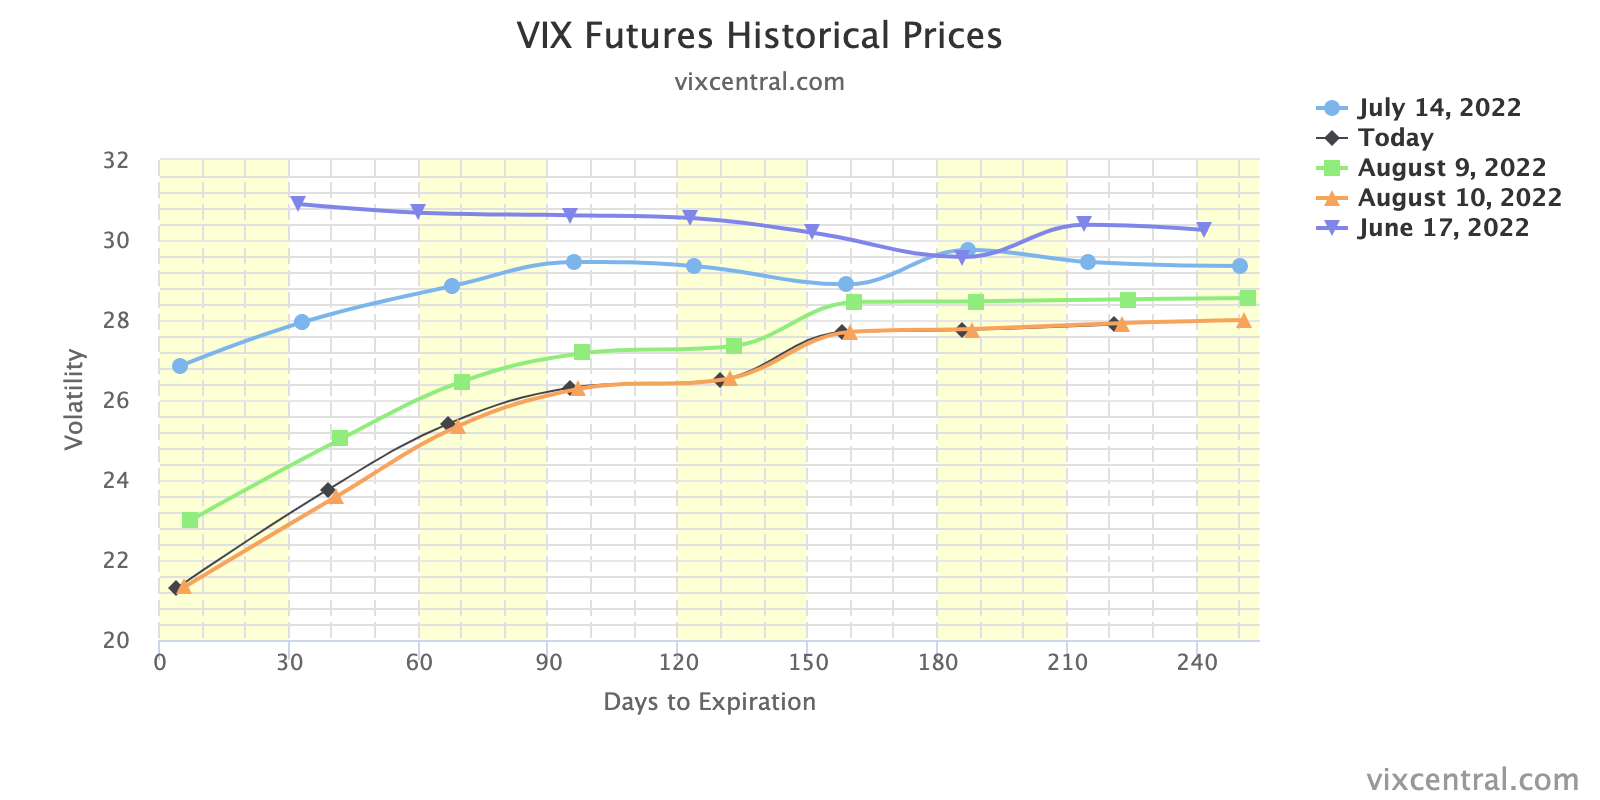
Adding, per to SpotGamma, “a lot of the boost from volatility compression has played out. With IVOL at a lower bound, it may be opportune to replace static Delta bets for those that are dynamic (i.e., long option exposures) and have less to lose in this lower volatility environment.”

Graphic: Retrieved from Vix Central. The term structure of IVOL.

“In a case where market participants see the Fed keeping its commitment to aggressive monetary policy action, negative Delta options exposures may outperform static short equity (bets on the downside).”

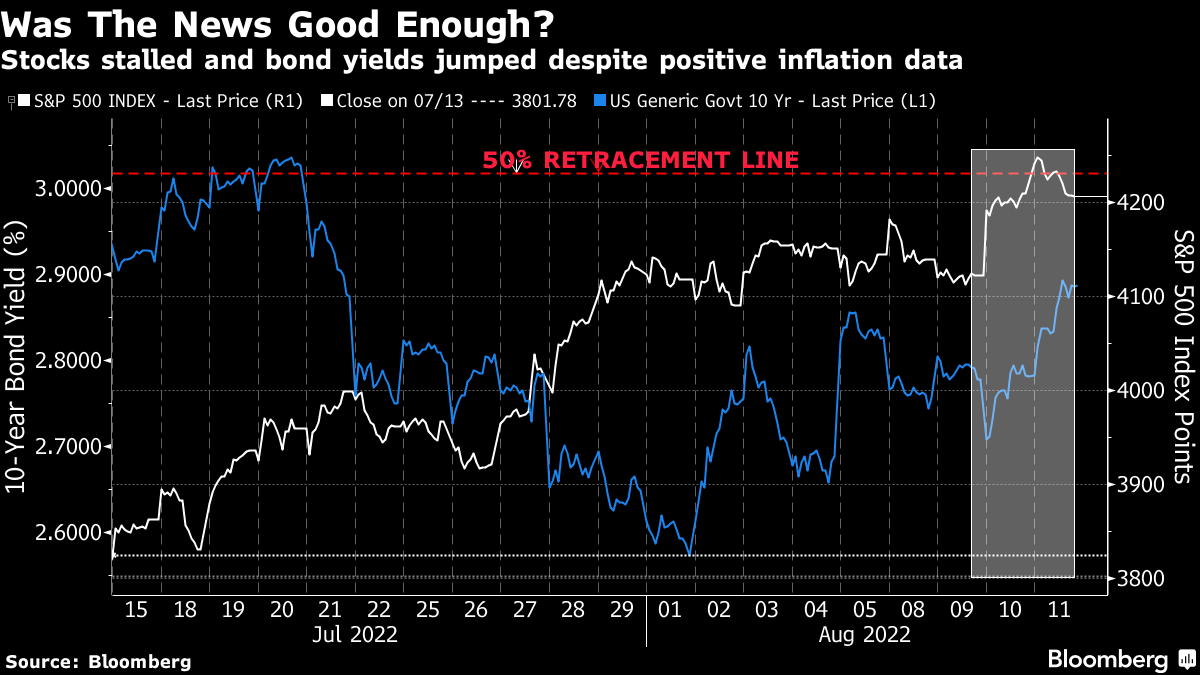
Graphic: Retrieved from Bloomberg. “Thursday’s message was that on mature reflection, the progress on the economy didn’t justify taking the stock market any higher than it was at the start of the day.”

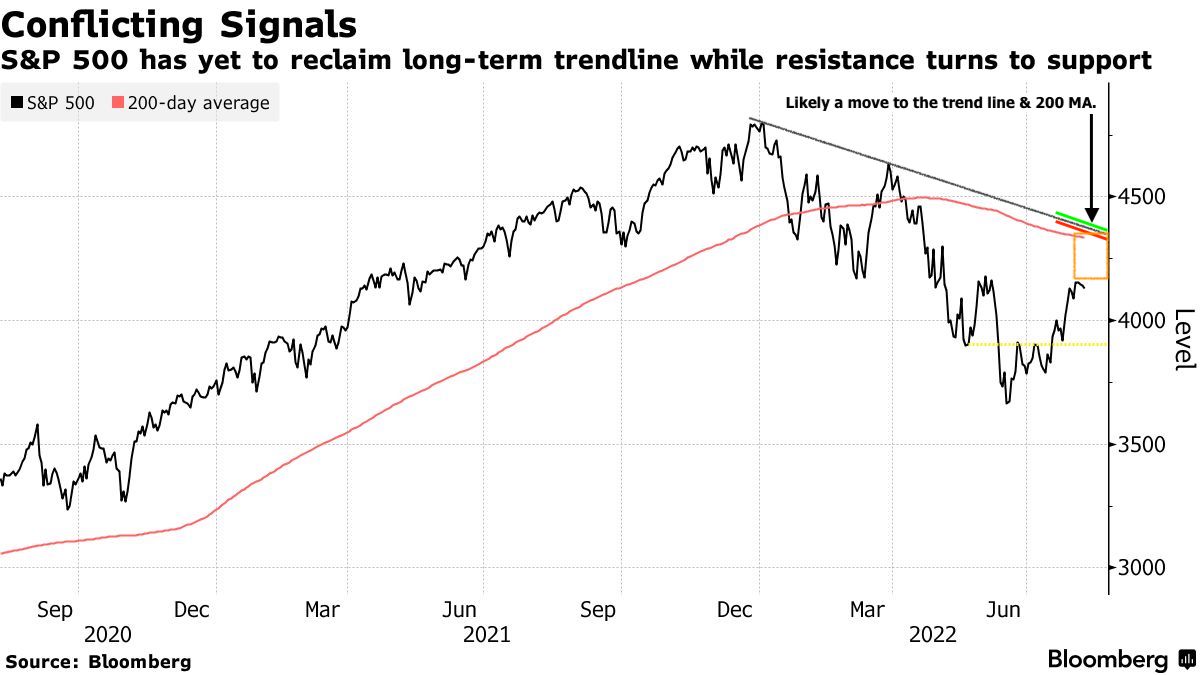
If bullish, sample structures to consider, given a smiley skew, include low- or zero-cost bullish call ratio spreads, against the trend resistances in products like the S&P 500 (INDEX: SPX).

Graphic: Retrieved from Bloomberg. Drawn on by Physik Invest.

Technical

As of 7:00 AM ET, Friday’s regular session (9:30 AM – 4:00 PM ET), in the S&P 500, is likely to open in the middle part of a nearly balanced overnight inventory, inside of prior-range and -value, suggesting a limited potential for immediate directional opportunity.

In the best case, the S&P 500 trades higher.

Any activity above the $4,227.75 HVNode puts into play the $4,253.25 HVNode. Initiative trade beyond the latter could reach as high as the $4,275.75 LVNode and $4,303.00 Weak High, or higher.

In the worst case, the S&P 500 trades lower.

Any activity below the $4,227.75 HVNode puts into play the $4,202.75 RTH Low. Initiative trade beyond the RTH Low could reach as low as the $4,189.25 LVNode and $4,153.25 HVNode, or lower.

Click here to load today’s key levels into the web-based TradingView charting platform. Note that all levels are derived using the 65-minute timeframe. New links are produced, daily.
Graphic: 65-minute profile chart of the Micro E-mini S&P 500 Futures.

Definitions

Volume Areas: A structurally sound market will build on areas of high volume (HVNodes). Should the market trend for long periods of time, it will lack sound structure, identified as low volume areas (LVNodes). LVNodes denote directional conviction and ought to offer support on any test. 

If participants were to auction and find acceptance into areas of prior low volume (LVNodes), then future discovery ought to be volatile and quick as participants look to HVNodes for favorable entry or exit.

POCs: POCs are valuable as they denote areas where two-sided trade was most prevalent in a prior day session. Participants will respond to future tests of value as they offer favorable entry and exit.

MCPOCs: POCs are valuable as they denote areas where two-sided trade was most prevalent over numerous day sessions. Participants will respond to future tests of value as they offer favorable entry and exit.

Volume-Weighted Average Prices (VWAPs): A metric highly regarded by chief investment officers, among other participants, for quality of trade. Additionally, liquidity algorithms are benchmarked and programmed to buy and sell around VWAPs.

About

After years of self-education, strategy development, mentorship, and trial-and-error, Renato Leonard Capelj began trading full-time and founded Physik Invest to detail his methods, research, and performance in the markets.

Capelj also develops insights around impactful options market dynamics at SpotGamma and is a Benzinga reporter.

Some of his works include conversations with ARK Invest’s Catherine Wood, investors Kevin O’Leary and John Chambers, FTX’s Sam Bankman-Fried, ex-Bridgewater Associate Andy Constan, Kai Volatility’s Cem Karsan, The Ambrus Group’s Kris Sidial, among many others.

Disclaimer

In no way should the materials herein be construed as advice. Derivatives carry a substantial risk of loss. All content is for informational purposes only.

Categories
Commentary

Daily Brief For August 11, 2022

The daily brief is a free glimpse into the prevailing fundamental and technical drivers of U.S. equity market products. Join the 750+ that read this report daily, below!

Graphic updated 7:30 AM ET. Sentiment Risk-On if expected /ES open is above the prior day’s range. /ES levels are derived from the profile graphic at the bottom of the following section. Levels may have changed since initially quoted; click here for the latest levels. SqueezeMetrics Dark Pool Index (DIX) and Gamma (GEX) calculations are based on where the prior day’s reading falls with respect to the MAX and MIN of all occurrences available. A higher DIX is bullish. At the same time, the lower the GEX, the more (expected) volatility. Learn the implications of volatility, direction, and moneyness. Breadth reflects a reading of the prior day’s NYSE Advance/Decline indicator. VIX reflects a current reading of the CBOE Volatility Index (INDEX: VIX) from 0-100.

Fundamental

Equity market rally spurred by cooler a Consumer Price Index (CPI).

Expected was an 8.7% rise year-over-year (YoY) and 0.2% month-over-month (MoM). Core CPI (which excludes food and energy) was to rise by 6.1% YoY and 0.5% MoM, respectively.

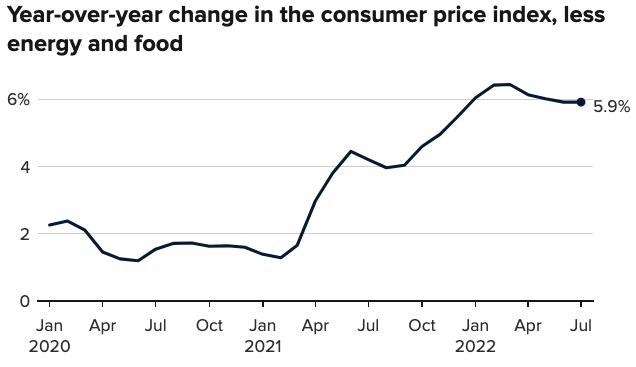
Officially, the headline number rose to 8.5%. The core CPI rose 5.9% YoY and 0.3% MoM, meaning the March peak remains (6.5% YoY, then).

Graphic: Retrieved from CNBC.

Participants responded positively to the number, as expected could happen in a case where the CPI printed lower.

As I talked about in yesterday’s morning letter and in a SpotGamma note, with easing inflation:

(1) investors may command a lower rate of return for their purchasing power and (2) lower rates (if policymakers were to become less aggressive) do less to negatively impact discounted cash flows and the ability to finance future growth.

It is the case that immediately after the release of the CPI, traders dramatically shifted their bets on monetary action.

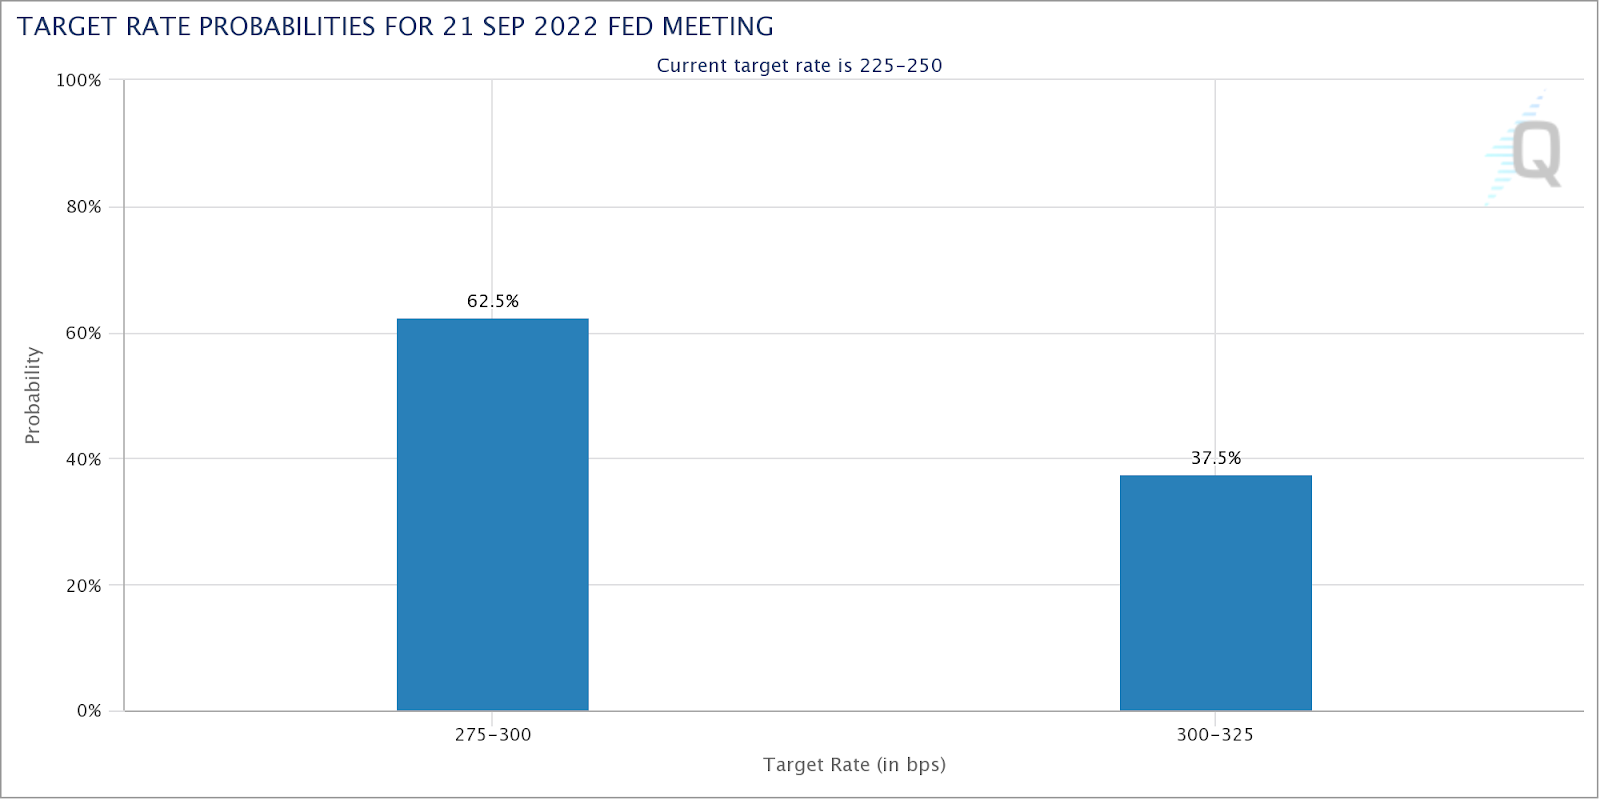
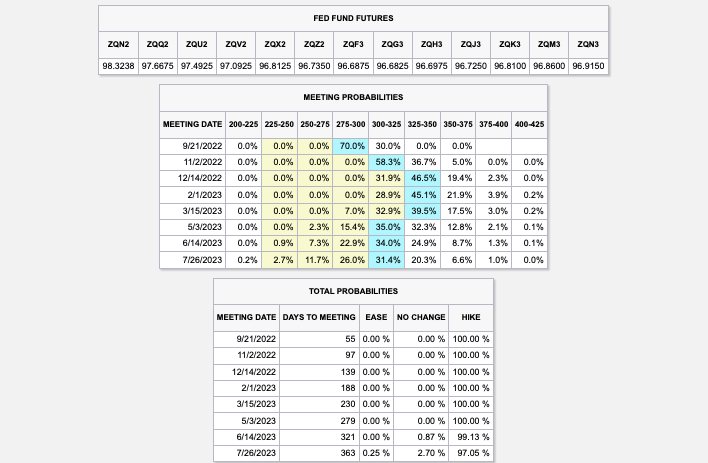
Previously, it was thought a 75 to 100 basis point hike would follow the report. Now, there are higher odds, as priced by the market, that there is a 25 to 50 basis point hike.

Graphic: Retrieved from CME Group Inc (NASDAQ: CME).

“I think the market is a bit overly giddy on this CPI number and it’s probably unlikely that the [Federal Reserve] (Fed) will start to ease up and take a less hawkish stance,” The Ambrus Group’s Kris Sidial put forth.

“The increase in risk assets somewhat gives the Fed the green light to be able to move more swiftly with a hawkish tone.”

Accordingly, the Fed’s Mary Daly said it is too early to declare victory in the inflation fight (and rightfully so), signaling, however, that she may support a slower pace of hikes.

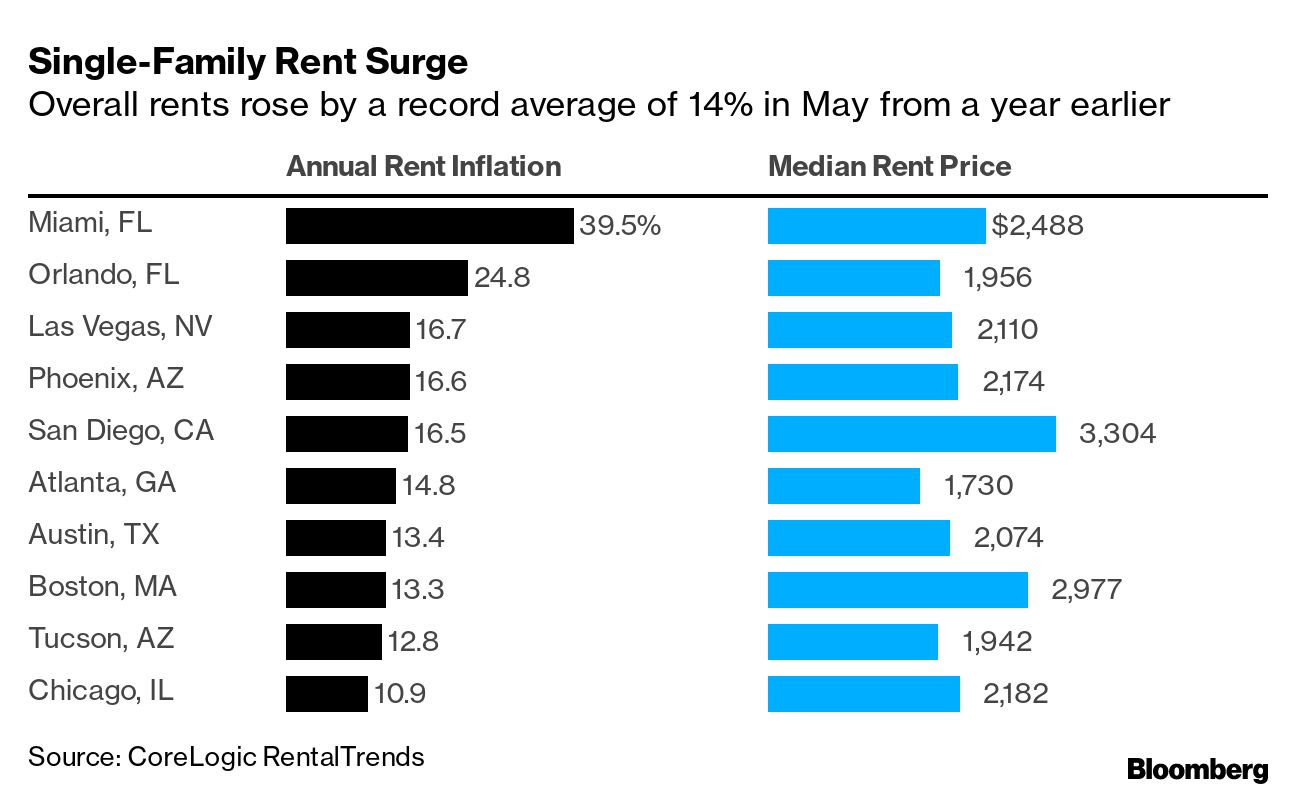
Graphic: Retrieved from Bloomberg.

This is as home buyers and renters, in some areas, are seeing large hikes in prices. For instance, per one Bloomberg article, a Miami native saw their rent increase “by $650 to $2,400.00 a month,” forcing them to search for new places to live.

The Ambrus Group’s Sidial adds:

“Inflation is one of those things that is difficult to control when it’s out [of] the bag (historically). I think the Fed understands this and if they have the opportunity to tame it, while not completely obliterating risk assets, it seems like a perfect scenario.”

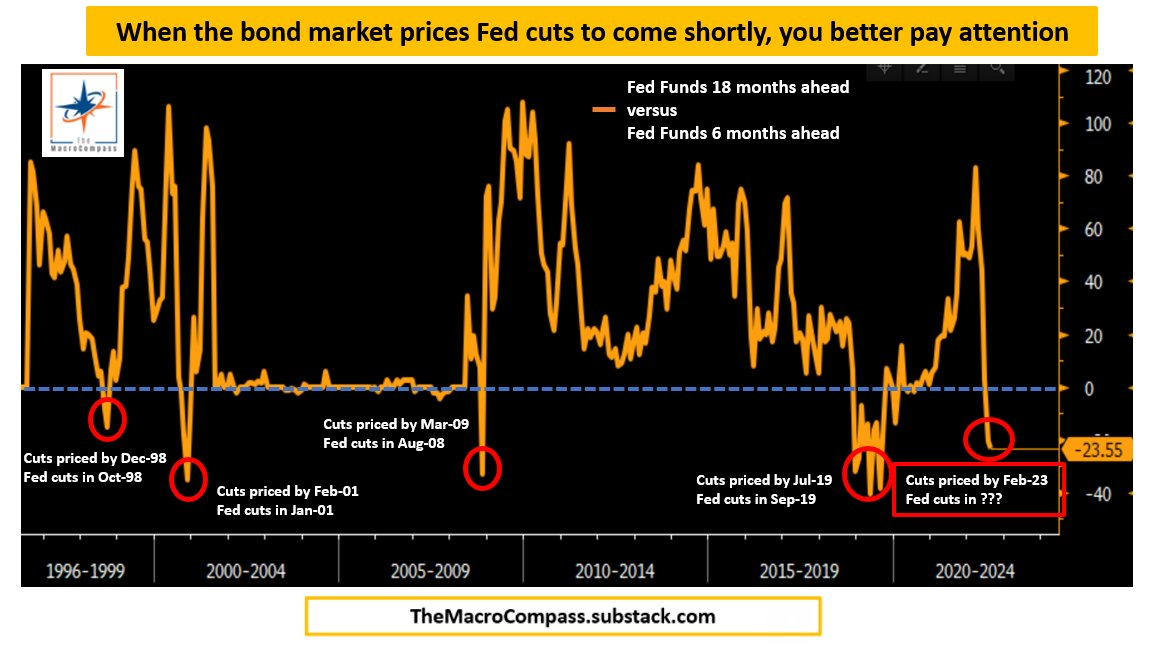
Ultimately, farther out in time, some metrics, which have incredible success in forecasting pivots, show the Fed likely to cut in 2023, shortly following the aggressive hiking cycle.

Graphic: Retrieved from Alfonso Peccatiello of The Macro Compass.

On the topic of (eventual) declines and slowing in the risk assets (like housing), “in most cases today, a borrower with 60 points of equity in their property, even facing moderate declines in their current home price, are not a big default risk,” explains Dan Ivascyn of PIMCO.

“A lot of what we like in the market today is seasoned-type risk that benefits from the multi-years of home price appreciation, and therefore is much less sensitive to what goes on from this point forward.”

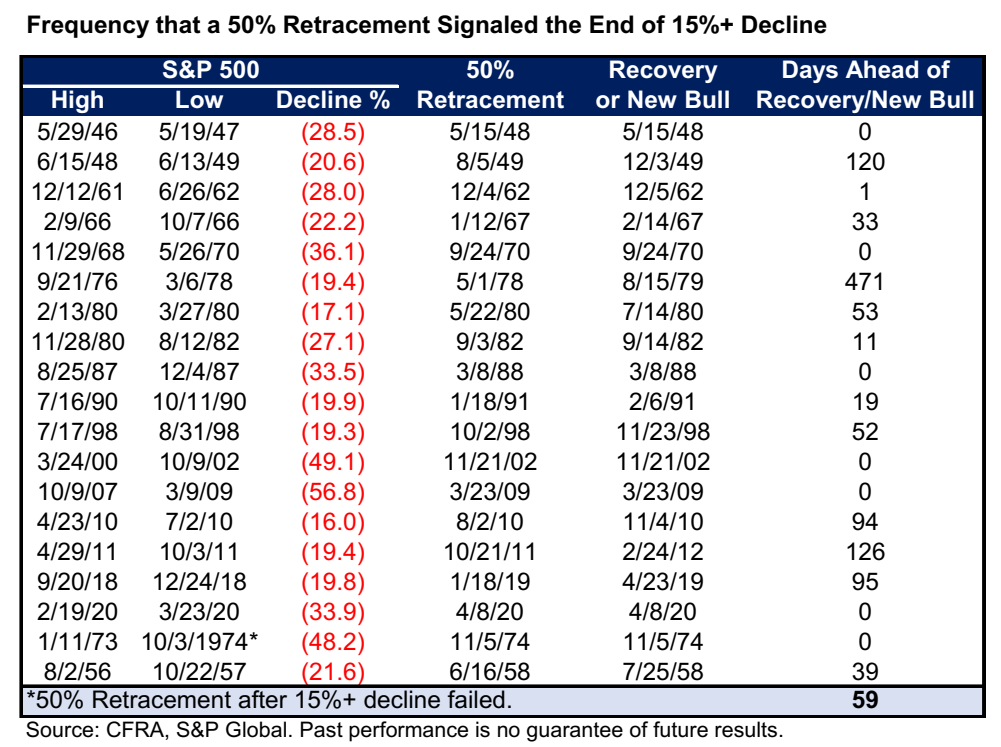
From an S&P 500 (INDEX: SPX) perspective, the index has basically recouped half its losses for the year. This often came after the bear lows were in.

Graphic: Retrieved from Bloomberg.

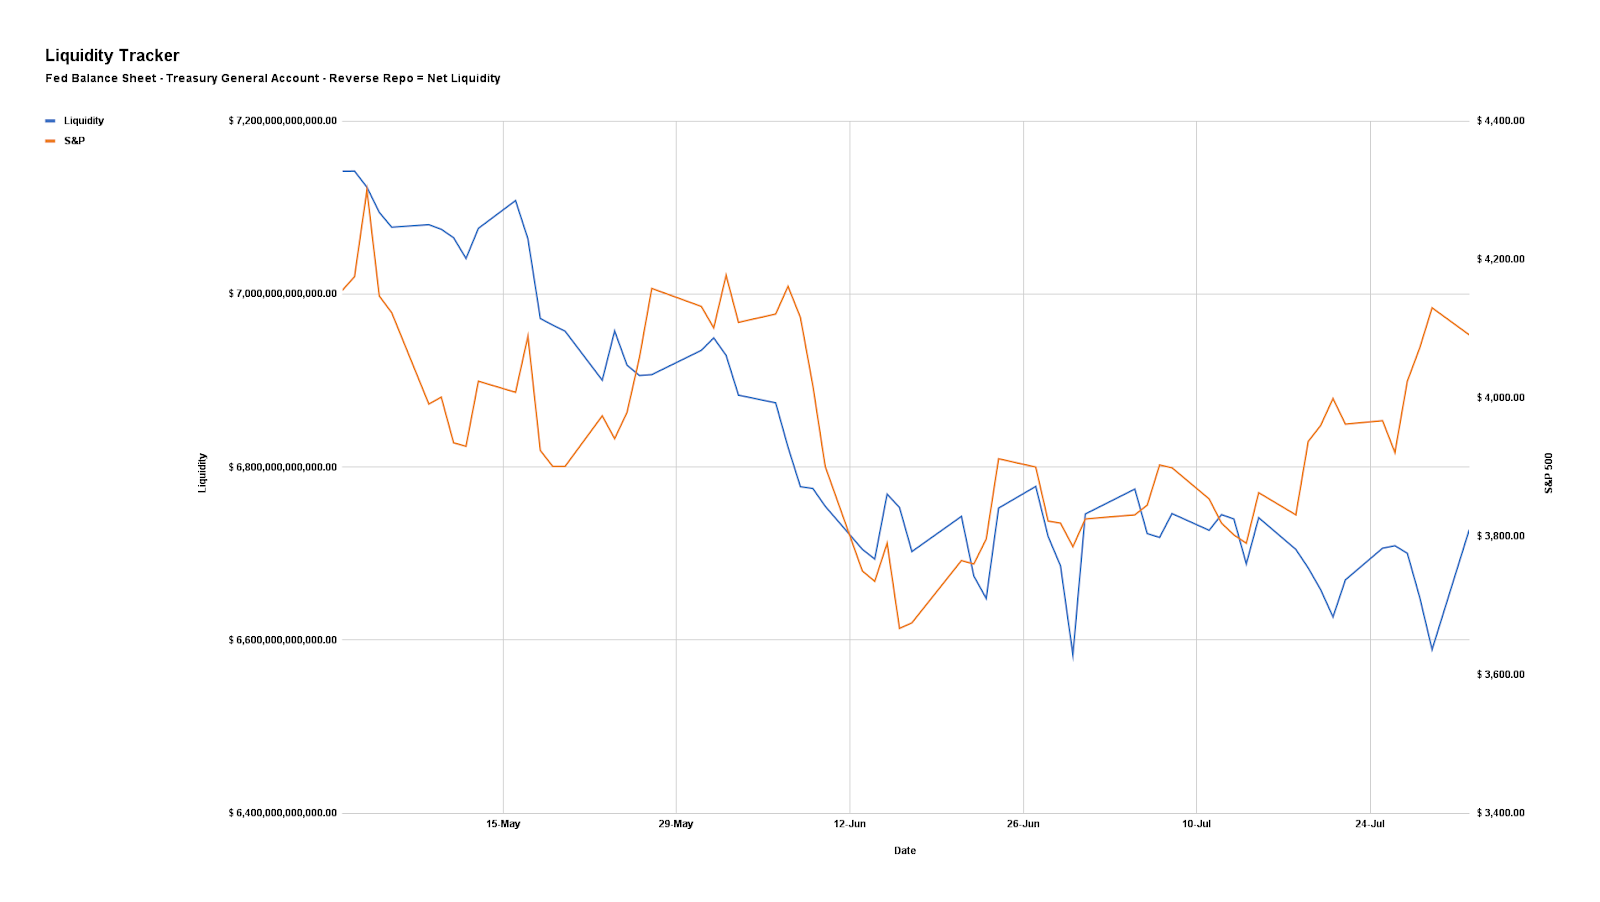
Notwithstanding, here’s our updated liquidity tracker that is monitoring the “preeminent driver of markets during the post-crisis decade.”

Graphic: Via Physik Invest. Data compiled by @jkonopas623. Fed Balance Sheet data, here. Treasury General Account Data, here. Reverse Repo data, here. NL = BS – TGA – RRP.

Positioning

As of 7:15 AM ET, Thursday’s expected volatility, via the Cboe Volatility Index (INDEX: VIX), sits at ~1.04%. Net gamma exposures increasing may promote tighter trading ranges.

Given where realized (RVOL) and implied (IVOL) volatility measures are, as well as skew, it is beneficial to be a buyer of options structures (i.e., replacing static directional exposures or delta with those that are dynamic) tied to the broader measures we follow like the S&P 500 (given increased average stock correlation and lower return dispersion).

The reason why? 

Per SpotGamma: “From an options perspective, a lot of the boost from volatility compression has played out. With implied volatility at a lower bound, it may be opportune to replace static delta bets for those that are dynamic (i.e., long option exposures) and have less to lose in this lower volatility environment.”

“In a case where market participants see the Fed keeping its commitment to aggressive monetary policy action, negative delta options exposures may outperform static short equity (bets on the downside).”

Technical

As of 7:30 AM ET, Thursday’s regular session (9:30 AM – 4:00 PM ET), in the S&P 500, is likely to open in the upper part of a positively skewed overnight inventory, outside of prior-range and -value, suggesting a potential for immediate directional opportunity.

In the best case, the S&P 500 trades higher.

Any activity above the $4,227.75 HVNode puts into play the $4,253.25 HVNode. Initiative trade beyond the latter could reach as high as the $4,275.75 LVNode and $4,303.00 Weak High, or higher.

In the worst case, the S&P 500 trades lower.

Any activity below the $4,227.75 HVNode puts into play the $4,203.00 VPOC. Initiative trade beyond the VPOC could reach as low as the $4,189.25 LVNode and $4,153.25 HVNode, or lower.

Click here to load today’s key levels into the web-based TradingView charting platform. Note that all levels are derived using the 65-minute timeframe. New links are produced, daily.
Graphic: 65-minute profile chart of the Micro E-mini S&P 500 Futures.

Definitions

Volume Areas: A structurally sound market will build on areas of high volume (HVNodes). Should the market trend for long periods of time, it will lack sound structure, identified as low volume areas (LVNodes). LVNodes denote directional conviction and ought to offer support on any test. 

If participants were to auction and find acceptance into areas of prior low volume (LVNodes), then future discovery ought to be volatile and quick as participants look to HVNodes for favorable entry or exit.

POCs: POCs are valuable as they denote areas where two-sided trade was most prevalent in a prior day session. Participants will respond to future tests of value as they offer favorable entry and exit.

MCPOCs: POCs are valuable as they denote areas where two-sided trade was most prevalent over numerous day sessions. Participants will respond to future tests of value as they offer favorable entry and exit.

Volume-Weighted Average Prices (VWAPs): A metric highly regarded by chief investment officers, among other participants, for quality of trade. Additionally, liquidity algorithms are benchmarked and programmed to buy and sell around VWAPs.

About

After years of self-education, strategy development, mentorship, and trial-and-error, Renato Leonard Capelj began trading full-time and founded Physik Invest to detail his methods, research, and performance in the markets.

Capelj also develops insights around impactful options market dynamics at SpotGamma and is a Benzinga reporter.

Some of his works include conversations with ARK Invest’s Catherine Wood, investors Kevin O’Leary and John Chambers, FTX’s Sam Bankman-Fried, ex-Bridgewater Associate Andy Constan, Kai Volatility’s Cem Karsan, The Ambrus Group’s Kris Sidial, among many others.

Disclaimer

In no way should the materials herein be construed as advice. Derivatives carry a substantial risk of loss. All content is for informational purposes only.
Categories
Commentary

Daily Brief For August 3, 2022

The daily brief is a free glimpse into the prevailing fundamental and technical drivers of U.S. equity market products. Join the 700+ that read this report daily, below!

Graphic updated 9:15 AM ET. Sentiment Neutral if expected /ES open is inside of the prior day’s range. /ES levels are derived from the profile graphic at the bottom of the following section. Levels may have changed since initially quoted; click here for the latest levels. SqueezeMetrics Dark Pool Index (DIX) and Gamma (GEX) calculations are based on where the prior day’s reading falls with respect to the MAX and MIN of all occurrences available. A higher DIX is bullish. At the same time, the lower the GEX, the more (expected) volatility. Learn the implications of volatility, direction, and moneyness. Breadth reflects a reading of the prior day’s NYSE Advance/Decline indicator. VIX reflects a current reading of the CBOE Volatility Index (INDEX: VIX) from 0-100.

Fundamental

Our August 1 letter assessed, mainly, the impacts of a burgeoning economic war that is hot as well put by a recent note authored by Credit Suisse Group AG’s (NYSE: CS) Zoltan Pozsar.

Read: Dr. Pippa Malmgren’s “A Hot War In Cold Places,” which was quoted by Credit Suisse’s Pozsar. Additionally, check out our archives for more analysis of Malmgren’s perspectives.

“Great powers are waging hot wars involving the flow of technologies, goods, and commodities,” the big “contributors to inflation,” a longer-lasting structural issue, Pozar puts forth.

Further, it is the case that “the pillars of the low inflation world are changing,” and geopolitics are the factors bolstering longer-lasting uncertainty and risk premia.

What was the case, before?

Previously, central bankers were waging wars “against deflationary impulses coming from the globalization of cheap resources (labor, goods, and commodities),” which we covered before.

Now, central bankers have a more difficult task stemming inflationary impulses coming from a complex and non-linear economic war between the U.S., China, and Russia that will do more, long-term, to “weaken the pillars of the globalized, low inflation world.”

So: 

  • Deflation, on globalization (and outward supply shifts), was fought with asset price inflation. 
  • Inflation, on de-globalization (and inward supply shifts), is fought with asset price deflation.

Exacerbating the de-globalization pulse on popular sovereignty, which I had the honor of talking on with Andy Constan, recently, are “wealth gains sapping labor force participation” and trends such as ESG, among other things. 

“It’s a mess: it’s easier to deal with the politics of wage setting than it is to ‘grow’ people – even in The Matrix, that’s possible only over time. Until then, we are stuck with a labor shortage, and President Biden’s top labor lawyer is the anti-Reagan: she’s encouraging the unionization of workers from Amazon to Starbucks…as opposed to firing them,” Pozsar explains.

For context, among the factors that helped Chairman Volcker stem inflation were new energy investment and the weakening of unions.

Accordingly, in a move from “generating demand structurally to soak up an excess supply of cheap stuff, to curbing demand structurally to adjust to shortages,” the prevailing tightening effort is not cyclical, as in corresponding to a business cycle. It’s structural.

It requires the sharp, “inward shift of supply curves across multiple fronts (labor, goods, and commodities),” putting the economy on an “L”-shaped path (i.e., a vertical drop in activity via recession, and flatline for a period of time as rates remain higher for longer to prevent a sharp rise in inflation, again).

Market participants, because of this, should be thinking about how deep (i.e., long-lasting) a recession is needed to curb inflation (rather than if a recession will happen at all); necessary is the purge of the “Super Size Me” mentality, Pozsar explains, and slow “interest-rate sensitive parts of the economy (housing and durables),” as well as reduce “demand for labor in services, … a function of the level of wealth across a range of assets (housing, stocks, as well as crypto).

“[W]hat the Fed is telling us when it flat-out dismisses two-quarters of negative GDP growth is that it isn’t focusing as much on the rate-sensitive parts of the economy as it did in the past,” Pozsar well summarizes, adding that 5-6% rates are not out of the realm of possibilities.

“Instead, it is focusing much more on the services economy and the labor market, which still remain strong. And therein lies the cautionary tale for the market.”

Looking out further in time, after inflation has been stemmed, the question is how the economy accelerates, again, and achieves stable growth. That depends on the West developing its own supply of things so “that ‘L’ becomes ‘L/’ and … that recovery [will be driven by] fiscally funded industrial policy.”

Graphic: Retrieved from Bloomberg. “Interest rates may be kept high for a while to ensure that rate cuts won’t cause an economic rebound (an ‘L’ and not a ‘V’), which might trigger a renewed bout of inflation,” Pozsar wrote in his note. “The risks are such that Powell will try his very best to curb inflation, even at the cost of a ‘depression’ and not getting reappointed.”

Positioning

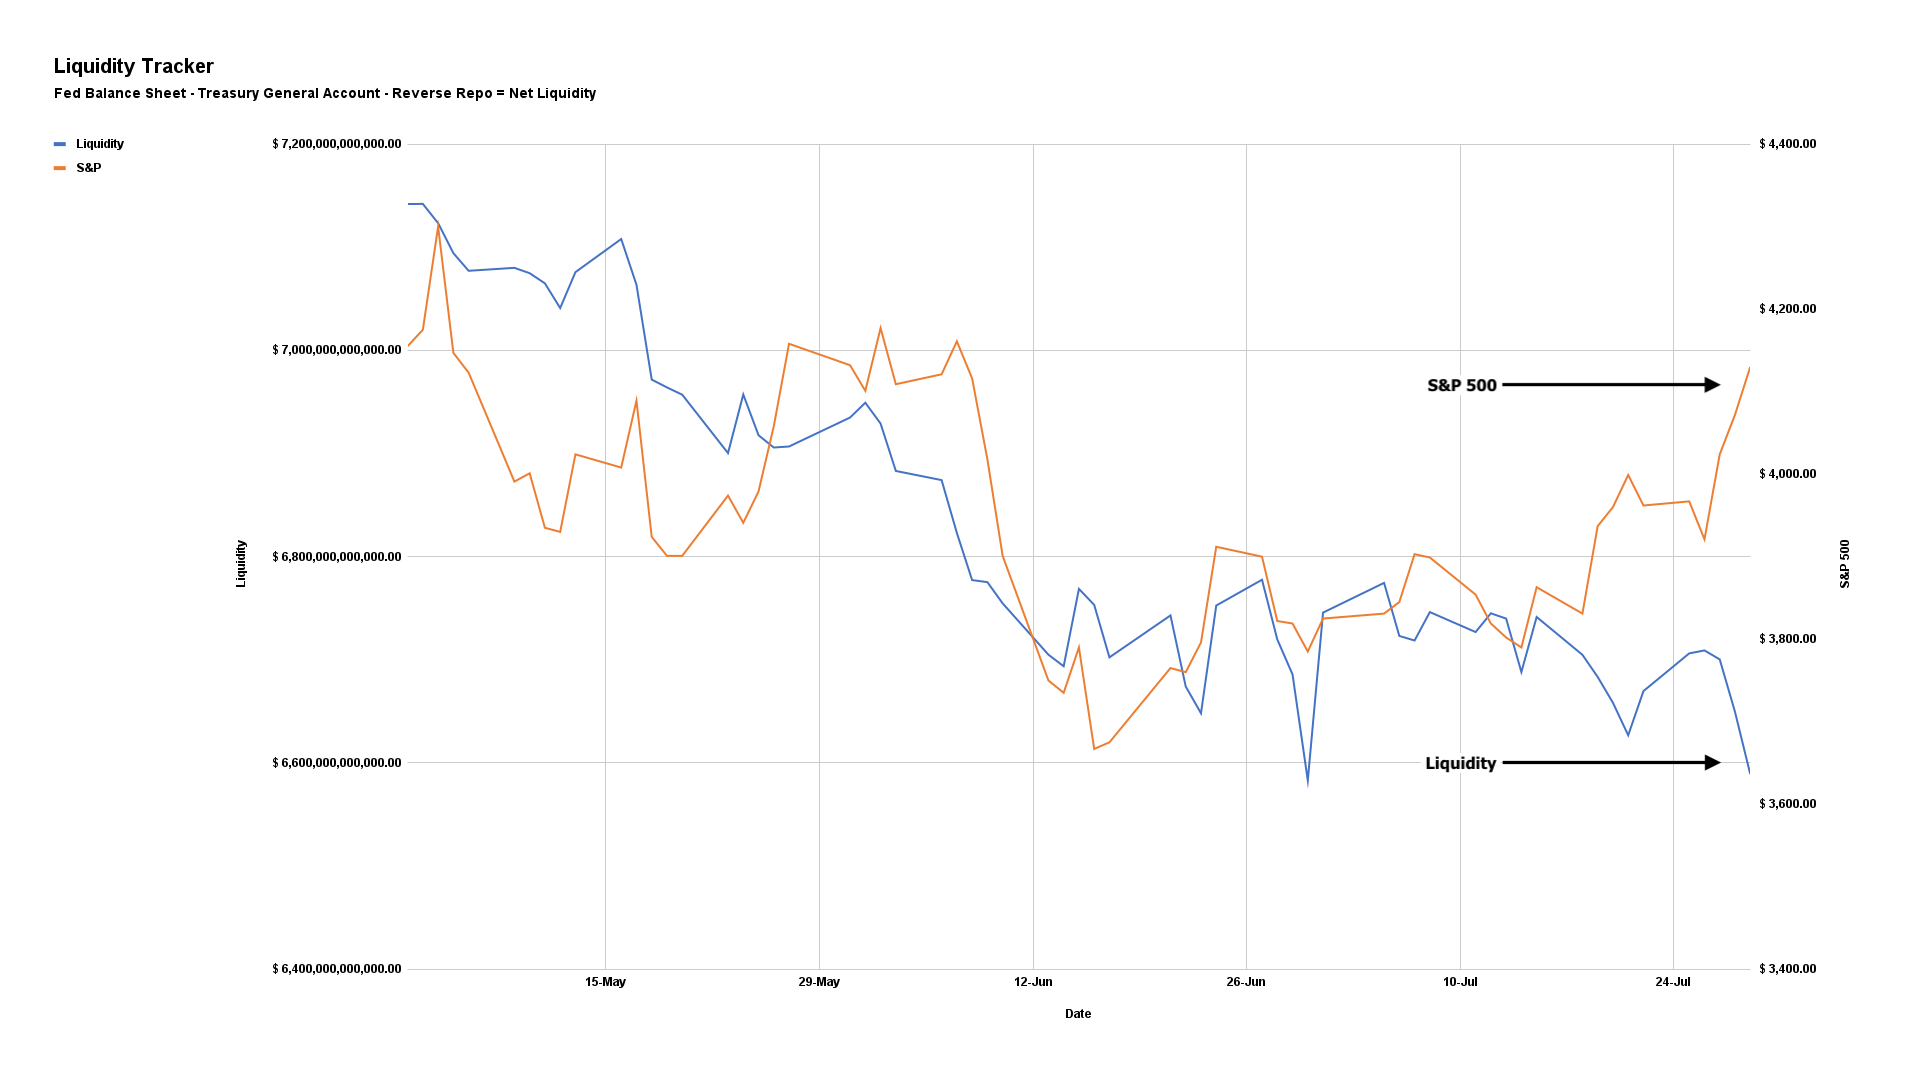
Regarding the topic of liquidity – money available for circulation – which was discussed in-depth Tuesday, August 2, below is an updated chart of our Liquidity Tracker. Conditions are mostly unchanged.

Graphic: Via Physik Invest. Data compiled by @jkonopas623. Fed Balance Sheet data, here. Treasury General Account Data, here. Reverse Repo data, here. NL = BS – TGA – RRP.

Moreover, in terms of options-related positioning, as of 8:50 AM ET, Wednesday’s expected volatility, via the Cboe Volatility Index (INDEX: VIX), sits at ~1.21%. Net gamma exposures increasing may promote tighter ranges.

Given where realized (RVOL) and implied (IVOL) volatility measures are, as well as skew, it is beneficial to be a buyer of complex options structures (e.g., put back spread).

The reason why? 

Well, as discussed in-depth Tuesday, prevailing policy narratives are likely to bolster risk premia “everywhere else,” and that does more to support our recent positioning analyses and the case for an “untethering” in equity implied volatility (IVOL), “one of the most supportive things into the decline,” per statements by Kai Volatility’s Cem Karsan.

Basically, given the macro risk, IVOL is likely at a lower bound (as validated by the S&P 500 trading higher and downside skew holding a bid) and, per The Ambrus Group’s Kris Sidial, “if you wanted to go out and hedge, the opportunity is still there in the equity space.”

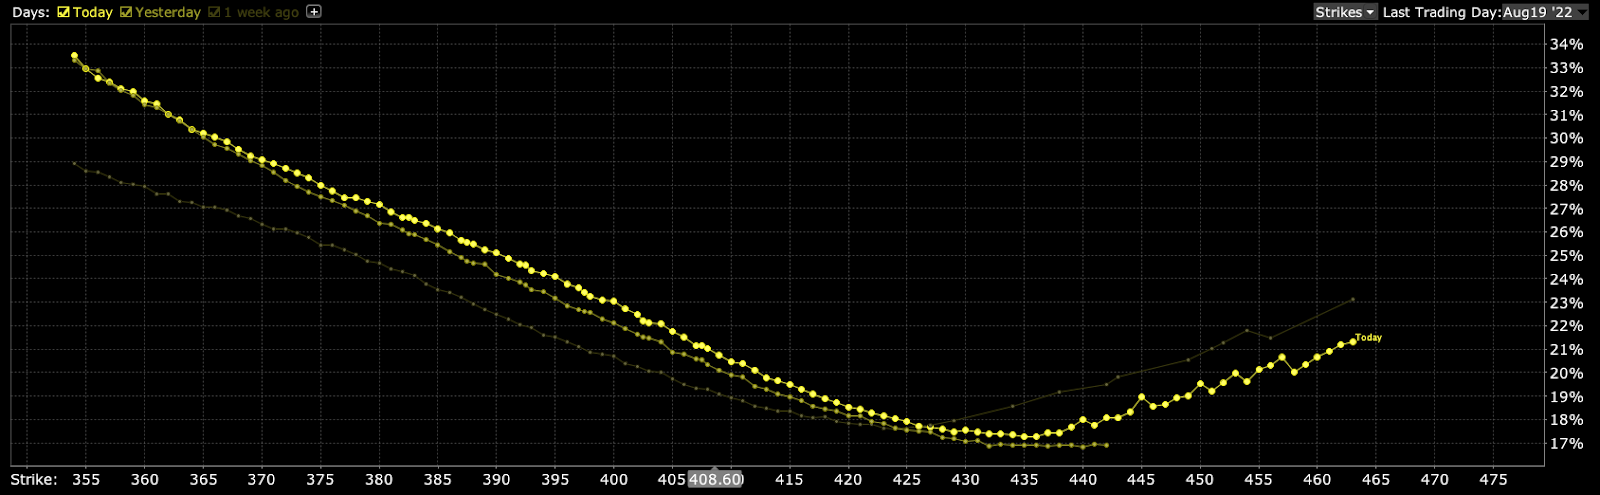
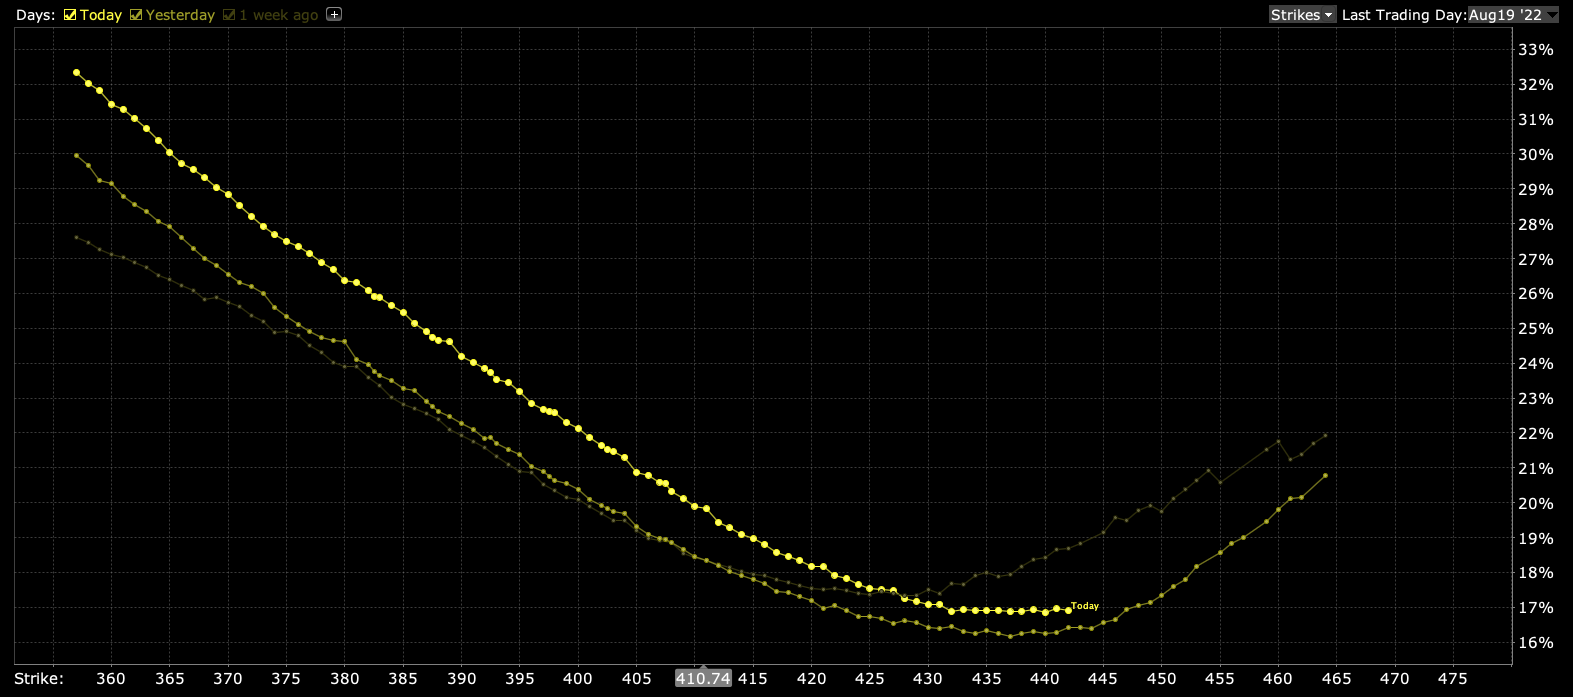
Through downside protection (e.g., butterfly and back spreads) you can position yourself to monetize on the sort-of non-linear repricing in volatility we’re alluding there is potential for. The bid in skew is helping those structures maintain their value better, essentially.

Graphic: Time-lapse skew on the S&P 500 (INDEX: SPX) for Tuesday, Monday, and one week ago. Retrieved from Interactive Brokers Group Inc’s (NASDAQ: IBKR) Trader Workstation.

Technical

As of 6:30 AM ET, Tuesday’s regular session (9:30 AM – 4:00 PM ET), in the S&P 500, is likely to open in the upper part of a positively skewed overnight inventory, inside of prior-range and -value, suggesting a limited potential for immediate directional opportunity.

In the best case, the S&P 500 trades higher.

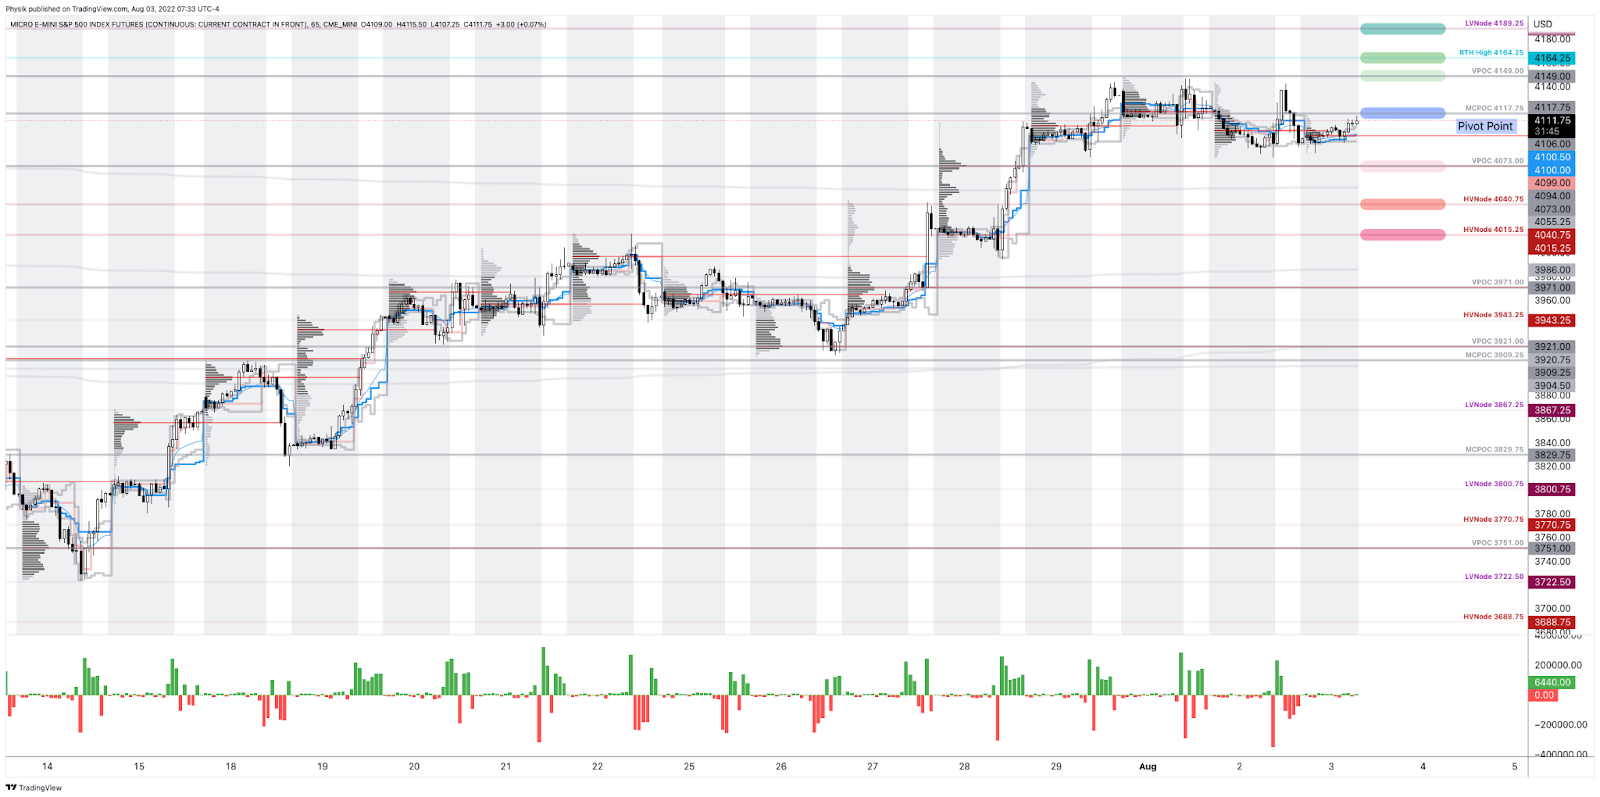
Any activity above the $4,117.75 MCPOC puts into play the $4,149.00 VPOC. Initiative trade beyond the VPOC could reach as high as the $4,164.25 RTH High and $4,189.25 LVNode, or higher.

In the worst case, the S&P 500 trades lower.

Any activity below the $4,117.75 MCPOC puts into play the $4,073.00 VPOC. Initiative trade beyond the VPOC could reach as low as the $4,040.75 and $4,015.25 HVNodes, or lower.

Click here to load today’s key levels into the web-based TradingView charting platform. Note that all levels are derived using the 65-minute timeframe. New links are produced, daily.
Graphic: 65-minute profile chart of the Micro E-mini S&P 500 Futures.

Definitions

Volume Areas: A structurally sound market will build on areas of high volume (HVNodes). Should the market trend for long periods of time, it will lack sound structure, identified as low volume areas (LVNodes). LVNodes denote directional conviction and ought to offer support on any test. 

If participants were to auction and find acceptance into areas of prior low volume (LVNodes), then future discovery ought to be volatile and quick as participants look to HVNodes for favorable entry or exit.

POCs: POCs are valuable as they denote areas where two-sided trade was most prevalent in a prior day session. Participants will respond to future tests of value as they offer favorable entry and exit.

MCPOCs: POCs are valuable as they denote areas where two-sided trade was most prevalent over numerous day sessions. Participants will respond to future tests of value as they offer favorable entry and exit.

Volume-Weighted Average Prices (VWAPs): A metric highly regarded by chief investment officers, among other participants, for quality of trade. Additionally, liquidity algorithms are benchmarked and programmed to buy and sell around VWAPs.

About

After years of self-education, strategy development, mentorship, and trial-and-error, Renato Leonard Capelj began trading full-time and founded Physik Invest to detail his methods, research, and performance in the markets.

Capelj also develops insights around impactful options market dynamics at SpotGamma and is a Benzinga reporter.

Some of his works include conversations with ARK Invest’s Catherine Wood, investors Kevin O’Leary and John Chambers, FTX’s Sam Bankman-Fried, ex-Bridgewater Associate Andy Constan, Kai Volatility’s Cem Karsan, The Ambrus Group’s Kris Sidial, among many others.

Disclaimer

In no way should the materials herein be construed as advice. Derivatives carry a substantial risk of loss. All content is for informational purposes only.
Categories
Commentary

Daily Brief For August 2, 2022

The daily brief is a free glimpse into the prevailing fundamental and technical drivers of U.S. equity market products. Join the 700+ that read this report daily, below!

Graphic updated 6:30 AM ET. Sentiment Risk-Off if expected /ES open is below the prior day’s range. /ES levels are derived from the profile graphic at the bottom of the following section. Levels may have changed since initially quoted; click here for the latest levels. SqueezeMetrics Dark Pool Index (DIX) and Gamma (GEX) calculations are based on where the prior day’s reading falls with respect to the MAX and MIN of all occurrences available. A higher DIX is bullish. At the same time, the lower the GEX, the more (expected) volatility. Learn the implications of volatility, direction, and moneyness. Breadth reflects a reading of the prior day’s NYSE Advance/Decline indicator. VIX reflects a current reading of the CBOE Volatility Index (INDEX: VIX) from 0-100.

Fundamental

The U.S. Treasury upped its borrowing estimate by $262 billion as federal revenue projections shifted.

Here’s why this matters.

Per Damped Spring’s Andy Constan, on an “overwhelming high issuance in Q1,” markets sold, and on “light issuance, once QT start[ed], plus some crazy tax receipts in Q3,” markets rallied.

With the Treasury’s debt managers seeking to borrow more than $400 billion through September, compared to the original estimate of $180 billion or so, anticipated is added borrowing through new marketable debt issuances.

“This is the reason I dumped my long equities after 3:00 when the news hit,” Constan added.

Overall, this news is important because it has an impact on the money available for circulation.

To explain, after the Federal Reserve (Fed) bean upping the size of its balance sheet (BS) in an unprecedented way in 2020, the deployment of this money – liquidity – boosted risk-asset prices and the cost of living.

We can measure the availability of this liquidity, as well showcased by Max Anderson, online. 

Graphic: Via Physik Invest. Data compiled by @jkonopas623. Fed Balance Sheet data, here. Treasury General Account Data, here. Reverse Repo data, here. NL = BS – TGA – RRP.

So, what’s going on, now?

To rein inflation, and undo some of its intervention, the Treasury issued fewer short-dated T-bills, and the Fed raised rates on Reverso Repo (RRP), “the next best low-duration-risk alternative.”

This has sucked over $2 trillion out of the economy, “six times more than ever done before.”

That said, unlike in the past, however, “relative changes in [the] Treasury General Account (TGA) and RRP” are way bigger than changes in the size of the BS. 

As a result, the game changes. 

The “changes in TGA and RRP have taken over as the primary drivers [of] Net Liquidity,” the money available to circulate in the economy. “[S]ince 2020, the Treasury and Reverse Repo [control] that. Not the size of Fed’s balance sheet.”

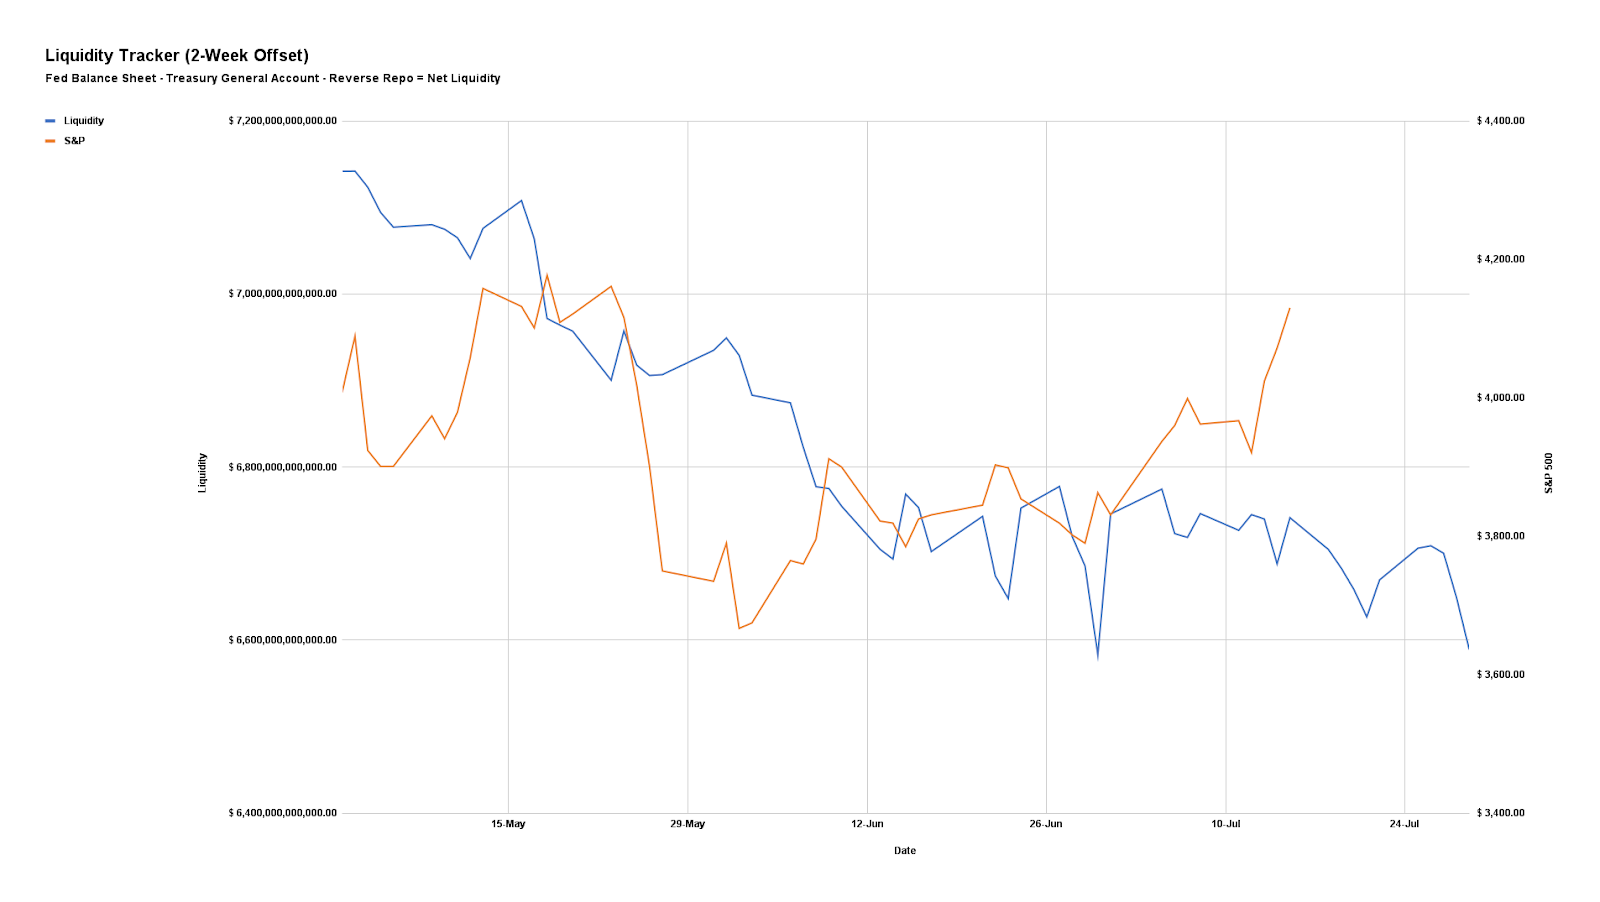
That’s per the tight correlation between Net Liquidity and the S&P 500. Offsetting the two by two weeks (i.e., using the path of Net Liquidity to forecast the path of the S&P 500 by two weeks in advance) reveals a tight correlation.

As Anderson puts it, “when there’s a change in Liquidity, it takes two weeks to propagate out into the economy and impact asset prices. And that change in Liquidity predicts next two week’s change in asset prices with 95% correlation.”

See a file containing the data and charts, here. We’ll work to improve the charts in subsequent letters.
Graphic: Via Physik Invest. Data compiled by @jkonopas623. Fed Balance Sheet data, here. Treasury General Account Data, here. Reverse Repo data, here. NL = BS – TGA – RRP.

Positioning

As of 6:30 AM ET, Tuesday’s expected volatility, via the Cboe Volatility Index (INDEX: VIX), sits at ~1.29%. Net gamma exposures increasing may promote tighter ranges.

Given where realized (RVOL) and implied (IVOL) volatility measures are, as well as skew, it is beneficial to be a buyer of complex options structures (e.g., back spreads).

The reason why? 

Pursuant to our comments on monetary policymakers ditching forward guidance, which, per the Macro Compass’ Alfonso Peccatiello leaves “no anchor for bond markets, … and higher volatility,” bolsters risk premia “everywhere else.”

As stated Monday, this does more to support our recent positioning analyses and the case for an “untethering” in equity IVOL, “one of the most supportive things into the decline,” per statements by Kai Volatility’s Cem Karsan.

Here’s some context.

As well explained in the Daily Brief for July 21, 2022, heading into the 2022 decline, institutions repositioned and hedged, even allocating to “commodity trend following,” per our Daily Brief for July 15, 2022, which worked well the first two quarters.

The monetization and counterparty hedging of existing customer hedges, as well as the sale of short-dated volatility, particularly in some of the single names where there was “rich” volatility, into the fall, lent to lackluster performance in IVOL and index mean reversion.

This trend is coming to an end as entities are squeezed out of trades that aren’t working (i.e., participants rotate out of volatility and commodities).

Per Karsan, as “volatility itself, on the equity side, becomes less and less hedged on the customer level, … [the] market can really begin to respond to the core macro factors.”

Should markets experience a shock (e.g., China and U.S. tensions escalate), the new demand for hedges may result in an “untethering” in IVOL, which was “one of the most supportive things into the decline,” Karsan said, adding that now is the best time to rotate into call options which are outperforming “their delta to the upside.”

Accordingly, given the macro risk, IVOL is likely at a lower bound (as validated by the S&P 500 trading higher and downside skew holding a bid) and, per The Ambrus Group’s Kris Sidial, “if you wanted to go out and hedge, the opportunity is still there in the equity space.”

Through downside protection (e.g., butterfly and back spreads) you can position yourself to monetize on the sort-of non-linear repricing in volatility we’re alluding there is potential for. The bid in skew is helping those structures maintain their value better, essentially.

Graphic: Time-lapse skew on the S&P 500 (INDEX: SPX) for Monday, Friday, and one week ago. Retrieved from Interactive Brokers Group Inc’s (NASDAQ: IBKR) Trader Workstation.

Technical

As of 6:30 AM ET, Tuesday’s regular session (9:30 AM – 4:00 PM ET), in the S&P 500, is likely to open in the lower part of a negatively skewed overnight inventory, outside of prior-range and -value, suggesting a potential for immediate directional opportunity.

In the best case, the S&P 500 trades higher.

Any activity above the $4,117.75 MCPOC puts into play the $4,149.00 VPOC. Initiative trade beyond the VPOC could reach as high as the $4,164.25 RTH High and $4,189.25 LVNode, or higher.

In the worst case, the S&P 500 trades lower.

Any activity below the $4,117.75 MCPOC puts into play the $4,073.00 VPOC. Initiative trade beyond the VPOC could reach as low as the $4,040.75 and $4,015.25 HVNodes, or lower.

Click here to load today’s key levels into the web-based TradingView charting platform. Note that all levels are derived using the 65-minute timeframe. New links are produced, daily.
Graphic: 65-minute profile chart of the Micro E-mini S&P 500 Futures.

Definitions

Volume Areas: A structurally sound market will build on areas of high volume (HVNodes). Should the market trend for long periods of time, it will lack sound structure, identified as low volume areas (LVNodes). LVNodes denote directional conviction and ought to offer support on any test. 

If participants were to auction and find acceptance into areas of prior low volume (LVNodes), then future discovery ought to be volatile and quick as participants look to HVNodes for favorable entry or exit.

POCs: POCs are valuable as they denote areas where two-sided trade was most prevalent in a prior day session. Participants will respond to future tests of value as they offer favorable entry and exit.

MCPOCs: POCs are valuable as they denote areas where two-sided trade was most prevalent over numerous day sessions. Participants will respond to future tests of value as they offer favorable entry and exit.

Volume-Weighted Average Prices (VWAPs): A metric highly regarded by chief investment officers, among other participants, for quality of trade. Additionally, liquidity algorithms are benchmarked and programmed to buy and sell around VWAPs.

About

After years of self-education, strategy development, mentorship, and trial-and-error, Renato Leonard Capelj began trading full-time and founded Physik Invest to detail his methods, research, and performance in the markets.

Capelj also develops insights around impactful options market dynamics at SpotGamma and is a Benzinga reporter.

Some of his works include conversations with ARK Invest’s Catherine Wood, investors Kevin O’Leary and John Chambers, FTX’s Sam Bankman-Fried, ex-Bridgewater Associate Andy Constan, Kai Volatility’s Cem Karsan, The Ambrus Group’s Kris Sidial, among many others.

Disclaimer

In no way should the materials herein be construed as advice. Derivatives carry a substantial risk of loss. All content is for informational purposes only.
Categories
Commentary

Daily Brief For July 28, 2022

The daily brief is a free glimpse into the prevailing fundamental and technical drivers of U.S. equity market products. Join the 600+ that read this report daily, below!

Graphic updated 7:00 AM ET. Sentiment Neutral if expected /ES open is inside of the prior day’s range. /ES levels are derived from the profile graphic at the bottom of the following section. Levels may have changed since initially quoted; click here for the latest levels. SqueezeMetrics Dark Pool Index (DIX) and Gamma (GEX) calculations are based on where the prior day’s reading falls with respect to the MAX and MIN of all occurrences available. A higher DIX is bullish. At the same time, the lower the GEX, the more (expected) volatility. Learn the implications of volatility, direction, and moneyness. Breadth reflects a reading of the prior day’s NYSE Advance/Decline indicator. VIX reflects a current reading of the CBOE Volatility Index (INDEX: VIX) from 0-100.

Fundamental

Key, yesterday, was the Federal Reserve’s (Fed) move to rein inflation with another 75 basis point interest rate hike. This lifted the target for the federal funds rate to 2.25-2.5%.

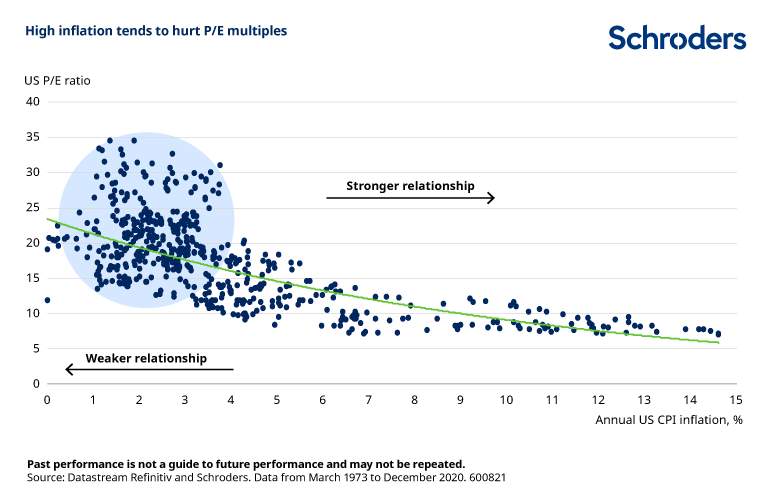
Accordingly, with inflation (which is to be dampened) a negative for stocks, a primary driver behind this year’s de-rate, already, equity markets closed sharply higher.

Graphic: Via Schroders plc (OTC: SHNWF). Taken from the Weekly S&P 500 ChartStorm.

Despite room for higher rates, the Fed explained future decisions would “depend on the data,” and that, per Bloomberg, the economy is likely “to withstand rapid monetary tightening.”

Graphic: Retrieved from Bloomberg. Tighter liquidity and credit bolster demand for money as well as the deflation of risk assets. “There used to be too little demand. Now there’s too little supply. And in a world of too little supply, the country doing the most to generate demand, which is the US, is exporting its problem—its problem being inflation,” per Harvard’s Jason Furman.

Adding, participants are, now, pricing in the potential for a federal funds rate peak in the range of 3.25-3.50% early-to-mid 2023, down from 4.00-4.75% after the last rate hike took place.

Graphic: Via CME Group Inc’s (NASDAQ: CME) FedWatch Tool.

Strategists at the likes of Bank of America Corporation (NYSE: BAC) put forth that it is likely, given an economic slowing, that the Fed, indeed, cuts rates next year and ends quantitative tightening (QT).

“The Fed is likely to stop QT with rate cuts due to the contradictory signal it sends on monetary policy and to simplify policy communications; the Fed will likely not want to be easing with rate cuts but tightening with QT,” the bank’s strategists explained. 

An end to QT would cut the supply that the “Treasury needs to issue to cover Fed redemptions. It also means the Fed may conduct secondary purchases, further limiting the amount of supply the market needs to absorb.”

This is in comparison to the narrative we discussed earlier this week, put forth by Damped Spring Advisors’ Andy Constan.

With “most of [the Fed] balance sheet reduction to be run-off” – non-reinvestment of “proceeds from maturing assets they own” – coupled with the Treasury halving “coupon issuance that the market must absorb,” Constan explained, instead, that the “Fed is done for the summer.”

This is likely to “result in less surprise and falling asset volatility” as investors realize “they are now under-risked,” which may drive a “risk premium contraction” and demand for risk assets.

Positioning

As of 6:50 AM ET, Thursday’s expected volatility, via the Cboe Volatility Index (INDEX: VIX), sits at ~1.22%. Net gamma exposures increasing may promote tighter ranges.

It is often, just after an event, that market movement is the result of inventory rebalances. Per Kai Volatility’s Cem Karsan, the subsequent move is to be “tied to the incremental effects on liquidity (QE/QT).” 

Graphic: Retrieved from MarketWatch.

Rising rates and the withdrawal of liquidity, coupled with the impact of inflation and an economic slowing, could prompt continued pressure on equity markets.

Given the macro risk, and the poor performance of implied volatility (IVOL), relative to that which markets have realized (RVOL), per The Ambrus Group’s Kris Sidial, “if you wanted to go out and hedge, the opportunity is still there in the equity space.”

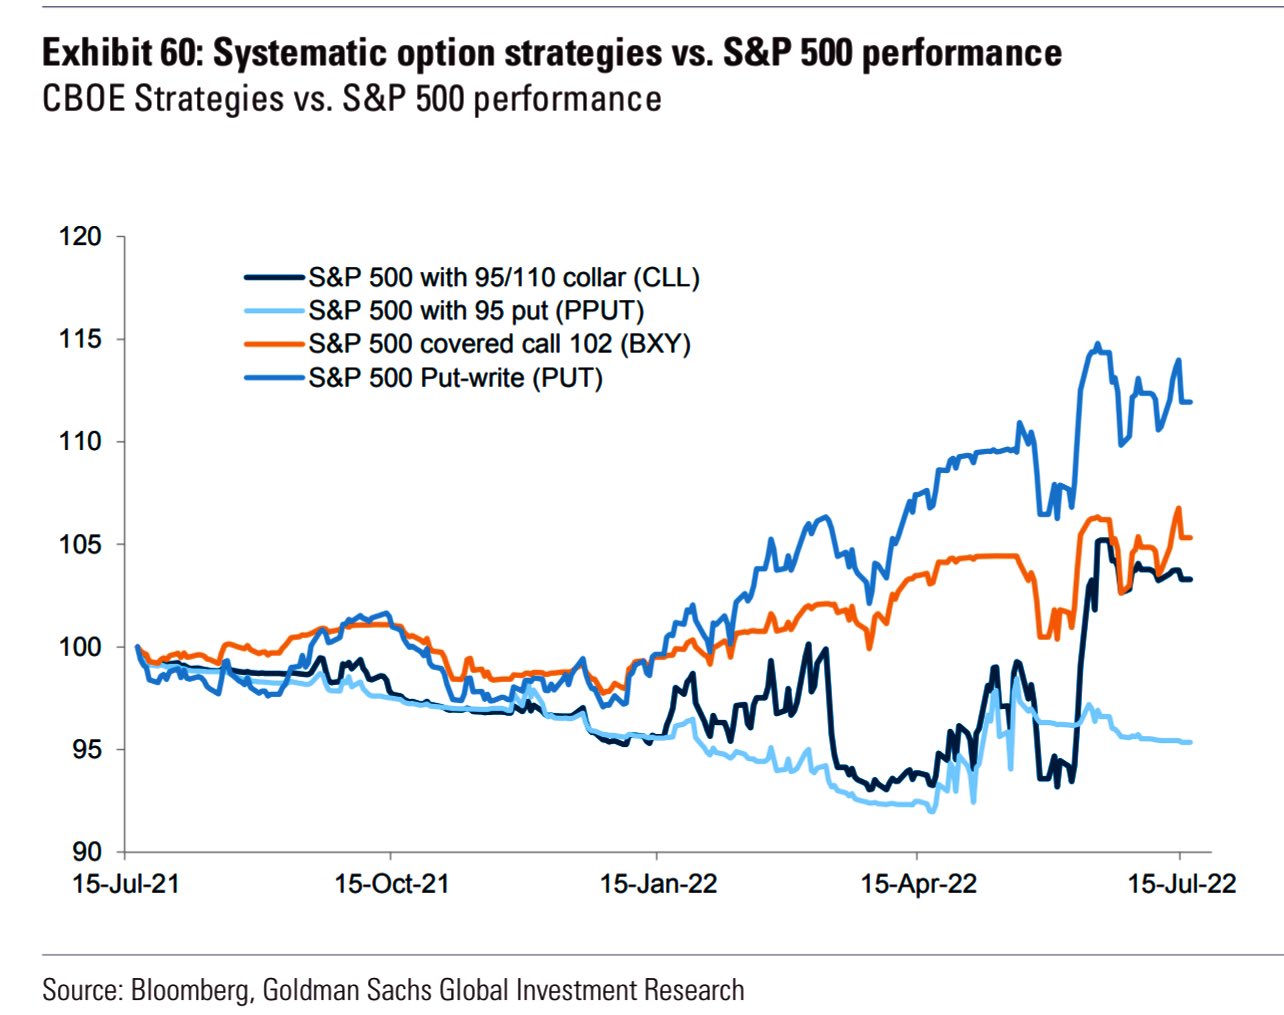
Graphic: Retrieved from Goldman Sachs Group Inc (NYSE: GS).

Should investors “ditch their [old] hedges in frustration as sentiment improves, because they didn’t work properly in a falling market,” this may set up “the potential for a second-leg-down event,” in the next year, as well explained in the Systemic Individual Investor.

“During the next sell-off, panic put-buying can cause a much more violent downward spiral, because options dealers are forced to sell an increasing amount of S&P futures into an accelerating down move.”

So, what to do? 

With call options outperforming “their delta to the upside,” it continues to make much sense to replace static equity long exposure with that which is dynamic, Karsan explained.

Technical

As of 6:50 AM ET, Thursday’s regular session (9:30 AM – 4:00 PM ET), in the S&P 500, is likely to open in the middle part of a negatively skewed overnight inventory, inside of prior-range and -value, suggesting a limited potential for immediate directional opportunity.

In the best case, the S&P 500 trades higher.

Any activity above the $4,015.75 HVNode puts into play the $4,041.25 HVNode. Initiative trade beyond the $4,041.25 HVNode could reach as high as the $4,071.50 BAL and $4,095.00 VPOC, or higher.

In the worst case, the S&P 500 trades lower.

Any activity below the $4,015.75 HVNode puts into play the $3,971.00 VPOC. Initiative trade beyond the VPOC could reach as low as the $3,943.25 HVNode and $3,921.00 VPOC, or lower.

Click here to load today’s key levels into the web-based TradingView charting platform. Note that all levels are derived using the 65-minute timeframe. New links are produced, daily.
Graphic: 65-minute profile chart of the Micro E-mini S&P 500 Futures.

Definitions

Volume Areas: A structurally sound market will build on areas of high volume (HVNodes). Should the market trend for long periods of time, it will lack sound structure, identified as low volume areas (LVNodes). LVNodes denote directional conviction and ought to offer support on any test. 

If participants were to auction and find acceptance into areas of prior low volume (LVNodes), then future discovery ought to be volatile and quick as participants look to HVNodes for favorable entry or exit.

POCs: POCs are valuable as they denote areas where two-sided trade was most prevalent in a prior day session. Participants will respond to future tests of value as they offer favorable entry and exit.

MCPOCs: POCs are valuable as they denote areas where two-sided trade was most prevalent over numerous day sessions. Participants will respond to future tests of value as they offer favorable entry and exit.

Volume-Weighted Average Prices (VWAPs): A metric highly regarded by chief investment officers, among other participants, for quality of trade. Additionally, liquidity algorithms are benchmarked and programmed to buy and sell around VWAPs.

About

After years of self-education, strategy development, mentorship, and trial-and-error, Renato Leonard Capelj began trading full-time and founded Physik Invest to detail his methods, research, and performance in the markets.

Capelj also develops insights around impactful options market dynamics at SpotGamma and is a Benzinga reporter.

Some of his works include conversations with ARK Invest’s Catherine Wood, investors Kevin O’Leary and John Chambers, FTX’s Sam Bankman-Fried, ex-Bridgewater Associate Andy Constan, Kai Volatility’s Cem Karsan, The Ambrus Group’s Kris Sidial, among many others.

Disclaimer

In no way should the materials herein be construed as advice. Derivatives carry a substantial risk of loss. All content is for informational purposes only.
Categories
Commentary

Daily Brief For July 27, 2022

The daily brief is a free glimpse into the prevailing fundamental and technical drivers of U.S. equity market products. Join the 600+ that read this report daily, below!

Graphic updated 6:55 AM ET. Sentiment Risk-On if expected /ES open is above the prior day’s range. /ES levels are derived from the profile graphic at the bottom of the following section. Levels may have changed since initially quoted; click here for the latest levels. SqueezeMetrics Dark Pool Index (DIX) and Gamma (GEX) calculations are based on where the prior day’s reading falls with respect to the MAX and MIN of all occurrences available. A higher DIX is bullish. At the same time, the lower the GEX, the more (expected) volatility. Learn the implications of volatility, direction, and moneyness. Breadth reflects a reading of the prior day’s NYSE Advance/Decline indicator. VIX reflects a current reading of the CBOE Volatility Index (INDEX: VIX) from 0-100.

Fundamental

We shall unpack details from the Federal Open Market Committee (FOMC) event in the coming sessions, stay tuned.

Positioning

As of 6:40 AM ET, Wednesday’s expected volatility, via the Cboe Volatility Index (INDEX: VIX), sits at ~1.27%. Net gamma exposures lightly decreasing may promote larger trading ranges.

Graphic: Via Physik Invest. Data retrieved from SqueezeMetrics.

Should fears with respect to the Federal Open Market Committee (FOMC) announcement be assuaged, then compression in volatility may do more to support current equity price levels.

Graphic: Updated July 26, 2022. Retrieved from Interactive Brokers Group Inc’s (NASDAQ: IBKR) Trader Workstation. Posted by SpotGamma. Short-dated, pre-FOMC, volatility is sold. Longer-dated, post-FOMC volatility is bid. “Traders have likely shorting implied volatility for pre-FOMC expirations which has been supportive of equities.”

Notwithstanding, let’s unpack some trends and how they may feed into a volatility “untethering.”

In the Daily Brief for March 31, 2022, we discussed participants’ aversion to selling short-term variance. This, which did more to assuage our fear of crash risk, as well explained in the Daily Brief for March 30, 2022, was, in part, the result of COVID-era volatility that forced participants, out on the risk curve, to deleverage en masse.

As stated in March, per Banco Santander SA’s (NYSE: SAN) research, the “supply of volatility remains very subdued in a trend that has continued since the pandemic.”

“We did observe some activity in 4Q21 and 1Q this year, but almost all of that was unwinding of existing positions from earlier, and these were not new trades.”

Graphic: Via Goldman Sachs Group Inc (NYSE: GS).

However, despite all of the “uncertainty from geopolitics and central banks,” we still saw broad equity implied volatility (IVOL) measures subdued, relative to those in rates and FX.

Graphic: Retrieved from QVR Advisors’ Benn Eifert.

Let’s unpack that muted response, further.

Well, as explained in the Daily Brief for July 21, 2022, heading into the 2022 decline, institutions repositioned and hedged, even allocating to “commodity trend following,” per our Daily Brief for July 15, 2022, which worked well the first two quarters.

The monetization and counterparty hedging of existing customer hedges, as well as the sale of short-dated volatility, particularly in some of the single names where there was “rich” volatility, into the fall, lent to lackluster performance in implied volatility and index mean reversion.

Graphic: Retrieved from Rob Emrich III. Via Goldman Sachs Group Inc (NYSE: GS).

This trend is set to come to an end as entities are squeezed out of trades that aren’t working (i.e., participants rotate out of volatility and commodities).

Graphic: Retrieved from SpotGamma. S&P 500 $3,500.00 put option values. “Like with the Boy Who Cried Wolf, people grew tired of false alarms. This year put buyers have been waiting for the wolf, but after June OPEX the villagers stopped listening.”

Per Kai Volatility’s Cem Karsan, as “volatility itself, on the equity side, becomes less and less hedged on the customer level, … [the] market can really begin to respond to the core macro factors.”

Should markets experience a shock, or trade substantially lower, the demand for hedges may result in an “untethering” in implied volatility, which was “one of the most supportive things into the decline,” Karsan said, adding that now is the best time to rotate into call options which are outperforming “their delta to the upside.”

Graphic: Time-lapse skew on the S&P 500 (INDEX: SPX) for July 25 and July 26, 2022. Retrieved from Interactive Brokers Group Inc’s (NASDAQ: IBKR) Trader Workstation.

Accordingly, given the macro risk, IVOL is likely at a lower bound and, per The Ambrus Group’s Kris Sidial, “if you wanted to go out and hedge, the opportunity is still there in the equity space.”

Technical

As of 6:30 AM ET, Wednesday’s regular session (9:30 AM – 4:00 PM ET), in the S&P 500, is likely to open in the upper part of a positively skewed overnight inventory, just outside of prior-range and -value, suggesting a potential for immediate directional opportunity.

In the best case, the S&P 500 trades higher.

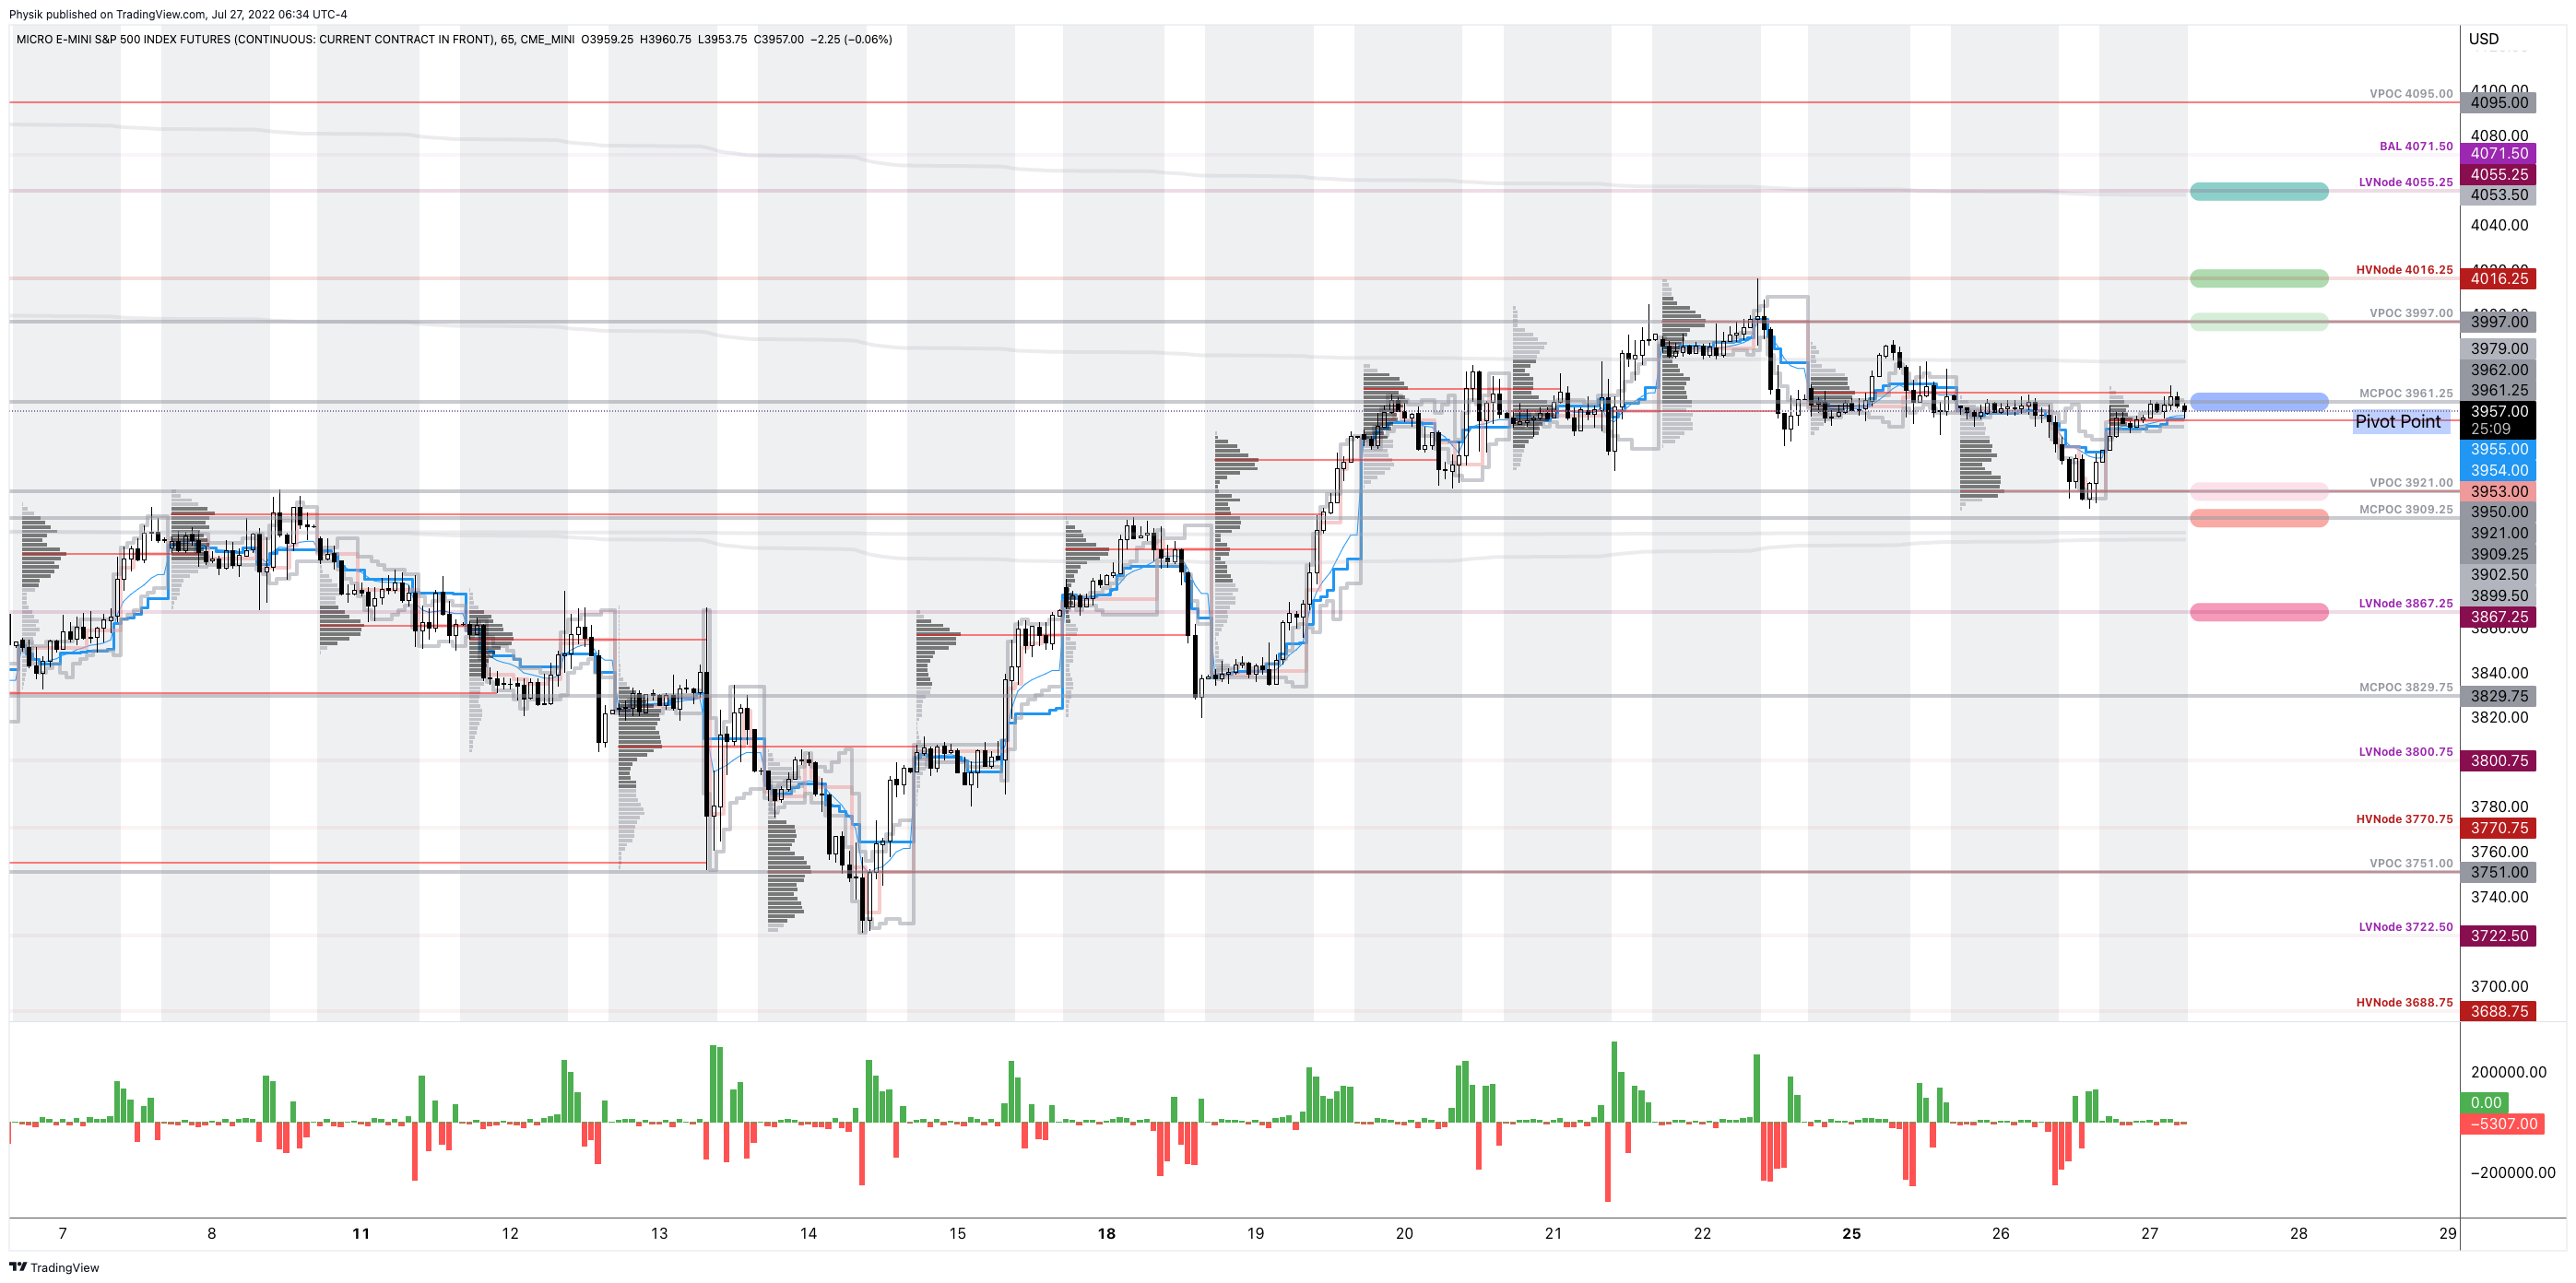
Any activity above the $3,961.25 MCPOC puts into play the $3,997.00 VPOC. Initiative trade beyond the VPOC could reach as high as the $4,016.25 HVNode and $4,055.25 LVNode, or higher.

In the worst case, the S&P 500 trades lower.

Any activity below the $3,961.25 MCPOC puts into play the $3,921.00 VPOC. Initiative trade beyond the VPOC could reach as low as the $3,909.25 MCPOC and $3,867.25 LVNode, or lower.

Click here to load today’s key levels into the web-based TradingView charting platform. Note that all levels are derived using the 65-minute timeframe. New links are produced, daily.
Graphic: 65-minute profile chart of the Micro E-mini S&P 500 Futures.

Definitions

Volume Areas: A structurally sound market will build on areas of high volume (HVNodes). Should the market trend for long periods of time, it will lack sound structure, identified as low volume areas (LVNodes). LVNodes denote directional conviction and ought to offer support on any test. 

If participants were to auction and find acceptance into areas of prior low volume (LVNodes), then future discovery ought to be volatile and quick as participants look to HVNodes for favorable entry or exit.

POCs: POCs are valuable as they denote areas where two-sided trade was most prevalent in a prior day session. Participants will respond to future tests of value as they offer favorable entry and exit.

MCPOCs: POCs are valuable as they denote areas where two-sided trade was most prevalent over numerous day sessions. Participants will respond to future tests of value as they offer favorable entry and exit.

Volume-Weighted Average Prices (VWAPs): A metric highly regarded by chief investment officers, among other participants, for quality of trade. Additionally, liquidity algorithms are benchmarked and programmed to buy and sell around VWAPs.

About

After years of self-education, strategy development, mentorship, and trial-and-error, Renato Leonard Capelj began trading full-time and founded Physik Invest to detail his methods, research, and performance in the markets.

Capelj also develops insights around impactful options market dynamics at SpotGamma and is a Benzinga reporter.

Some of his works include conversations with ARK Invest’s Catherine Wood, investors Kevin O’Leary and John Chambers, FTX’s Sam Bankman-Fried, ex-Bridgewater Associate Andy Constan, Kai Volatility’s Cem Karsan, The Ambrus Group’s Kris Sidial, among many others. 

Disclaimer

In no way should the materials herein be construed as advice. Derivatives carry a substantial risk of loss. All content is for informational purposes only.
Categories
Commentary

Daily Brief For July 18, 2022

The daily brief is a free glimpse into the prevailing fundamental and technical drivers of U.S. equity market products. Join the 300+ that read this report daily, below!

Graphic updated 6:30 AM ET. Sentiment Risk-On if expected /ES open is above the prior day’s range. /ES levels are derived from the profile graphic at the bottom of the following section. Levels may have changed since initially quoted; click here for the latest levels. SqueezeMetrics Dark Pool Index (DIX) and Gamma (GEX) calculations are based on where the prior day’s reading falls with respect to the MAX and MIN of all occurrences available. A higher DIX is bullish. At the same time, the lower the GEX, the more (expected) volatility. Learn the implications of volatility, direction, and moneyness. Breadth reflects a reading of the prior day’s NYSE Advance/Decline indicator. VIX reflects a current reading of the CBOE Volatility Index (INDEX: VIX) from 0-100.

Fundamental

Positivity across most products we monitor in this letter. This is alongside participants’ paring of bets on more aggressive Federal Reserve (Fed) action. It was just last week, right after the CPI dump, that participants were pricing a near-50% chance of a 100 basis point rate hike in July.

That is no longer the case. The odds are 60-40 in favor of a 50 to 75 basis point hike.

Graphic: Via CME Group Inc’s (NASDAQ: CME) FedWatch Tool.

A quick check of the Eurodollar (FUTURE: /GE) curve, a reflection of participants’ outlook on interest rates, we see a peak of the Fed-rate-hike cycle – the terminal rate – near DEC 2022.

Below, we see the overnight rate expected to peak near 3.915% by late 2022.

Graphic: Via Charles Schwab Corporation-owned (NYSE: SCHW) TD Ameritrade’s Thinkorswim.

For context, the price of /GE reflects the interest offered on U.S. dollar-denominated deposits at banks outside of the U.S. With that, they’re “expressed numerically using 100 minus the implied 3-month U.S. dollar LIBOR interest rate,” per Investopedia. This means that at current DEC 2022 prices (96.085), this reflects an implied interest rate settlement rate of 3.915%.

Read: The shift from the Eurodollar to SOFR is accelerating as “SOFR adoption cracked 50%.”

The U.S. Dollar (INDEX: DXY), though it is generally far stronger on pressures (e.g., recession, geopolitics) elsewhere, eased.

Read: Why the U.S. Dollar is booming and creating a possible doom loop and Sunak takes the lead in the voting for U.K. Prime Minister, as well as China weighs mortgage grace period to appease angry home buyers and the ECB case for a half-point rate hike just won’t go away.
Graphic: Via Bloomberg.

Further, it is policy adjustments that are inflicting damage on some inflated areas of the market like crypto and private equity.

Recall that prevailing monetary policies made it easier to borrow and make longer-duration bets on ideas with a lot of promise in the future. Central banks, too, underwrote losses of this regime and encouraged continued growth. This had consequences on the real economy and asset prices which rose and kept deflationary pressures at bay.

As well put forth in our May 18, 2022 commentary, the recent market rout is a recession and the direct reflection of the unwind of carry. Capital was “misallocated” and the Fed’s move to control price stability is “completely unreasonable” as they’re not in a position to do it “without bringing down the markets,” per Kai Volatility’s Cem Karsan.

Read: Kris Abdelmessih’s Moontower #148 on prevailing macroeconomic perspectives.

A prospective hit in demand is in the context of improvement among supply chains, as Citigroup Inc (NYSE: C) economists explain

Graphic: Via Bloomberg.

“The bad news is that this looks to be occurring on the back of a slowing in the global consumer’s demand for goods, especially discretionary goods, and thus may also signal rising recession risks.”

Graphic: Via Bloomberg. “Carmakers registered the fewest new vehicles in the European Union since 1996 as persistent supply chain snarls and record inflation afflict the industry. New-car sales in the EU and four other states tracked by the European Automobile Manufacturers’ Association fell 17% to 1.07 million last month, according to a statement. Volkswagen AG was the hardest-hit major carmaker, with registrations dropping 24% from a year ago.”

It is the case that as the “Fed is pursuing demand destruction through negative wealth effects,” it will, ultimately, pivot because “central banks can only deal with nominal [and] not real chokepoints,” according to Credit Suisse Group AG’s (NYSE: CS) Zoltan Pozsar.

Read: Despite stronger than expected retail sales, inflation adjustments point to a leveling-off.

The “risk of recession, whether it is real or merely implied by an inversion of the yield curve, won’t deter the Fed from hiking rates higher faster or from injecting more volatility to build up negative wealth effects.” 

“Rallies could beget more forceful pushback from the Fed – the new game.”

Watch: Quantitative Tightening is the direct flow of capital to capital markets.

Positioning

Please check out the Daily Brief for July 15, 2022. There we summarized, well, the implication of the macro landscape and options positioning.

The summary was that with commodities not offering protection, one has to be concerned if “the flock move[s],” per The Ambrus Group’s Kris Sidial and, ultimately, “if you wanted to go out and hedge, the opportunity is still there in the equity space.”

This is as markets are in a window of “non-strength,” says Karsan in the video below.

Technical

As of 6:30 AM ET, Monday’s regular session (9:30 AM – 4:00 PM ET), in the S&P 500, is likely to open in the upper part of a positively skewed overnight inventory, outside of prior-range and -value, suggesting a potential for immediate directional opportunity.

In the best case, the S&P 500 trades higher.

Any activity above the $3,909.25 MCPOC puts into play the $3,943.25 HVNode. Initiative trade beyond the HVNode could reach as high as the $3,982.75 LVNode and $4,016.25 HVNode, or higher.

In the worst case, the S&P 500 trades lower.

Any activity below the $3,909.25 MCPOC puts into play the $3,857.00 VPOC. Initiative trade beyond the VPOC could reach as low as the $3,829.75 MCPOC and $3,800.75 LVNode, or lower.

Click here to load today’s key levels into the web-based TradingView charting platform. Note that all levels are derived using the 65-minute timeframe. New links are produced, daily.
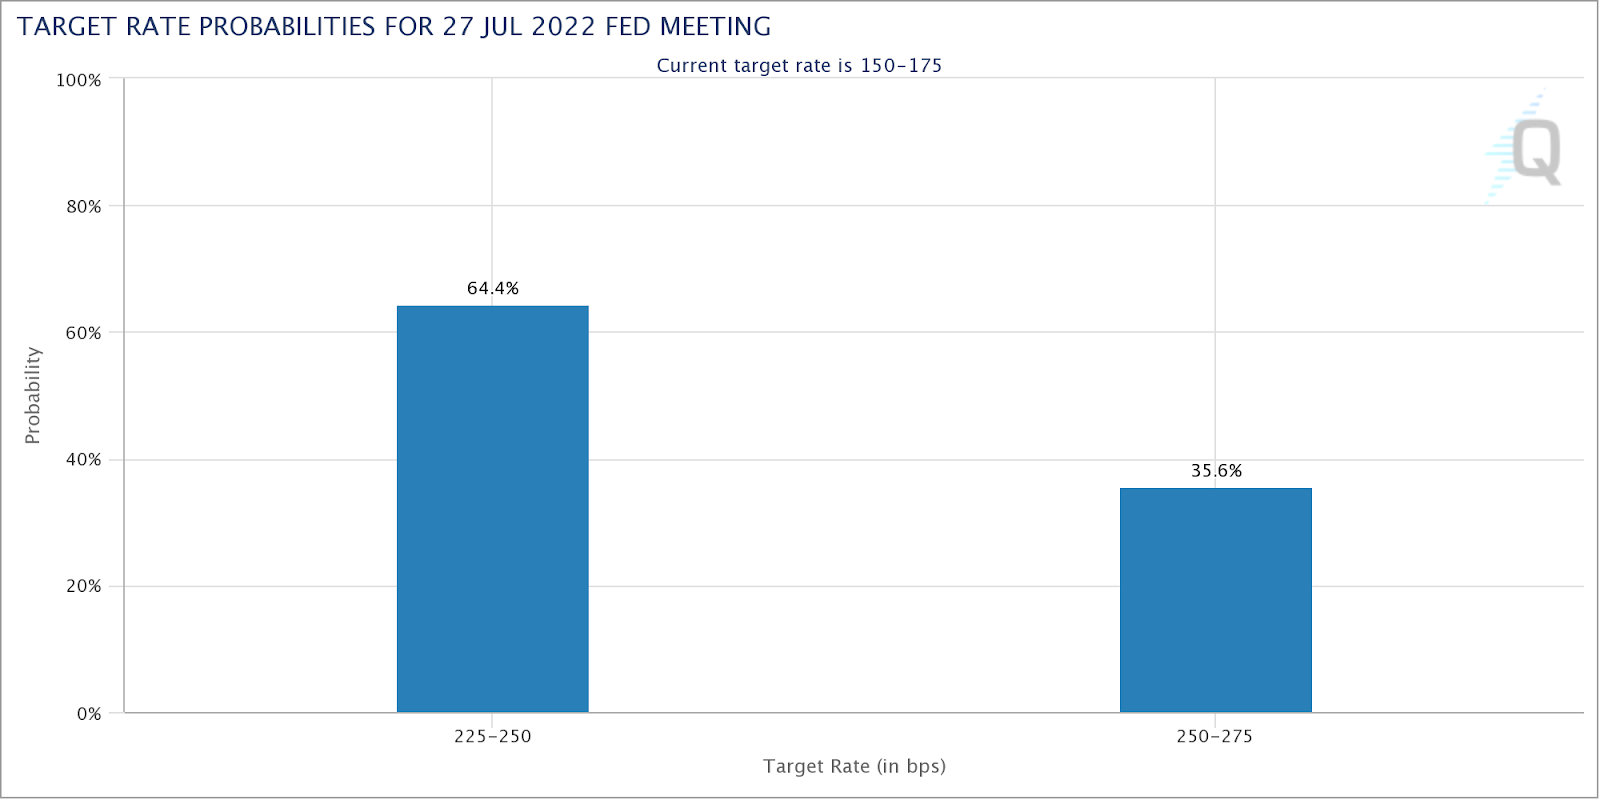
Graphic: 65-minute profile chart of the Micro E-mini S&P 500 Futures.
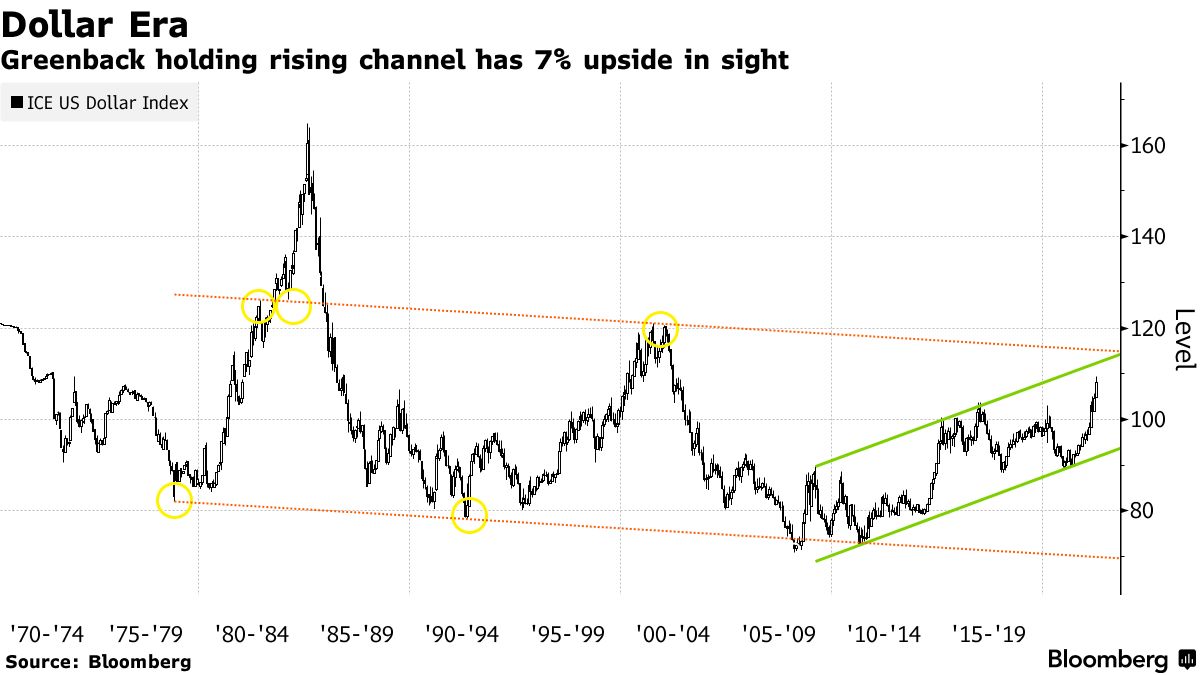
Considerations: Responsiveness near key-technical areas (that are discernable visually on a chart), suggests technically-driven traders with short time horizons are very active. 

Such traders often lack the wherewithal to defend retests and, additionally, the type of trade may be indicative of the other time frame participants waiting for more information to initiate trades.

Definitions

Volume Areas: A structurally sound market will build on areas of high volume (HVNodes). Should the market trend for long periods of time, it will lack sound structure, identified as low volume areas (LVNodes). LVNodes denote directional conviction and ought to offer support on any test. 

If participants were to auction and find acceptance into areas of prior low volume (LVNodes), then future discovery ought to be volatile and quick as participants look to HVNodes for favorable entry or exit.

POCs: POCs are valuable as they denote areas where two-sided trade was most prevalent in a prior day session. Participants will respond to future tests of value as they offer favorable entry and exit.

MCPOCs: POCs are valuable as they denote areas where two-sided trade was most prevalent over numerous day sessions. Participants will respond to future tests of value as they offer favorable entry and exit.

Volume-Weighted Average Prices (VWAPs): A metric highly regarded by chief investment officers, among other participants, for quality of trade. Additionally, liquidity algorithms are benchmarked and programmed to buy and sell around VWAPs.

About

After years of self-education, strategy development, mentorship, and trial-and-error, Renato Leonard Capelj began trading full-time and founded Physik Invest to detail his methods, research, and performance in the markets.

Capelj also develops insights around impactful options market dynamics at SpotGamma and is a Benzinga reporter.

Some of his works include conversations with ARK Invest’s Catherine Wood, investors Kevin O’Leary and John Chambers, FTX’s Sam Bankman-Fried, former Bridgewater Associate Andy Constan, Kai Volatility’s Cem Karsan, The Ambrus Group’s Kris Sidial, among many others.

Disclaimer

In no way should the materials herein be construed as advice. Derivatives carry a substantial risk of loss. All content is for informational purposes only.